Here I summarize the global seismicity for 2016. I limit this summary to earthquakes with magnitude greater than or equal to M 7.0. I reported on all but two of these earthquakes. There were no earthquakes as large as an M 8.0 for the entire year of 2016. However, we had an inventory of 17 earthquakes with M ≥ 7.0. Here is the 2015 Earthquake Summary Page. I initially prepared this a couple weeks ago, but wanted to wait until January 1 before I presented it. Good thing I waited as there was an earthquake in Chile on 12/25 and a swarm in Nevada on 12/28. Happy New Year! Waiting to post this was challenging, sort of like waiting to open wrapped holiday gifts.
- Here are all the annual summaries:
- Here are the annual summaries for the Cascadia region.
-
I include summaries of my earthquake reports in sorted into three categories. One may also search for earthquakes that may not have made it into these summary pages (use the search tool).
- Magnitude
- Region
- Year
Annual Summary Poster
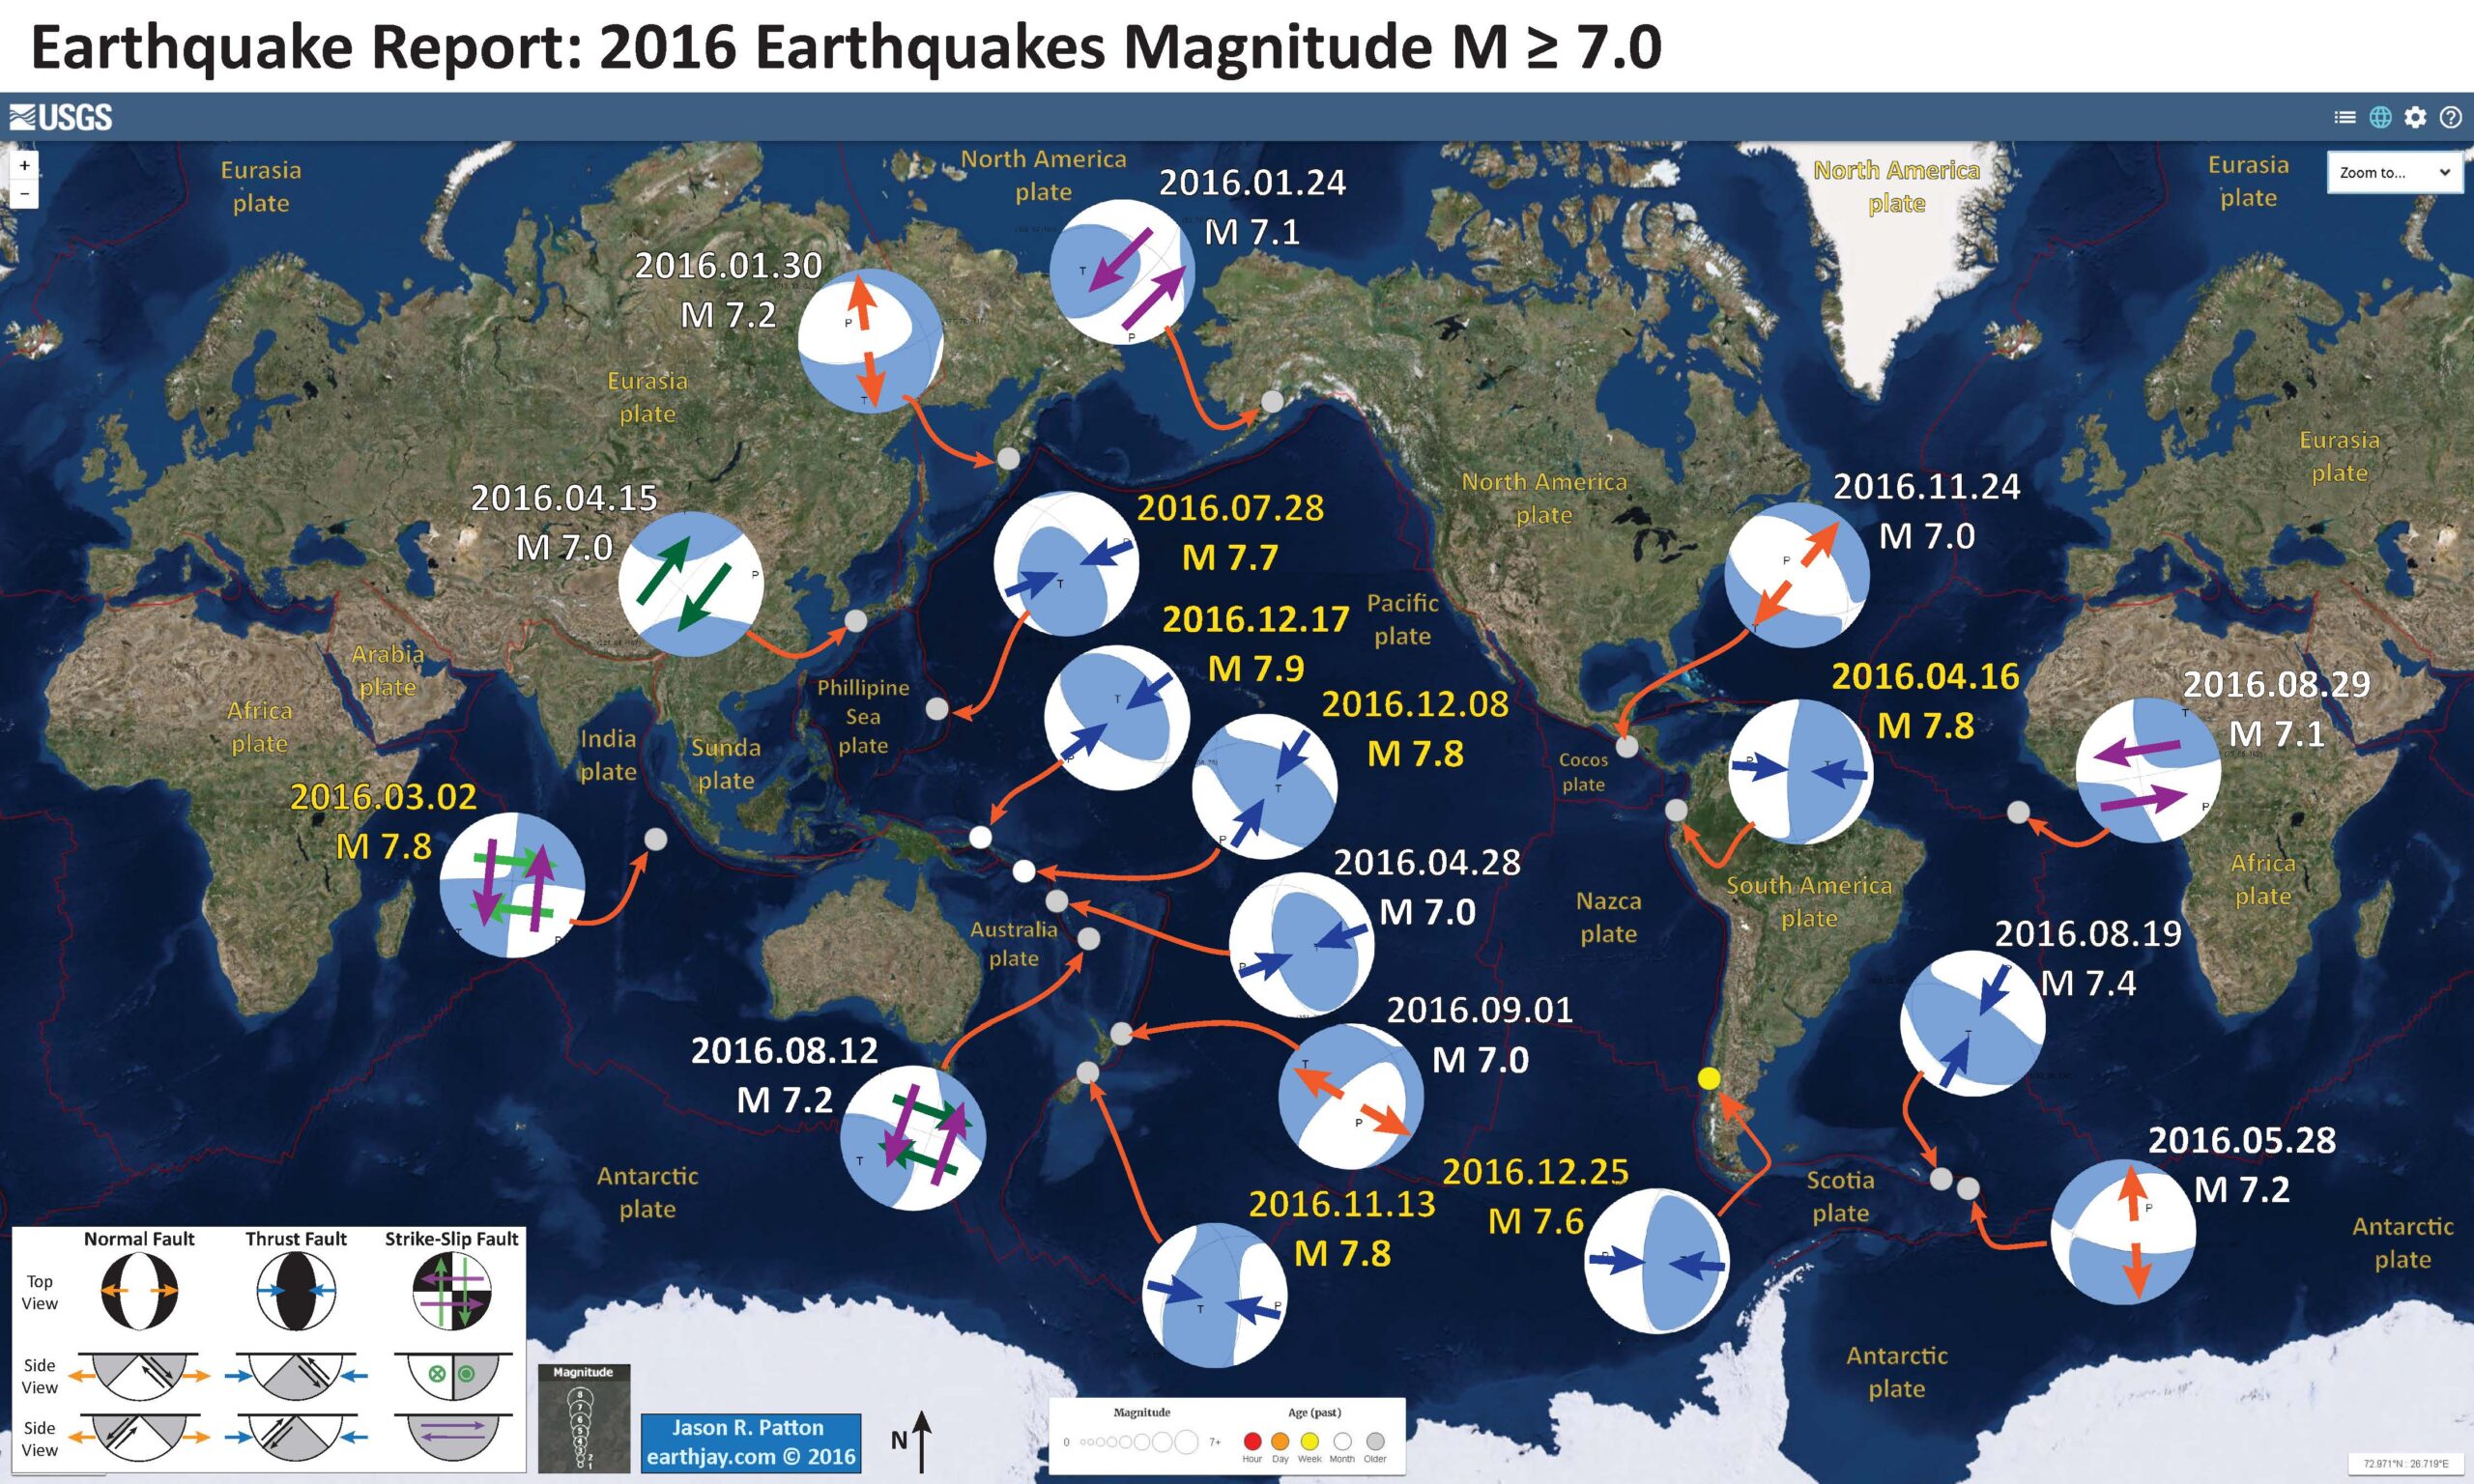
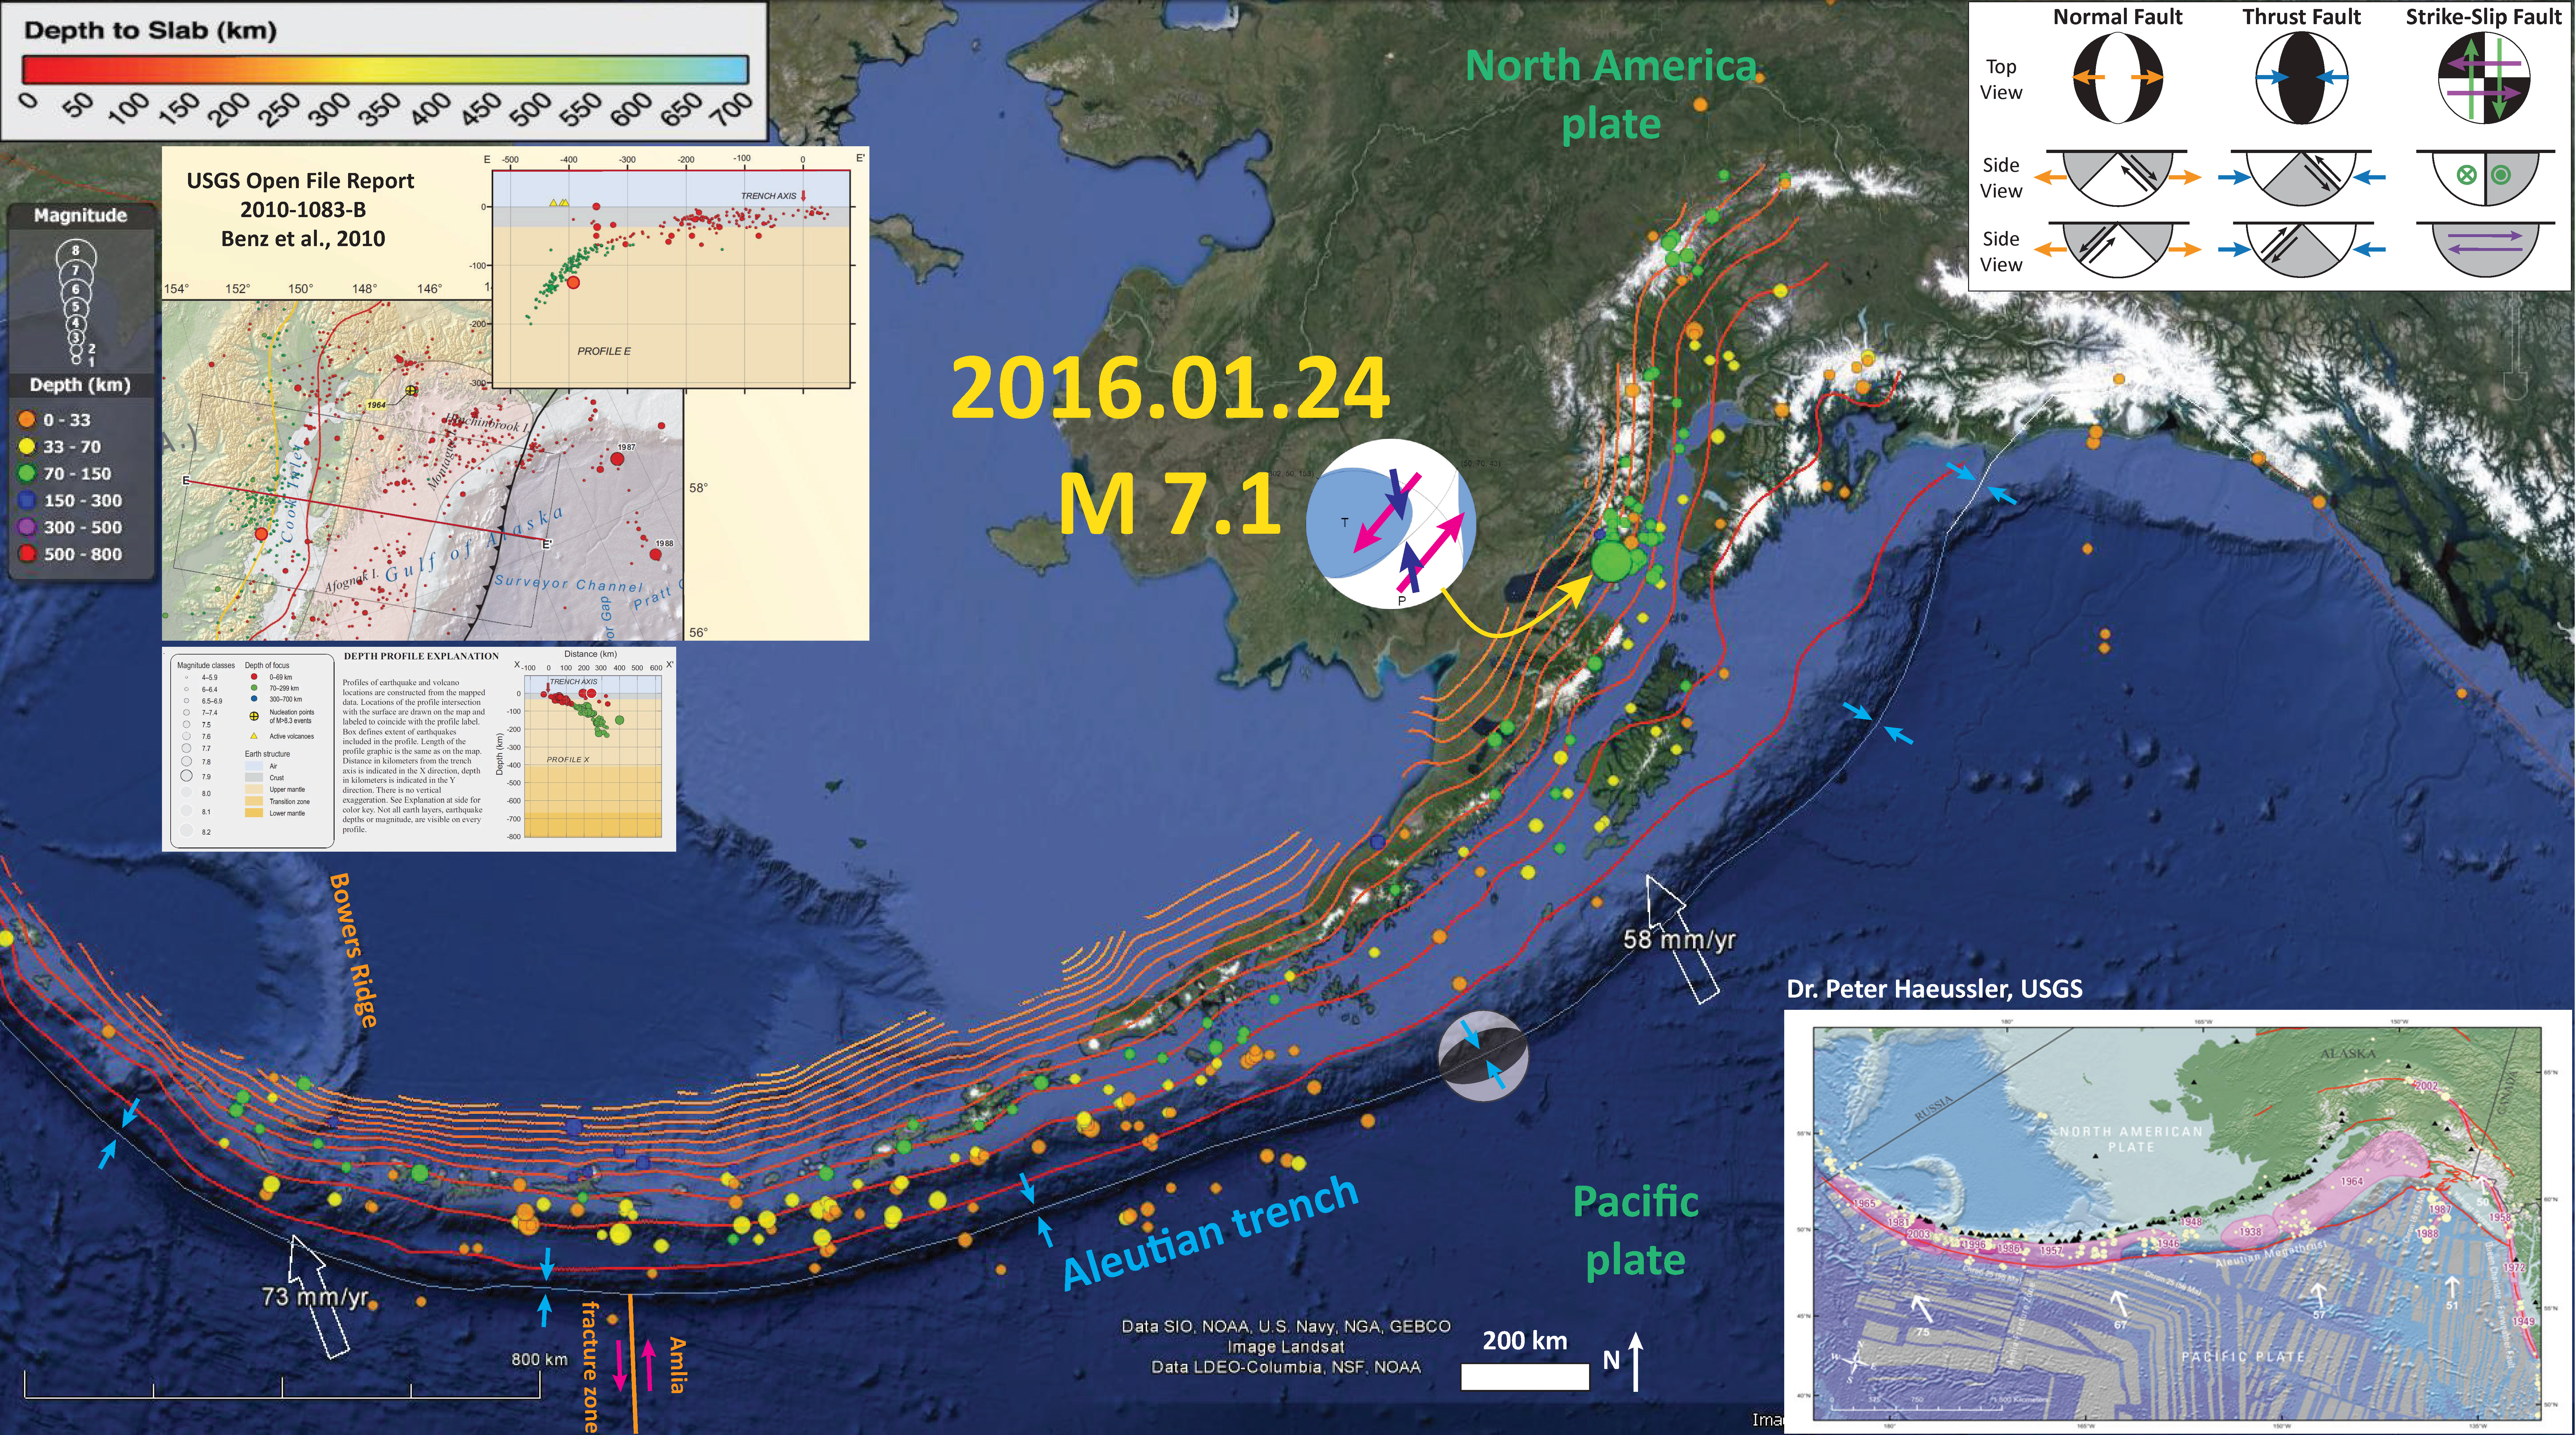
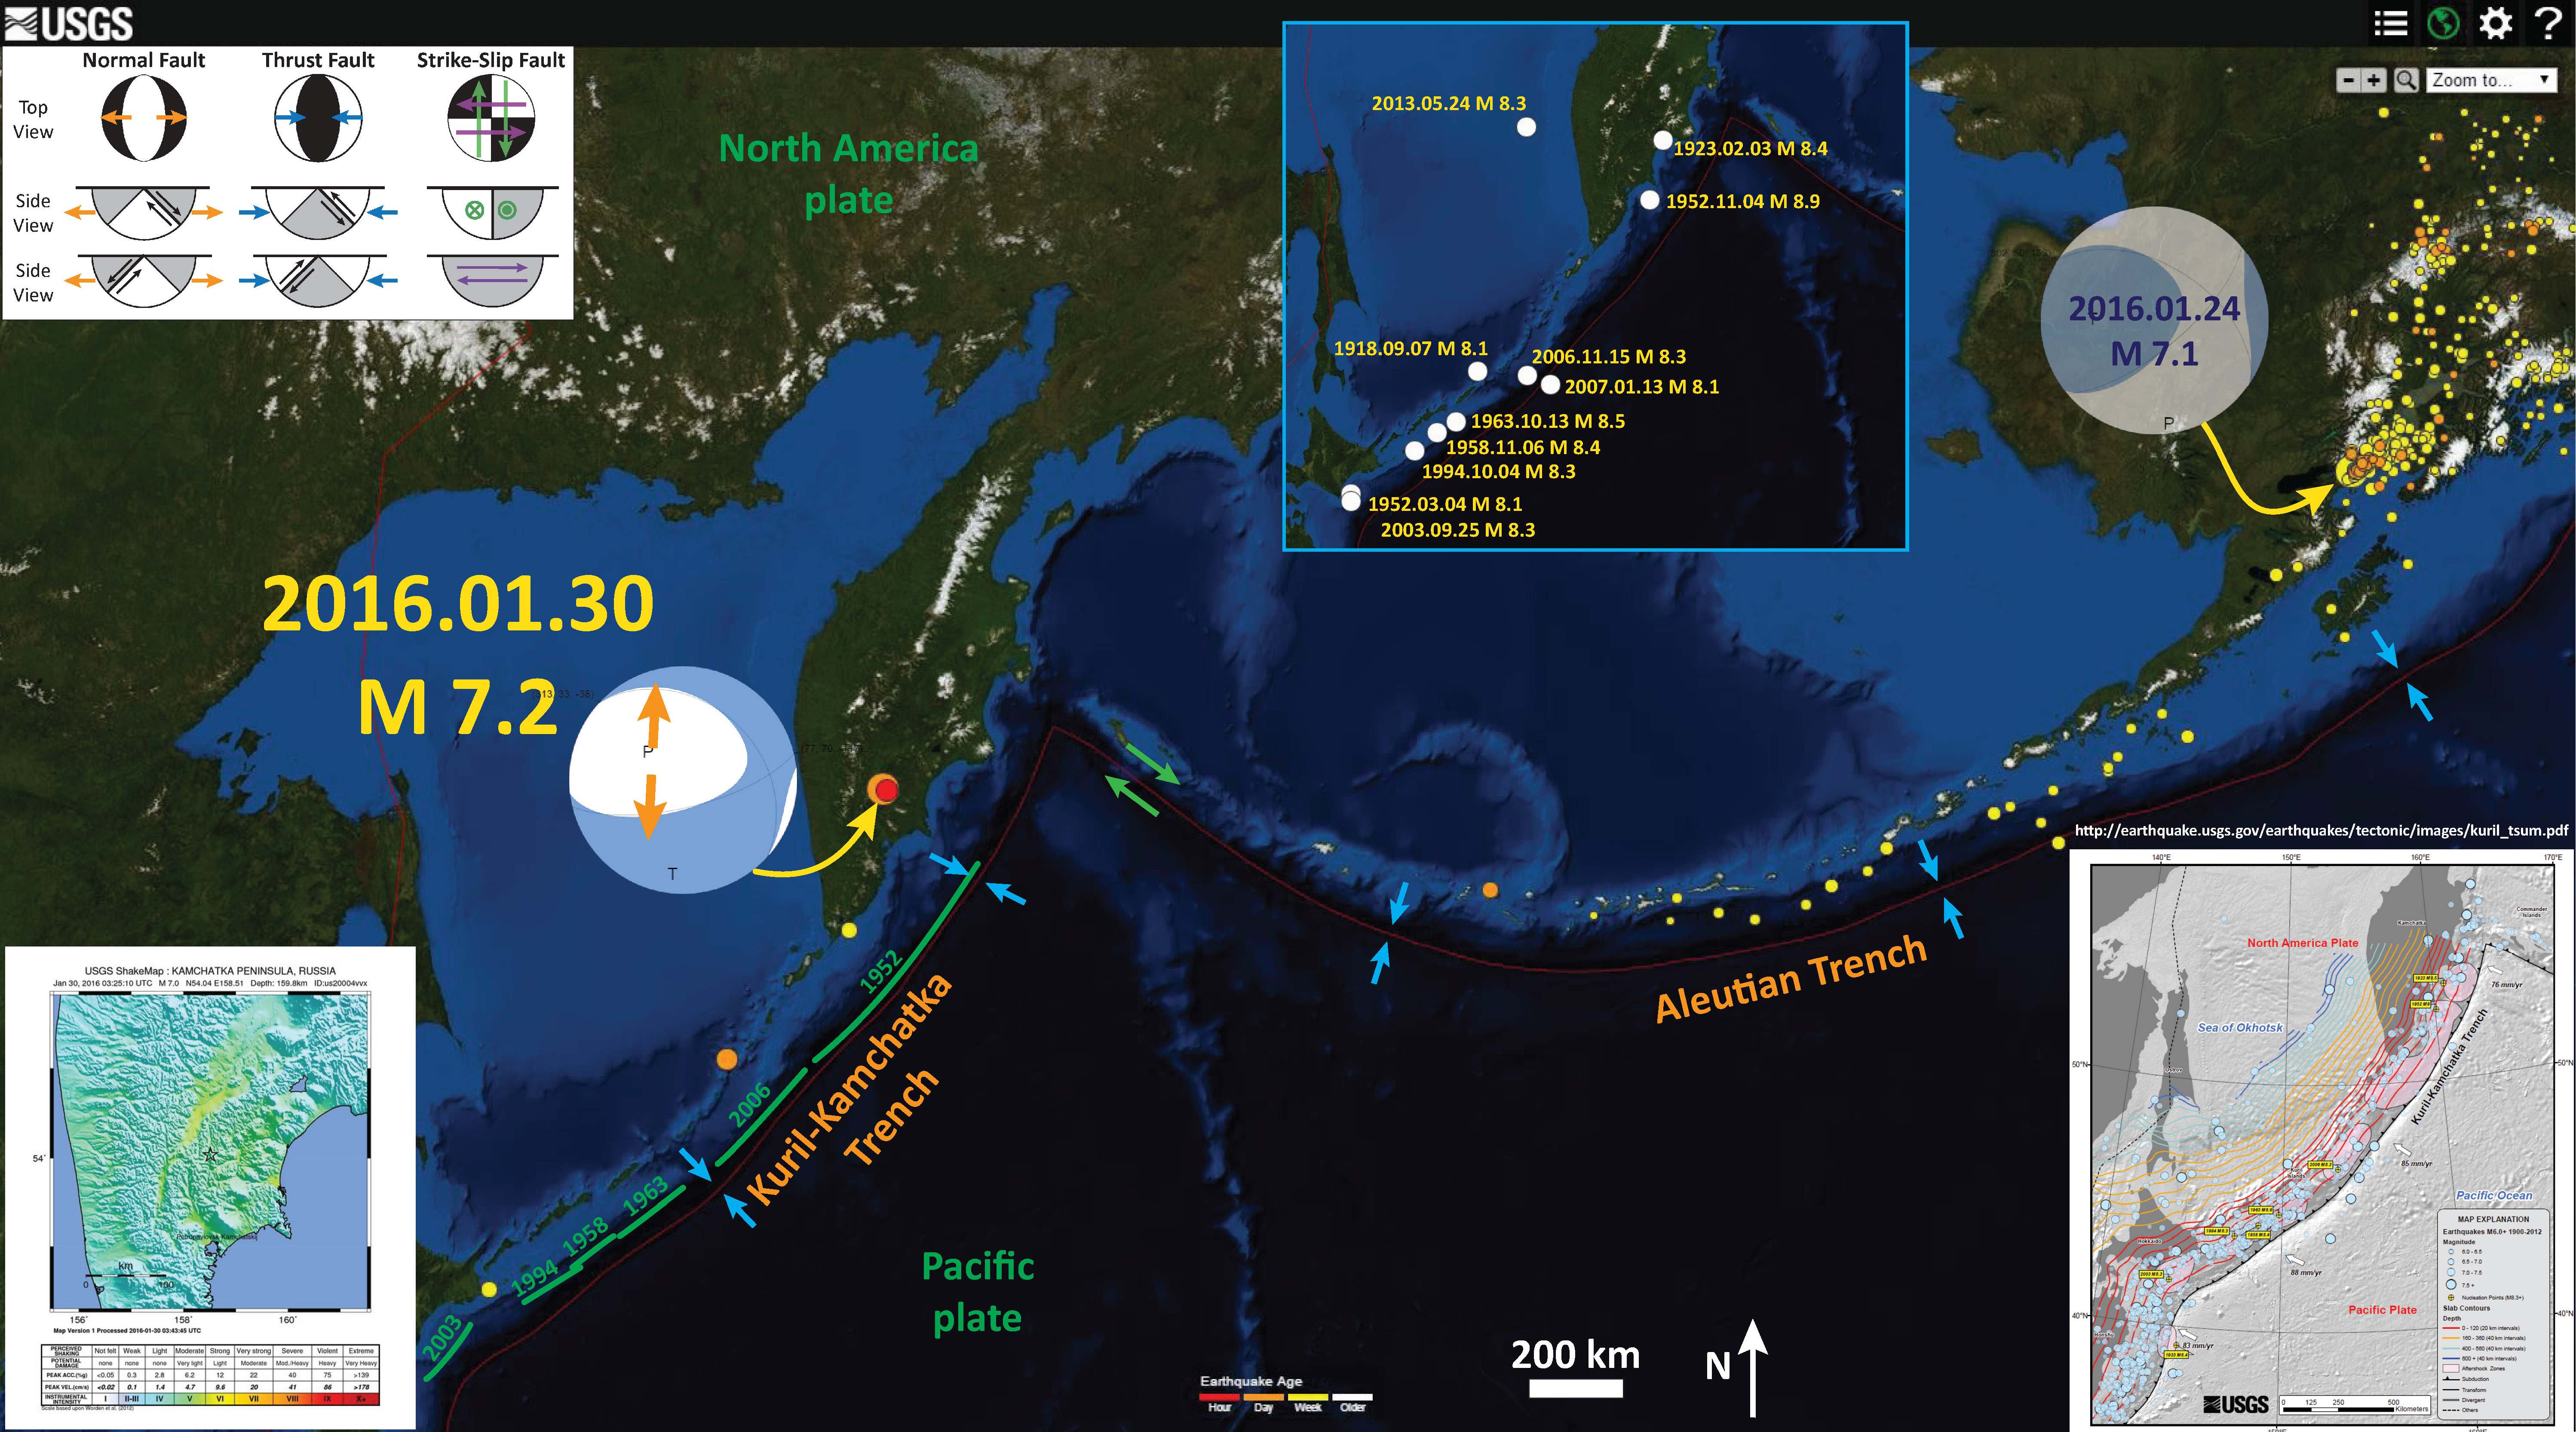
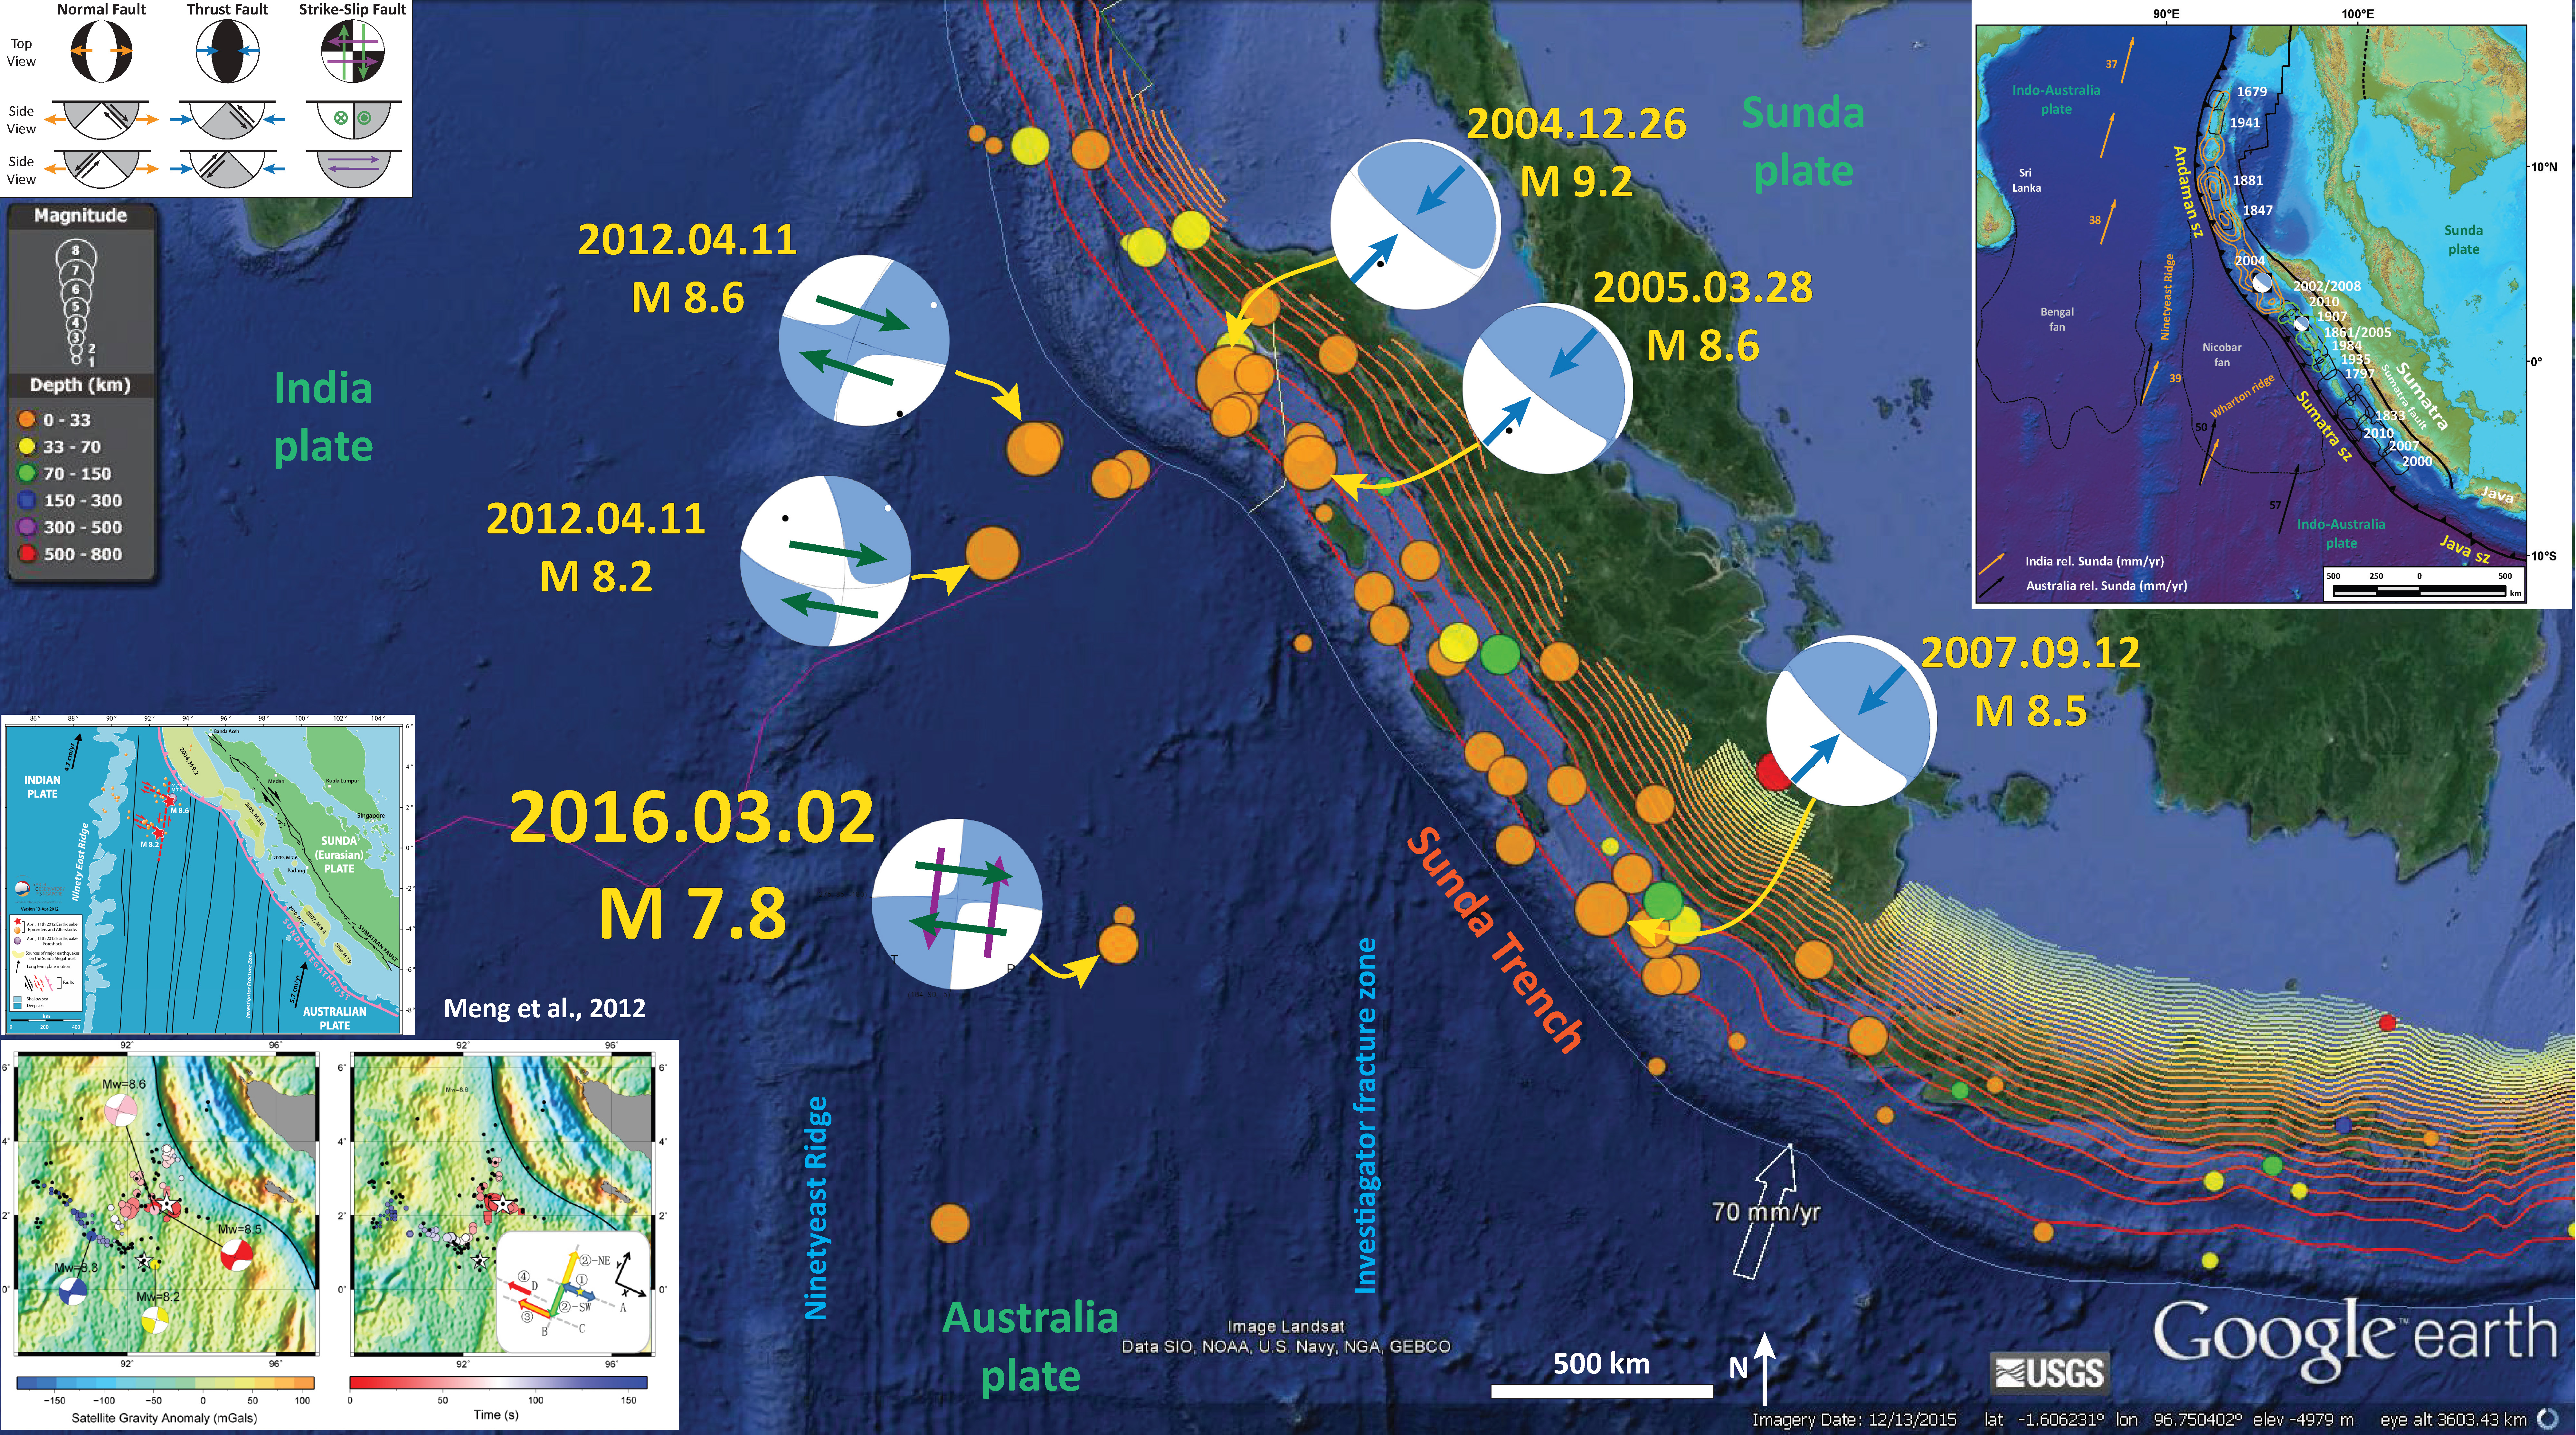
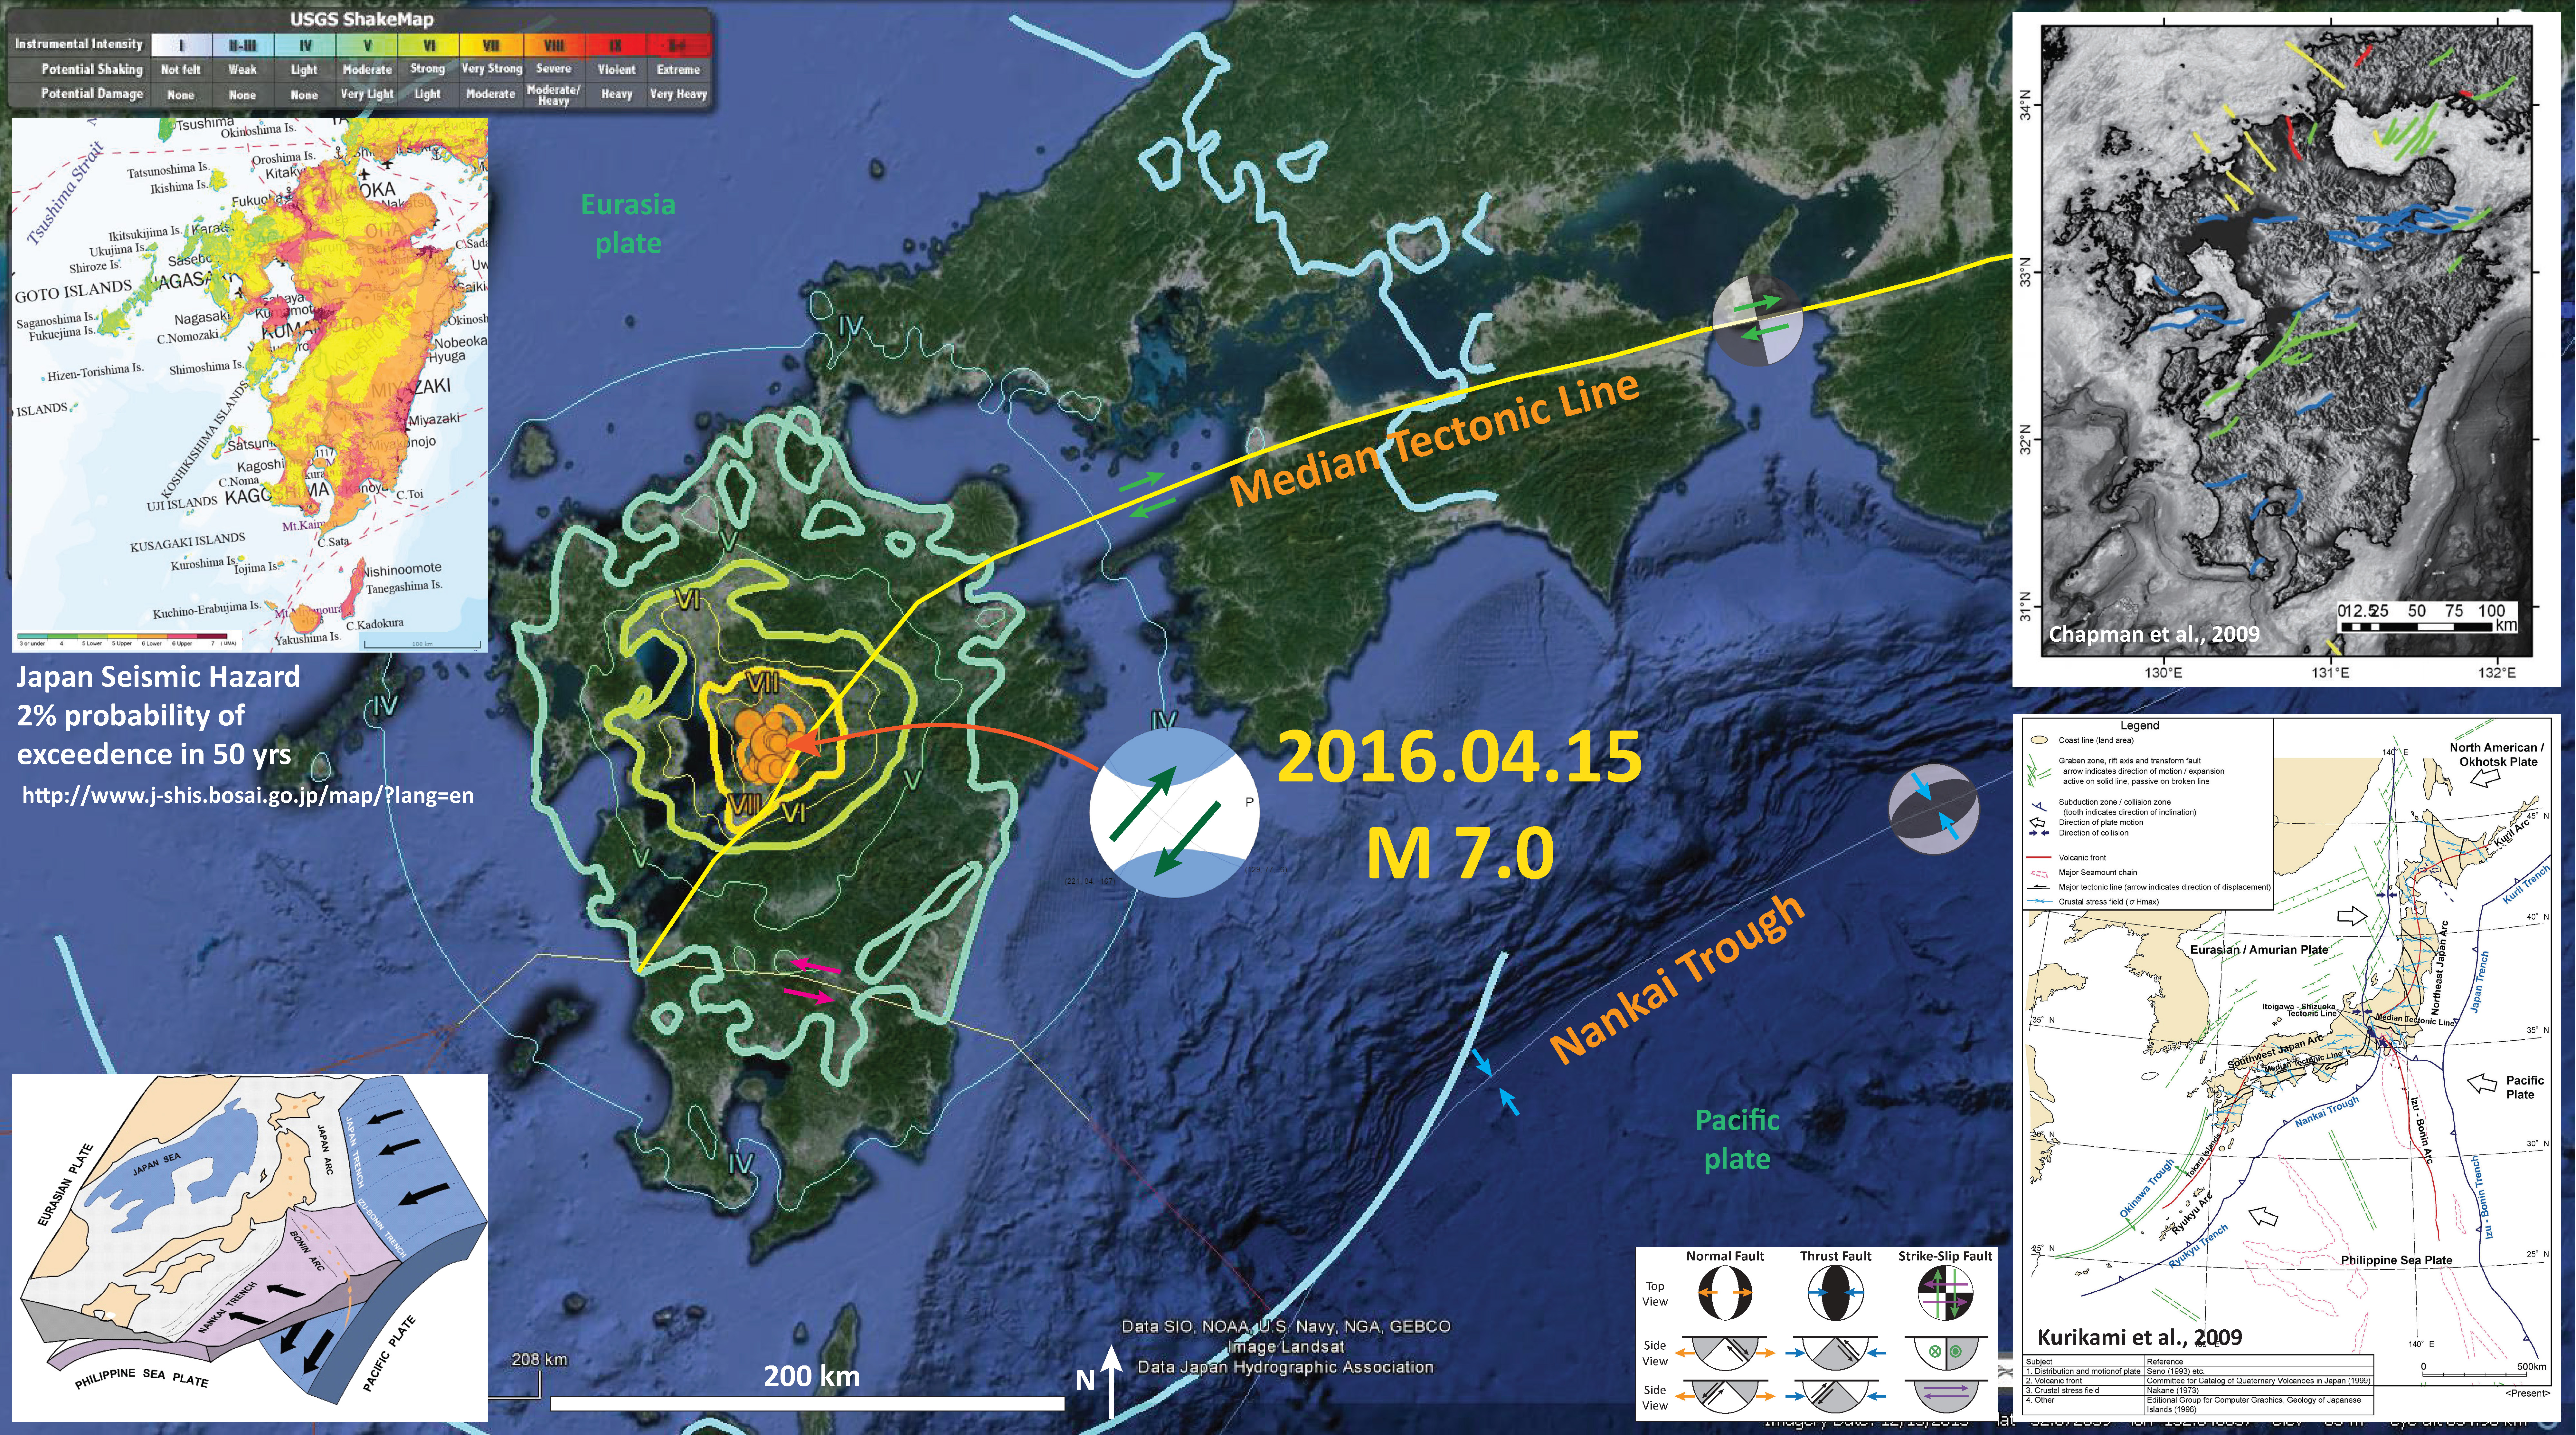
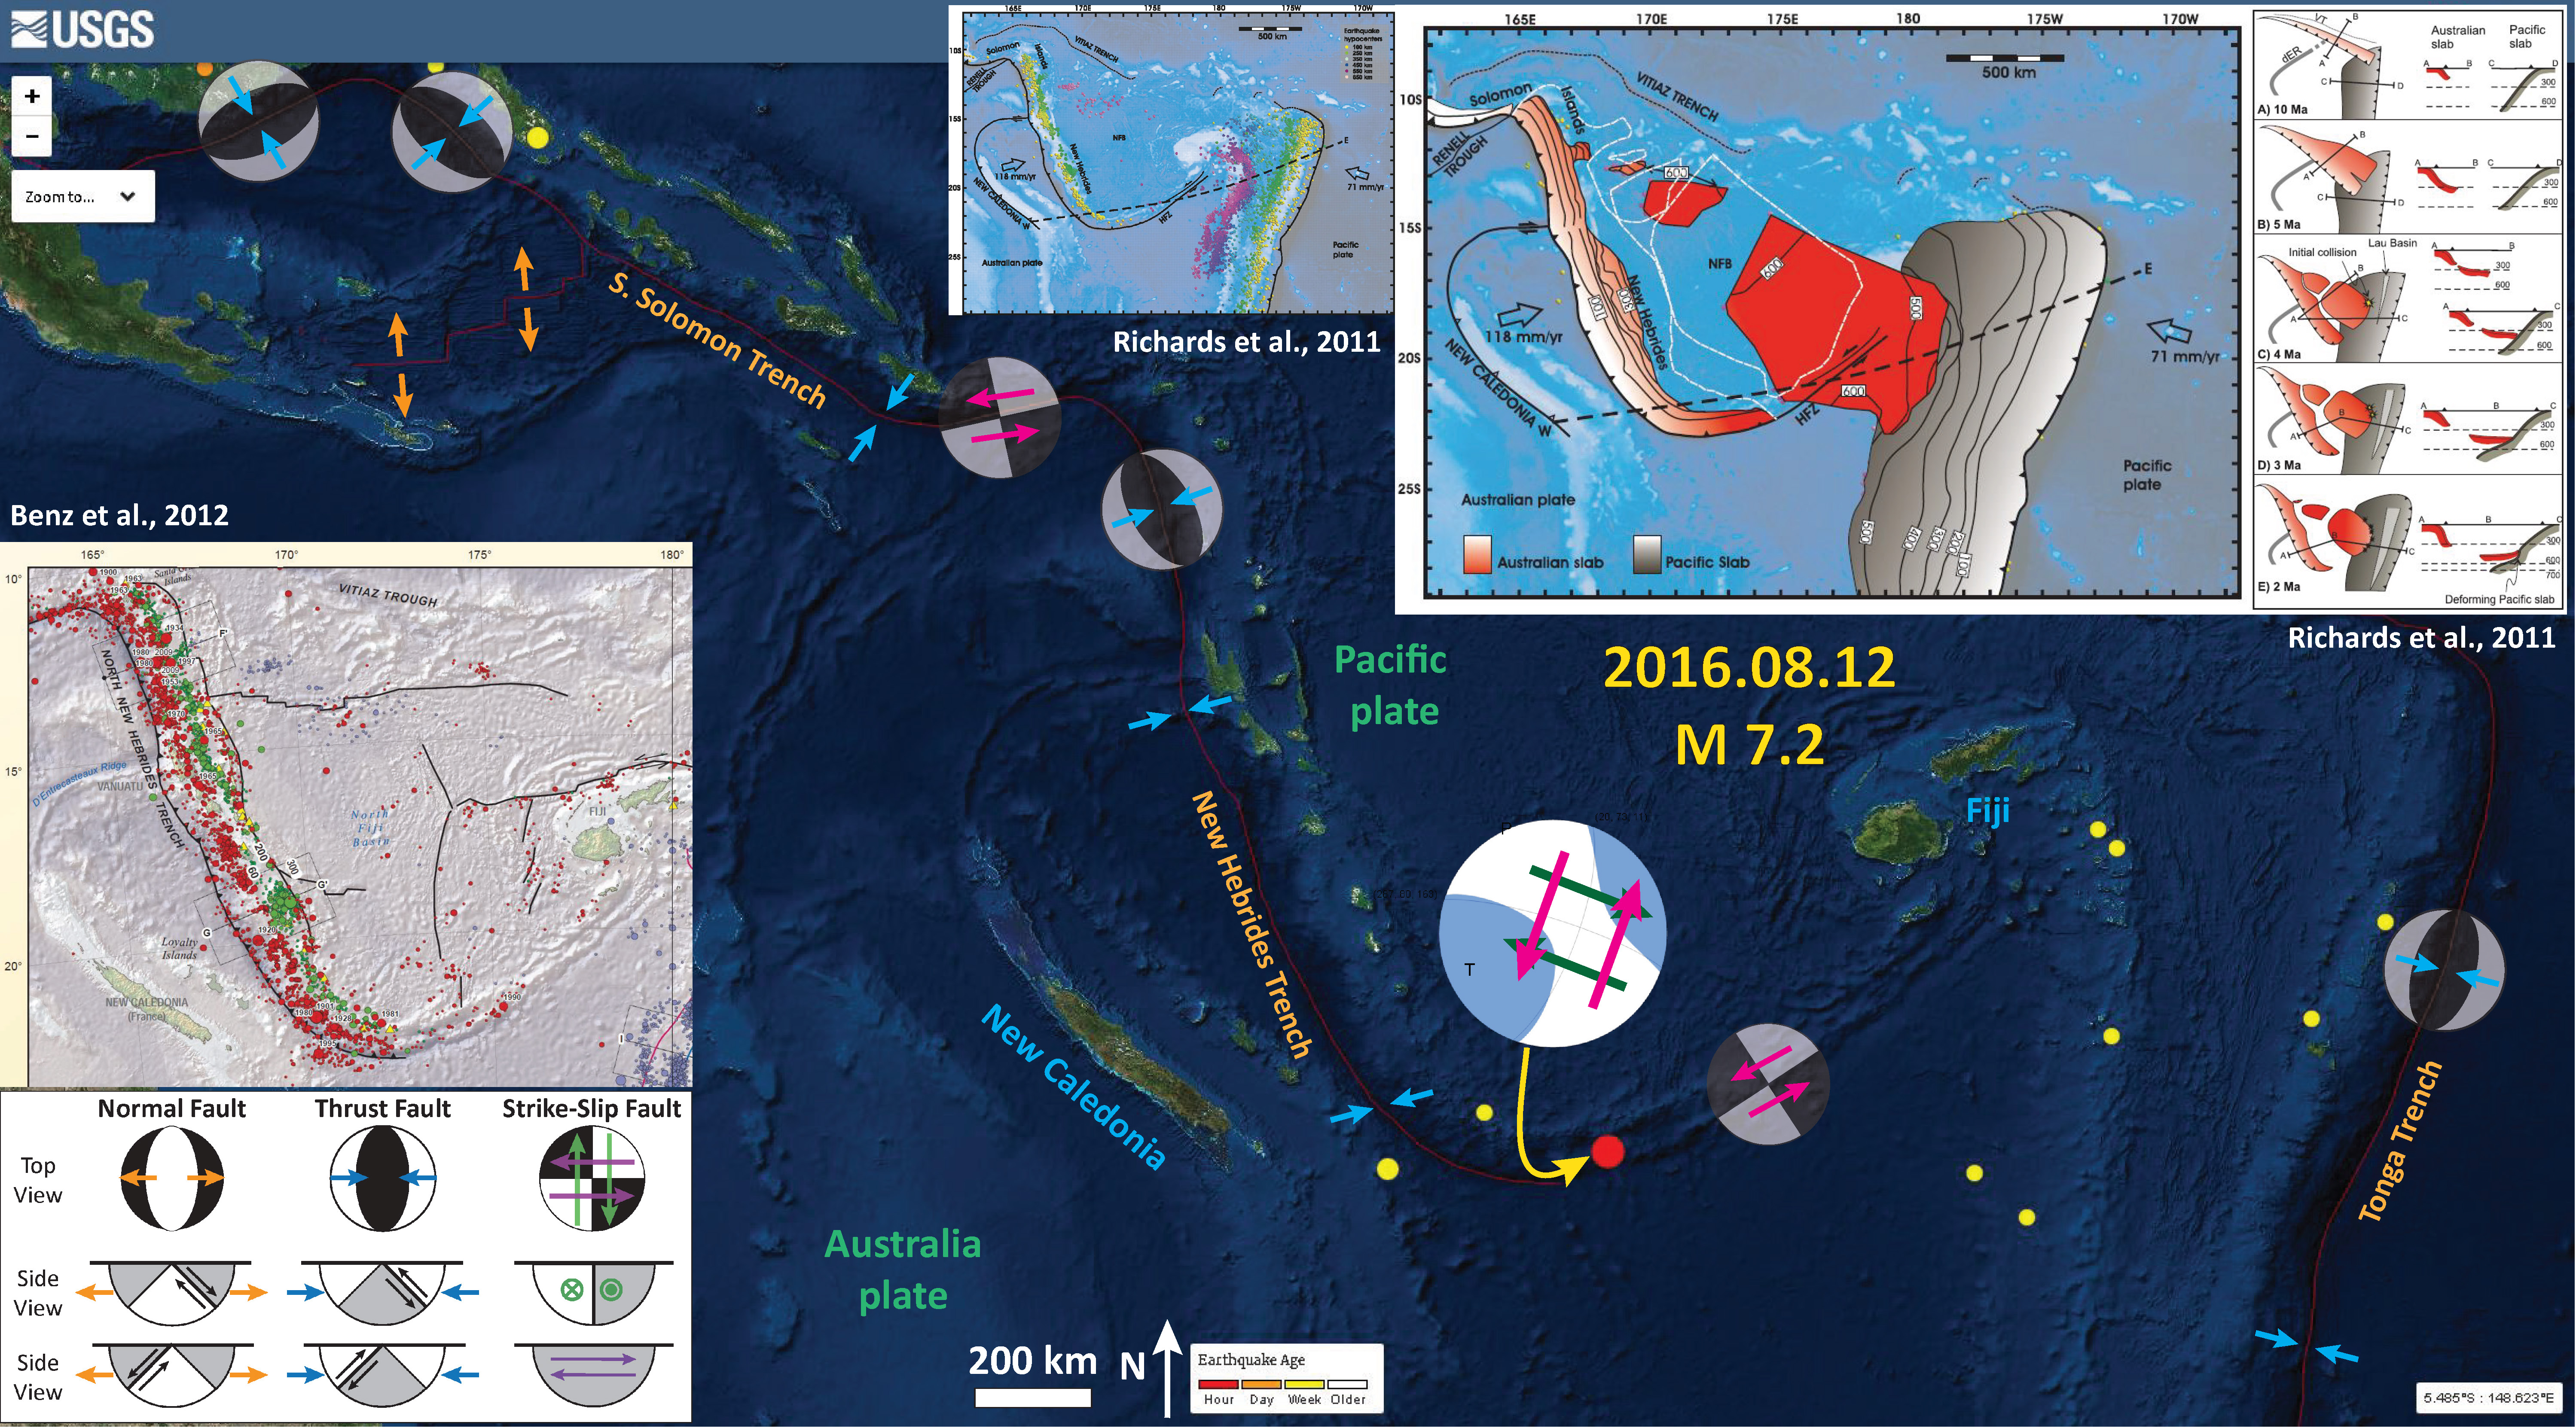
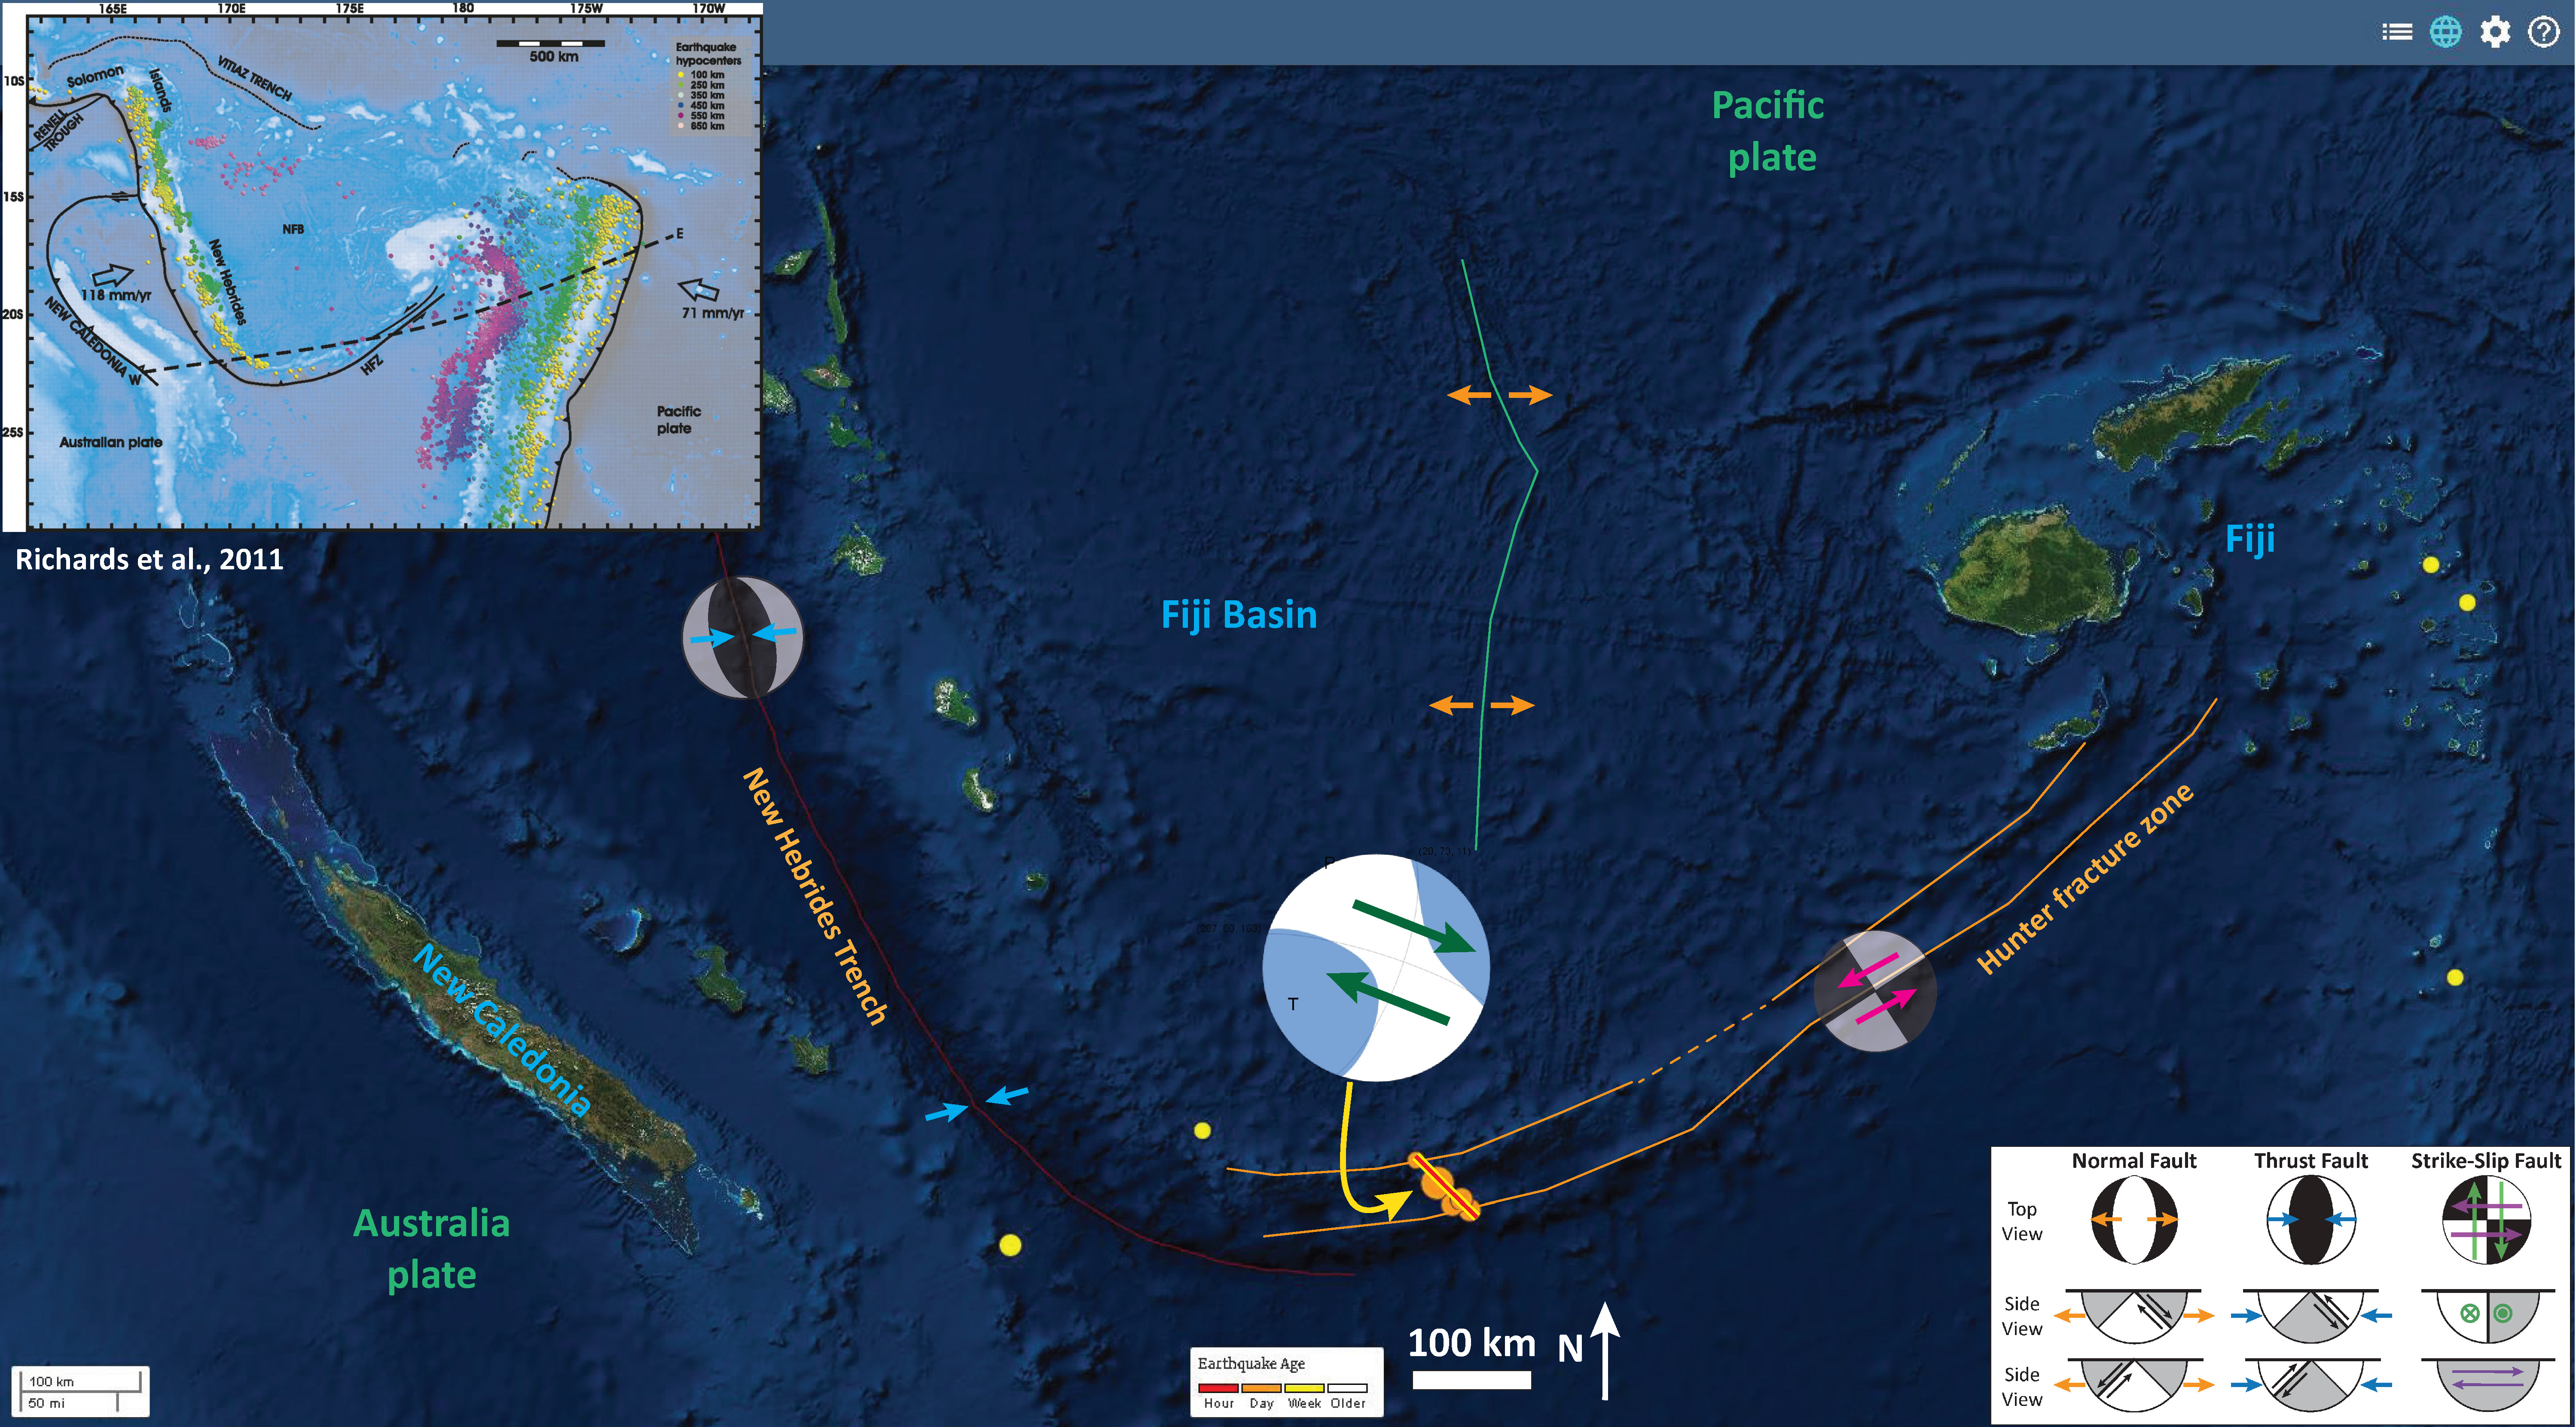
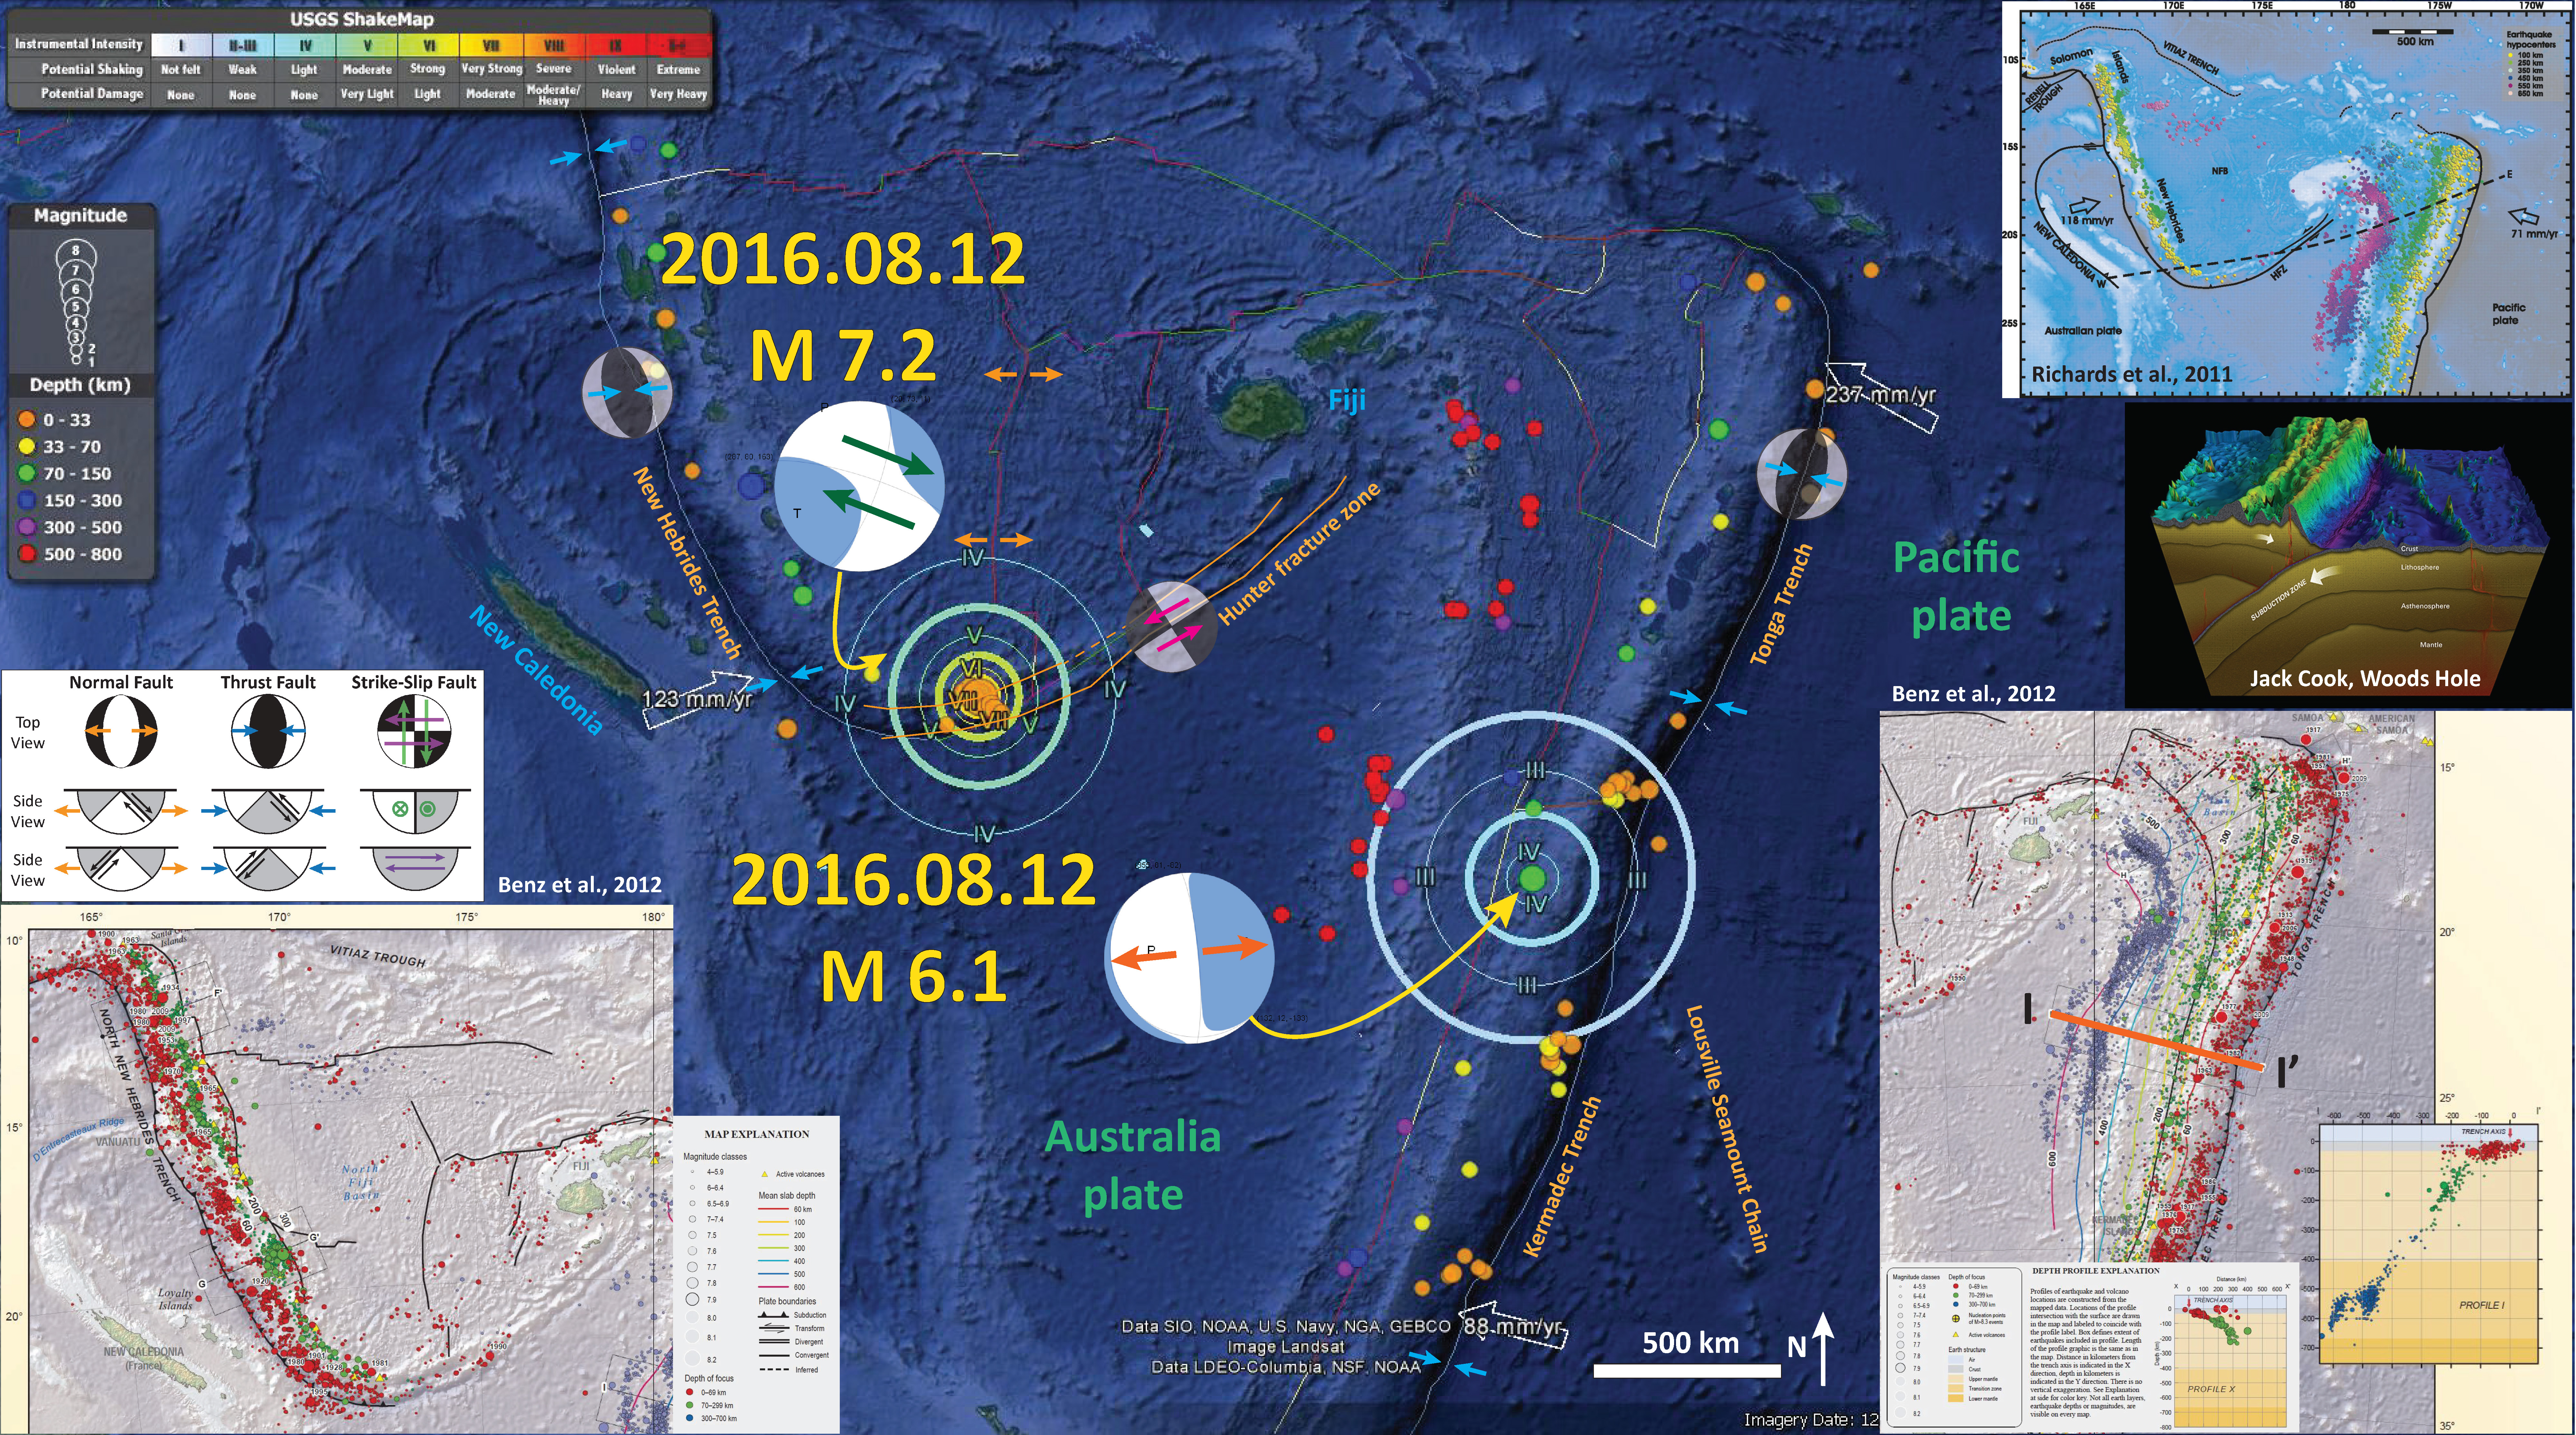
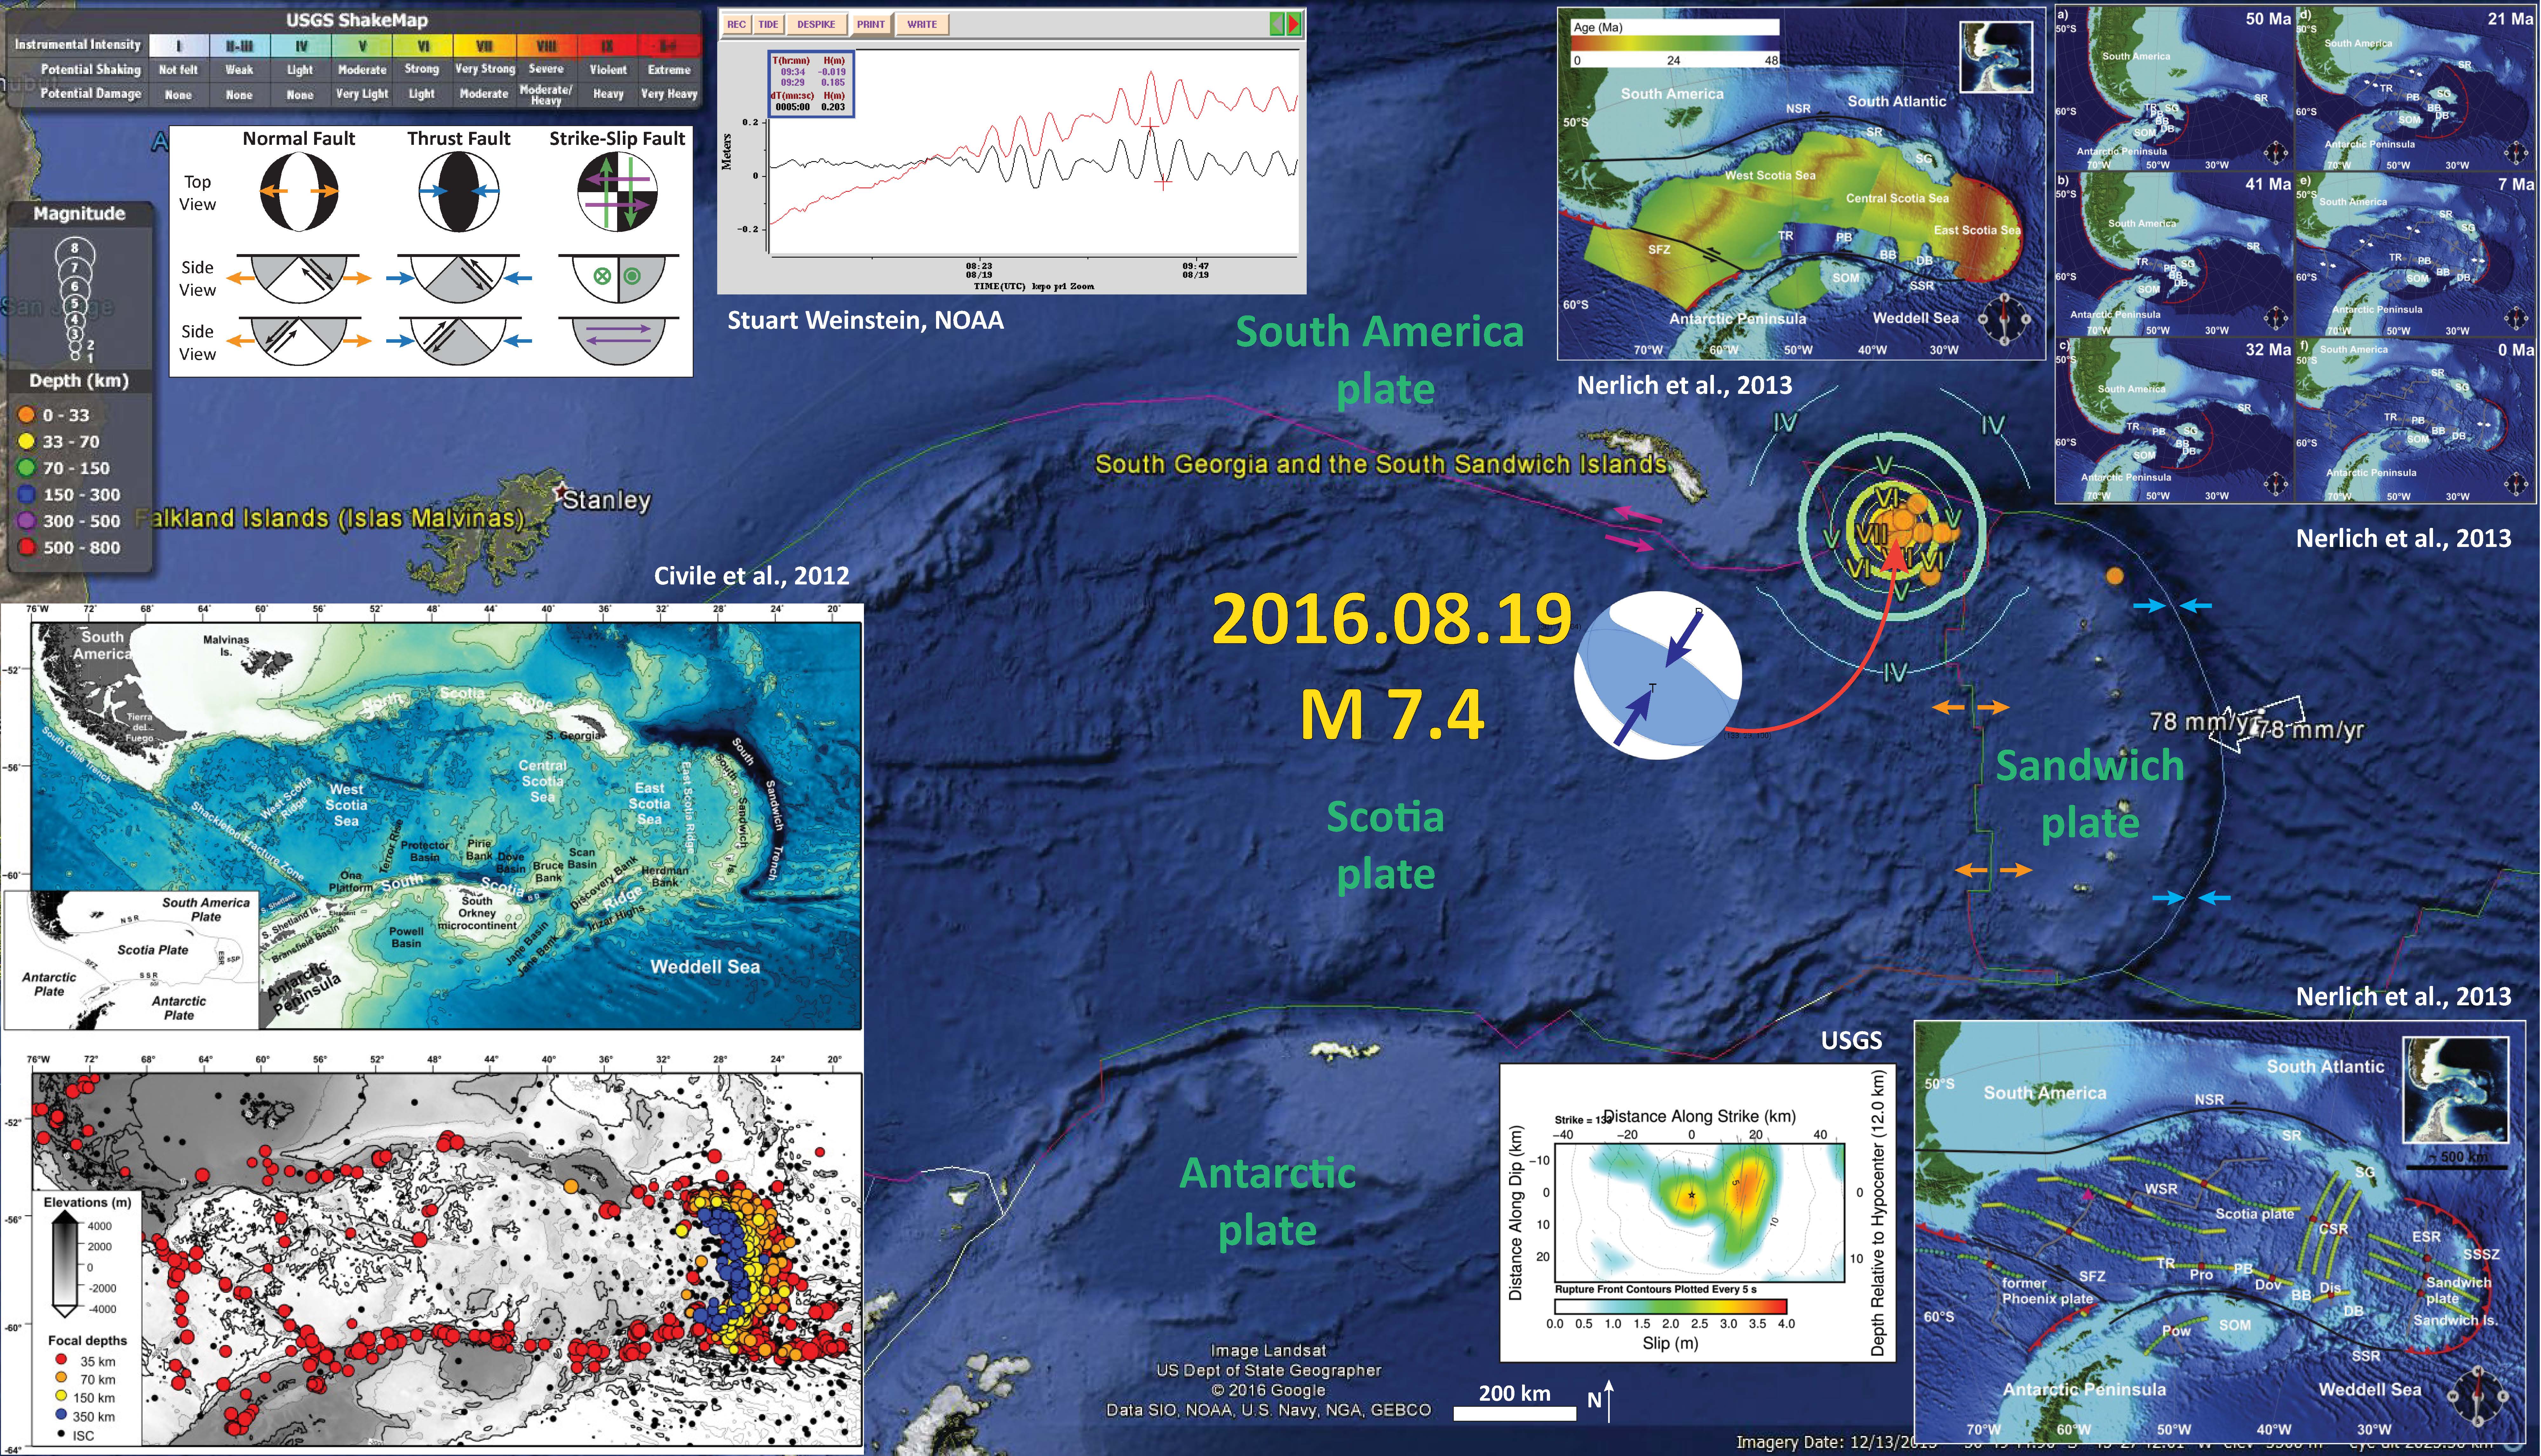
- Here is the map where I show the epicenters as circles with colors designating the age. I also plot the USGS moment tensors for each earthquake, with arrows showing the sense of motion for each earthquake.
- I placed a moment tensor / focal mechanism legend in the lower left corner of the map. There is more material from the USGS web sites about moment tensors and focal mechanisms (the beach ball symbols). Both moment tensors and focal mechanisms are solutions to seismologic data that reveal two possible interpretations for fault orientation and sense of motion. One must use other information, like the regional tectonics, to interpret which of the two possibilities is more likely.
- In some cases, I am able to interpret the sense of motion for strike-slip earthquakes. In other cases, I do not know enough to be able to make this interpretation (so I plot both solutions).
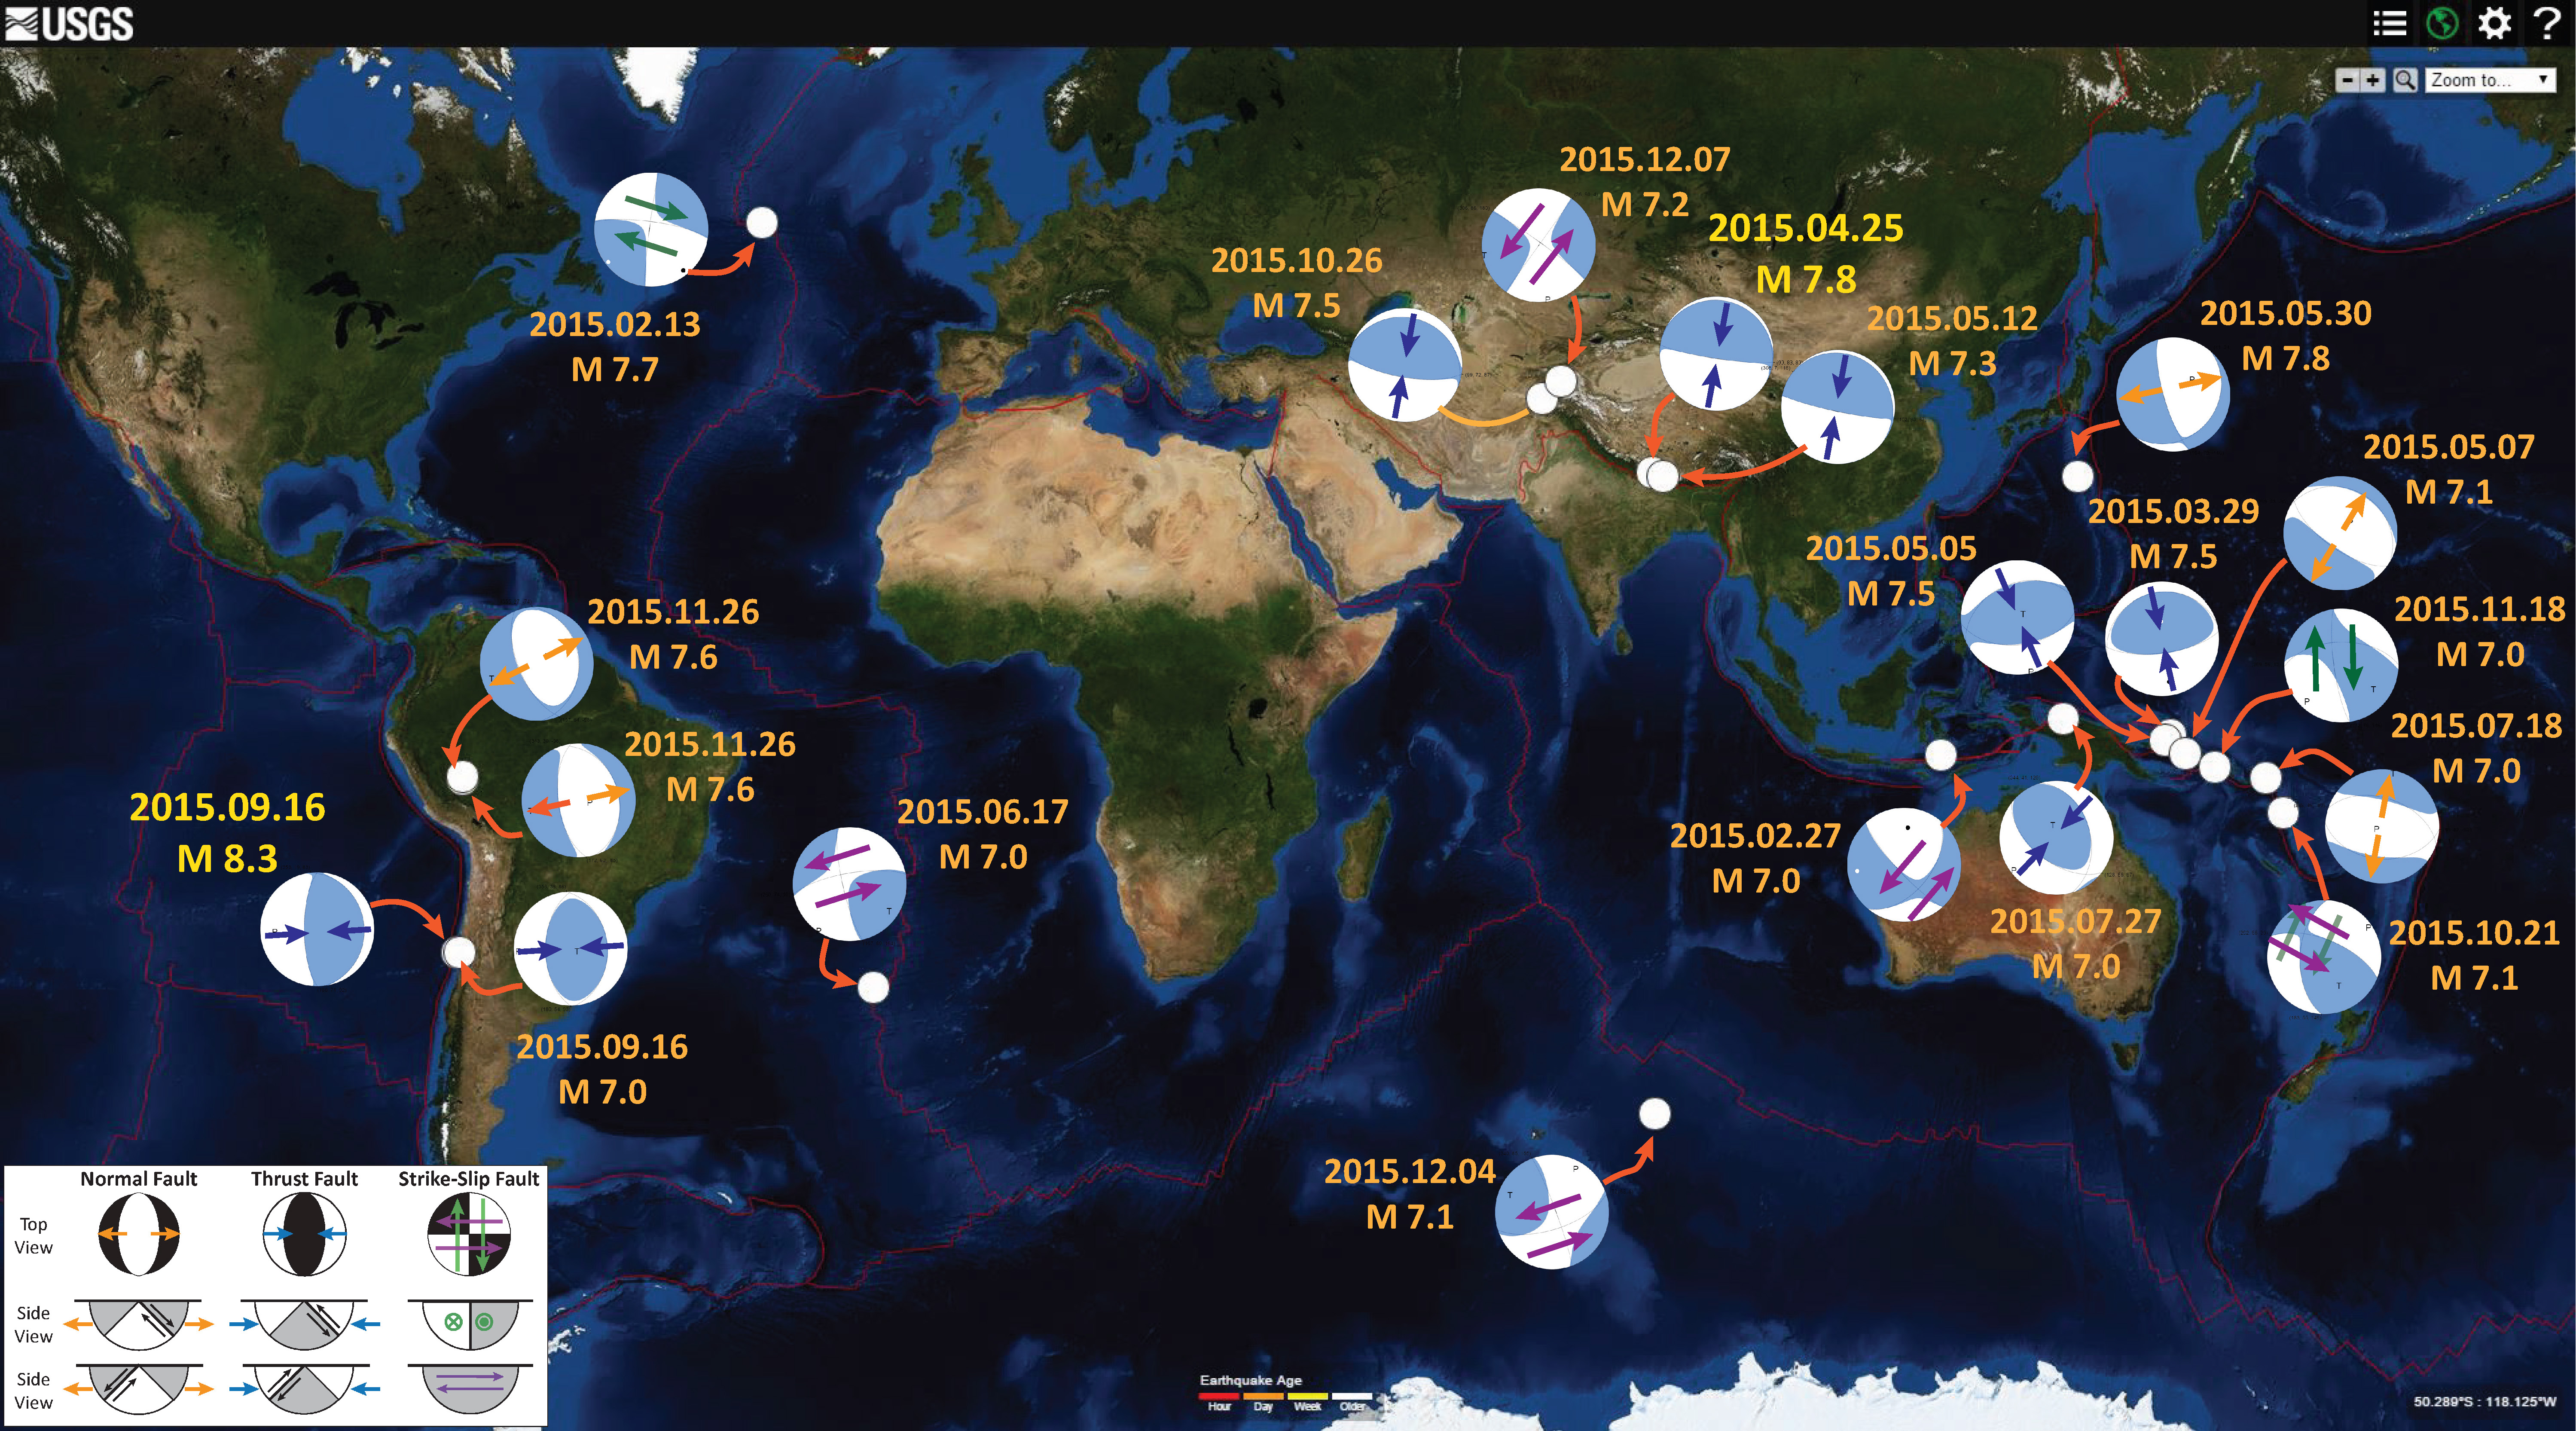
- Compare with last year’s summary poster. Here is the 2015 Earthquake Summary Page. Note how the subduction zones in the southwestern Pacific are highly active in both 2015 and 2016.

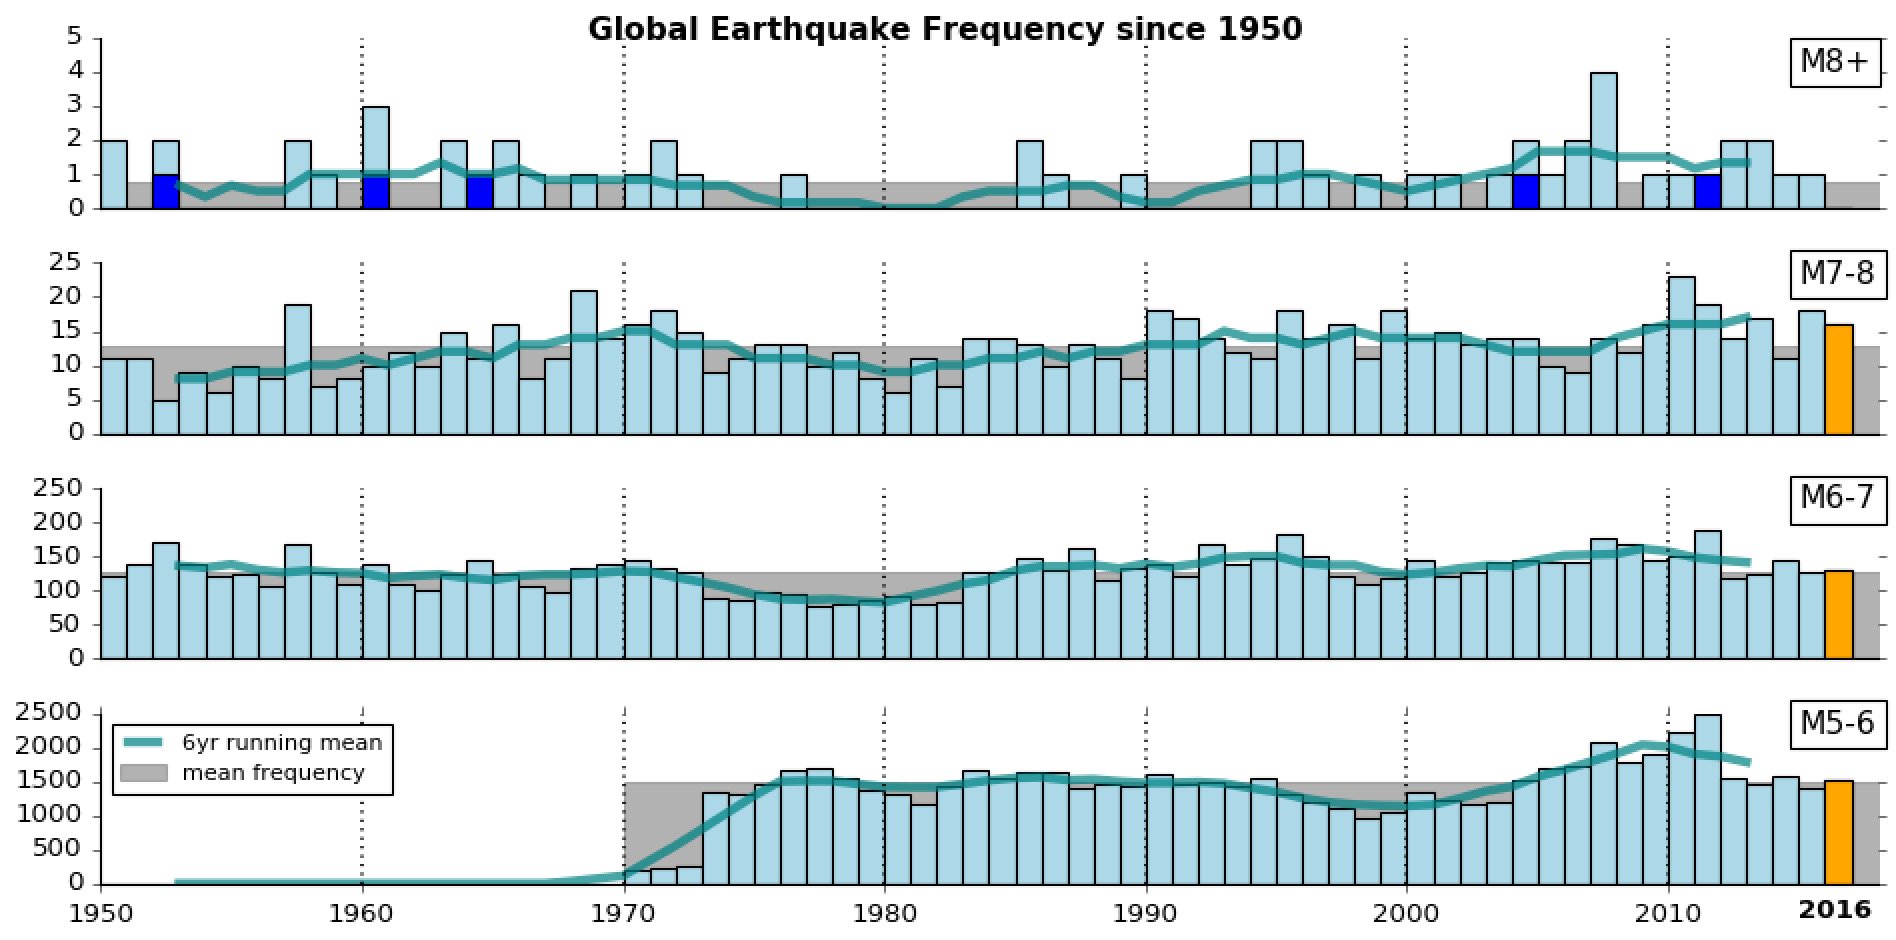
- Here is a summary showing a running total and mean of earthquakes for different magnitude ranges. This came from Chris Rowan @Allochthonous. Here is an update to the graphic below, coming with an explanation.
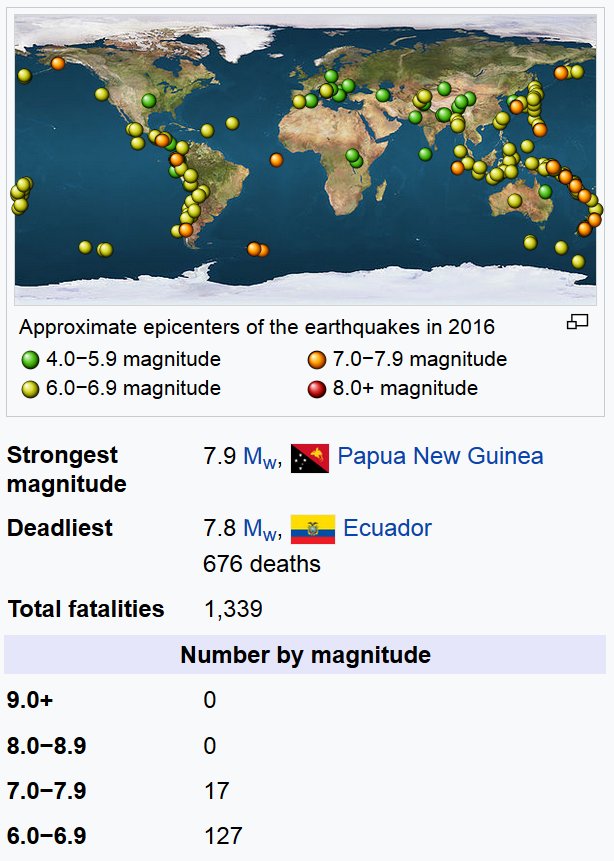
- Here is a summary showing the epicenters from earthquakes in 2016 with symbol sorted vs. magnitude. This came from Susan Hough @SeismoSue.
2016 Highlights from others
- 2016.01.24 M 7.1 Alaska, USA (USGS) and my #EarthquakeReport.
- 2016.01.30 M 7.2 Kamchatka Peninsula, Russia (USGS) and my #EarthquakeReport.
- 2016.03.02 M 7.8 Sumatra, Indonesia (USGS) and my #EarthquakeReport.
- 2016.04.15 M 7.0 Kumamoto, Japan (USGS) and my #EarthquakeReport and update.
- Here is a link to the video file embedded below (2 MB mp4)
- 2016.04.16 M 7.8 Quito, Ecuador (USGS) and my #EarthquakeReport and update.
- 2016.04.28 M 7.0 Vanuatu (USGS) and my #EarthquakeReport.
- 2016.05.28 M 7.2 South Sandwich Islands (USGS).
- 2016.07.28 M 7.7 Mariana Islands (USGS). and my #EarthquakeReport
- 2016.08.12 M 7.2 New Hebrides (USGS) and my Earthquake Report and update #1 and update #2.
- 2016.08.19 M 7.4 South Sandwich Islands (USGS) and my #EarthquakeReport.
- 2016.08.29 M 7.1 Mid Atlantic Ridge (USGS) and my #EarthquakeReport.
- 2016.09.01 M 7.0 Gisborne, New Zealand (USGS) and my #EarthquakeReport.
- 2016.11.13 M 7.8 Kaikoura, New Zealand (USGS) and my #EarthquakeReport and update #2.
- 2016.11.24 M 7.0 El Salvador (USGS) and my #EarthquakeReport.
- 2016.12.08 M 7.8 Solomon Islands (USGS) and my #EarthquakeReport.
- 2016.12.17 M 7.9 Bougainville (USGS) and my #EarthquakeReport.
- 2016.12.25 M 7.6 Chile (USGS) and my #EarthquakeReport.
- This map shows the MMI contours for the 1960 and 2010 earthquakes in addition to this 2016 earthquake. This helps us visualize the spatial extent for these earthquakes with a large range of magnitudes. Recall that an M 9.5 earthquake releases about 32 times the energy that an M 8.5 earthquake releases. Note how the 1960 and 2010 earthquakes span a region between the Juan Fernandez fracture zone and where the Chile Rise intersects the trench, where the 4 fracture zones (Guamblin, Darwin, Taitao, and Tres Montes) intersect the trench.
Here are the web pages for these earthquakes. The first link goes to the USGS page and the second link goes to the Earthquake Report page.
-
I put together an animation for the seismicity from the past few days. The animation spans 4/13-4/16. Below is a map that shows a summary of the animation. Beneath that is the video (link and embedded).

- 2016.04.03 M 6.9 Vanuatu
- 2016.04.06 M 6.9 Vanuatu Update #1
- 2016.10.30 M 6.6 Italy
- 2016.10.30 M 6.6 Italy Update #1
- 2016.11.21 M 6.9 Japan
- 2016.12.08 M 6.5 Mendocino fault, CA
- 2016.12.08 M 6.5 Mendocino fault, CA Update #1
- 2016.12.28 M 5.7 swarm Nevada
Here are web pages for some additional earthquakes. The USGS web page for each of these earthquakes is available on the Earthquake Report Page.

ALL Earthquake Reports – 2016
- 2016.12.28 M 5.7 swarm Nevada
- 2016.12.25 M 7.6 Chile
- 2016.12.17 M 7.9 Bougainville
- 2016.12.08 M 7.8 Solomons
- 2016.12.08 M 6.5 Mendocino fault, CA
- 2016.12.08 M 6.5 Mendocino fault, CA Update #1
- 2016.12.05 M 4.3 Petrolia CA
- 2016.11.21 M 6.9 Japan
- 2016.11.13 M 7.8 New Zealand Post #1
- 2016.12.03 M 7.8 New Zealand Post #2
- 2016.11.24 M 7.0 El Salvador
- 2016.11.06 M 4.1 Laytonville, CA
- 2016.11.04 M 6.4 Maule, Chile
- 2016.11.03 M 3.8 Laytonville, CA
- 2016.11.02 M 3.6 Oregon
- 2016.10.30 M 6.6 Italy
- 2016.10.30 M 6.6 Italy Update #1
- 2016.10.28 M 4.1 Mendocino fault
- 2016.10.28 M 5.8 Tyrrhenian Sea
- 2016.10.27 M 4.1 Mendocino fault
- 2016.10.26 M 6.1 Italy
- 2016.10.19 M 6.2 Japan
- 2016.10.19 M 6.6 Java
- 2016.10.17 M 6.9 New Britain
- 2016.10.16 M 5.3 Greece/Albania
- 2016.10.15 M 6.4 South Bismarck Sea
- 2016.09.25 M 5.0 Gorda plate
- 2016.09.14 M 6.0 Solomon Islands
- 2016.09.10 M 5.7 Tanzania
- 2016.09.05 M 6.3 Bering Kresla (west of Aleutians)
- 2016.09.03 M 5.6 Oklahoma
- 2016.09.03 M 5.6 Mendocino
- 2016.08.31 M 6.7 New Britain
- 2016.08.30 M 7.1 Mid Atlantic Ridge
- 2016.08.24 M 6.8 Burma
- 2016.08.23 M 6.2 Italy
- 2016.08.20 M 6.0 Japan
- 2016.08.19 M 7.4 Scotia plate
- 2016.08.18 M 5.7 Australia
- 2016.08.12 M 7.2 New Hebrides Update #2
- 2016.08.12 M 7.2 New Hebrides Update #1
- 2016.08.12 M 7.2 New Hebrides
- 2016.08.10 M 5.1 Lake Pillsbury, CA
- 2016.08.04 M 4.5 Honey Lake, CA
- 2016.07.29 M 7.7 Mariana
- 2016.07.21 M 4.7 Gorda plate p-1
- 2016.07.21 M 4.7 Gorda plate p-2
- 2016.04.29 M 6.6 East Pacific Rise / MAT
- 2016.04.16 M 7.8 Ecuador
- 2016.04.16 M 7.8 Ecuador Update #1/li>
- 2016.04.15 M 7.0 Japan
- 2016.04.16 M 7.0 Japan Update #2
- 2016.04.14 M 6.2 Japan
- 2016.04.13 M 5.7 & 6.4 Kamchatka
- 2016.04.06 M 6.9 Vanuatu Update #1
- 2016.04.03 M 6.9 Vanuatu
- 2016.04.02 M 6.2 Alaska Peninsula
- 2016.04.01 M 6.0 Japan
- 2016.03.27 M 5.7 Aleutians
- 2016.03.19 M 5.2 Explorer plate
- 2016.03.12 M 6.3 Aleutians
- 2016.03.02 M 7.8 Sumatra/Indian Ocean
- 2016.02.23 M 5.9 Antarctic plate
- 2016.02.23 M 4.9 Bakersfield
- 2016.02.15 M 6.2 Macquarie Island
- 2016.02.14 M 5.8 New Zealand
- 2016.02.05 M 6.4 Taiwan
- 2016.02.05 M 6.4 Taiwan Update #1
- 2016.01.30 M 5.0 Gorda plate
- 2016.01.29 M 7.2 Kamchatka
- 2016.01.24 M 6.1 Mediterranean
- 2016.01.24 M 7.1 Alaska
- 2016.01.21 M 6.6 Mexico
- 2016.01.17 1900-2016 Summary northern Caribbean
- 2016.01.17 M 5.1 pair Cuba
- 2016.01.02 M 4.5 Mendocino fault
Pingback: Earthquake Report: 2016 Summary Cascadia | earthjay science