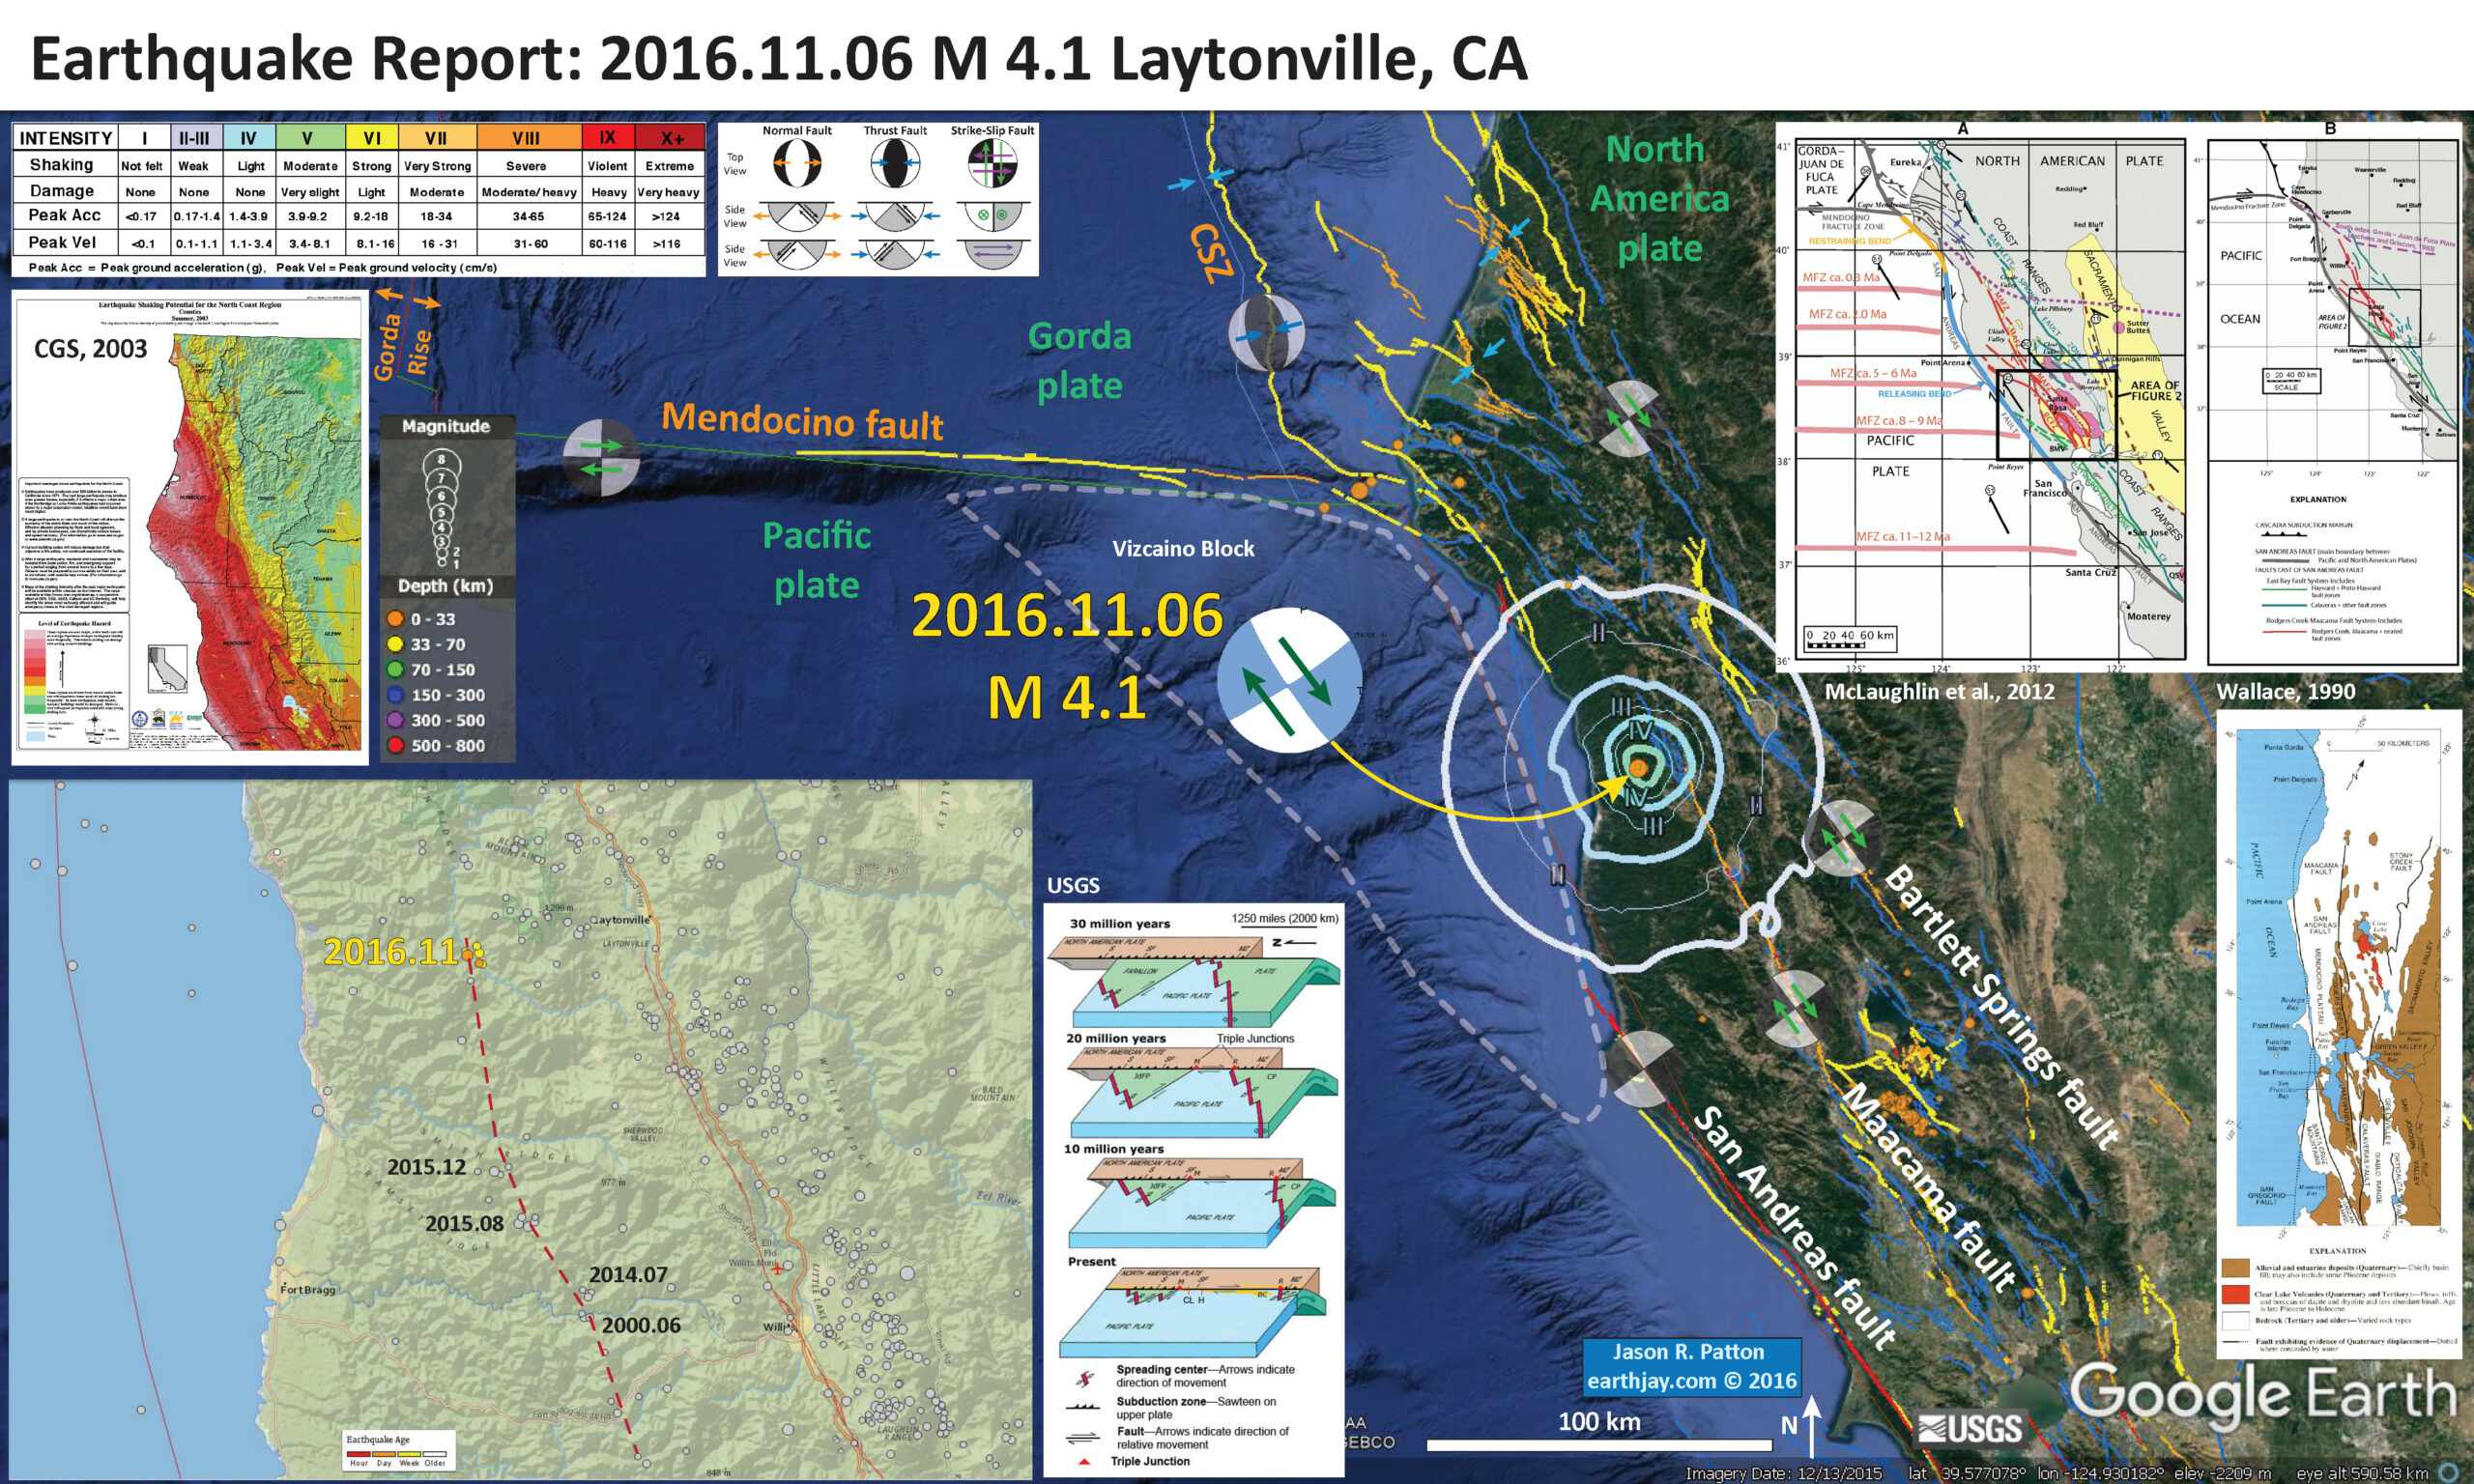
This morning there was another earthquake in northern CA between the San Andreas (SAF) and Maacama faults (MF). This region has been active for the past few years, with earthquakes in the M 3-4 range. Most recently, there was a M 3.8 really close to today’s M 4.1. These earthquakes may indicate the possibility of an unmapped fault. There have been earthquakes in 2000, 2014, and 2015 that align along strike (of a possible fault that is sub-parallel to the SAF/MF systems). Here is the USGS website for today’s M 4.1 earthquake.
The San Andreas fault is a right-lateral strike-slip transform plate boundary between the Pacific and North America plates. The plate boundary is composed of faults that are parallel to sub-parallel to the SAF and extend from the west coast of CA to the Wasatch fault (WF) system in central Utah (the WF runs through Salt Lake City and is expressed by the mountain range on the east side of the basin that Salt Lake City is built within).
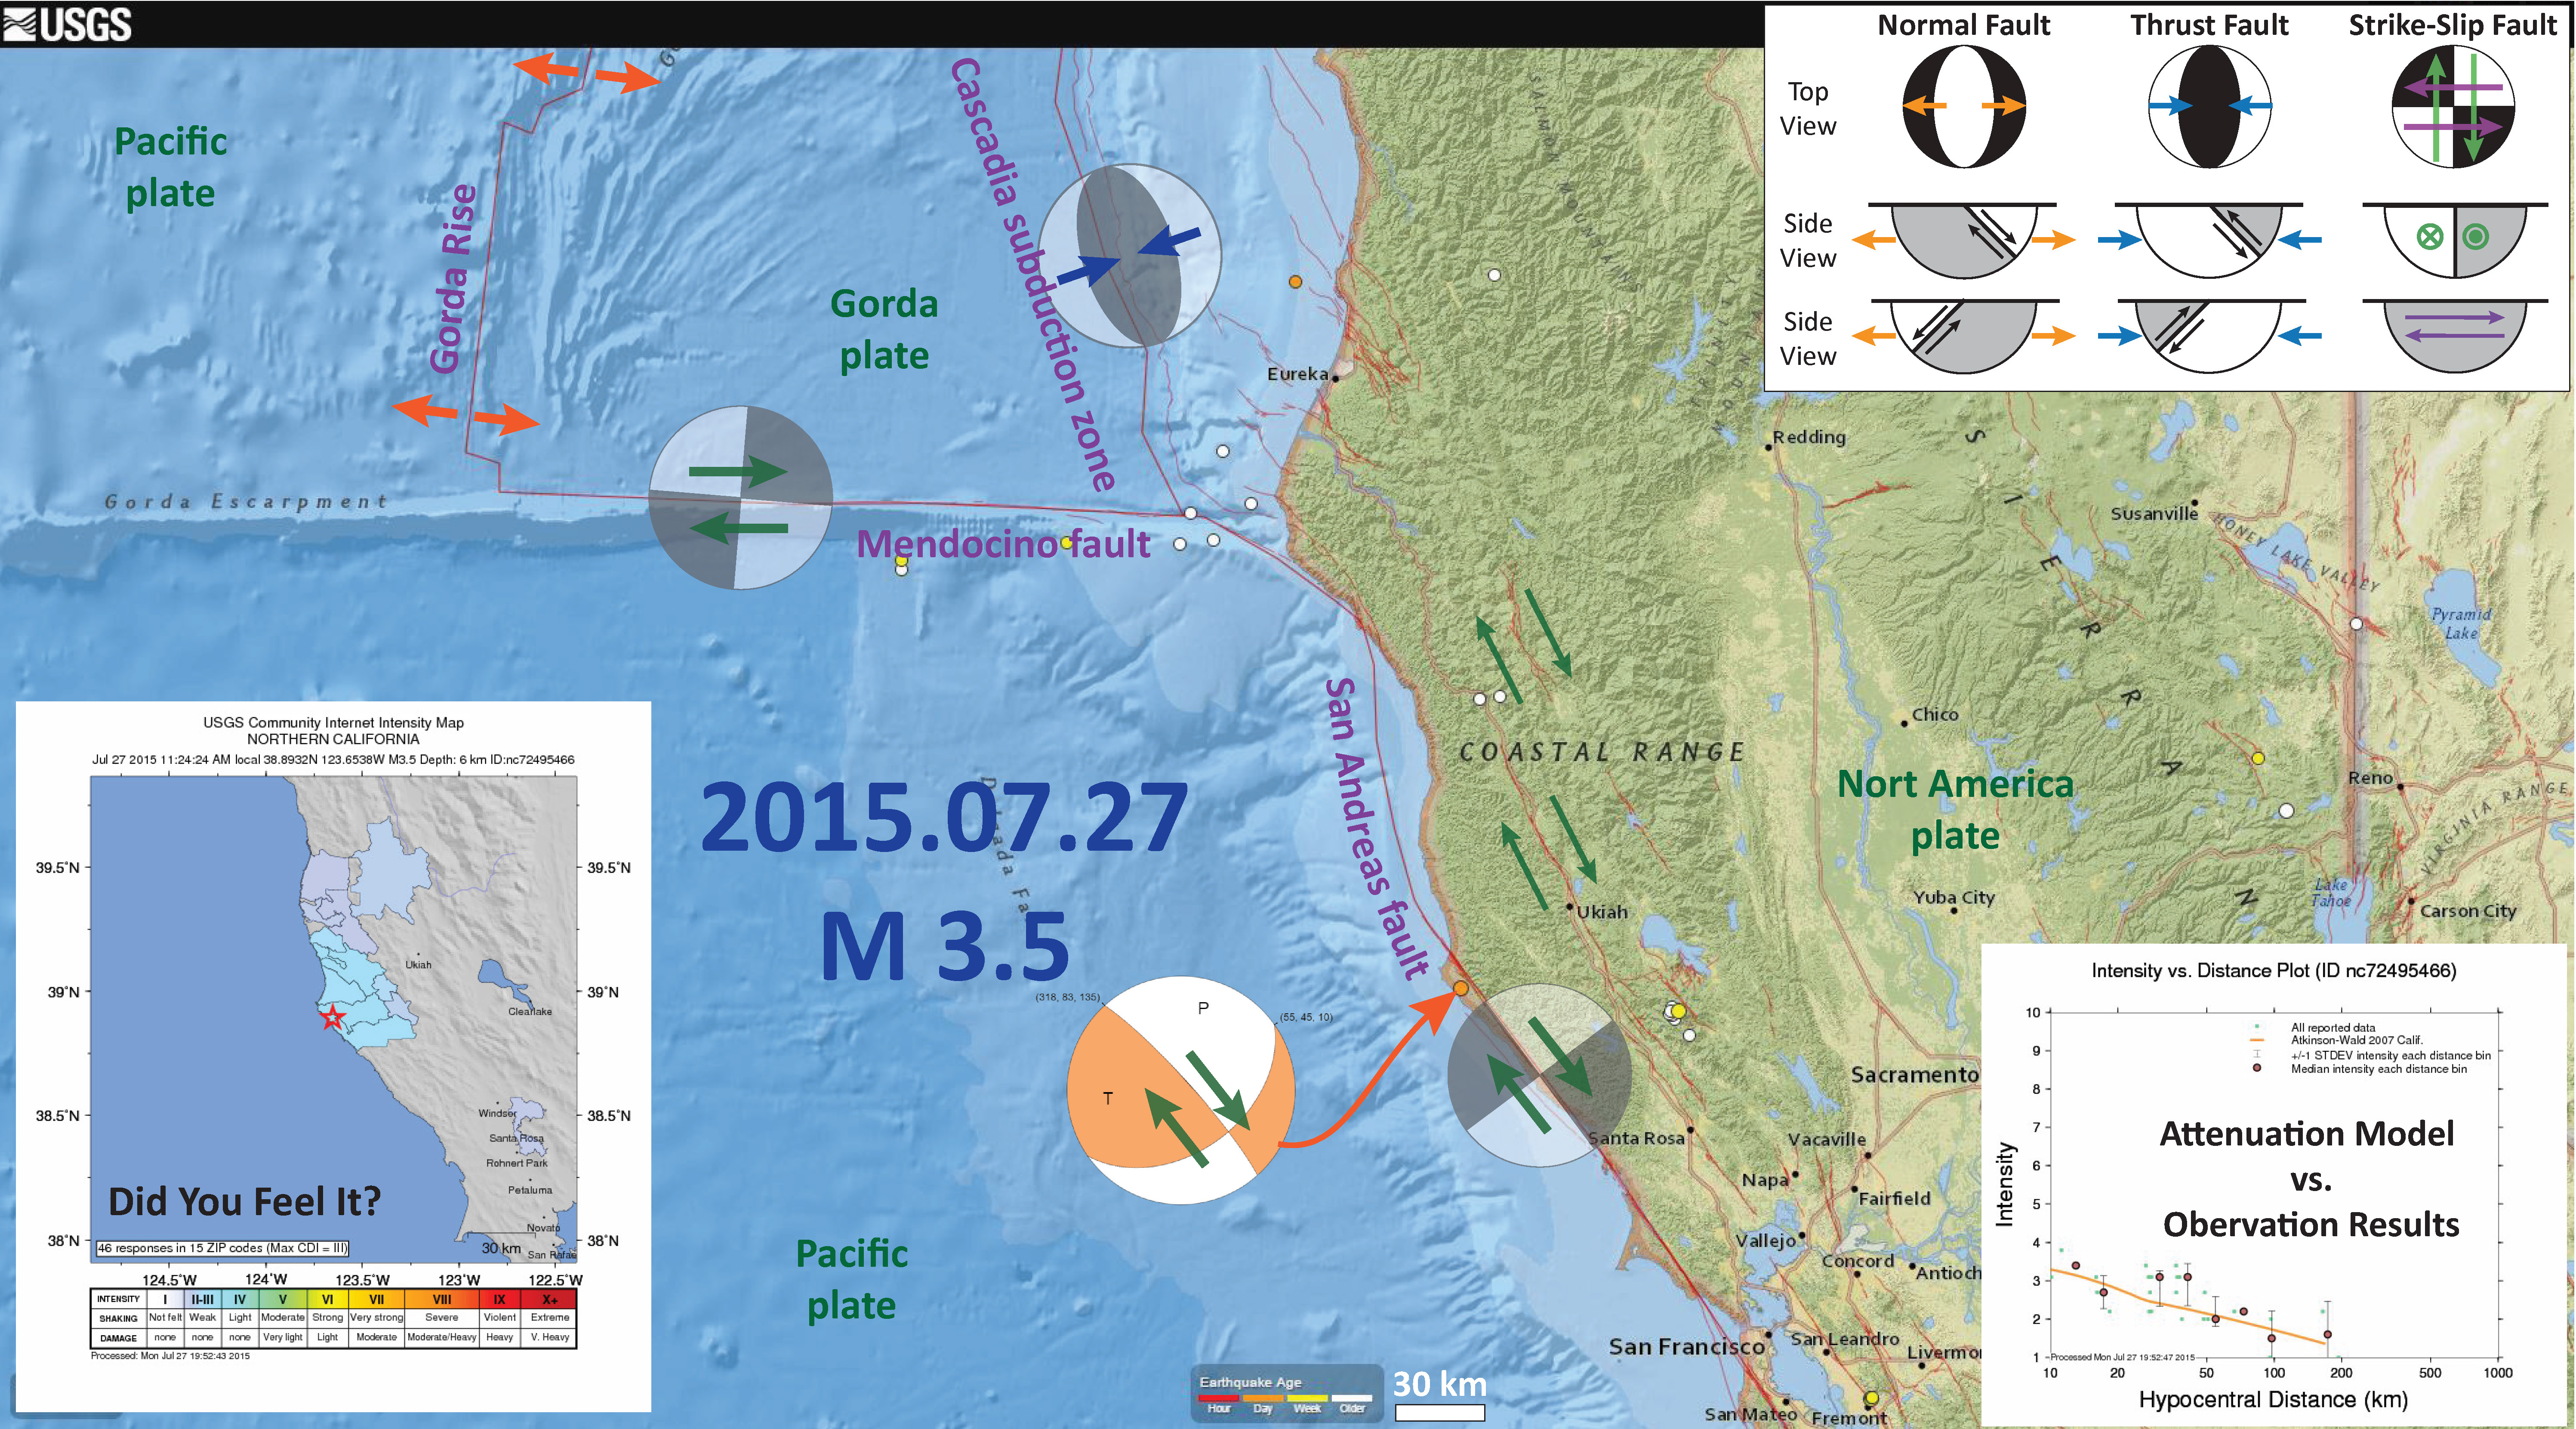
The three main faults in the region north of San Francisco are the SAF, the MF, and the Bartlett Springs fault (BSF). I also place a graphical depiction of the USGS moment tensor for this earthquake. The SAF, MF, and BSF are all right lateral strike-slip fault systems. There are no active faults mapped in the region of Sunday’s epicenter, but I interpret this earthquake to have right-lateral slip. Without more seismicity or mapped faults to suggest otherwise, this is a reasonable interpretation.
Below I plot the seismicity from the past month, with color representing depth and diameter representing magnitude (see legend). I use the USGS Quaternary fault and fold database for the faults. I outlined the Vizcaino Block, which many interpret to be a prehistoric subduction zone accretionary prism from a time before the San Andreas existed.
I also include the shaking intensity contours on the map. These use the Modified Mercalli Intensity Scale (MMI; see the legend on the map). This is based upon a computer model estimate of ground motions, different from the “Did You Feel It?” estimate of ground motions that is actually based on real observations. The MMI is a qualitative measure of shaking intensity. More on the MMI scale can be found here and here. This is based upon a computer model estimate of ground motions, different from the “Did You Feel It?” estimate of ground motions that is actually based on real observations.
I placed a moment tensor / focal mechanism legend on the poster. There is more material from the USGS web sites about moment tensors and focal mechanisms (the beach ball symbols). Both moment tensors and focal mechanisms are solutions to seismologic data that reveal two possible interpretations for fault orientation and sense of motion. One must use other information, like the regional tectonics, to interpret which of the two possibilities is more likely. Based on the moment tensor and my knowledge of the tectonics of this region, I interpret this earthquake to have had a right lateral strike slip motion along an east-west fault.
UPDATE: 6 November 2023
Over 2 decades ago I worked for Pacific Watershed Associates, a consulting firm from Arcata/McKinleyville (Humboldt County, California). I worked initially as a GIS technician but moved to having a staff geologist position. Bill Weaver and Danny Hagans were the first best bosses that I have ever had.
The principals developed a methodology for assessing and designing forest and ranch roads to reduce fine sediment delivery to salmon bearing water courses. They did this initially at Redwood National and State Parks.
After many years of working within these water courses to mitigate the century of devastation (timber harvesting altered the landscape, decreasing the quality of fish habitat), they learned that roads are the largest contributor of fine sediment to water courses. So, they focused on that type of watershed restoration.
One of the staff geologists at the time was Todd Kraemer (who still works there) and he had some jobs down west of Laytonville. Kraemer showed me photos of these beautiful mud pots.
Later, as I was working on my Ph.D. I learned about how mud volcanoes can indicate a wide variety of conditions related to different plate tectonic settings. I thought back about these Branscomb mud volcanoes and kept that partly to myself.
Then there was the earthquake in 2017 along the Makran margin (Pakistan).
Then I came across Mark Tingay and his tweets about mud volcanoes. At some point, these Branscomb mud volcanoes even came up with Mark.
Well, here is the update.
Bob McLaughlin (USGS emeritus) actually investigated the geochemistry of these Branscomb mud volcanoes years ago.
These volcanoes are located on private property in rural Mendocino County, deep within the Emerald Triangle (the locus of recreational cannabis farming in the 1970s/80s that established an international reputation for this [now legal] recreational substance).
Back then and into the 21st century (even today, though to a lesser degree) it was potentially quite dangerous to drive around on these dirt roads. Dangerous because of this [at the time] illegal industry but also dangerous because others who lived in these rural areas also guarded their private property with loaded weapons.
So, Bob was driving out to check out these volcanoes and nearby them, he heard some gun shots. This frightened Bob quite a bit.
Long story short, the person shooting the gun was the resident there who had been shooting some rabbits.
Bob helped her bury the dead rabbits and that was the beginning of an unexpected decades long friendship.
Bob sampled the mud to test to see if there was a deep source for the fluids or gasses (e.g., tectonic or magmatic). Without going into the details, Bob found that these mud volcanoes are sourced from shallow depths and are unrelated to plate tectonics.
So, the location where these mud volcanoes coincide with this seismicity is merely a coincidence. (long story short, heheh)
- In the upper right corner I include a map from McLaughlin et al. (2012) that shows the regional faulting.
- In the lower right corner I include generalized fault map of northern California from Wallace (1990).
- In the lower left corner I include a map that shows the seismicity for this region since 1960, including earthquakes with magnitudes greater than or equal to M 1.5. I have labeled some of the significant earthquake swarms, with magnitudes ranging from M 3-4. Here is the USGS search that I used to create this map.
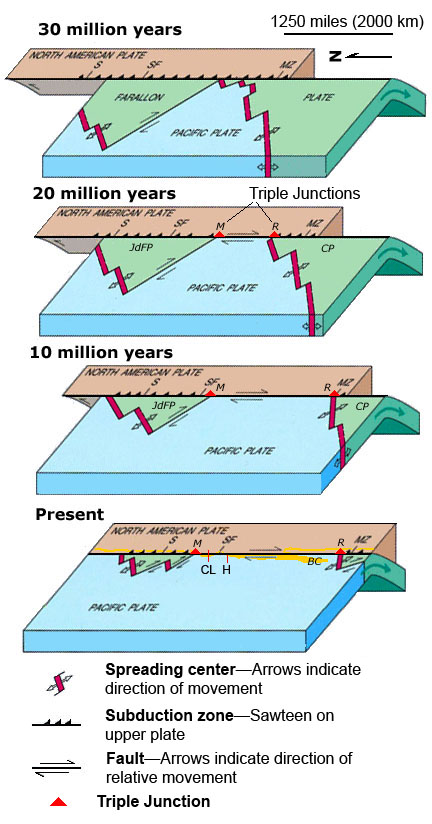
- To the right of the seismicity map is a figure that shows the evolution of the San Andreas fault system since 30 million years ago (Ma). This is a figure from the USGS here.
- In the upper left corner I include the Earthquake Shaking Potential map from the state of California. This is a probabilistic seismic hazard map, basically a map that shows the likelihood that there will be shaking of a given amount over a period of time. More can be found from the California Geological Survey here. I place a yellow star in the approximate location of today’s earthquake.
I include some inset figures in the poster.

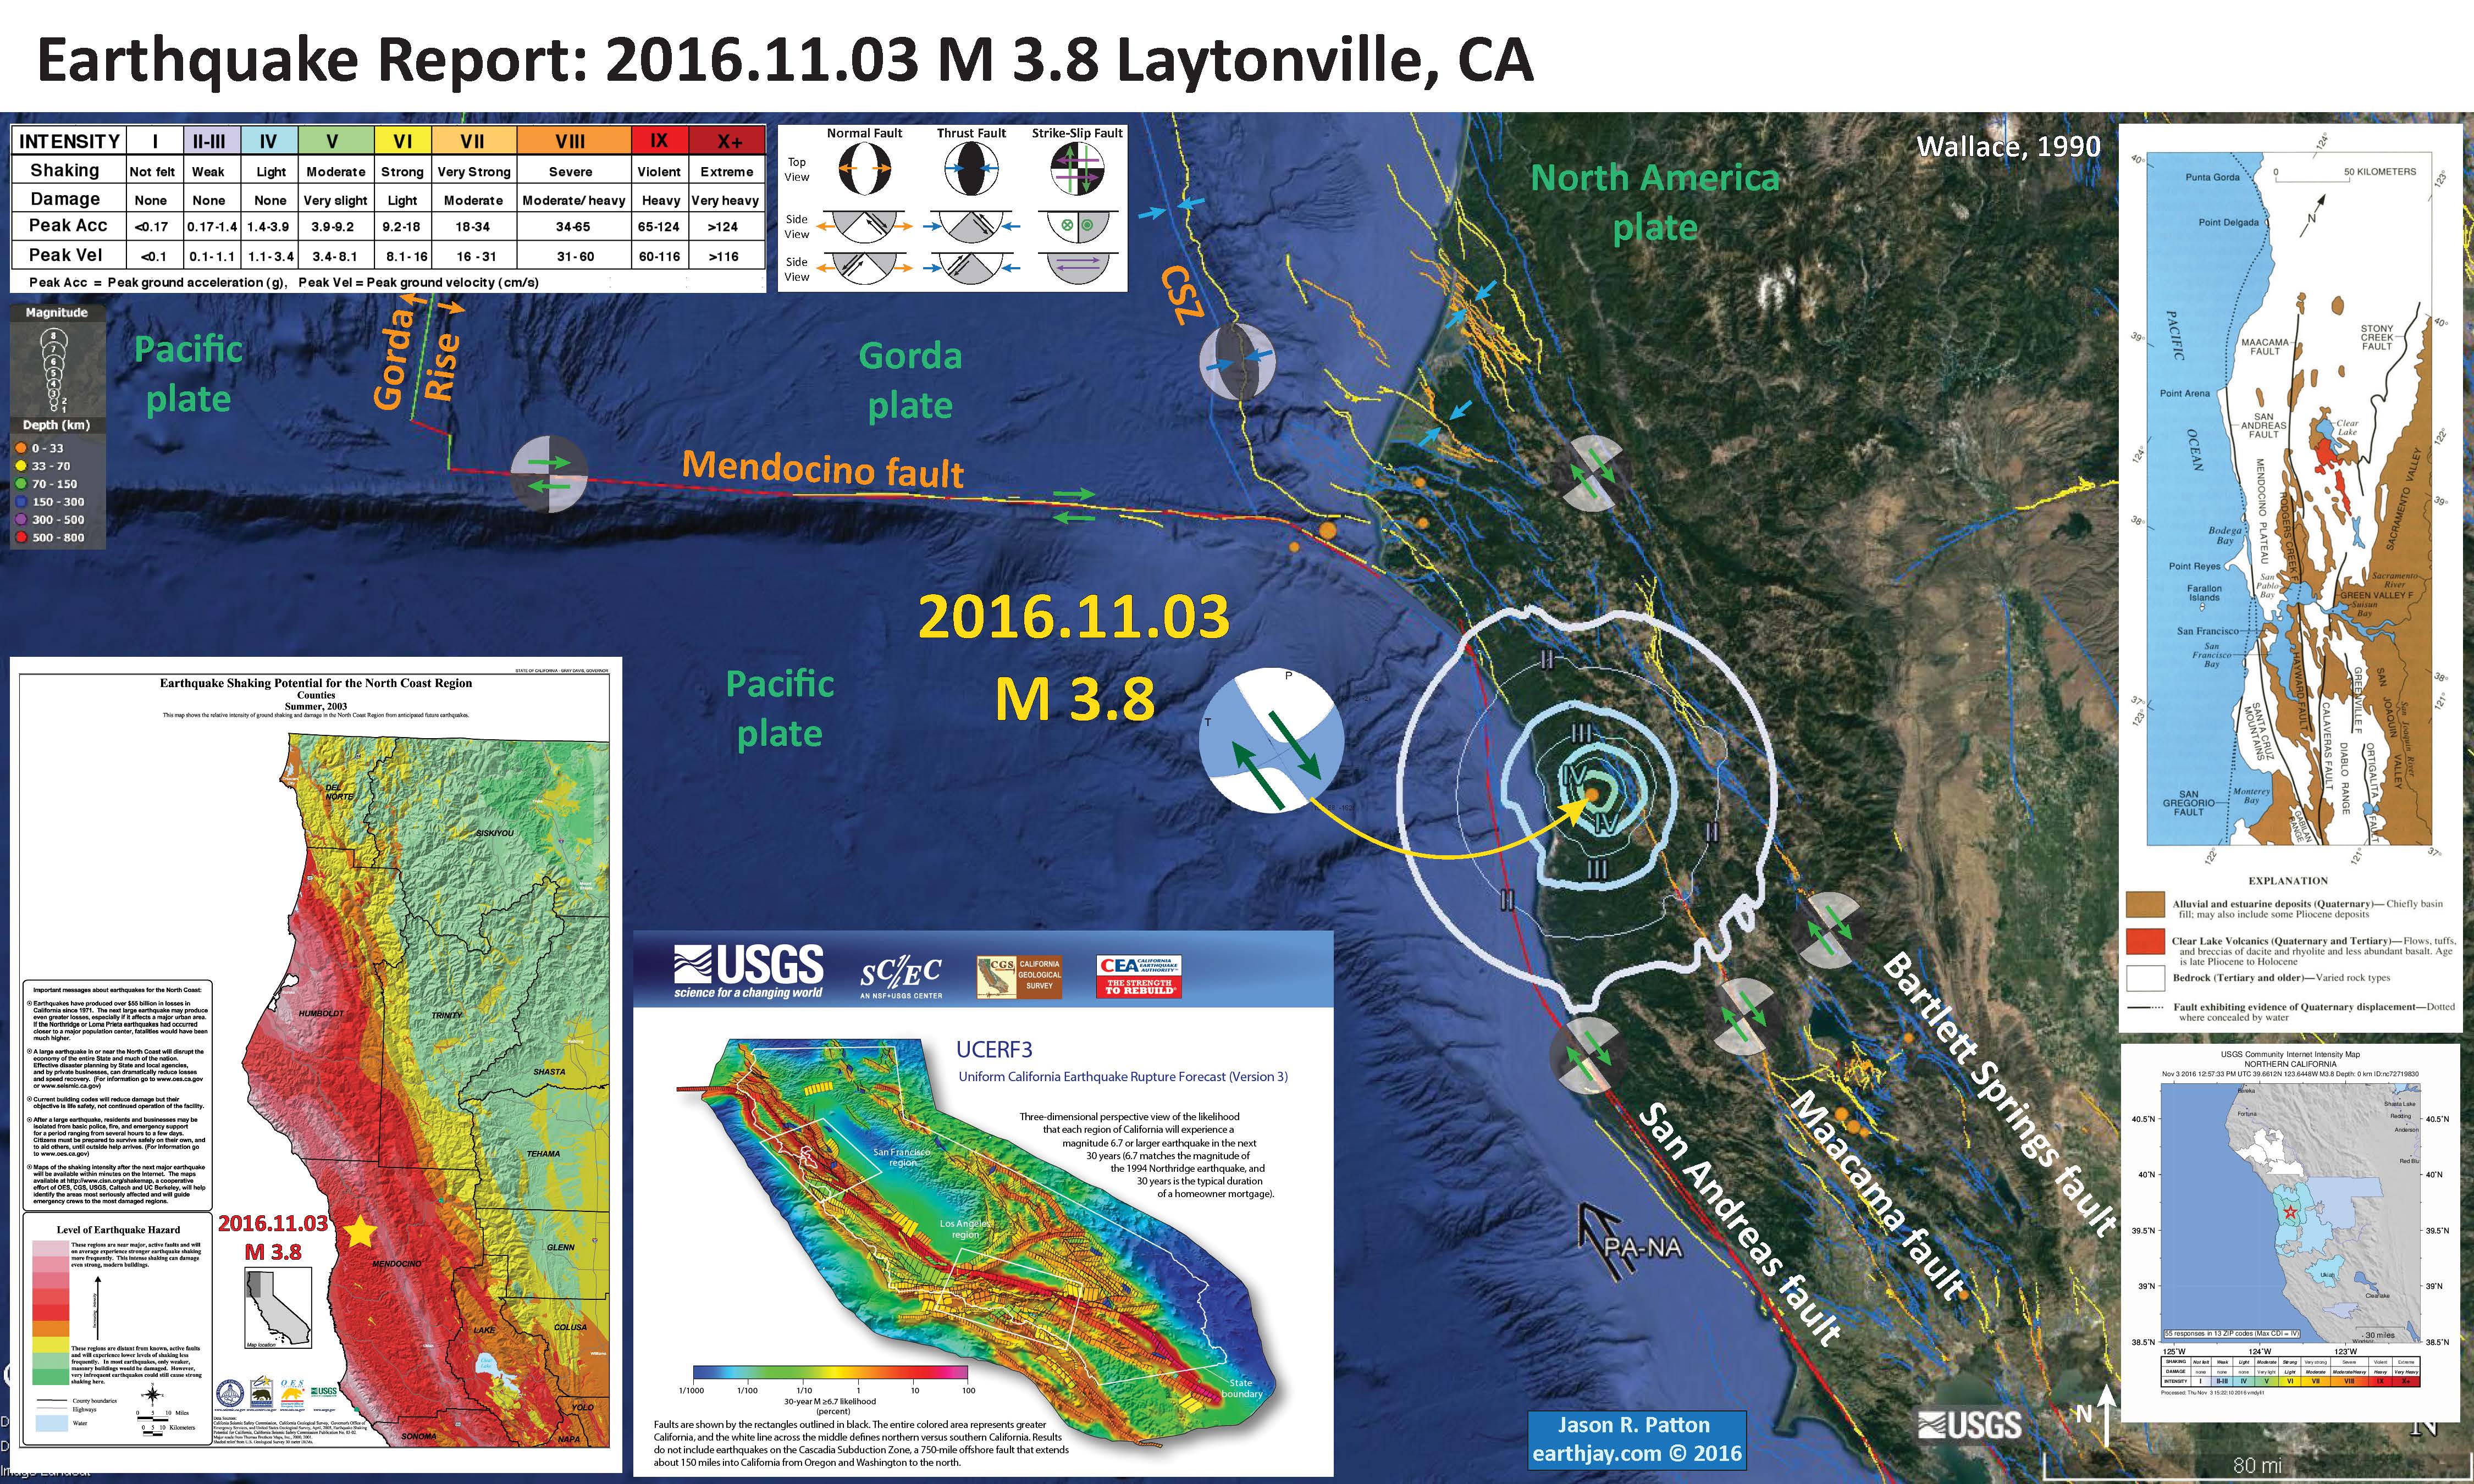
- Earlier this month (a couple days ago), there was an earthquake in this region. Below is my interpretive poster for that earthquake. Here is my Earthquake Report.
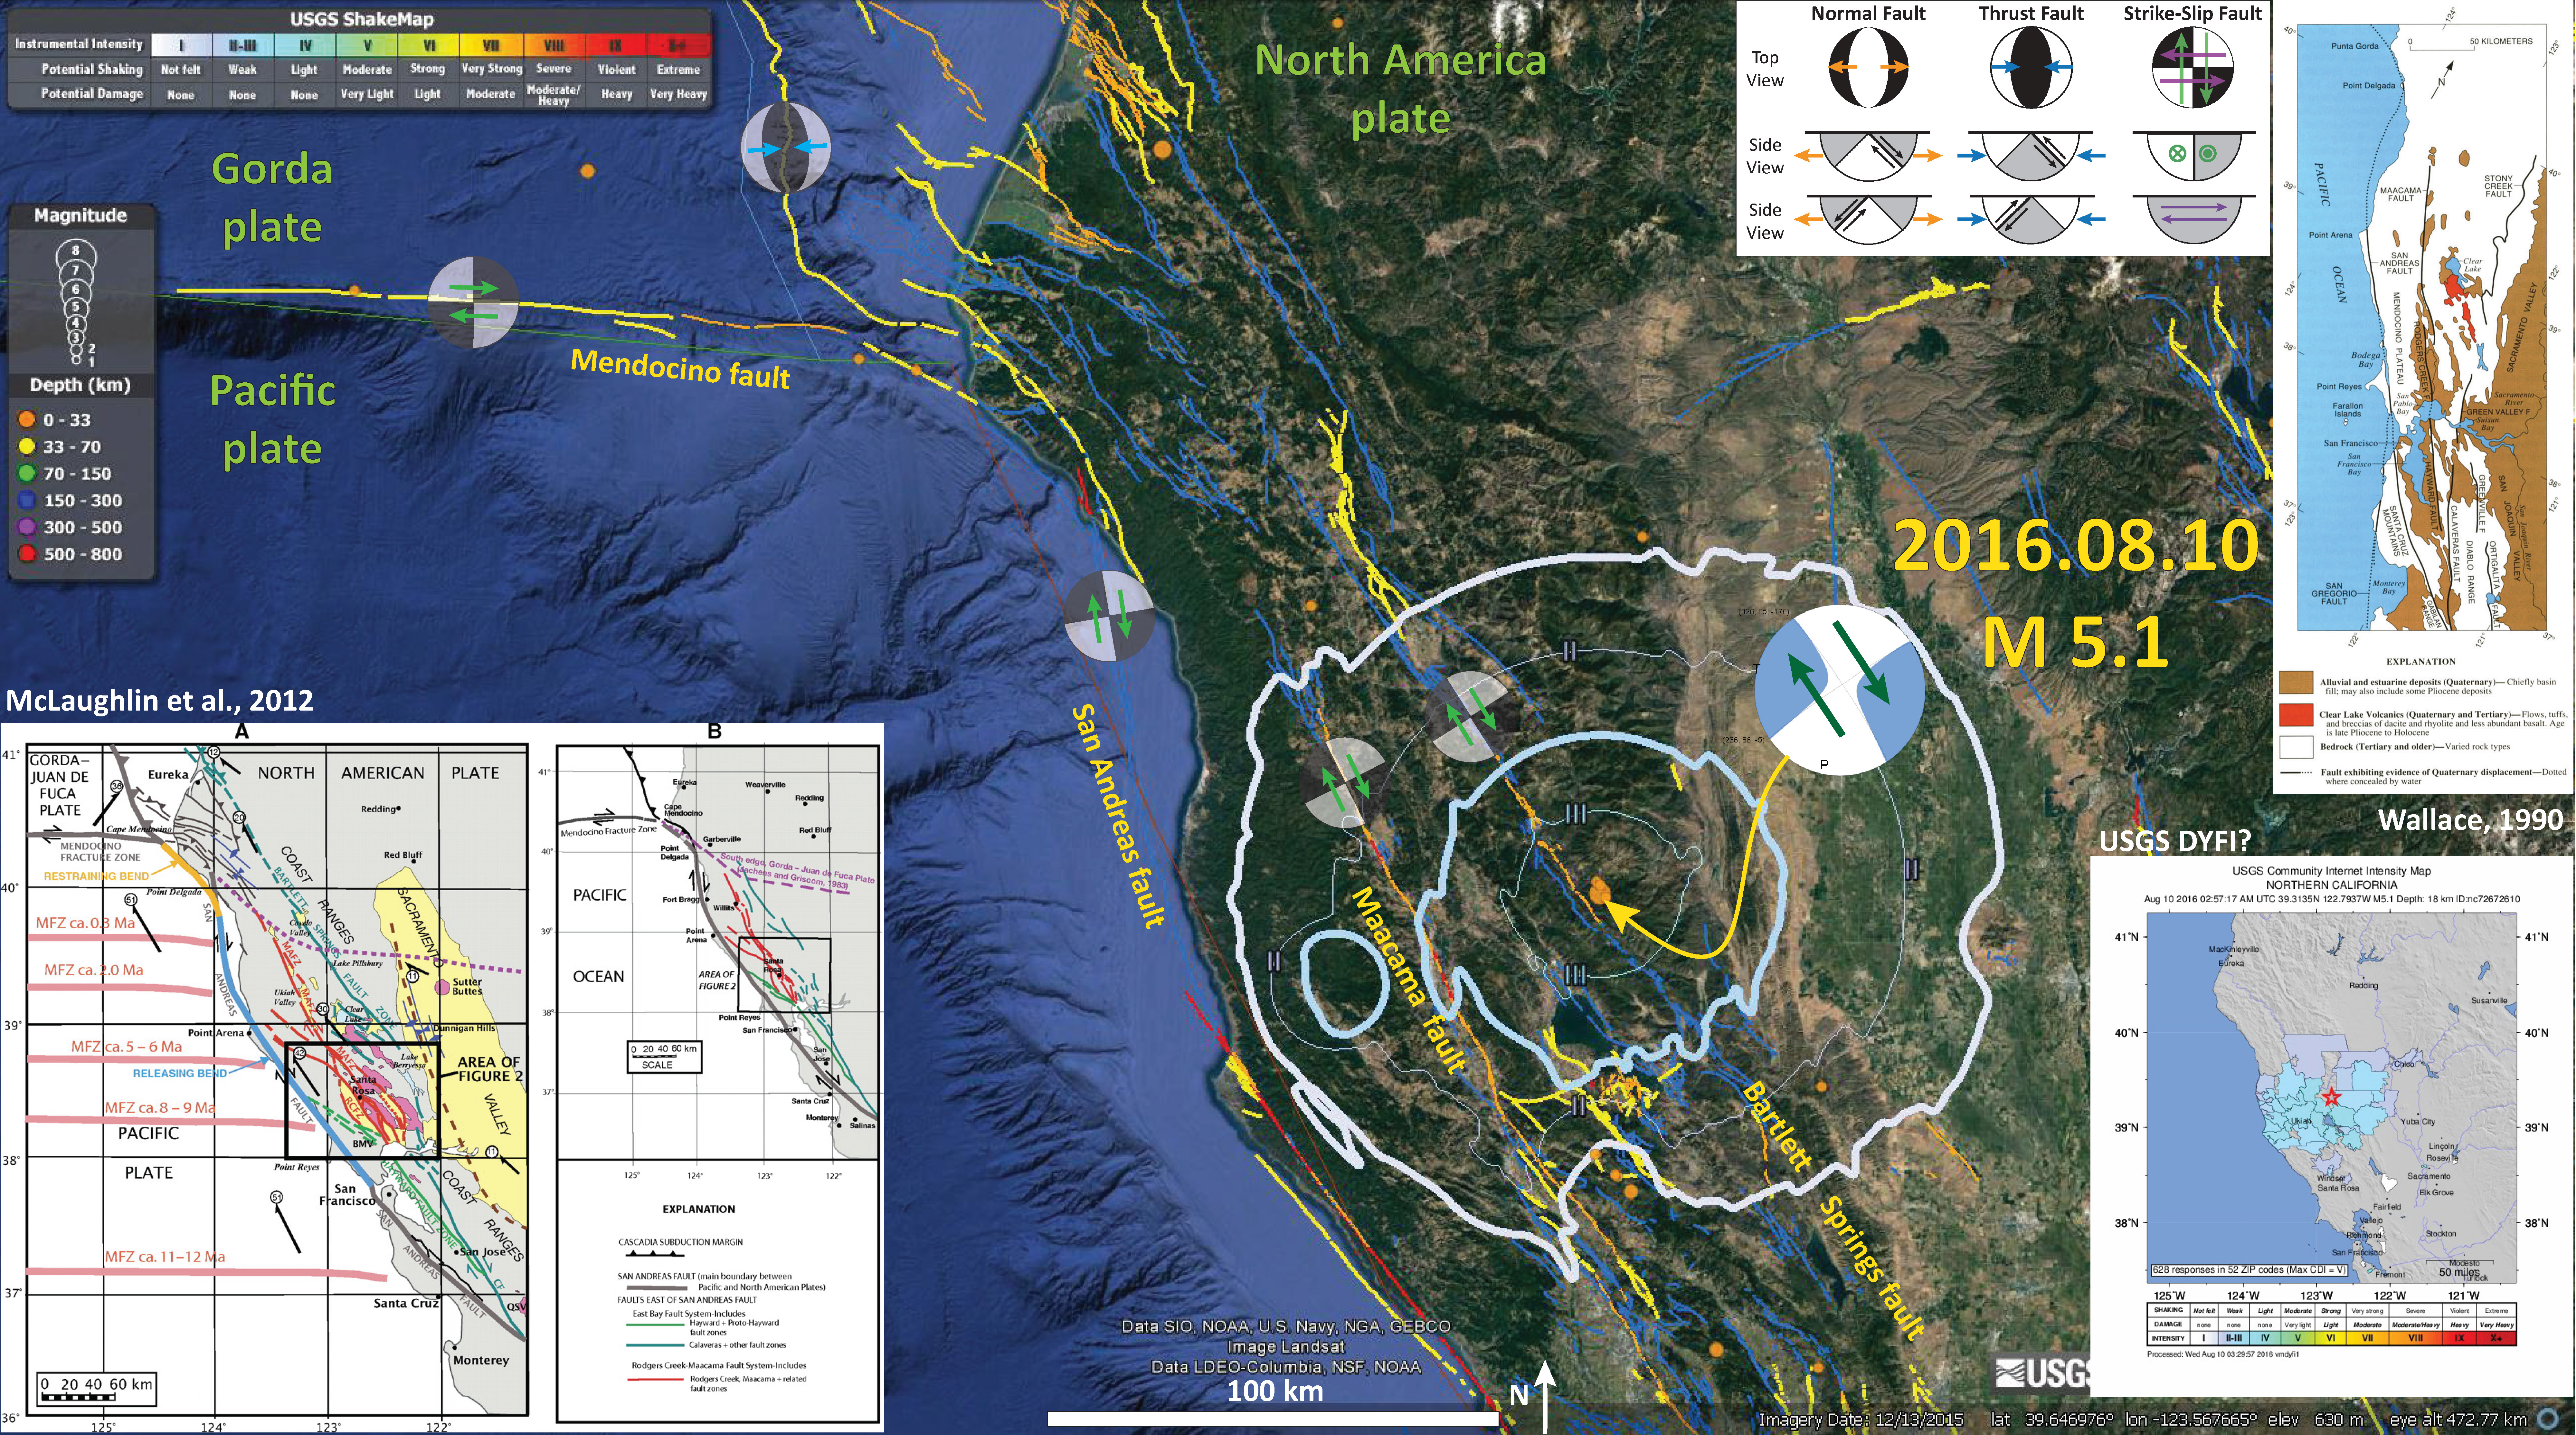
- Earlier this year, there was an earthquake in this region, along the BSF. Below is my interpretive poster for that earthquake. Here is my Earthquake Report.
- Last year there was an earthquake in this region. Below is my interpretive poster for that earthquake. Here is my Earthquake Report.

- There was a recent earthquake along the San Andreas fault in the Point Arena region in July of 2015.
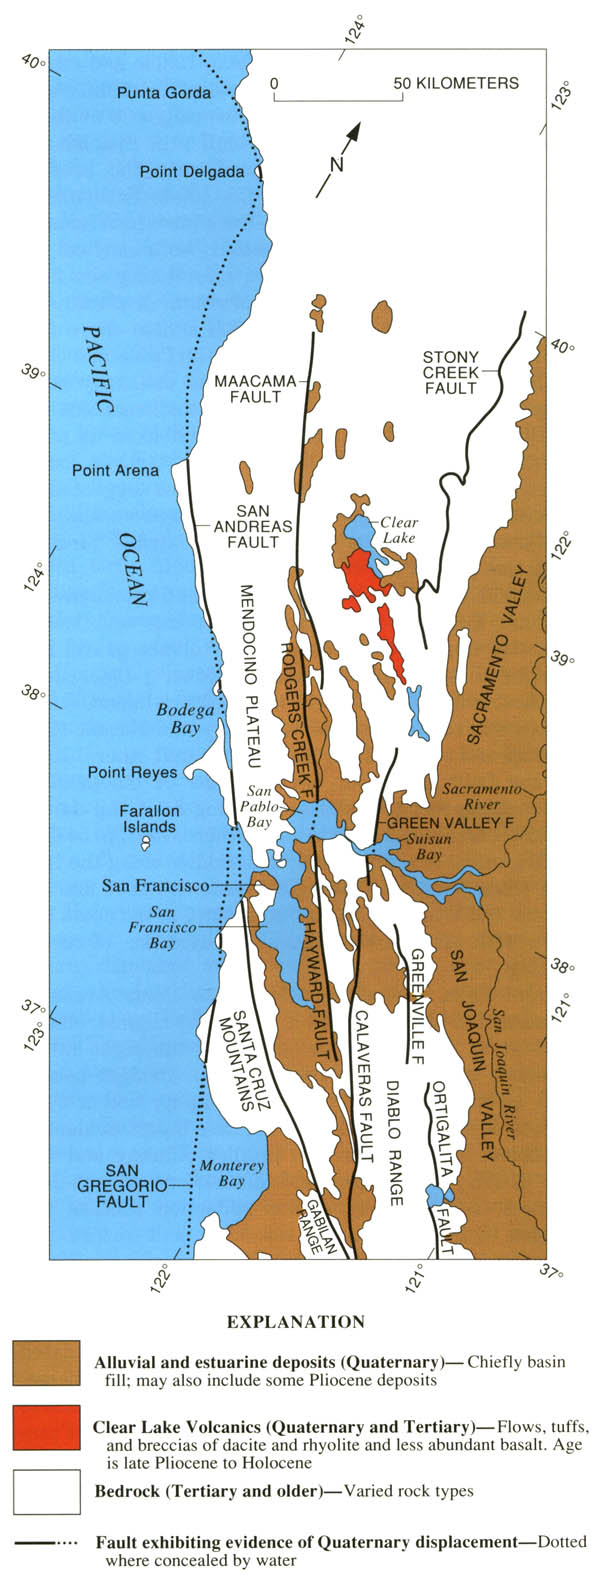
- I place a map shows the configuration of faults in central (San Francisco) and northern (Point Delgada – Punta Gorda) CA (Wallace, 1990). Here is the caption for this map, that is on the lower left corner of my map. Below the citation is this map presented on its own.
Geologic sketch map of the northern Coast Ranges, central California, showing faults with Quaternary activity and basin deposits in northern section of the San Andreas fault system. Fault patterns are generalized, and only major faults are shown. Several Quaternary basins are fault bounded and aligned parallel to strike-slip faults, a relation most apparent along the Hayward-Rodgers Creek-Maacama fault trend.
- About 75% of the relative plate motion is accommodated along the SAF and its synthetic sister faults in the northern CA region. The rest of the plate boundary motion is accommodated along the Eastern CA shear zone and Walker Lane, along with the Central Nevada Seismic Belt, and the Wasatch fault systems. In Northern CA, there is about 33-37 mm/yr strain accumulated on the SAF plate boundary system. About 18-25 mm/yr is on the SAF, 8-11 mm/yr on the MF, and 5-7 mm/yr on the Bartlett Springs fault system (Geist and Andrews, 2000).
- Here is a map from McLaughlin et al. (2012) that shows the regional faulting. I include the figure caption as a blockquote below.
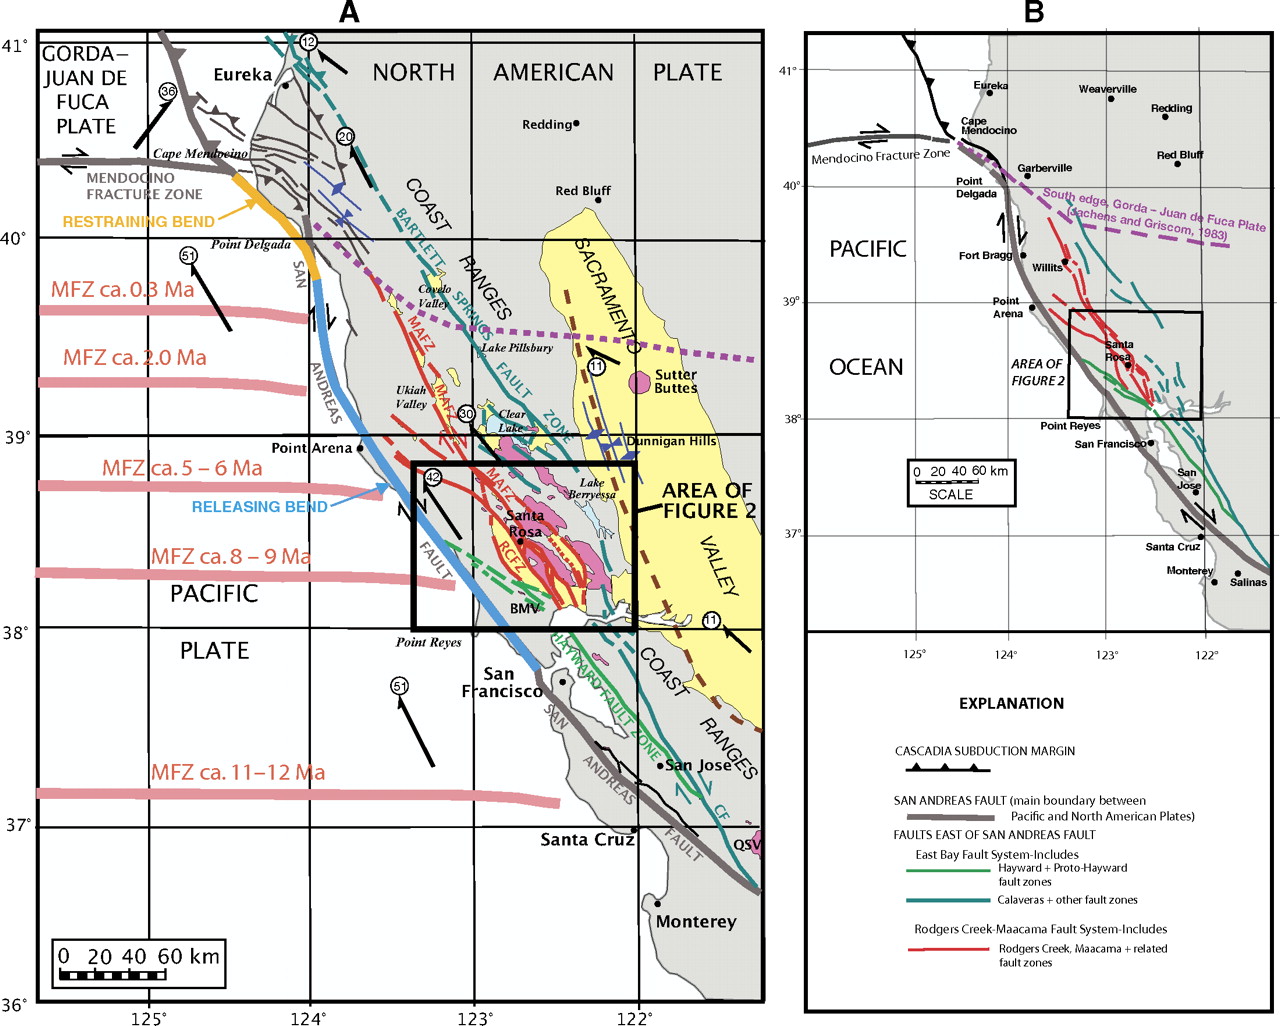
Maps showing the regional setting of the Rodgers Creek–Maacama fault system and the San Andreas fault in northern California. (A) The Maacama (MAFZ) and Rodgers Creek (RCFZ) fault zones and related faults (dark red) are compared to the San Andreas fault, former and present positions of the Mendocino Fracture Zone (MFZ; light red, offshore), and other structural features of northern California. Other faults east of the San Andreas fault that are part of the wide transform margin are collectively referred to as the East Bay fault system and include the Hayward and proto-Hayward fault zones (green) and the Calaveras (CF), Bartlett Springs, and several other faults (teal). Fold axes (dark blue) delineate features associated with compression along the northern and eastern sides of the Coast Ranges. Dashed brown line marks inferred location of the buried tip of an east-directed tectonic wedge system along the boundary between the Coast Ranges and Great Valley (Wentworth et al., 1984; Wentworth and Zoback, 1990). Dotted purple line shows the underthrust south edge of the Gorda–Juan de Fuca plate, based on gravity and aeromagnetic data (Jachens and Griscom, 1983). Late Cenozoic volcanic rocks are shown in pink; structural basins associated with strike-slip faulting and Sacramento Valley are shown in yellow. Motions of major fault blocks and plates relative to fi xed North America, from global positioning system and paleomagnetic studies (Argus and Gordon, 2001; Wells and Simpson, 2001; U.S. Geological Survey, 2010), shown with thick black arrows; circled numbers denote rate (in mm/yr). Restraining bend segment of the northern San Andreas fault is shown in orange; releasing bend segment is in light blue. Additional abbreviations: BMV—Burdell Mountain Volcanics; QSV—Quien Sabe Volcanics. (B) Simplifi ed map of color-coded faults in A, delineating the principal fault systems and zones referred to in this paper.
- Here is the figure showing the evolution of the SAF since its inception about 29 Ma. I include the USGS figure caption below as a blockquote.
- Here is a map that shows the shaking potential for earthquakes in CA. This comes from the state of California here.
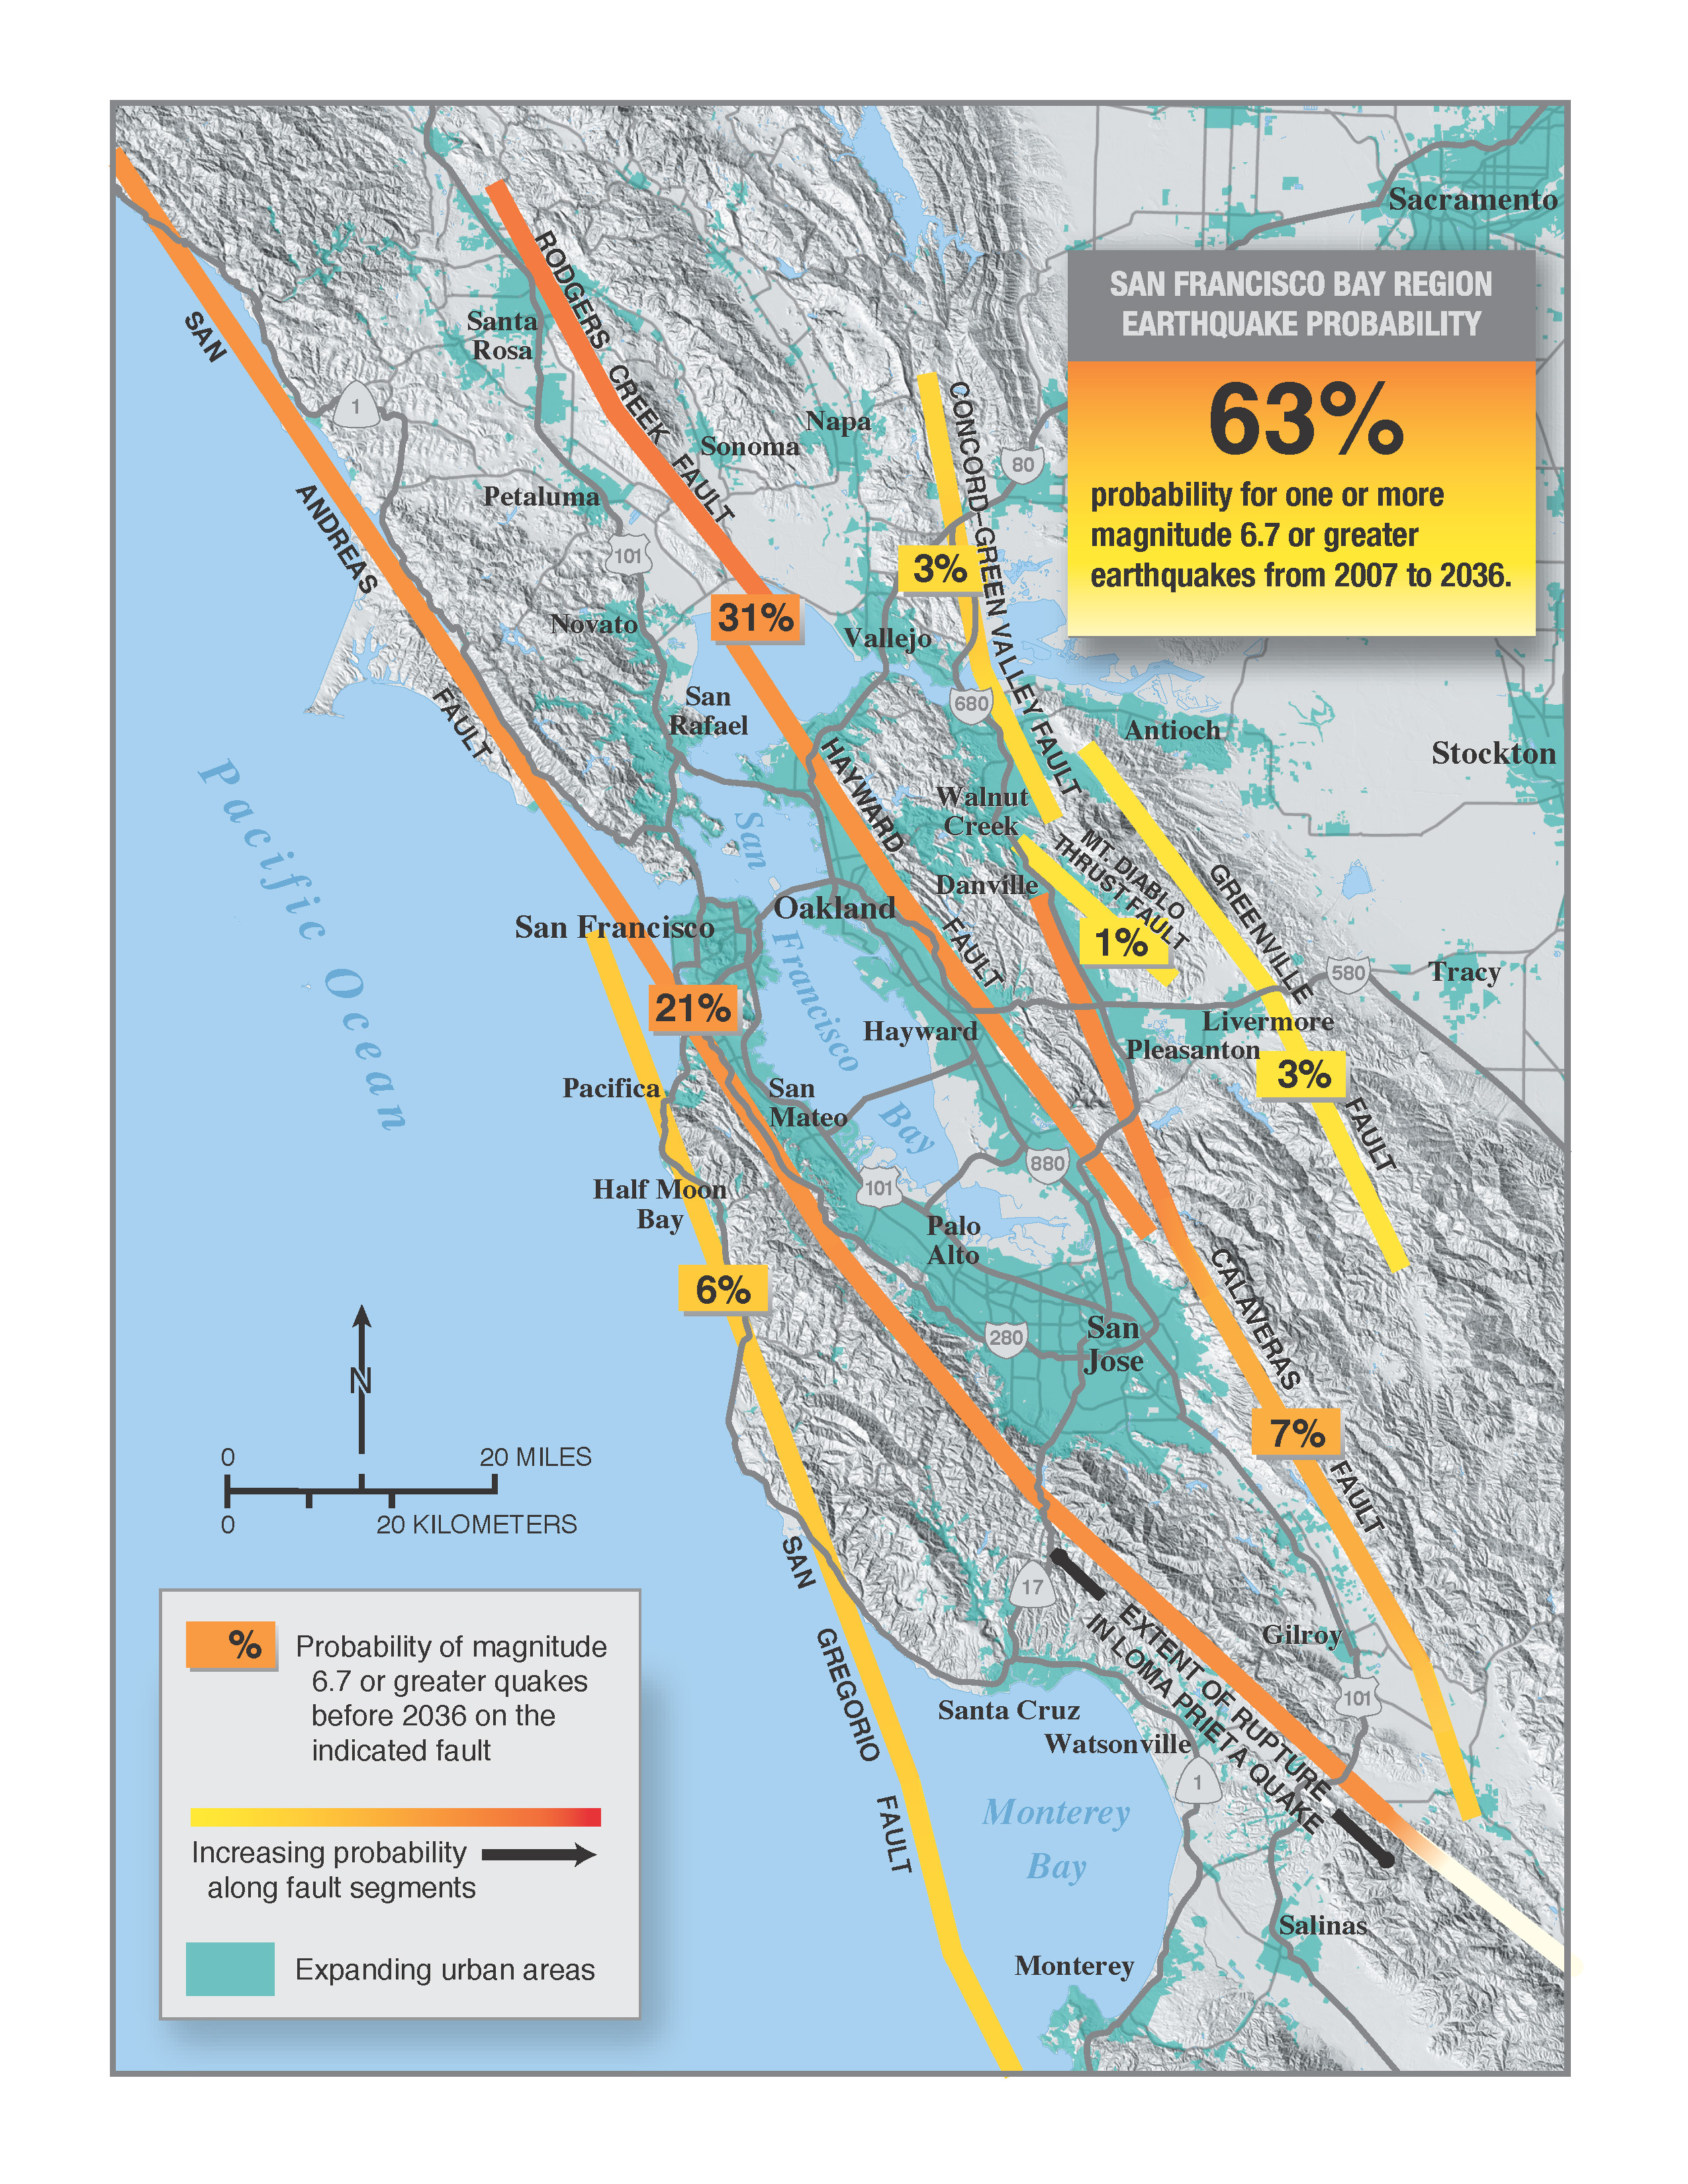
- This is a map that shows the probability of earthquakes along these fault systems in the San Francisco Bay region.
- Geist, E.L. and Andrews D.J., 2000. Slip rates on San Francisco Bay area faults from anelastic deformation of the continental lithosphere, Journal of Geophysical Research, v. 105, no. B11, p. 25,543-25,552.
- Irwin, W.P., 1990. Quaternary deformation, in Wallace, R.E. (ed.), 1990, The San Andreas Fault system, California: U.S. Geological Survey Professional Paper 1515, online at: http://pubs.usgs.gov/pp/1990/1515/
- McLaughlin, R.J., Sarna-Wojcicki, A.M., Wagner, D.L., Fleck, R.J., Langenheim, V.E., Jachens, R.C., Clahan, K., and Allen, J.R., 2012. Evolution of the Rodgers Creek–Maacama right-lateral fault system and associated basins east of the northward-migrating Mendocino Triple Junction, northern California in Geosphere, v. 8, no. 2., p. 342-373.
- Stoffer, P.W., 2006, Where’s the San Andreas Fault? A guidebook to tracing the fault on public lands in the San Francisco Bay region: U.S. Geological Survey General Interest Publication 16, 123 p., online at http://pubs.usgs.gov/gip/2006/16/
- Wallace, Robert E., ed., 1990, The San Andreas fault system, California: U.S. Geological Survey Professional Paper 1515, 283 p. [https://pubs.er.usgs.gov/publication/pp1515].
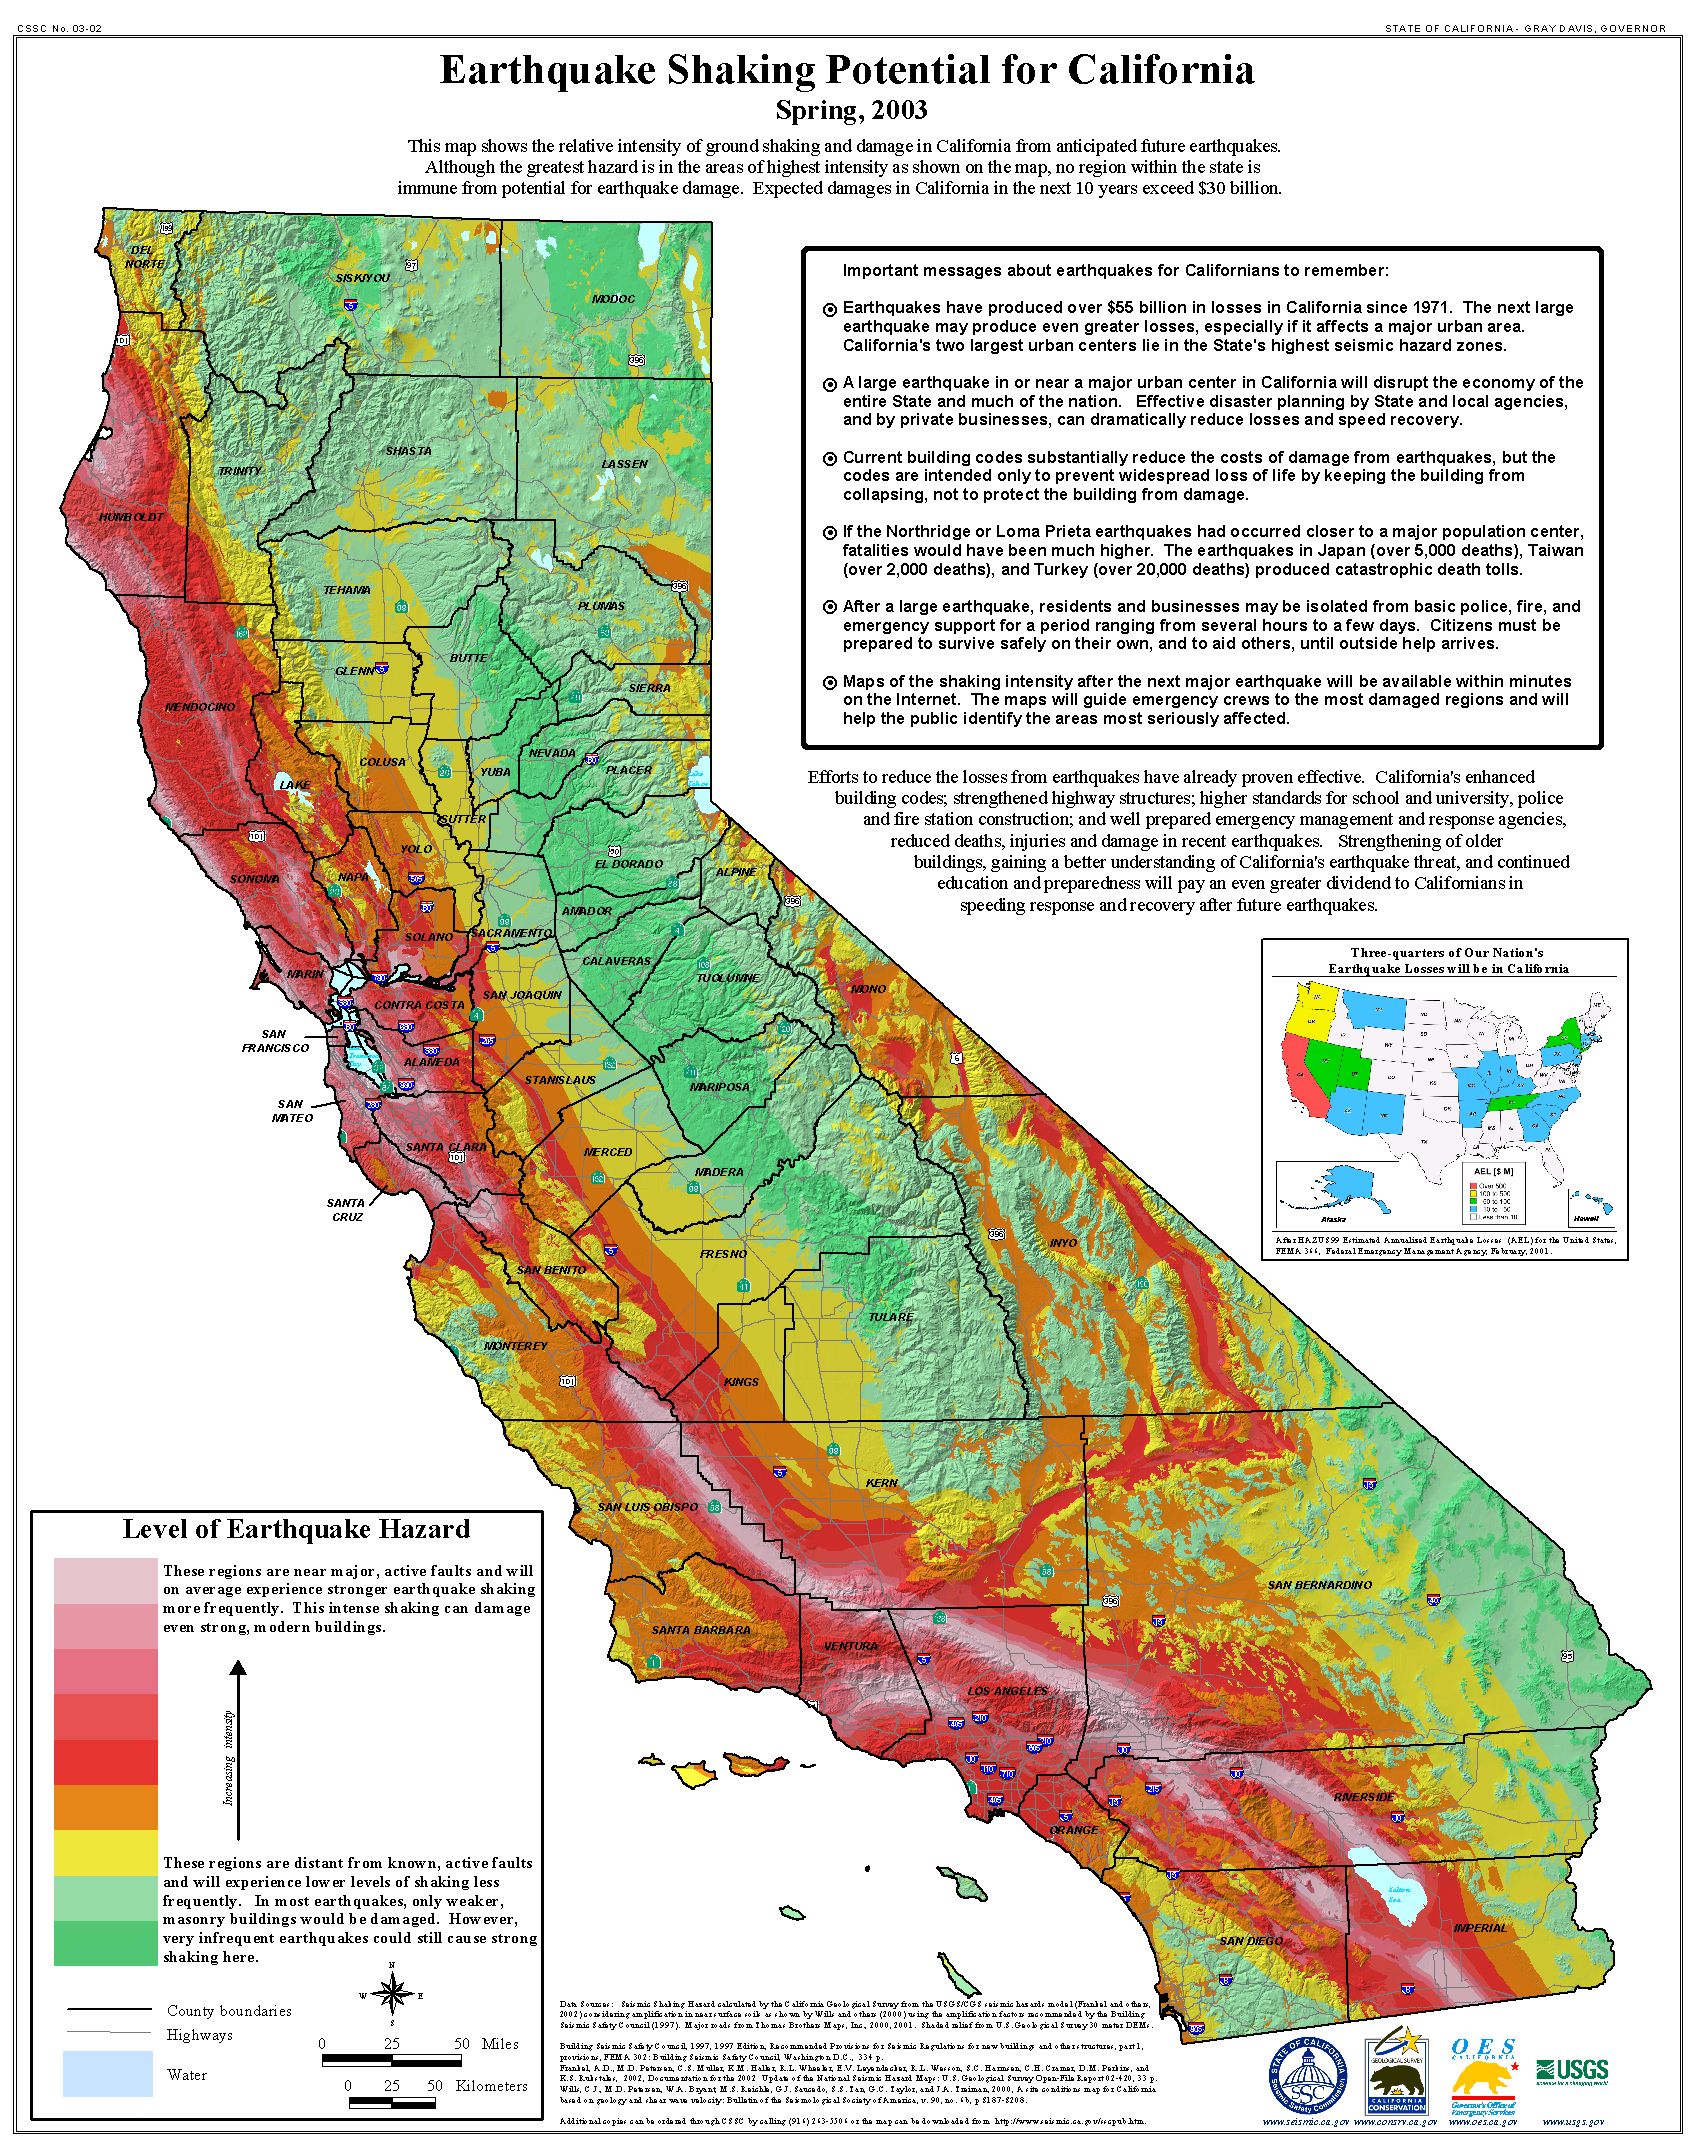
Earthquake shaking hazards are calculated by projecting earthquake rates based on earthquake history and fault slip rates, the same data used for calculating earthquake probabilities. New fault parameters have been developed for these calculations and are included in the report of the Working Group on California Earthquake Probabilities. Calculations of earthquake shaking hazard for California are part of a cooperative project between USGS and CGS, and are part of the National Seismic Hazard Maps. CGS Map Sheet 48 (revised 2008) shows potential seismic shaking based on National Seismic Hazard Map calculations plus amplification of seismic shaking due to the near surface soils.