Here I summarize the seismicity for Cascadia in 2016. I limit this summary to earthquakes with magnitude greater than or equal to M 4.0. I reported on all but five of these earthquakes. I put this together a couple weeks ago, but wanted to wait to post until the new year (just in case that there was another earthquake to include).
I prepared a 2016 annual summary for Earth here.
-
I include summaries of my earthquake reports in sorted into three categories. One may also search for earthquakes that may not have made it into these summary pages (use the search tool).
- Magnitude
- Region
- Year
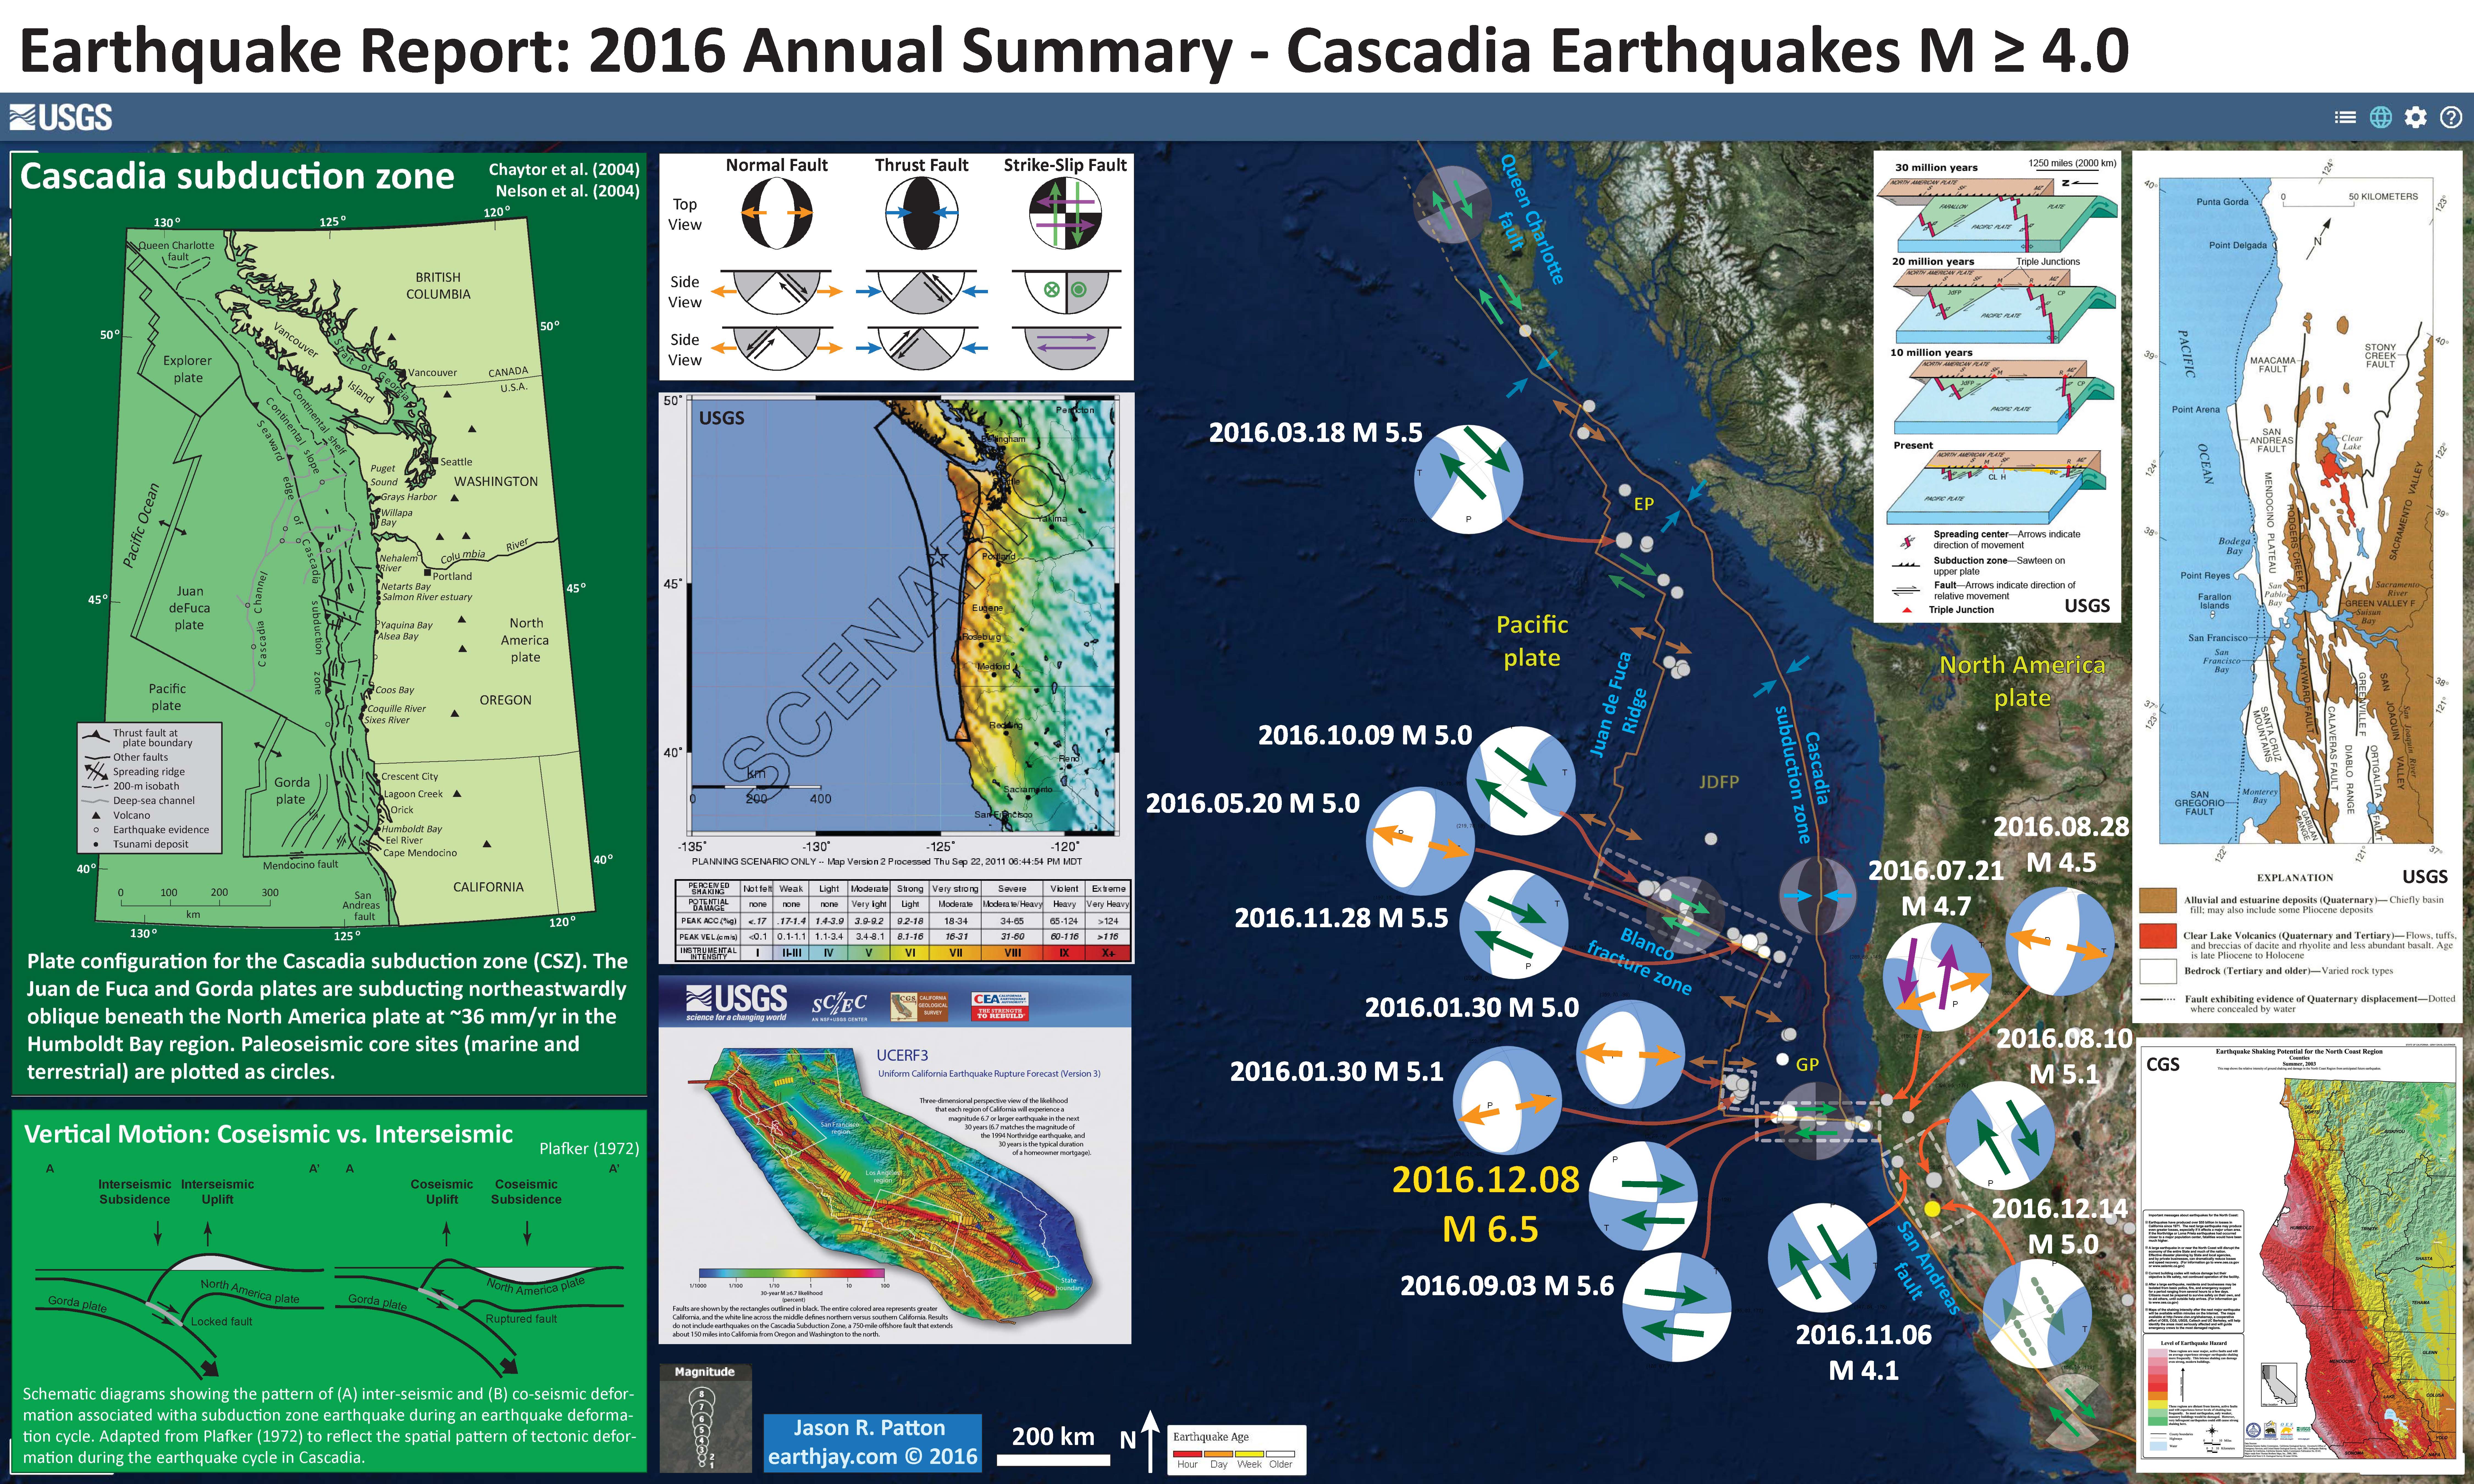
Earthquake Summary Poster (2016)
- Here is the map where I show the epicenters as circles with colors designating the age. I also plot the USGS moment tensors for each earthquake, with arrows showing the sense of motion for each earthquake.
- I placed a moment tensor / focal mechanism legend in the lower left corner of the map. There is more material from the USGS web sites about moment tensors and focal mechanisms (the beach ball symbols). Both moment tensors and focal mechanisms are solutions to seismologic data that reveal two possible interpretations for fault orientation and sense of motion. One must use other information, like the regional tectonics, to interpret which of the two possibilities is more likely.
- In some cases, I am able to interpret the sense of motion for strike-slip earthquakes. In other cases, I do not know enough to be able to make this interpretation (so I plot both solutions).
- In the upper left corner is a map of the Cascadia subduction zone (CSZ) and regional tectonic plate boundary faults. This is modified from several sources (Chaytor et al., 2004; Nelson et al., 2004)
- Below the CSZ map is an illustration modified from Plafker (1972). This figure shows how a subduction zone deforms between (interseismic) and during (coseismic) earthquakes. Today’s earthquake did not occur along the CSZ, so did not produce crustal deformation like this. However, it is useful to know this when studying the CSZ.
- To the lower right of the Cascadia map and cross section is a map showing the latest version of the Uniform California Earthquake Rupture Forecast (UCERF). Let it be known that this is not really a forecast, and this name was poorly chosen. People cannot forecast earthquakes. However, it is still useful. The faults are colored vs. their likelihood of rupturing. More can be found about UCERF here. Note that the San Andreas fault, and her two sister faults (Maacama and Bartlett Springs), are orange-red.
- To the upper right of the Cascadia map and cross section is a map showing the shaking intensities based upon the USGS Shakemap model. Earthquake Scenarios describe the expected ground motions and effects of specific hypothetical large earthquakes. The color scale is the same as found on many of my #EarthquakeReport interpretive posters, the Modified Mercalli Intensity Scale (MMI). The latest version of this map is here.
- In the upper right corner I include generalized fault map of northern California from Wallace (1990).
- To the left of the Wallace (1990) map is a figure that shows the evolution of the San Andreas fault system since 30 million years ago (Ma). This is a figure from the USGS here.
- In the lower right corner I include the Earthquake Shaking Potential map from the state of California. This is a probabilistic seismic hazard map, basically a map that shows the likelihood that there will be shaking of a given amount over a period of time. More can be found from the California Geological Survey here. I place a yellow star in the approximate location of today’s earthquake.
I include some inset figures in the poster.
- Cascadia’s 315th Anniversary 2015.01.26
- Cascadia’s 316th Anniversary 2016.01.26
- Earthquake Information about the CSZ 2015.10.08
Cascadia subduction zone: General Overview
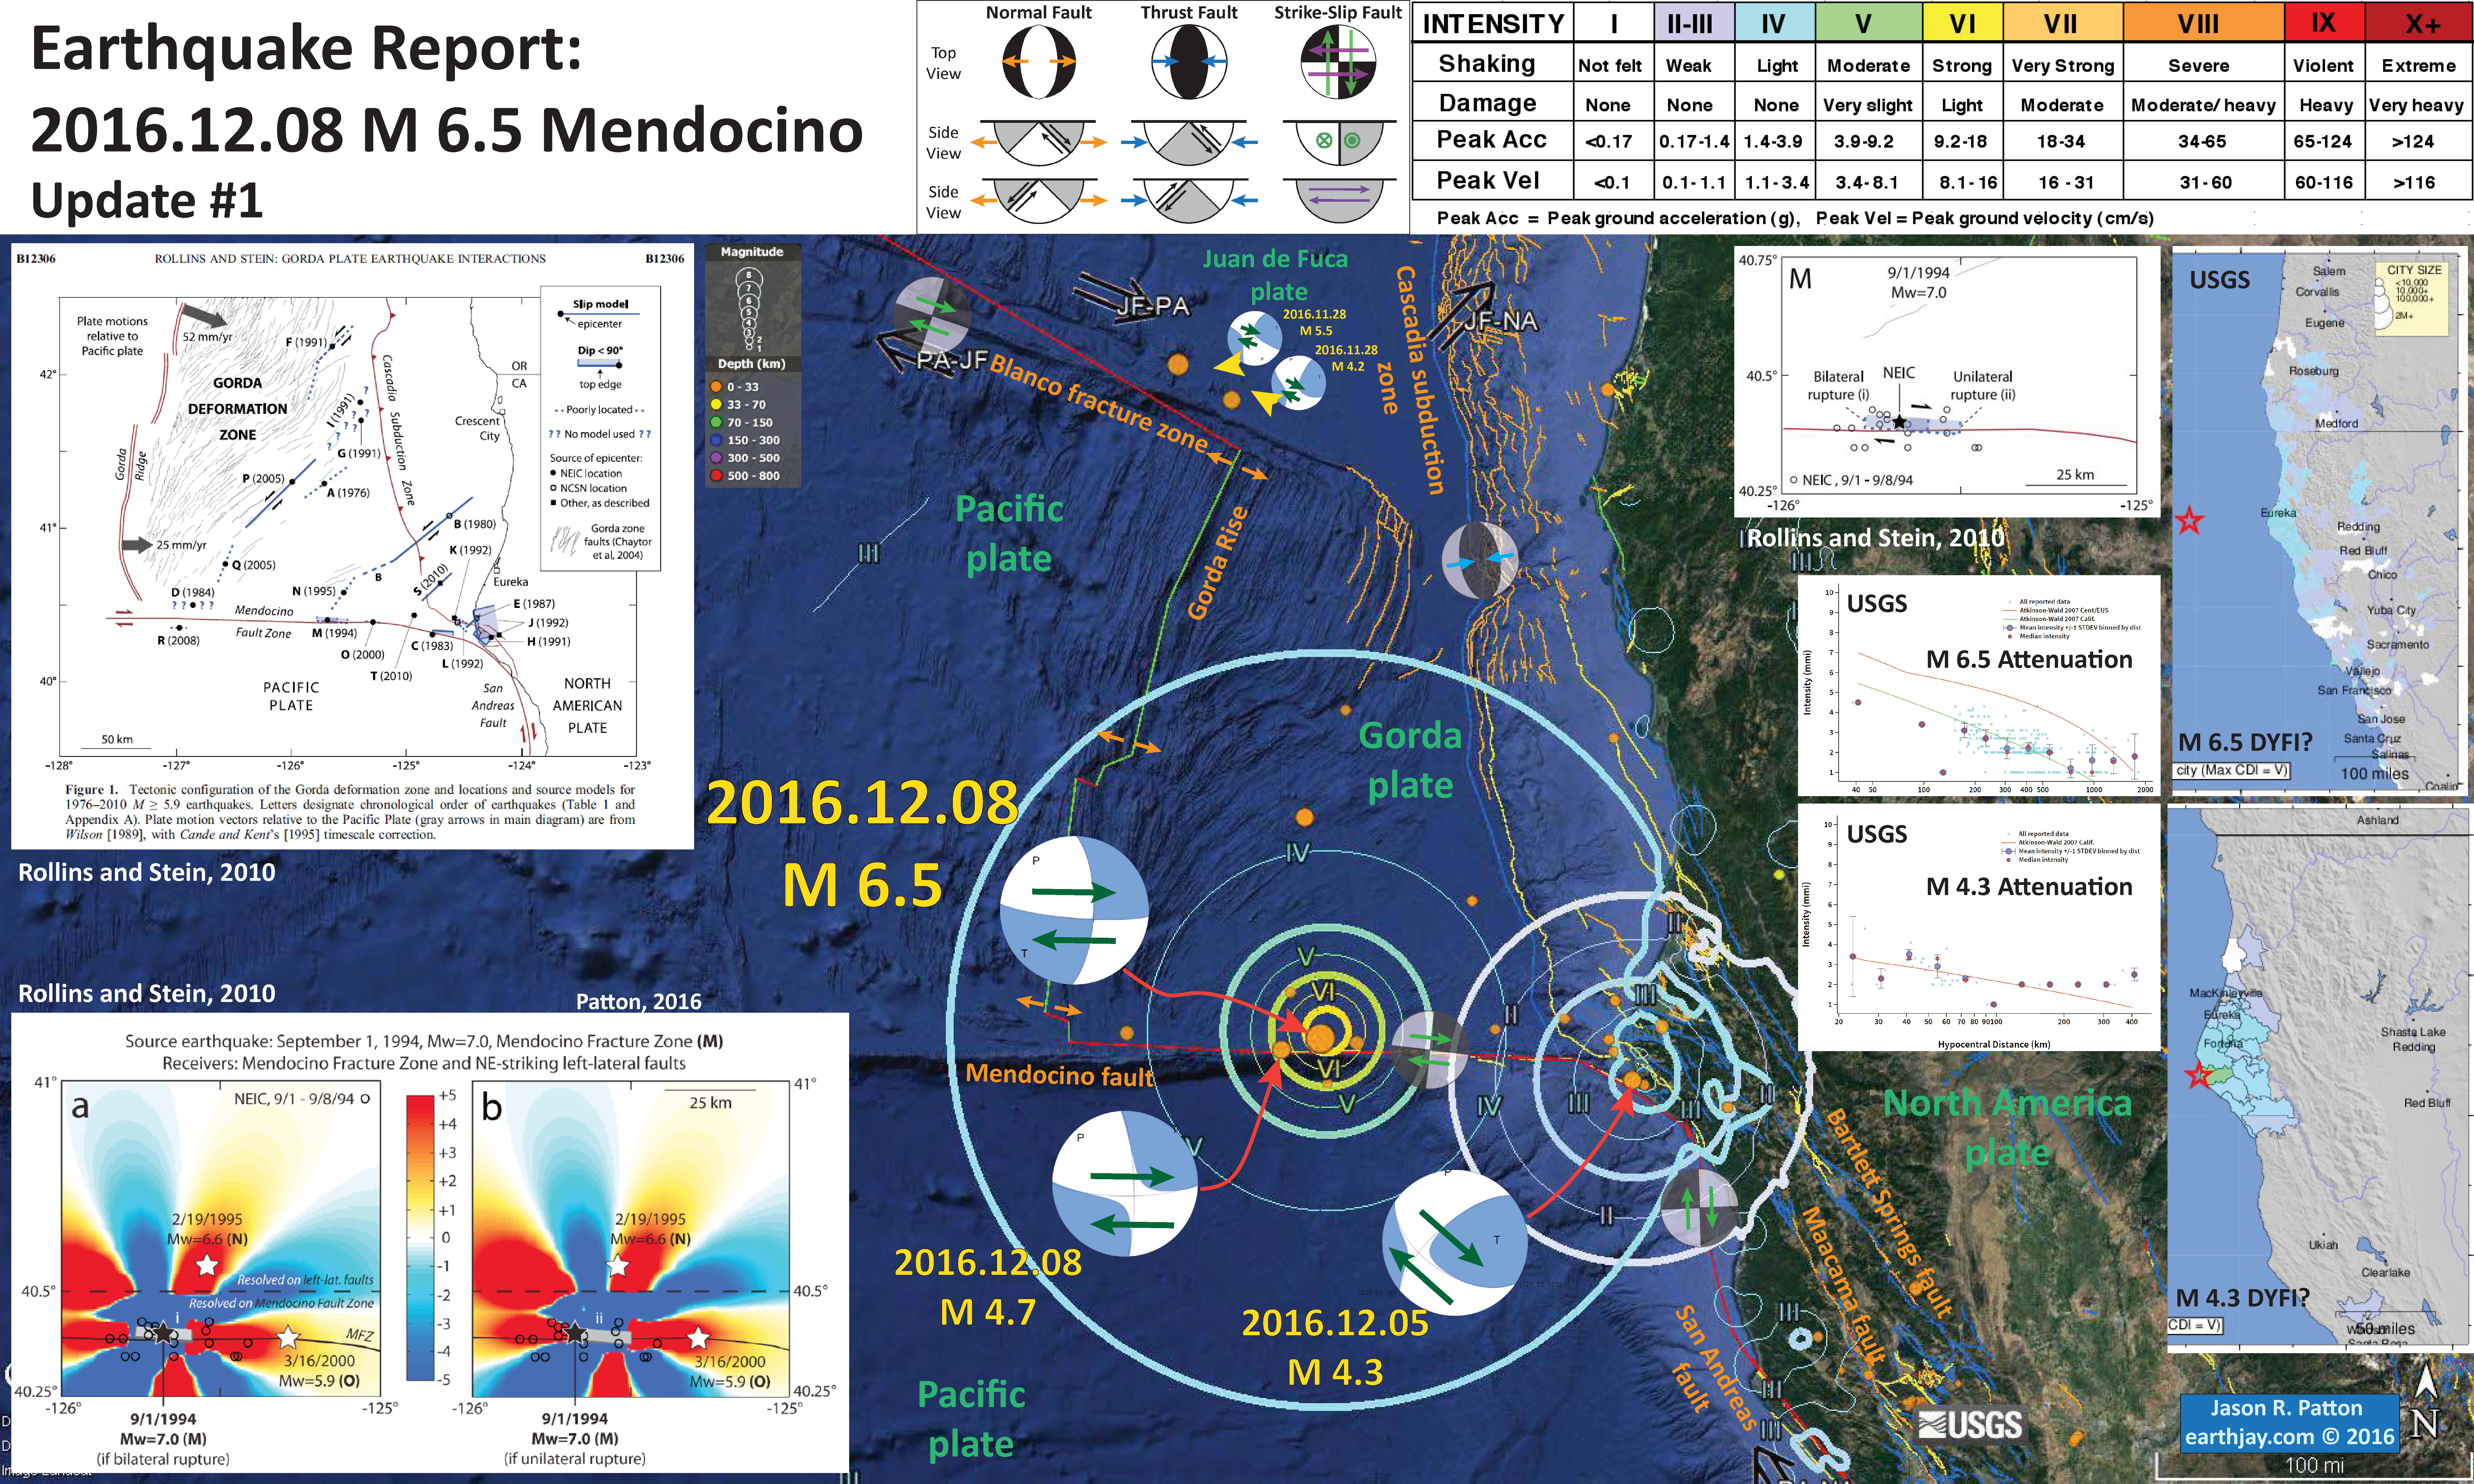
The big player this year was an M 6.5 along the Mendocino fault on 2016.12.08. Here I present an inventory of 8 earthquakes with M ≥ 5.0. There are a few additional earthquakes with smaller magnitudes that are of particular interest.
Please visit the #EarthquakeReport pages for more information about the figures that I include in the Earthquake Report interpretive posters below.
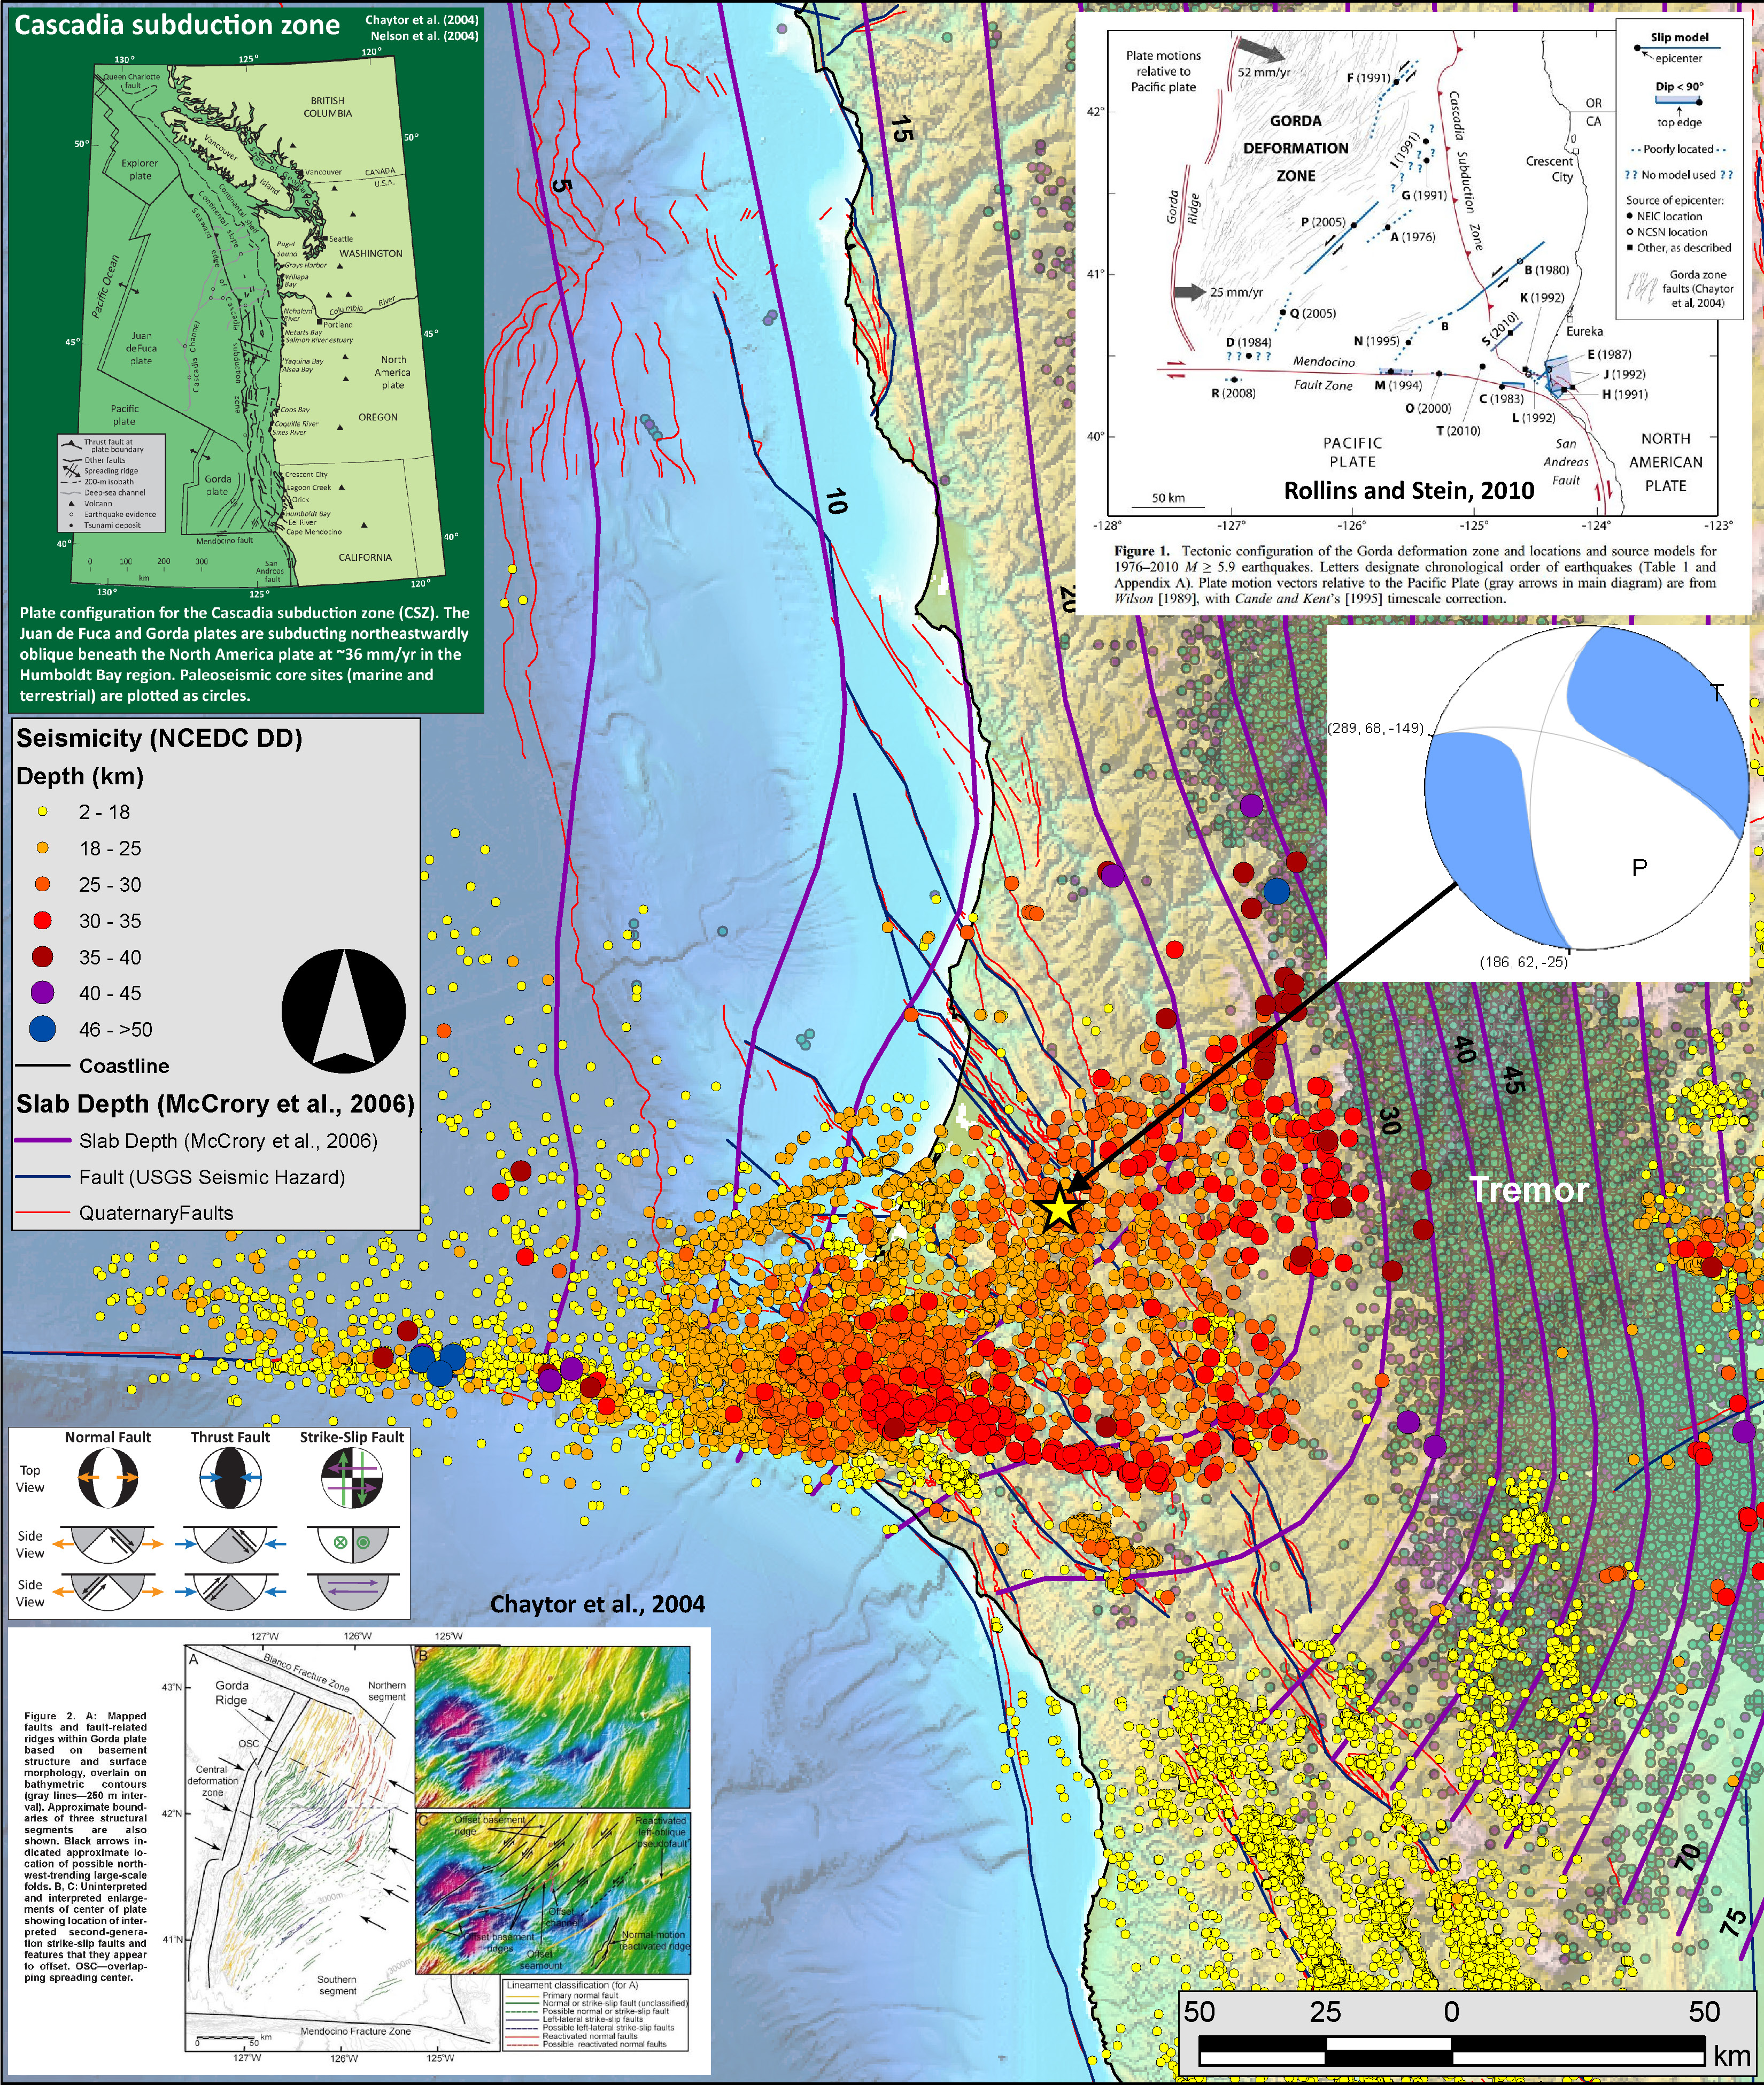
- 2016.01.30 M 5.1 Gorda Rise (USGS).
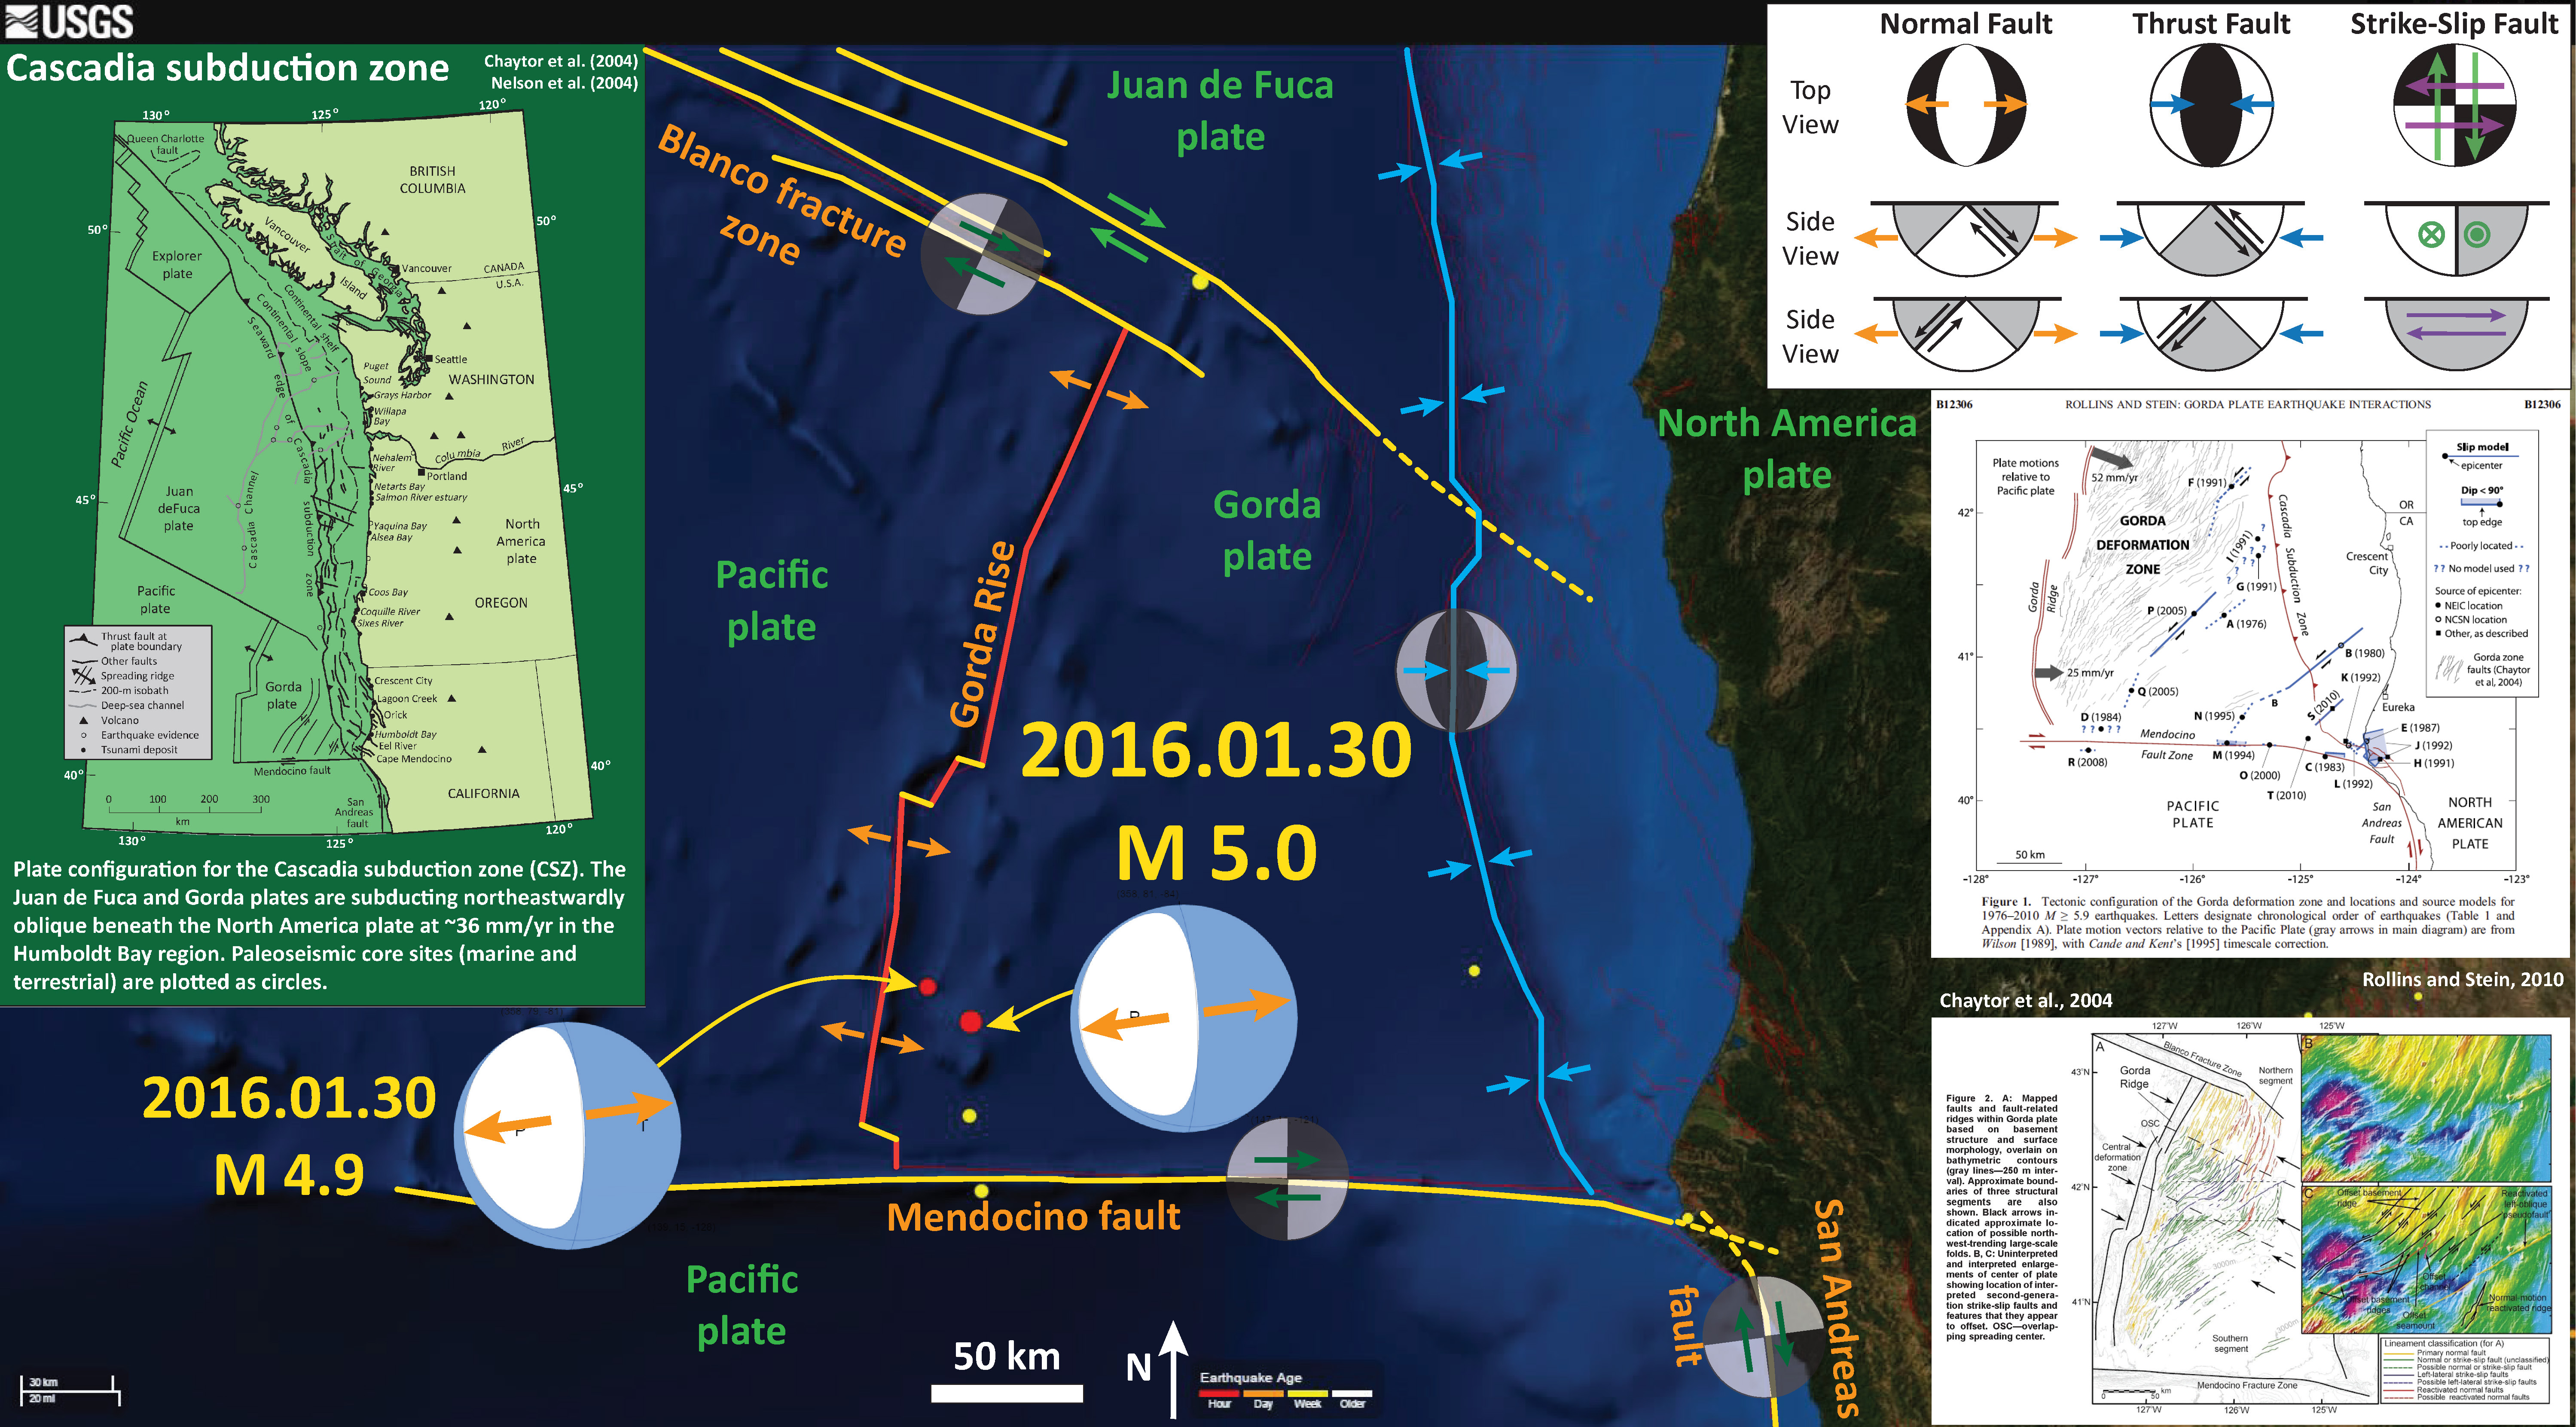
- 2016.01.30 M 5.0 Gorda Rise (USGS) and my Earthquake Report.
- The below map includes both the M 5.1 and M 5.0 earthquakes listed above, though on my poster they are labeled M 4.9 and M 5.0 respectively.
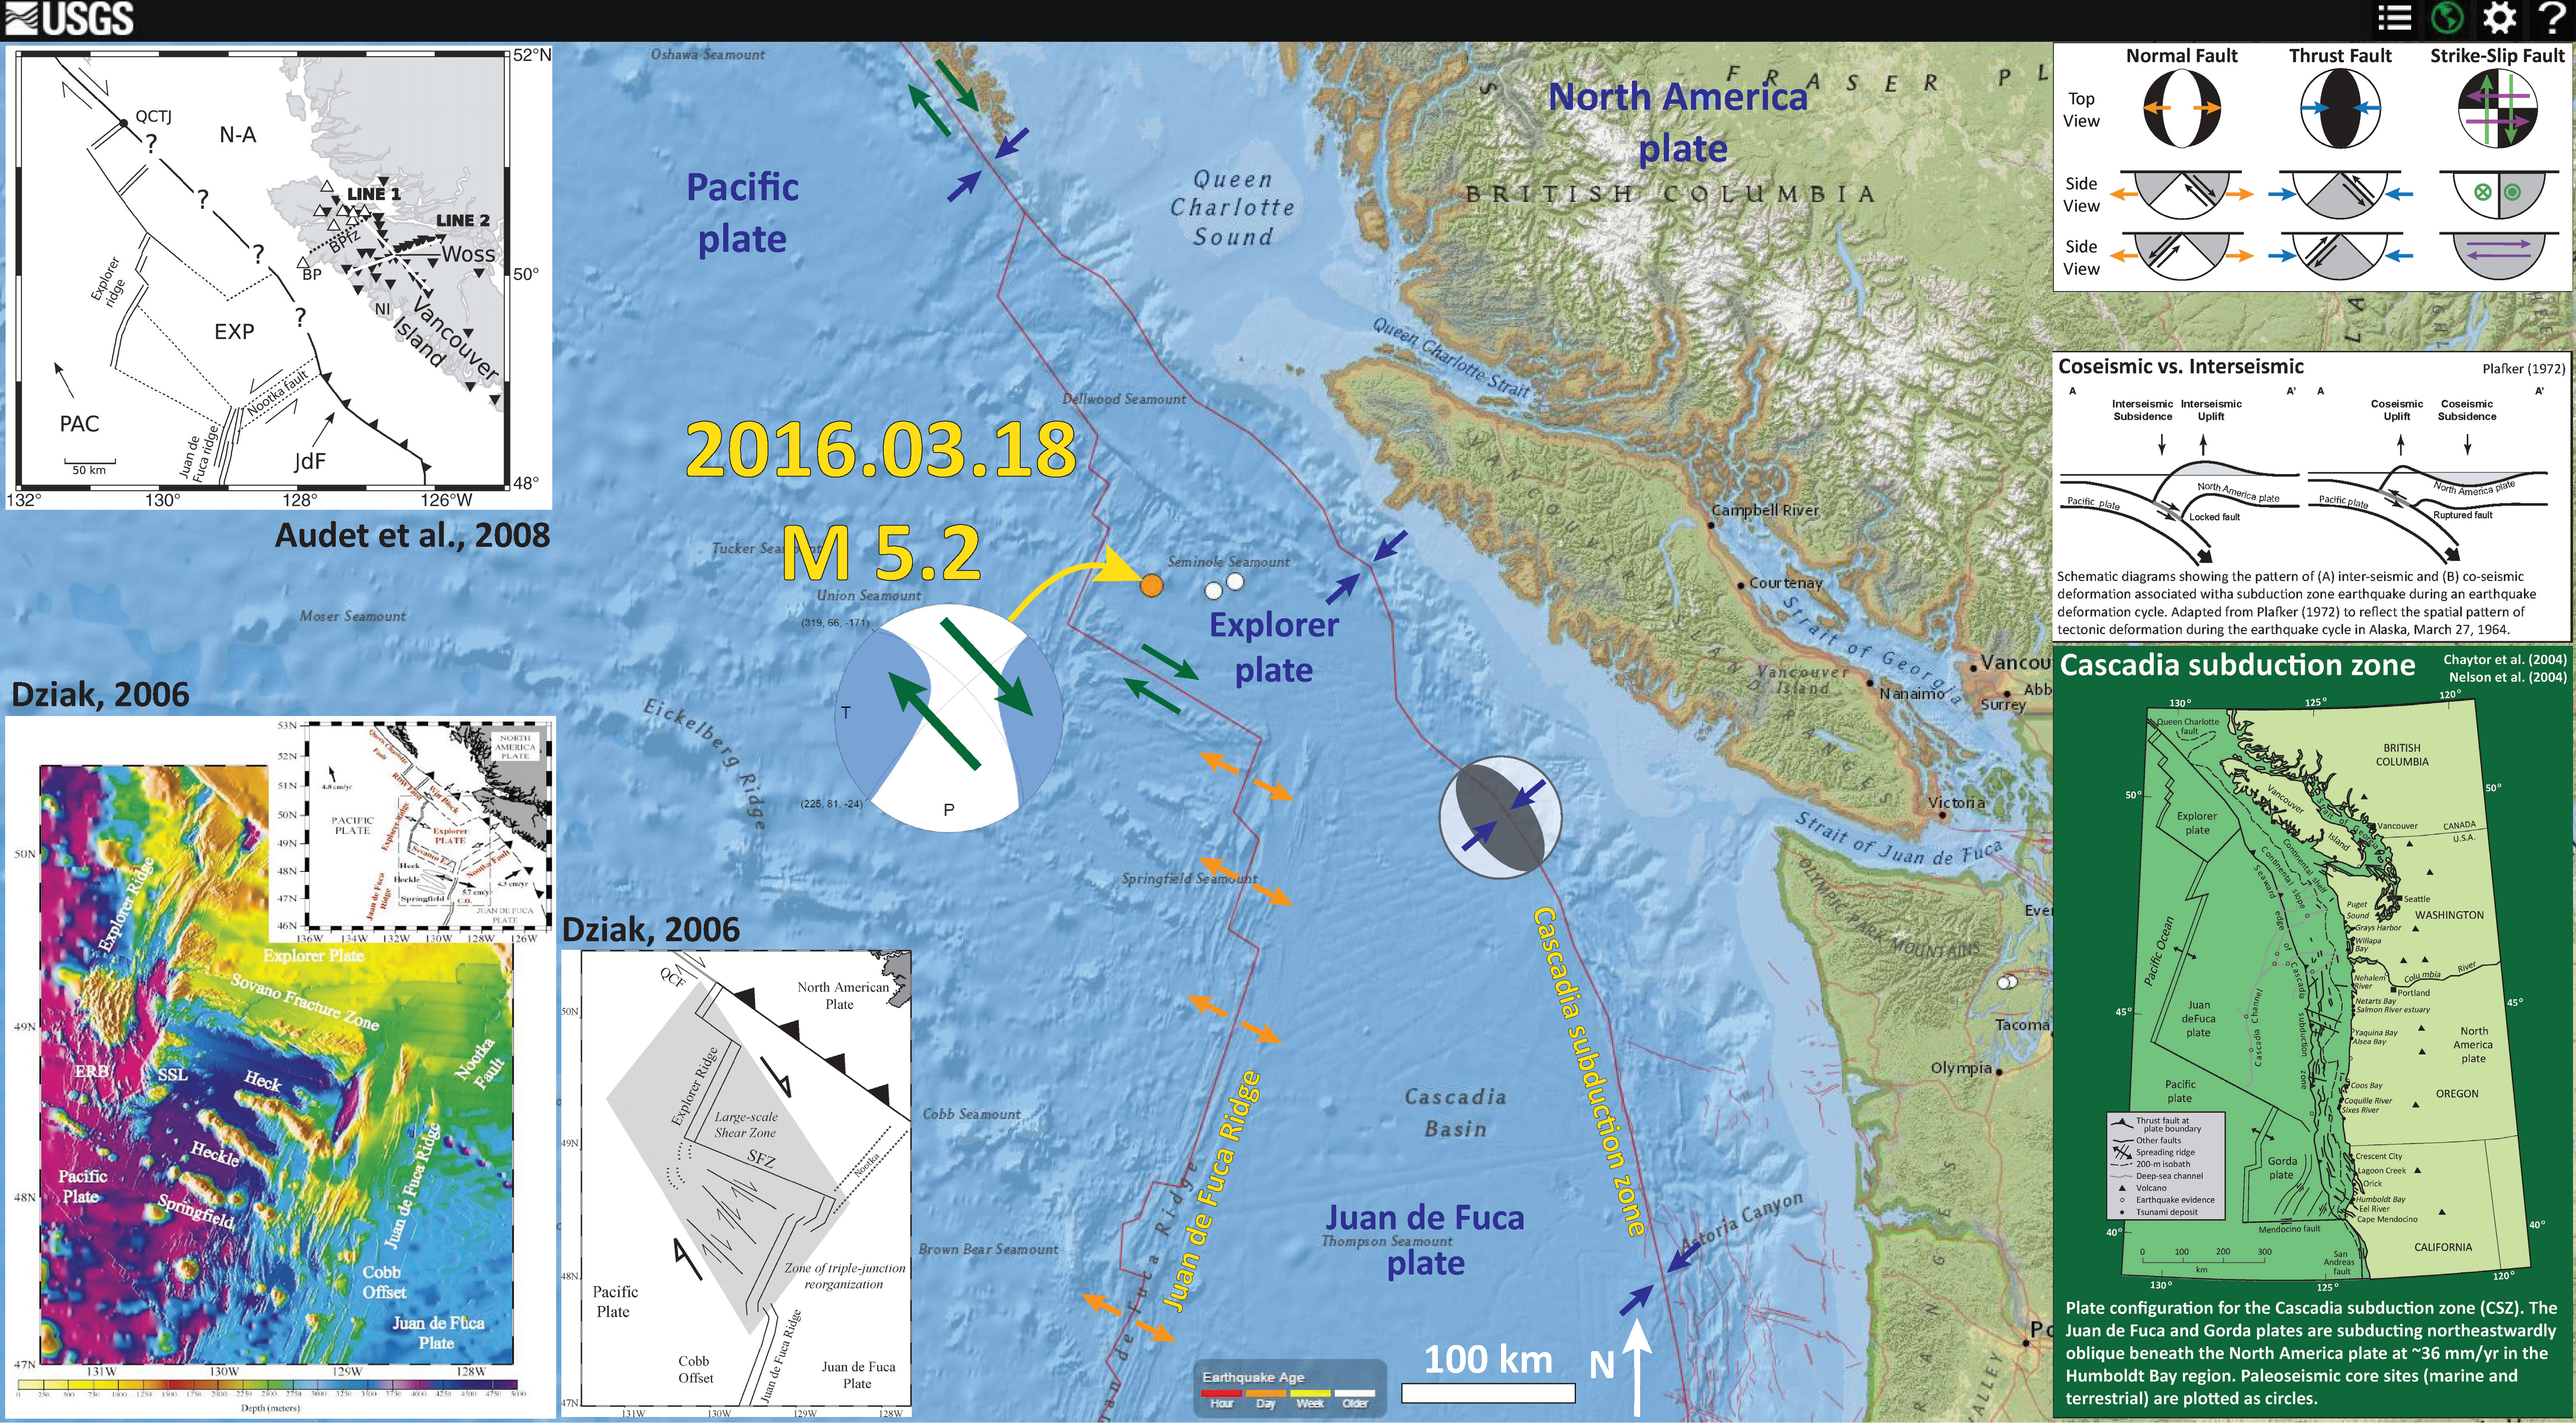
- 2016.03.18 M 5.2 Explorer plate (USGS) and my Earthquake Report.
- 2016.05.20 M 5.0 Blanco fracture zone (USGS).
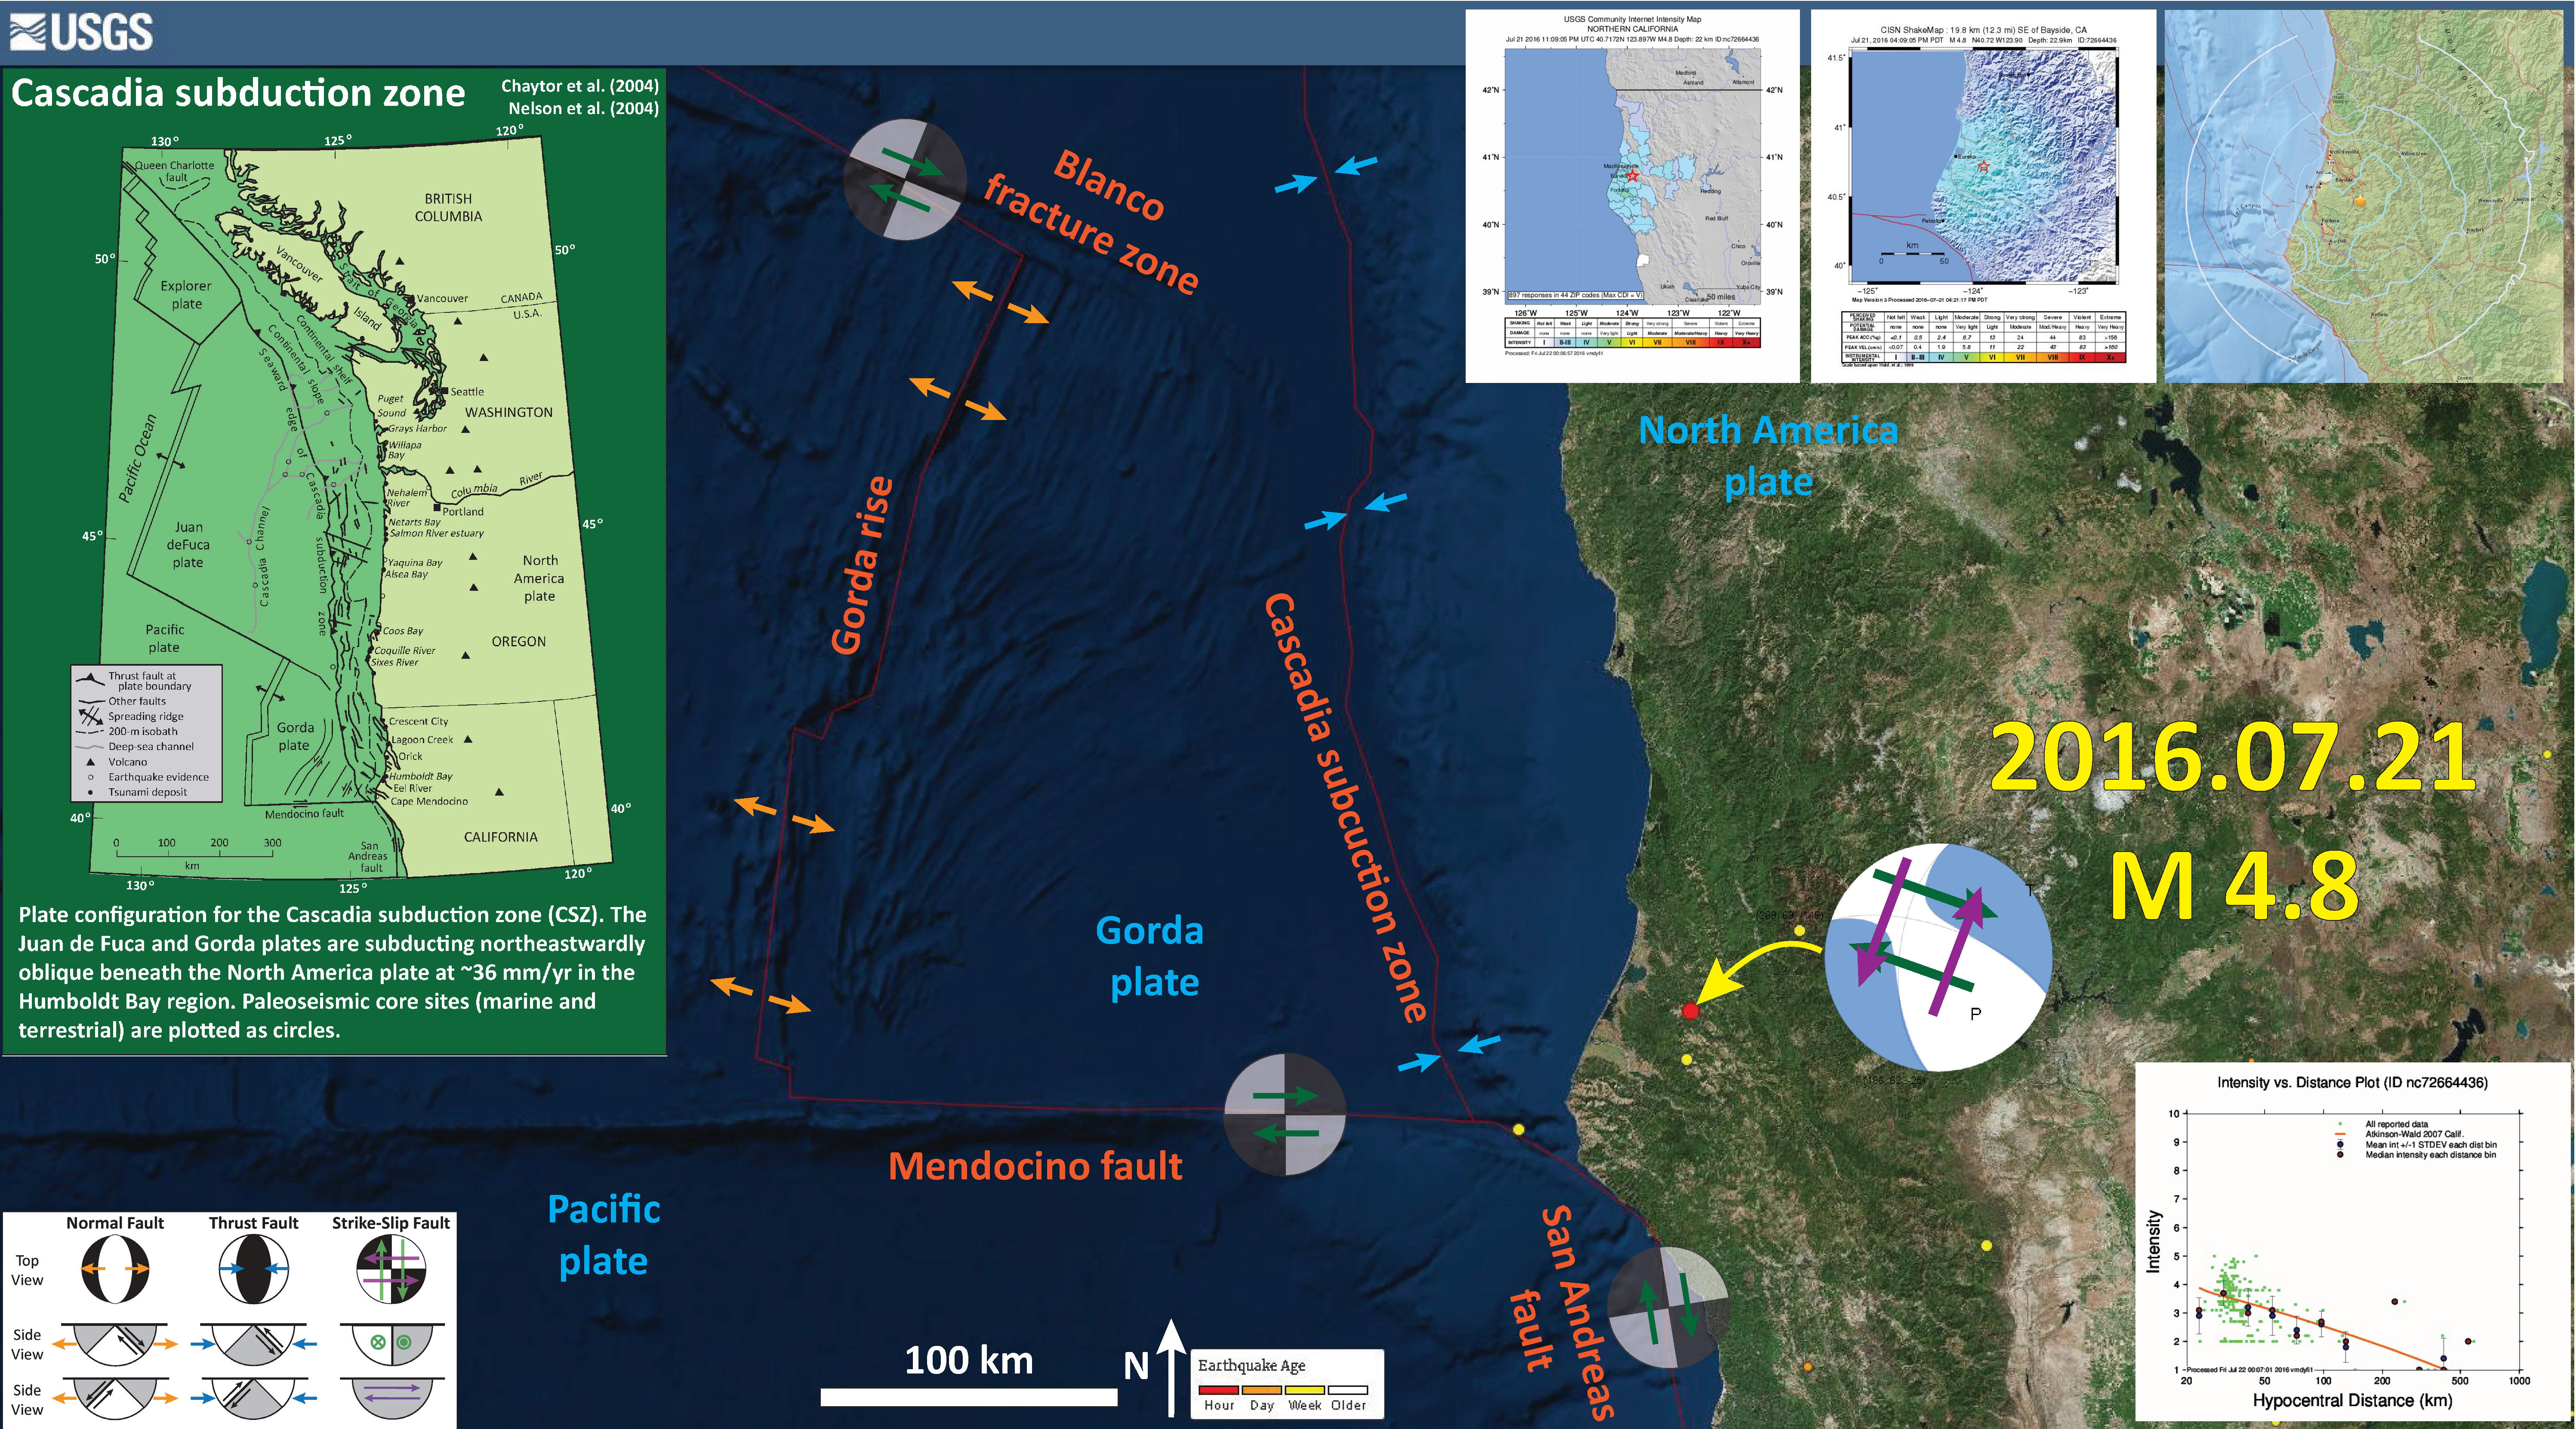
- 2016.07.21 M 4.7 Bayside, California (USGS) and my first Earthquake Report and Update #1. The second map below has lots of additional material plotted that is explained on the Update #1 page.
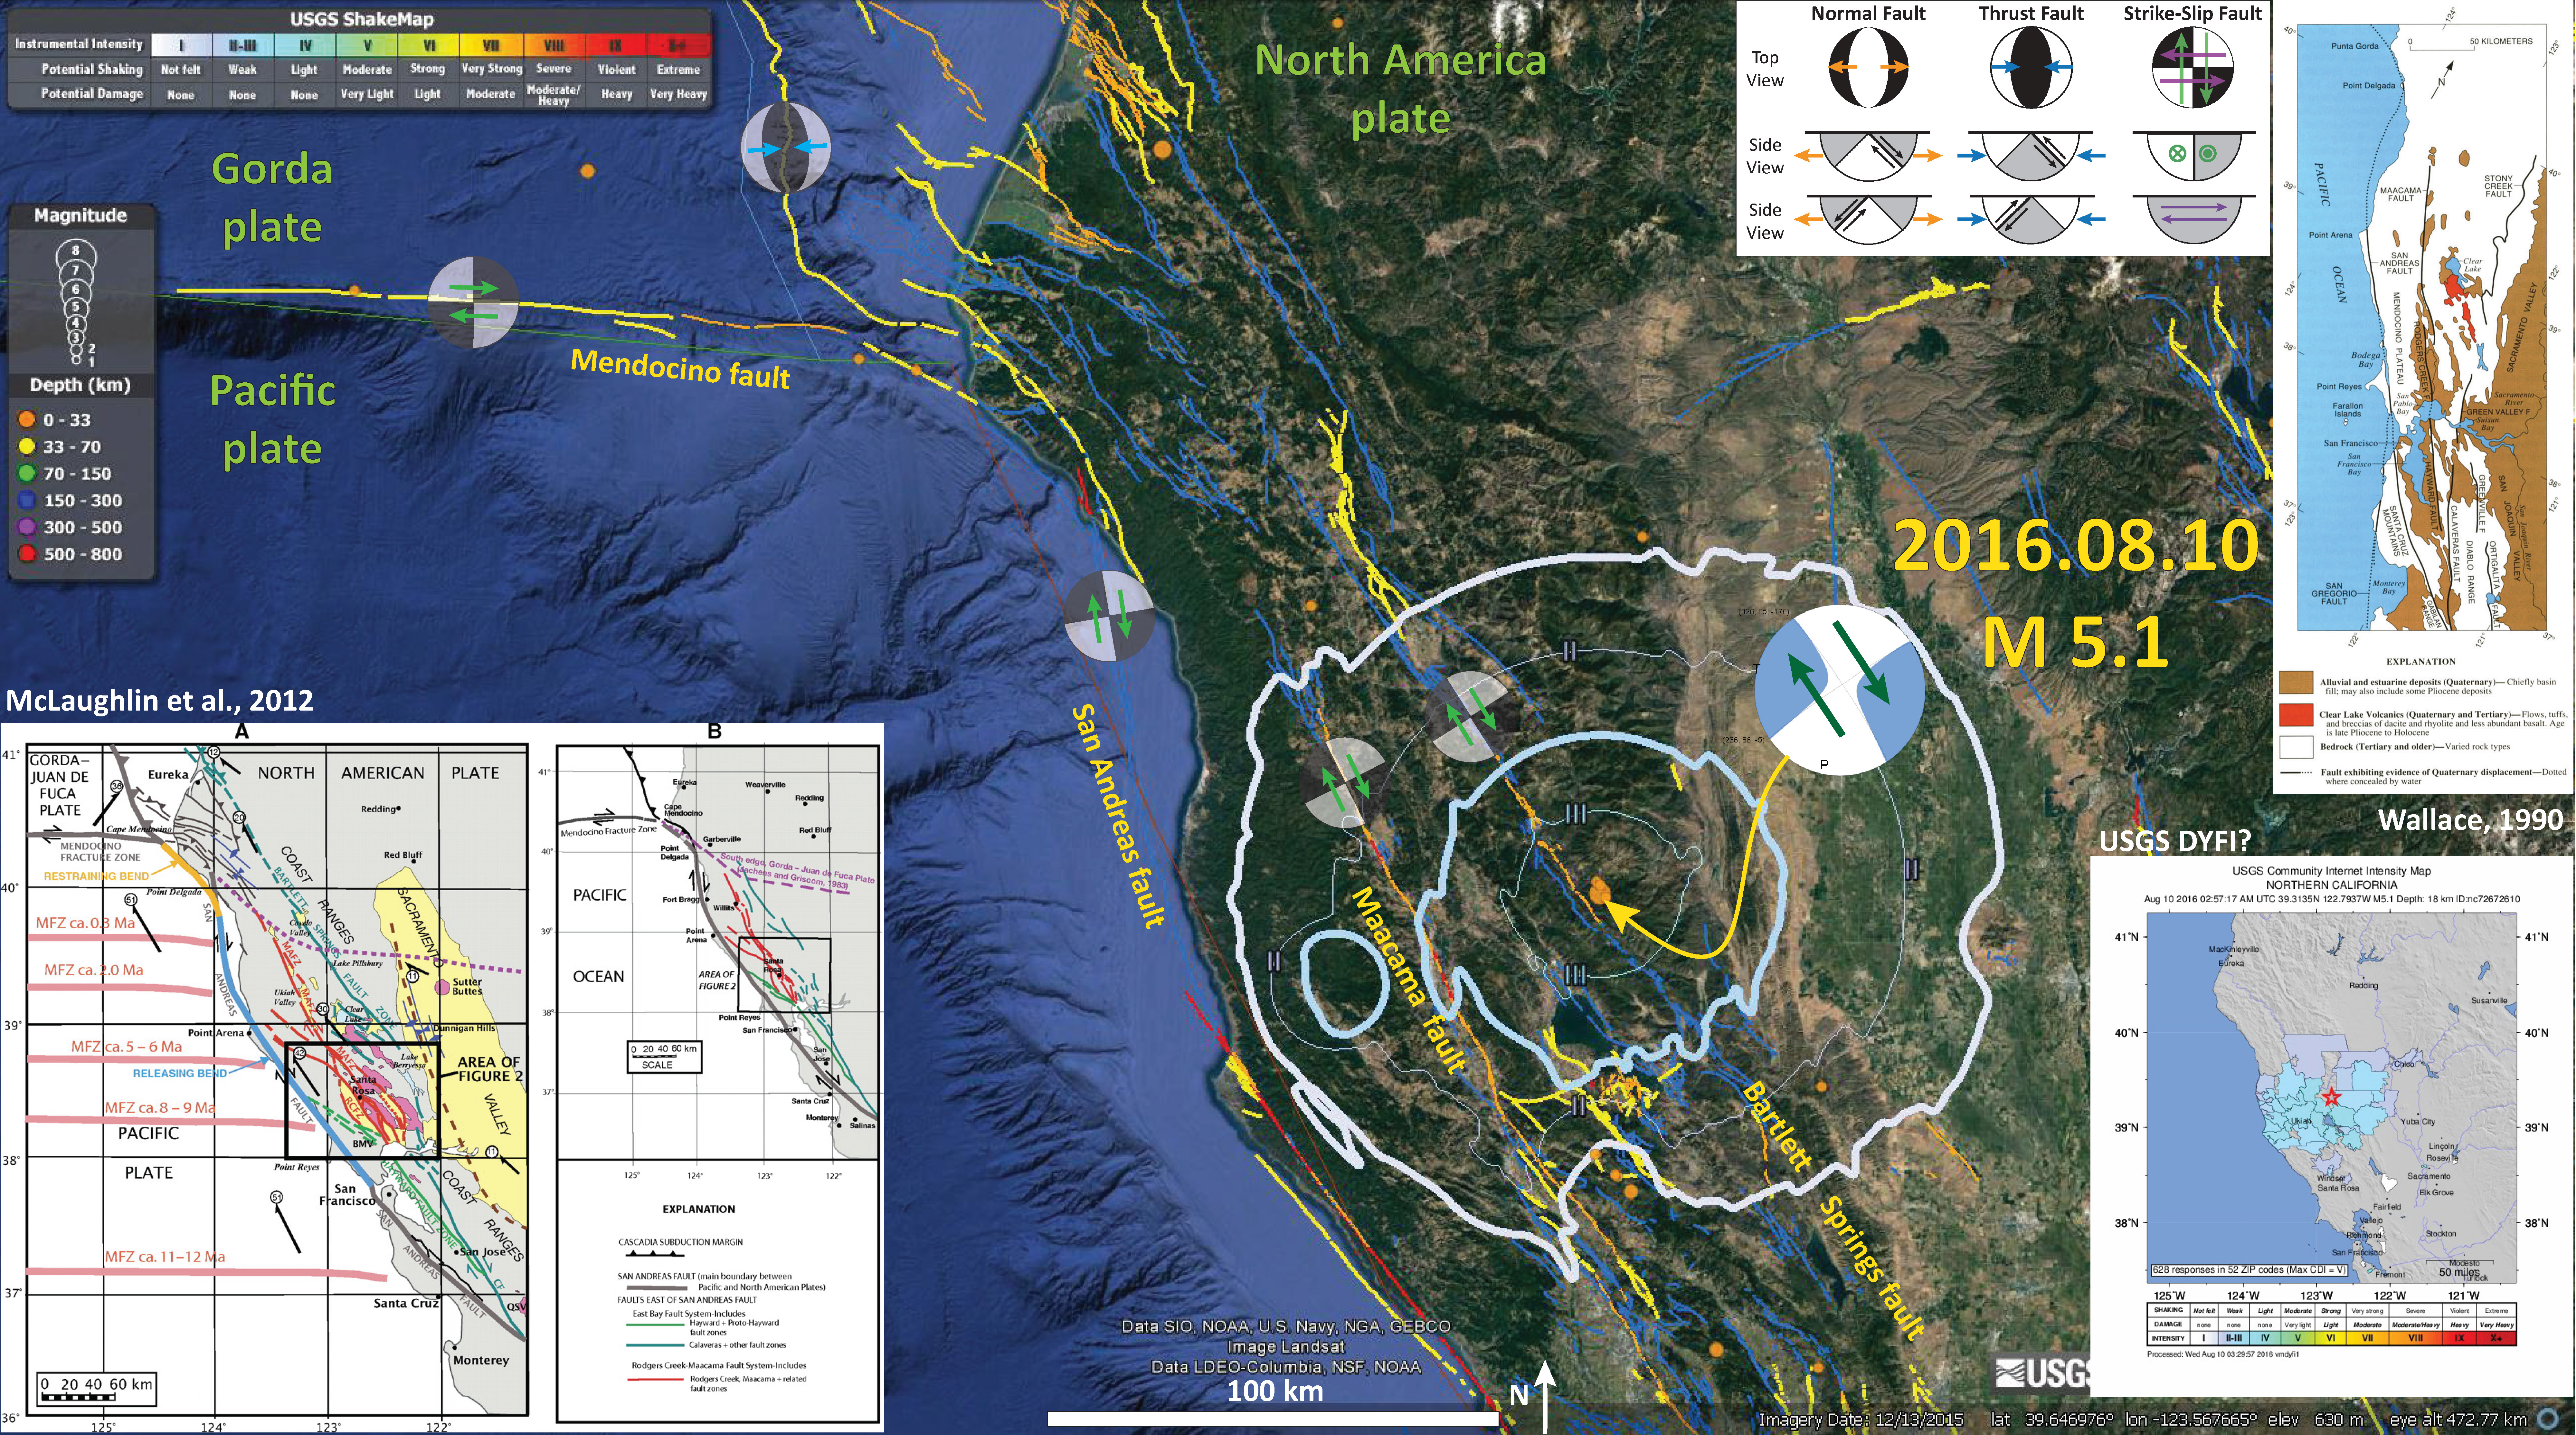
- 2016.08.10 M 5.1 Upper Lake (USGS) and my Earthquake Report.
- 2016.08.28 M 4.5 Hayfork, California (USGS).
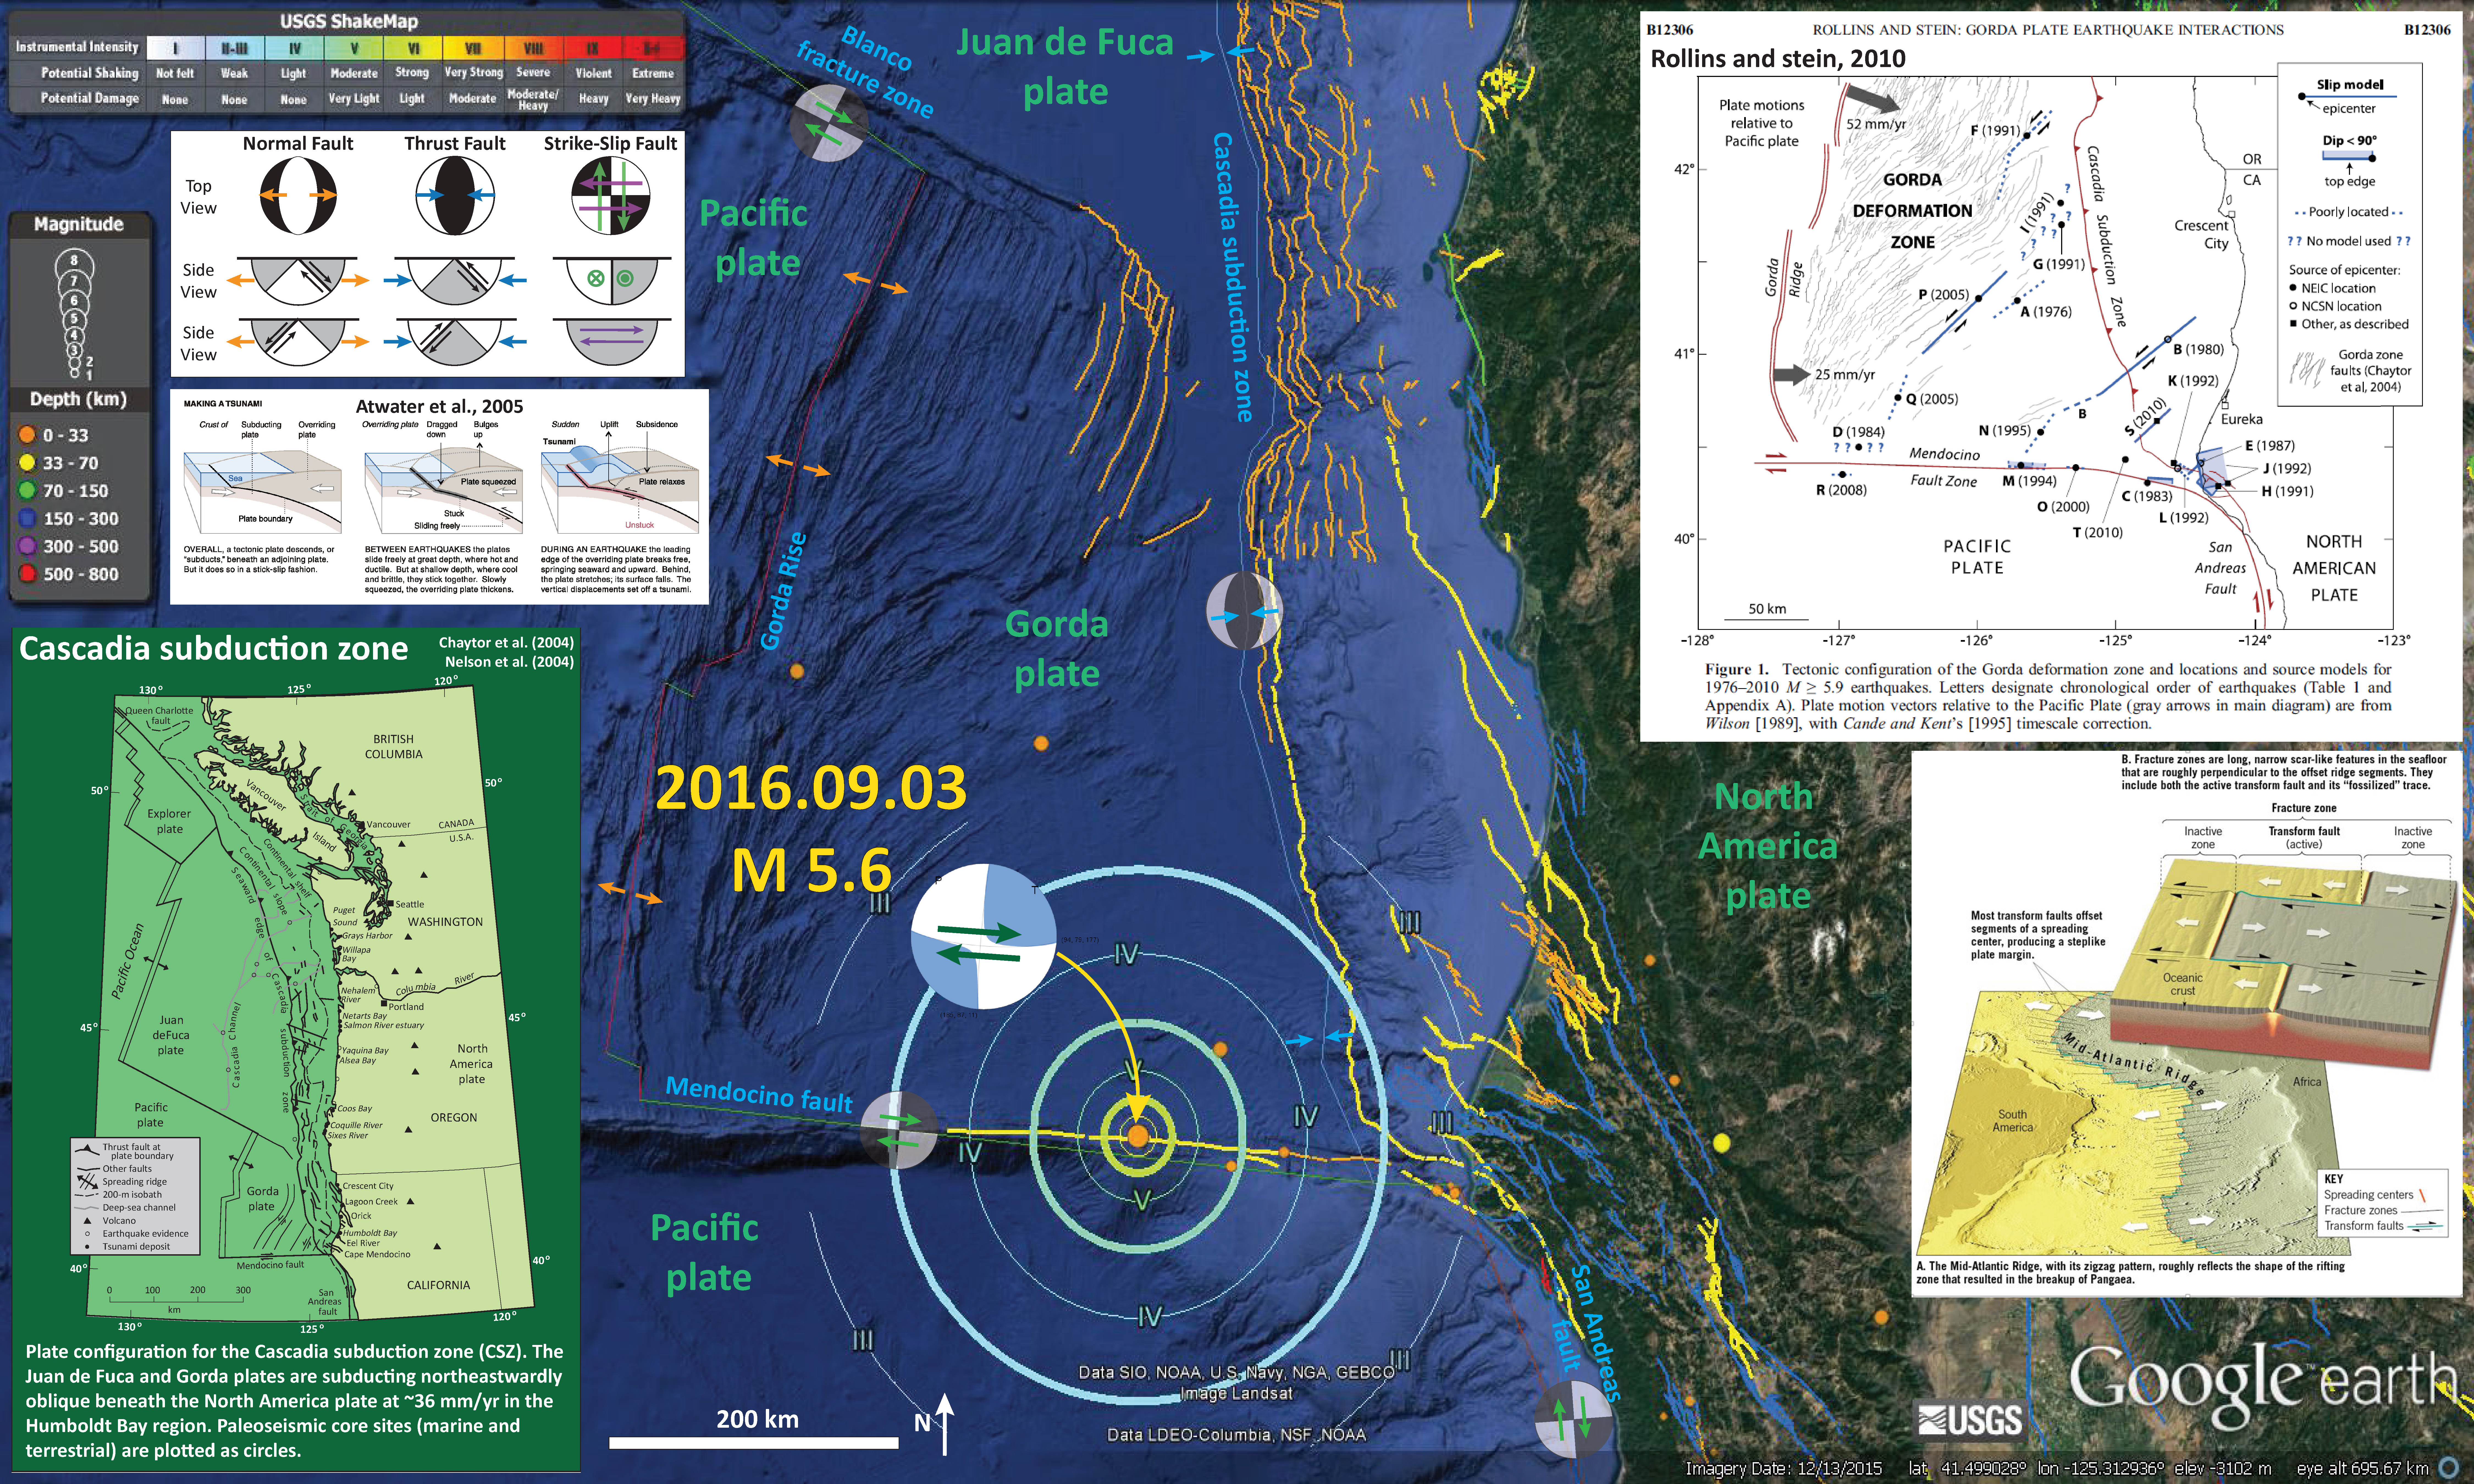
- 2016.09.03 M 5.6 Mendocino fault (USGS) and my Earthquake Report.
- 2016.10.09 M 5.0 Blanco fracture zone (USGS)
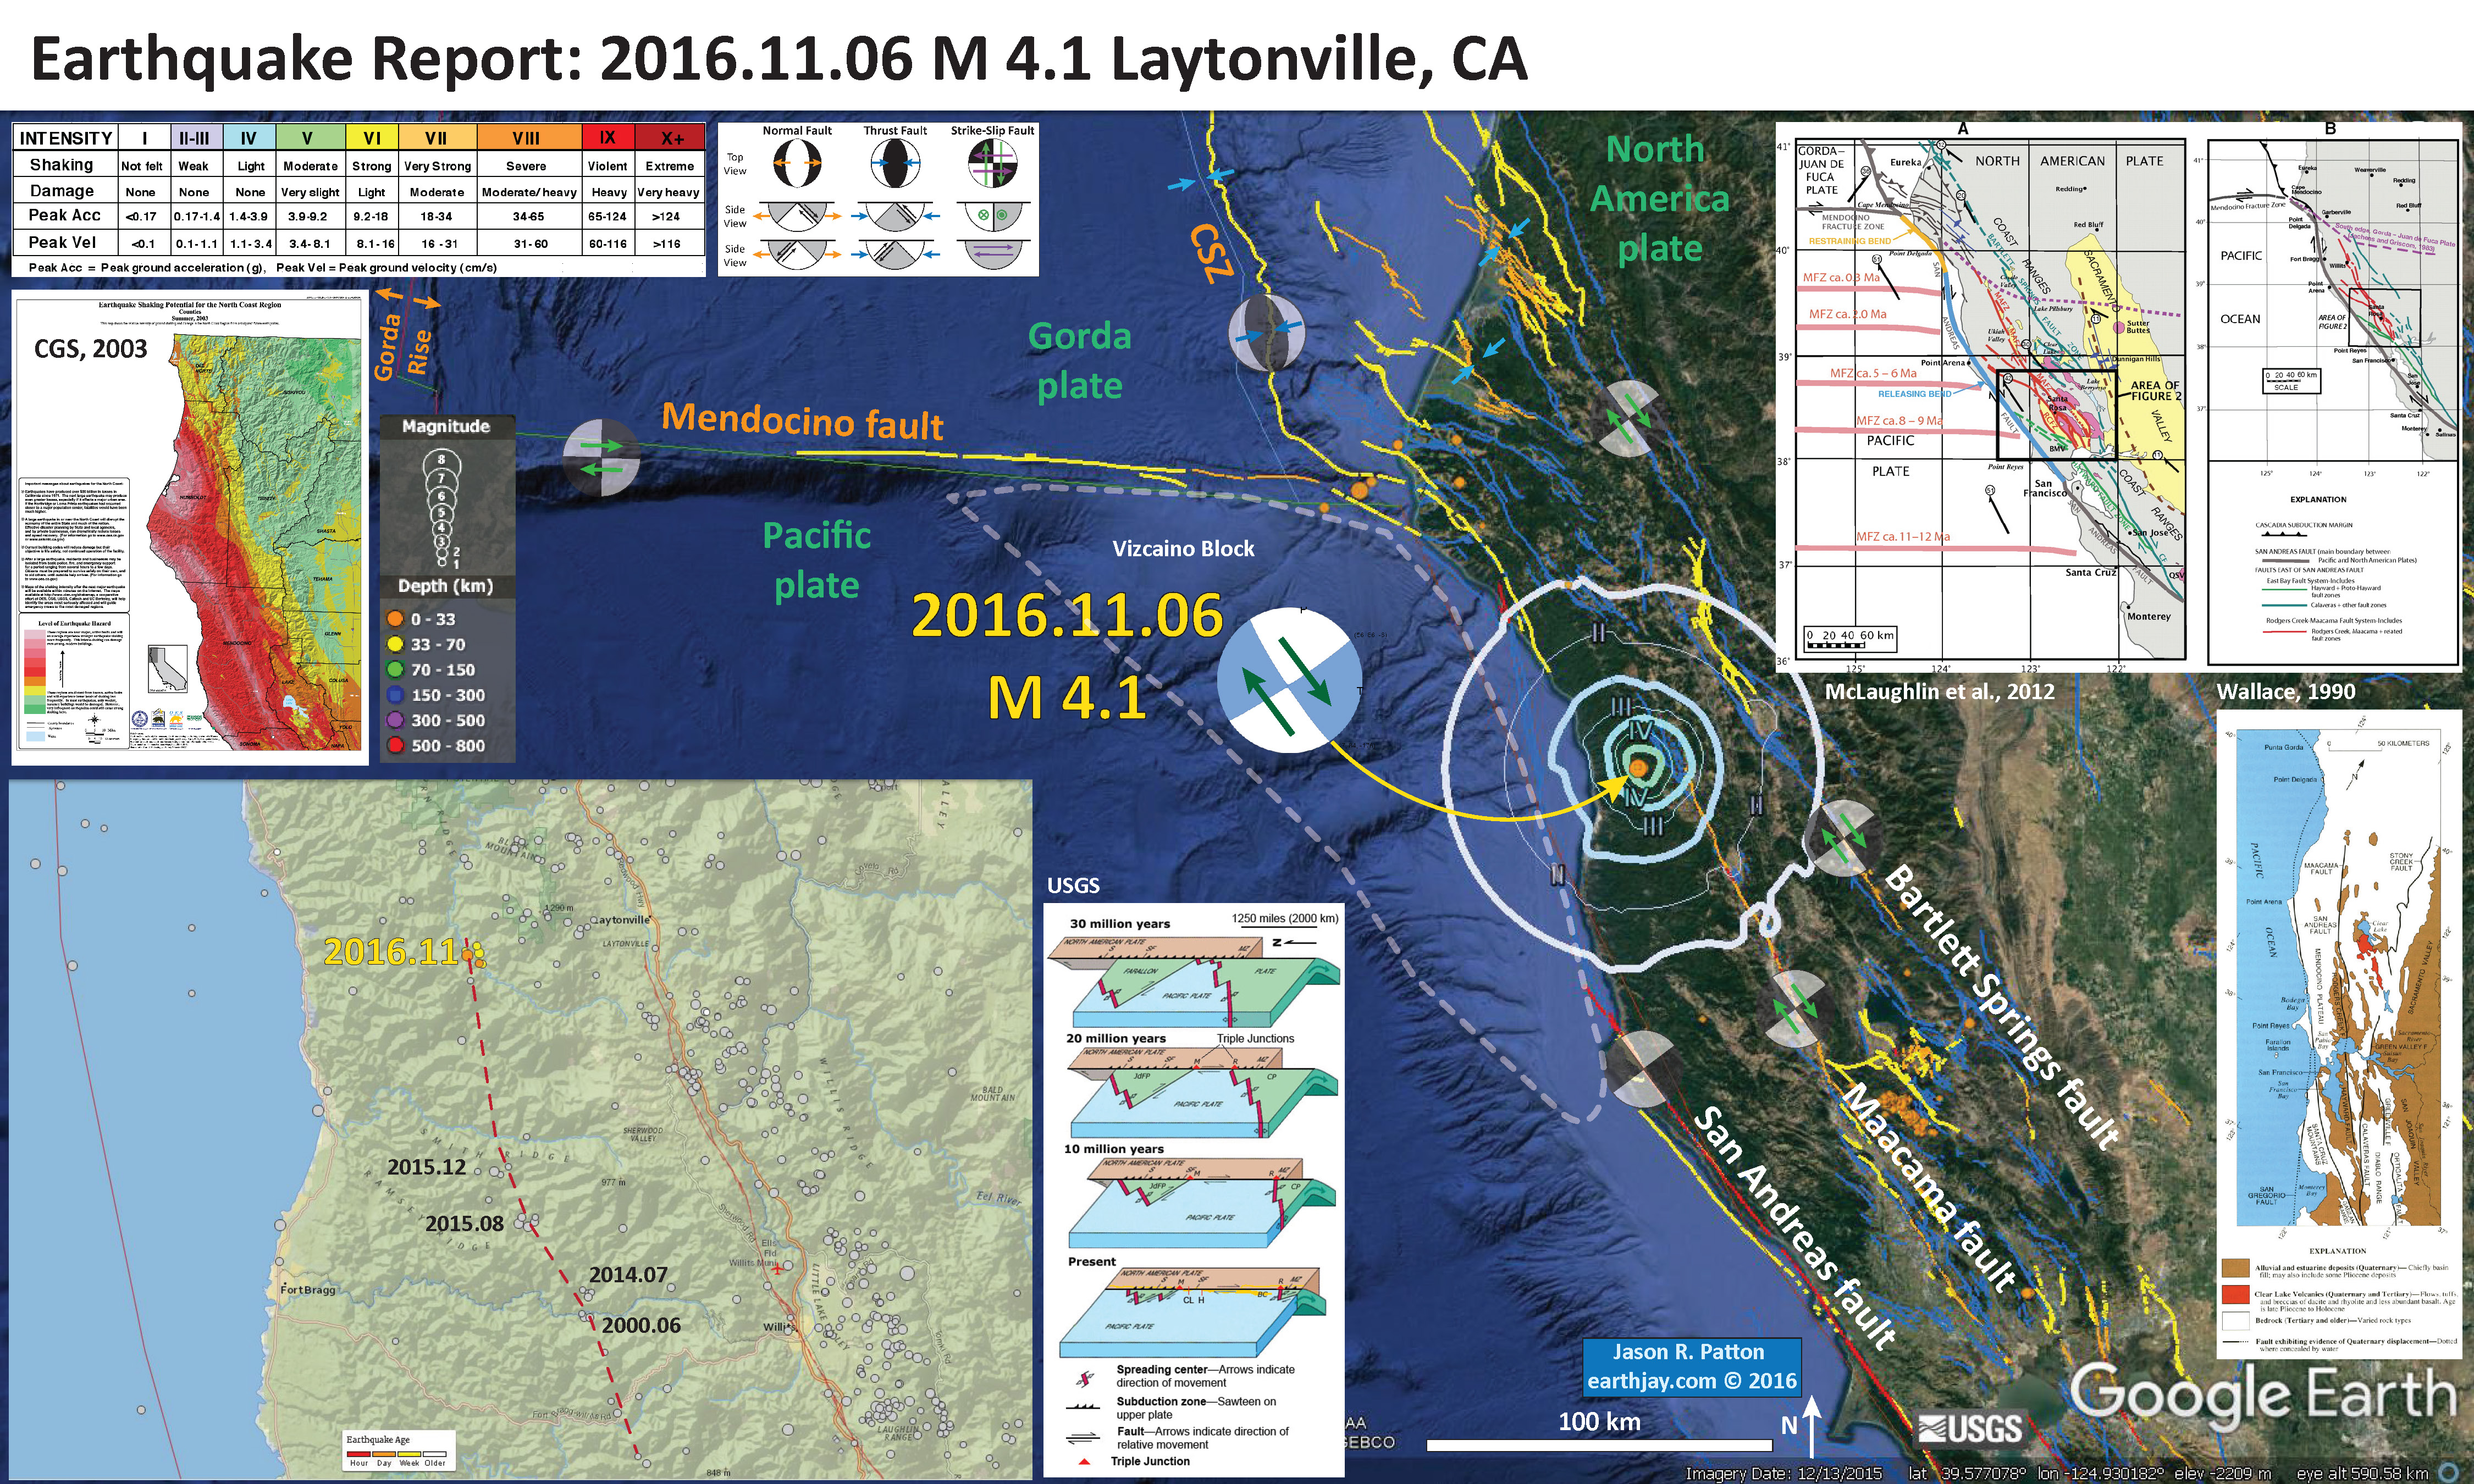
- 2016.11.06 M 4.1 Laytonville, California (USGS) and my Earthquake Report.
- 2016.11.28 M 5.5 Blanco fracture zone (USGS).
- 2016.12.08 M 6.5 Mendocino fault (USGS) and my Earthquake Report and my Update #1. The upper figure is my initial #EarthquakeReport interpretive poster and the lower figure is my updated poster.
- 2016.12.14 M 5.0 The Geysers, California (USGS).
Here are the web pages for these earthquakes. The first link goes to the USGS page and the second link goes to the Earthquake Report page.
- Cascadia’s 316th Anniversary 2016.01.26
- 2016.09.25 M 5.0 Gorda plate
- 2016.09.25 M 5.0 Gorda plate
- 2016.07.21 M 4.7 Gorda plate p-1
- 2016.07.21 M 4.7 Gorda plate p-2
- 2016.01.30 M 5.0 Gorda plate
- 2016.12.08 M 6.5 Mendocino fault, CA
- 2016.12.08 M 6.5 Mendocino fault, CA Update #1
- 2016.12.05 M 4.3 Petrolia CA
- 2016.10.27 M 4.1 Mendocino fault
- 2016.09.03 M 5.6 Mendocino
- 2016.01.02 M 4.5 Mendocino fault
- 2016.11.02 M 3.6 Oregon
- 2016.03.19 M 5.2 Explorer plate
Cascadia subduction zone:
General Overview
2016 Earthquake Reports
Gorda plate
Mendocino fault
North America plate
Explorer plate
- Atwater, B.F., Musumi-Rokkaku, S., Satake, K., Tsuju, Y., Eueda, K., and Yamaguchi, D.K., 2005. The Orphan Tsunami of 1700—Japanese Clues to a Parent Earthquake in North America, USGS Professional Paper 1707, USGS, Reston, VA, 144 pp.
- Chaytor, J.D., Goldfinger, C., Dziak, R.P., and Fox, C.G., 2004. Active deformation of the Gorda plate: Constraining deformation models with new geophysical data: Geology v. 32, p. 353-356.
- Dengler, L.A., Moley, K.M., McPherson, R.C., Pasyanos, M., Dewey, J.W., and Murray, M., 1995. The September 1, 1994 Mendocino Fault Earthquake, California Geology, Marc/April 1995, p. 43-53.
- Geist, E.L. and Andrews D.J., 2000. Slip rates on San Francisco Bay area faults from anelastic deformation of the continental lithosphere, Journal of Geophysical Research, v. 105, no. B11, p. 25,543-25,552.
- Irwin, W.P., 1990. Quaternary deformation, in Wallace, R.E. (ed.), 1990, The San Andreas Fault system, California: U.S. Geological Survey Professional Paper 1515, online at: http://pubs.usgs.gov/pp/1990/1515/
- McLaughlin, R.J., Sarna-Wojcicki, A.M., Wagner, D.L., Fleck, R.J., Langenheim, V.E., Jachens, R.C., Clahan, K., and Allen, J.R., 2012. Evolution of the Rodgers Creek–Maacama right-lateral fault system and associated basins east of the northward-migrating Mendocino Triple Junction, northern California in Geosphere, v. 8, no. 2., p. 342-373.
- Nelson, A.R., Asquith, A.C., and Grant, W.C., 2004. Great Earthquakes and Tsunamis of the Past 2000 Years at the Salmon River Estuary, Central Oregon Coast, USA: Bulletin of the Seismological Society of America, Vol. 94, No. 4, pp. 1276–1292
- Rollins, J.C. and Stein, R.S., 2010. Coulomb stress interactions among M ≥ 5.9 earthquakes in the Gorda deformation zone and on the Mendocino Fault Zone, Cascadia subduction zone, and northern San Andreas Fault: Journal of Geophysical Research, v. 115, B12306, doi:10.1029/2009JB007117, 2010.
- Stoffer, P.W., 2006, Where’s the San Andreas Fault? A guidebook to tracing the fault on public lands in the San Francisco Bay region: U.S. Geological Survey General Interest Publication 16, 123 p., online at http://pubs.usgs.gov/gip/2006/16/
- Wallace, Robert E., ed., 1990, The San Andreas fault system, California: U.S. Geological Survey Professional Paper 1515, 283 p. [http://pubs.usgs.gov/pp/1988/1434/].
