We just had an earthquake along strike with the Mendocino fault zone. This region is seismically active and there were a number of MF earthquakes in 2015. Here is the USGS web page for today’s M = 4.5 MF earthquake. Also, there was a M 4.9 earthquake within the Gorda plate a week ago. Here is the USGS web page for that M = 4.9 GP earthquake.
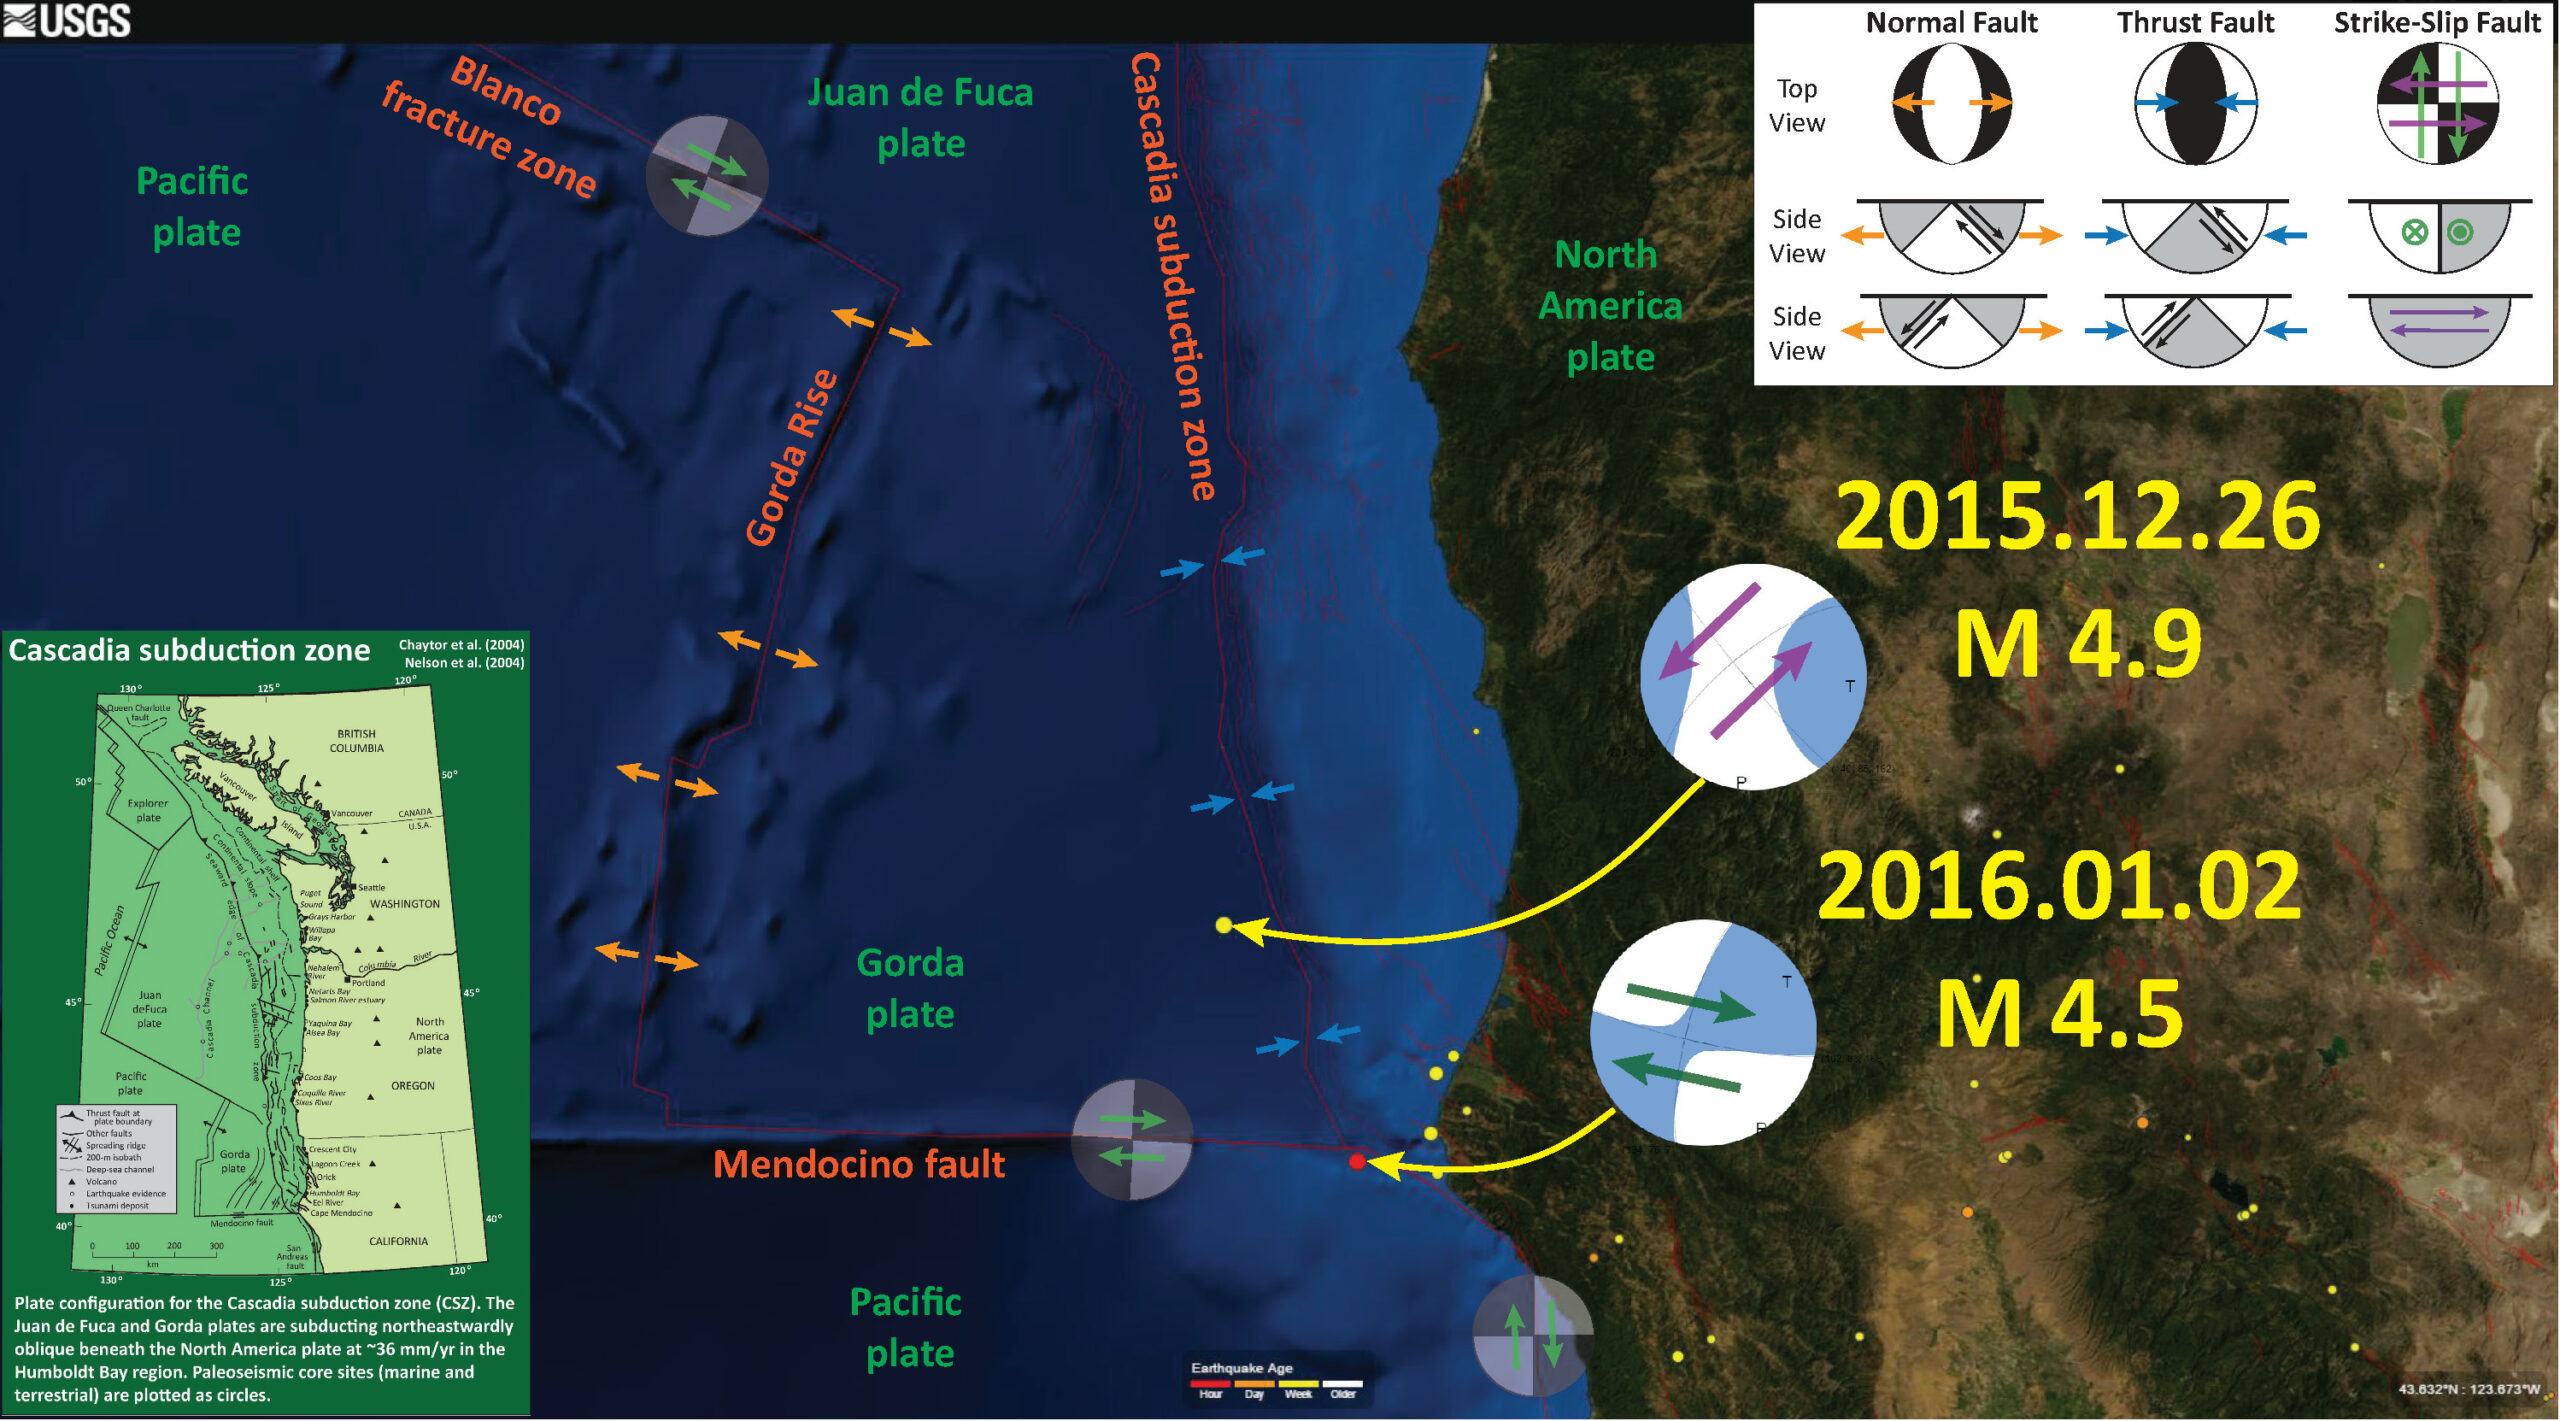
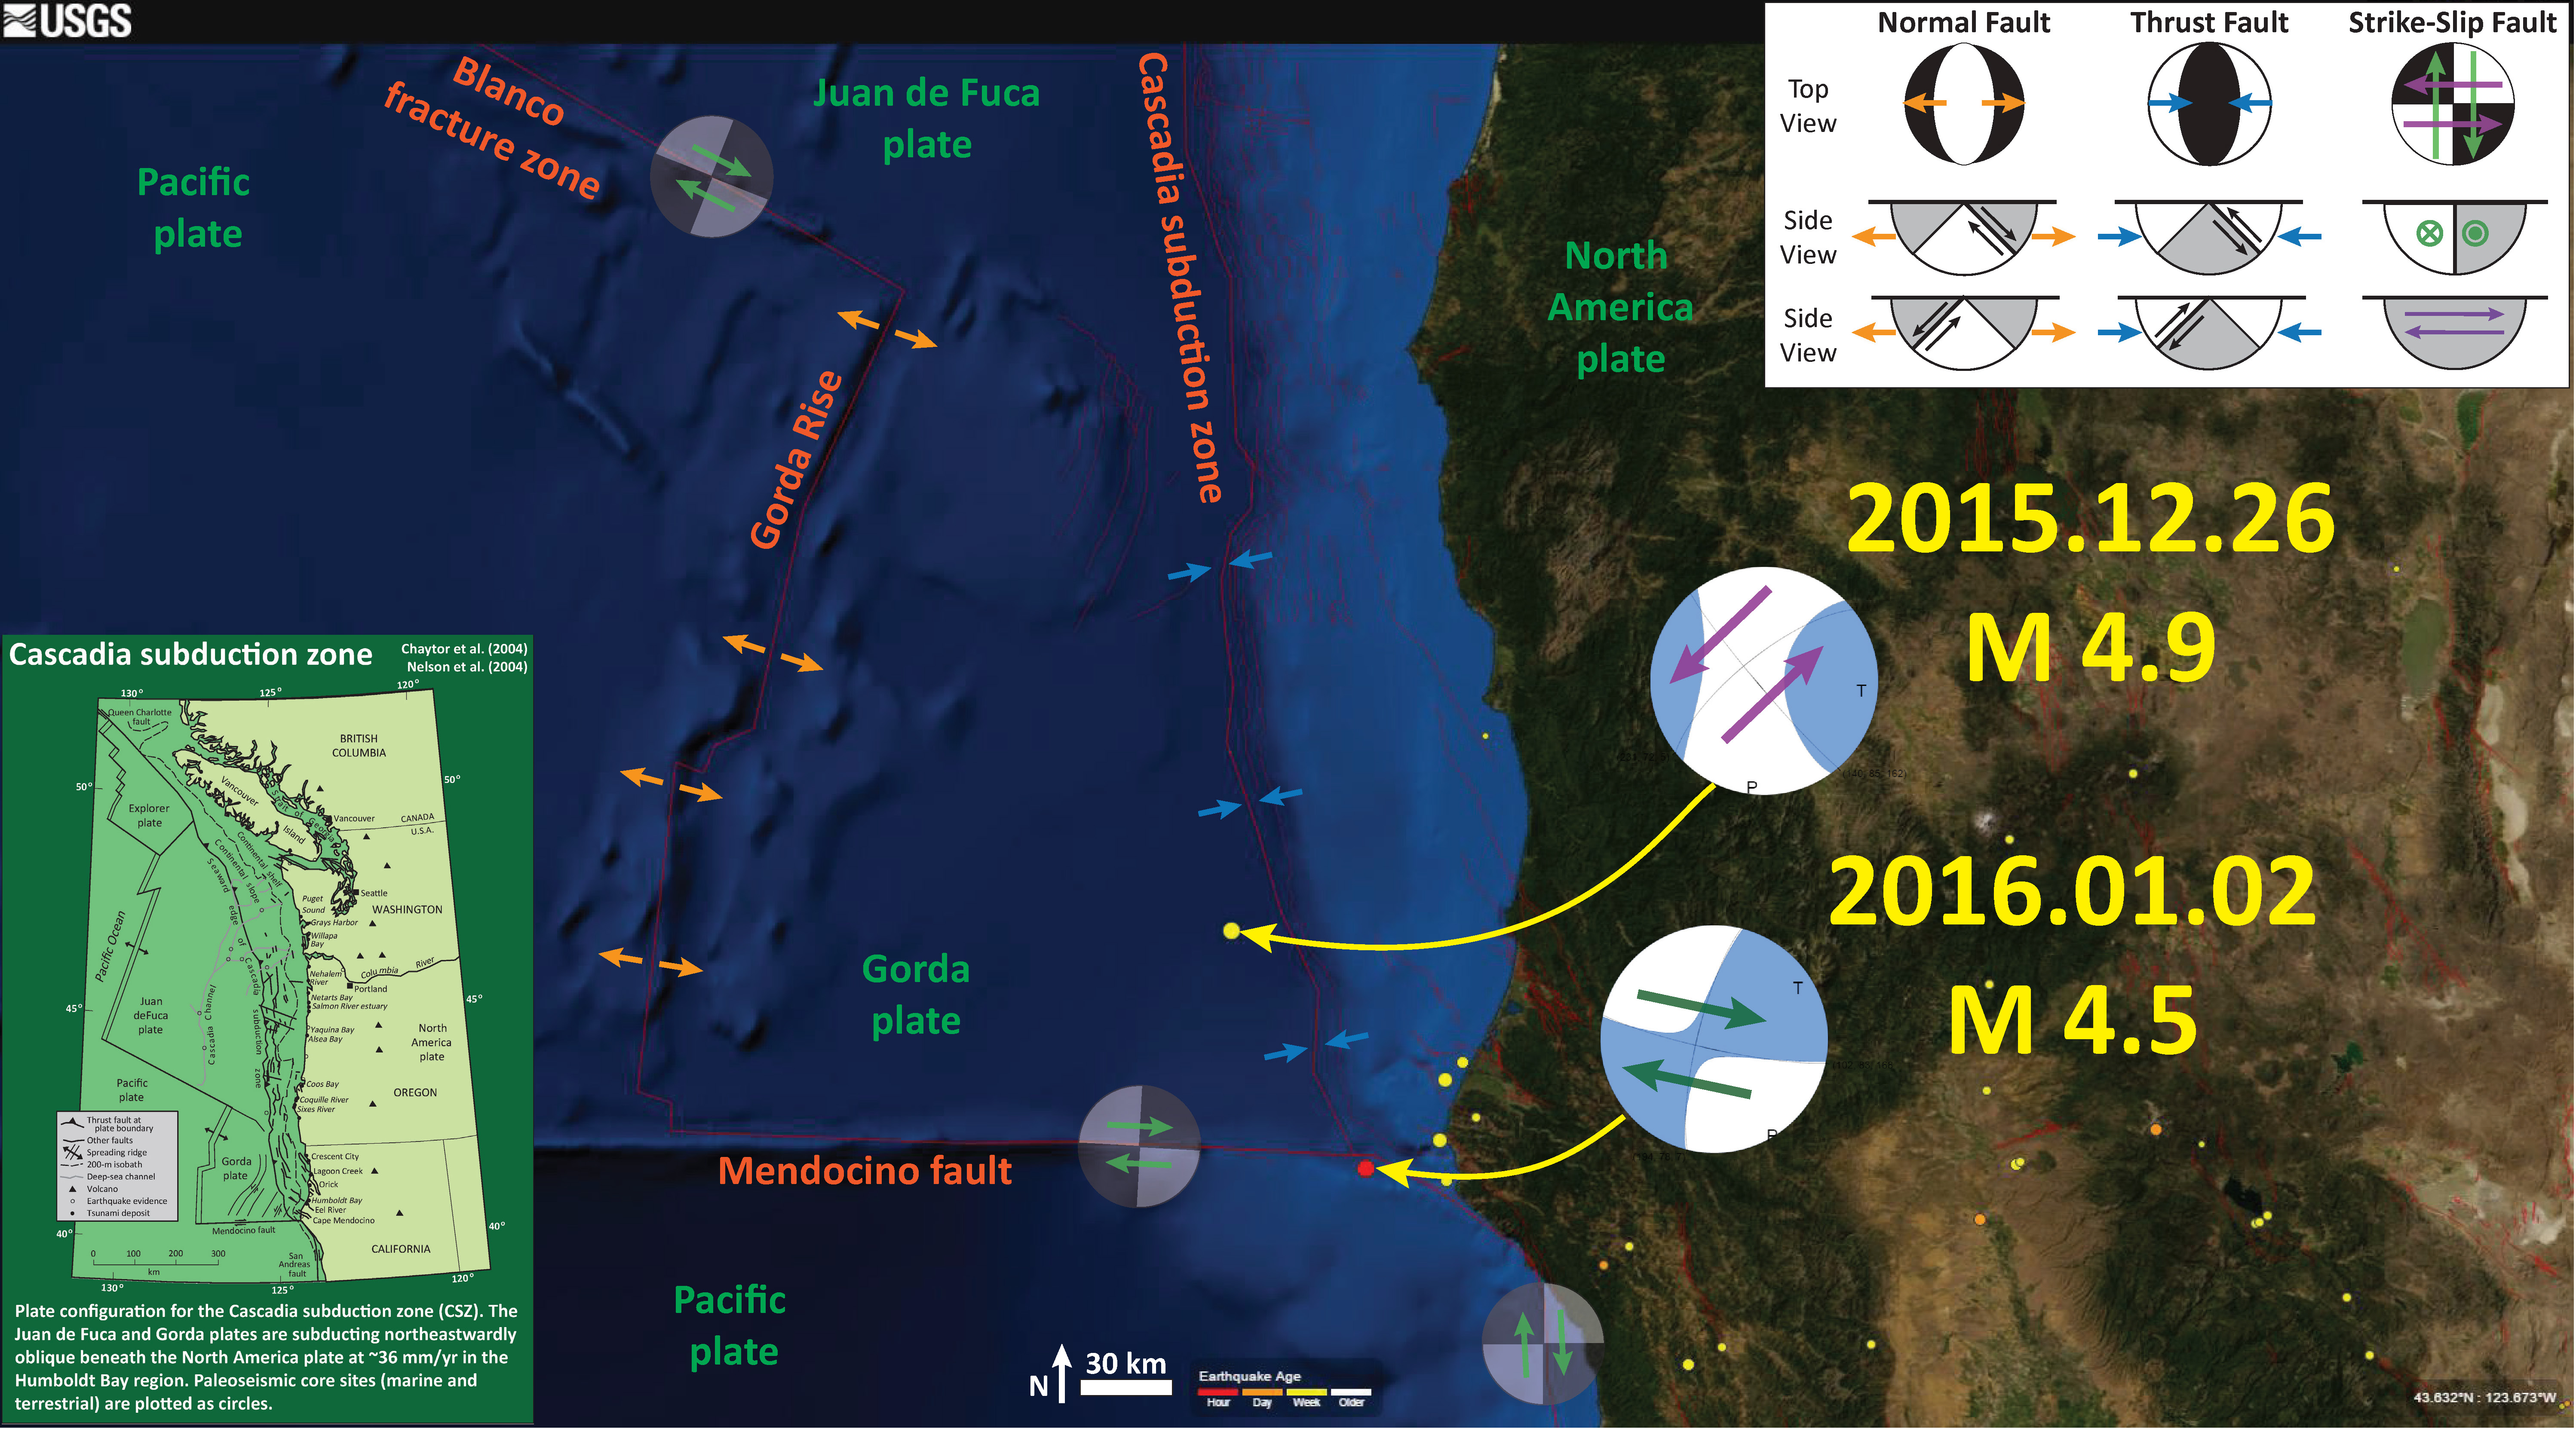
Here is a map that shows the epicenters for these two earthquakes. I also plot the moment tensors for these earthquakes.
I placed a moment tensor / focal mechanism legend in the upper right corner of the map. There is more material from the USGS web sites about moment tensors and focal mechanisms (the beach ball symbols). Both moment tensors and focal mechanisms are solutions to seismologic data that reveal two possible interpretations for fault orientation and sense of motion. One must use other information, like the regional tectonics, to interpret which of the two possibilities is more likely.
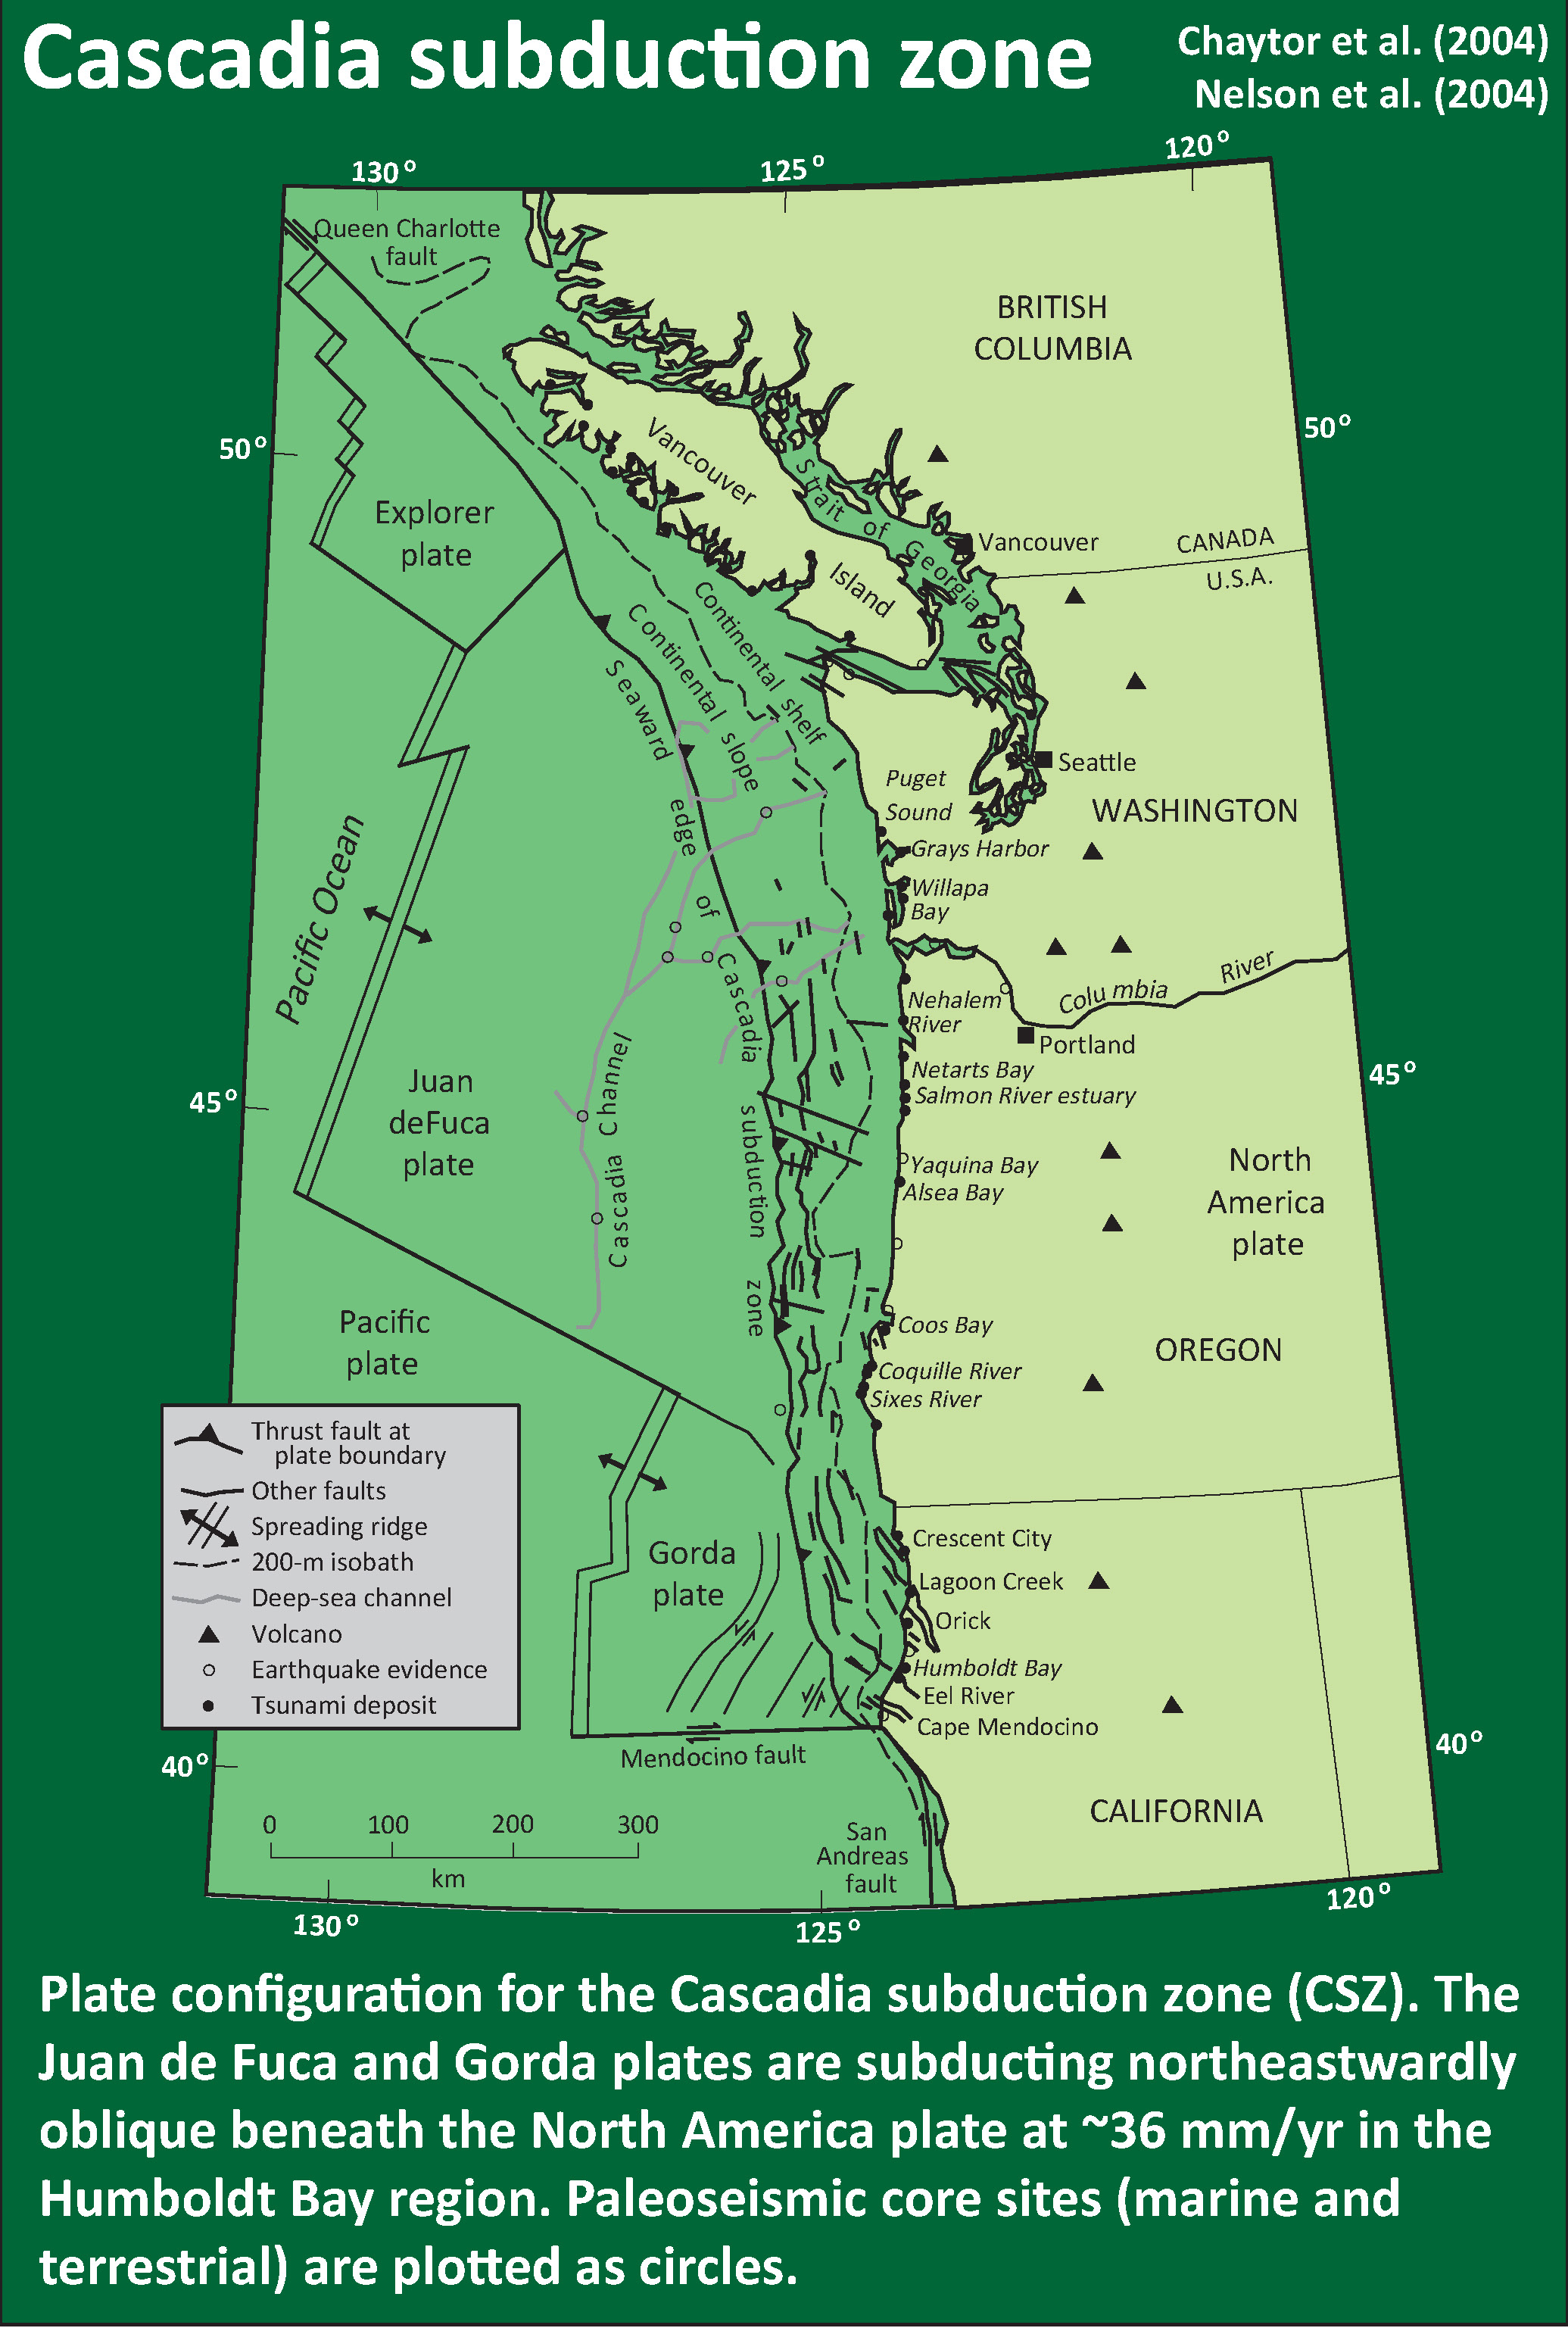
I include a plate tectonic map modified from Nelson et al. (2004) and Nelson et al. (2004). This map shows the Cascadia subduction zone, along with other major plate boundary faults in the region (Gorda Rise, Mendocino fault, San Andreas fault). The map also shows the interpretation of faults that are part of the internally deforming Gorda plate. These faults within the Gorda plate are responsible for the large damaging earthquakes in 1980, 2005, and 2010 (others also in 2014, and 2015).
Based on our knowledge of the regional tectonics, I interpret the M 4.5 earthquake to have an E-W striking right-lateral strike-slip solution and the M 4.9 earthquake a NE striking left-lateral strike-slip earthquake. This M 4.5 earthquake appears to have occurred along the Mendocino fault, a right-lateral (dextral) transform plate boundary. This plate boundary connects the Gorda rise and Juan de Fuca ridge spreading centers with their counterparts in the Gulf of California, with the San Andreas strike-slip fault system. Transform plate boundaries are defined that they are strike-slip and that they connect spreading ridges. In this sense of the definition, the Mendocino fault and the San Andreas fault are part of the same system.
For more on the graphical representation of moment tensors and focal mechnisms, check this IRIS video out:
Here is a map of the Cascadia subduction zone, modified from Nelson et al. (2004). The Juan de Fuca and Gorda plates subduct norteastwardly beneath the North America plate at rates ranging from 29- to 45-mm/yr. Sites where evidence of past earthquakes (paleoseismology) are denoted by white dots. Where there is also evidence for past CSZ tsunami, there are black dots. These paleoseismology sites are labeled (e.g. Humboldt Bay). Some submarine paleoseismology core sites are also shown as grey dots. The two main spreading ridges are not labeled, but the northern one is the Juan de Fuca ridge (where oceanic crust is formed for the Juan de Fuca plate) and the southern one is the Gorda rise (where the oceanic crust is formed for the Gorda plate).
-
There are several sources of seismicity in northern California, The Cascadia subduction zone, the Gorda plate, the Mendocino fault, the San Andreas fault, the Blanco fracture zone, and within the North America plate. Below are some pages that discuss earthquakes with these different sources.
- 2015.01.28 M 5.7 Mendocino fault
- 2014.03.10 M 6.8 Gorda plate
- 2015.05.26 M 4.3 Gorda plate
- 2015.06.10 M 5.9 Blanco fracture zone
- 2015.04.12 M 4.2 Blanco fracture zone
-
This page has some maps that show earthquake summaries for various sources.
- Gorda plate and Mendocino fault
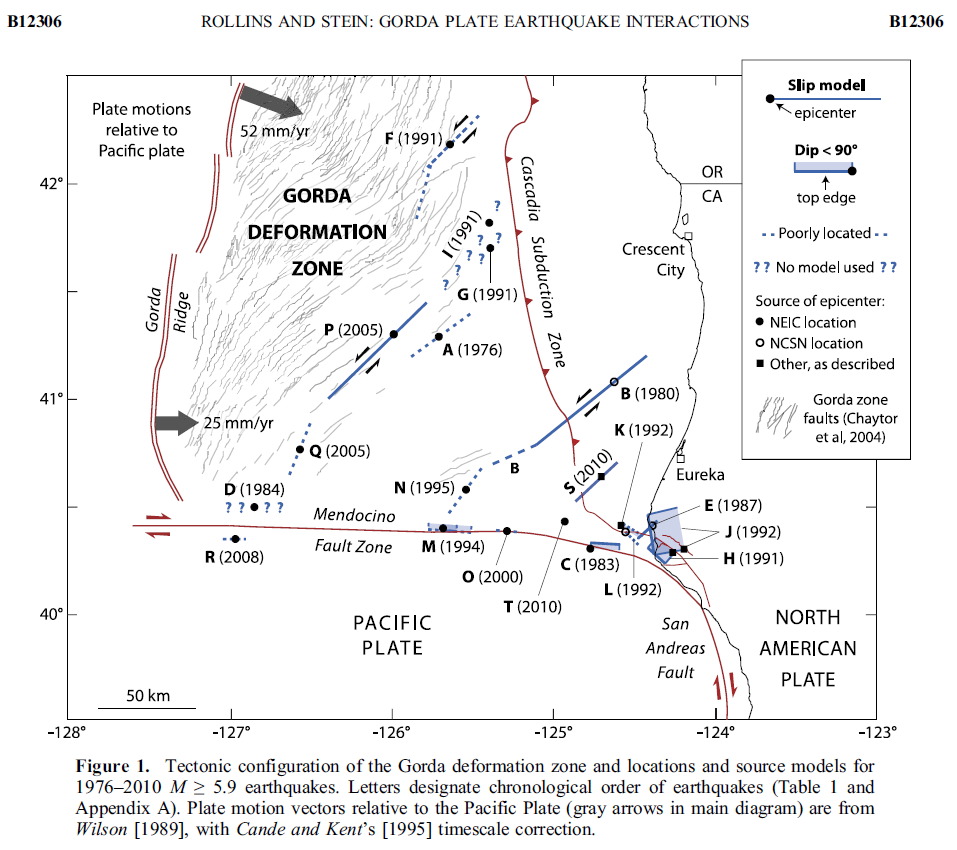
Here is a map from Rollins and Stein, showing their interpretations of different historic earthquakes in the region. This was published in response to the January 2010 Gorda plate earthquake. The faults are from Chaytor et al. (2004). The 1980, 1992, 1994, 2005, and 2010 earthquakes are plotted and labeled. I did not mention the 2010 earthquake, but it most likely was just like 1980 and 2005, a left-lateral strike-slip earthquake on a northeast striking fault.
In this map below, I label a number of other significant earthquakes in this Mendocino triple junction region. Another historic right-lateral earthquake on the Mendocino fault system was in 1994. There was a series of earthquakes possibly along the easternmost section of the Mendocino fault system in late January 2015, here is my post about that earthquake series.
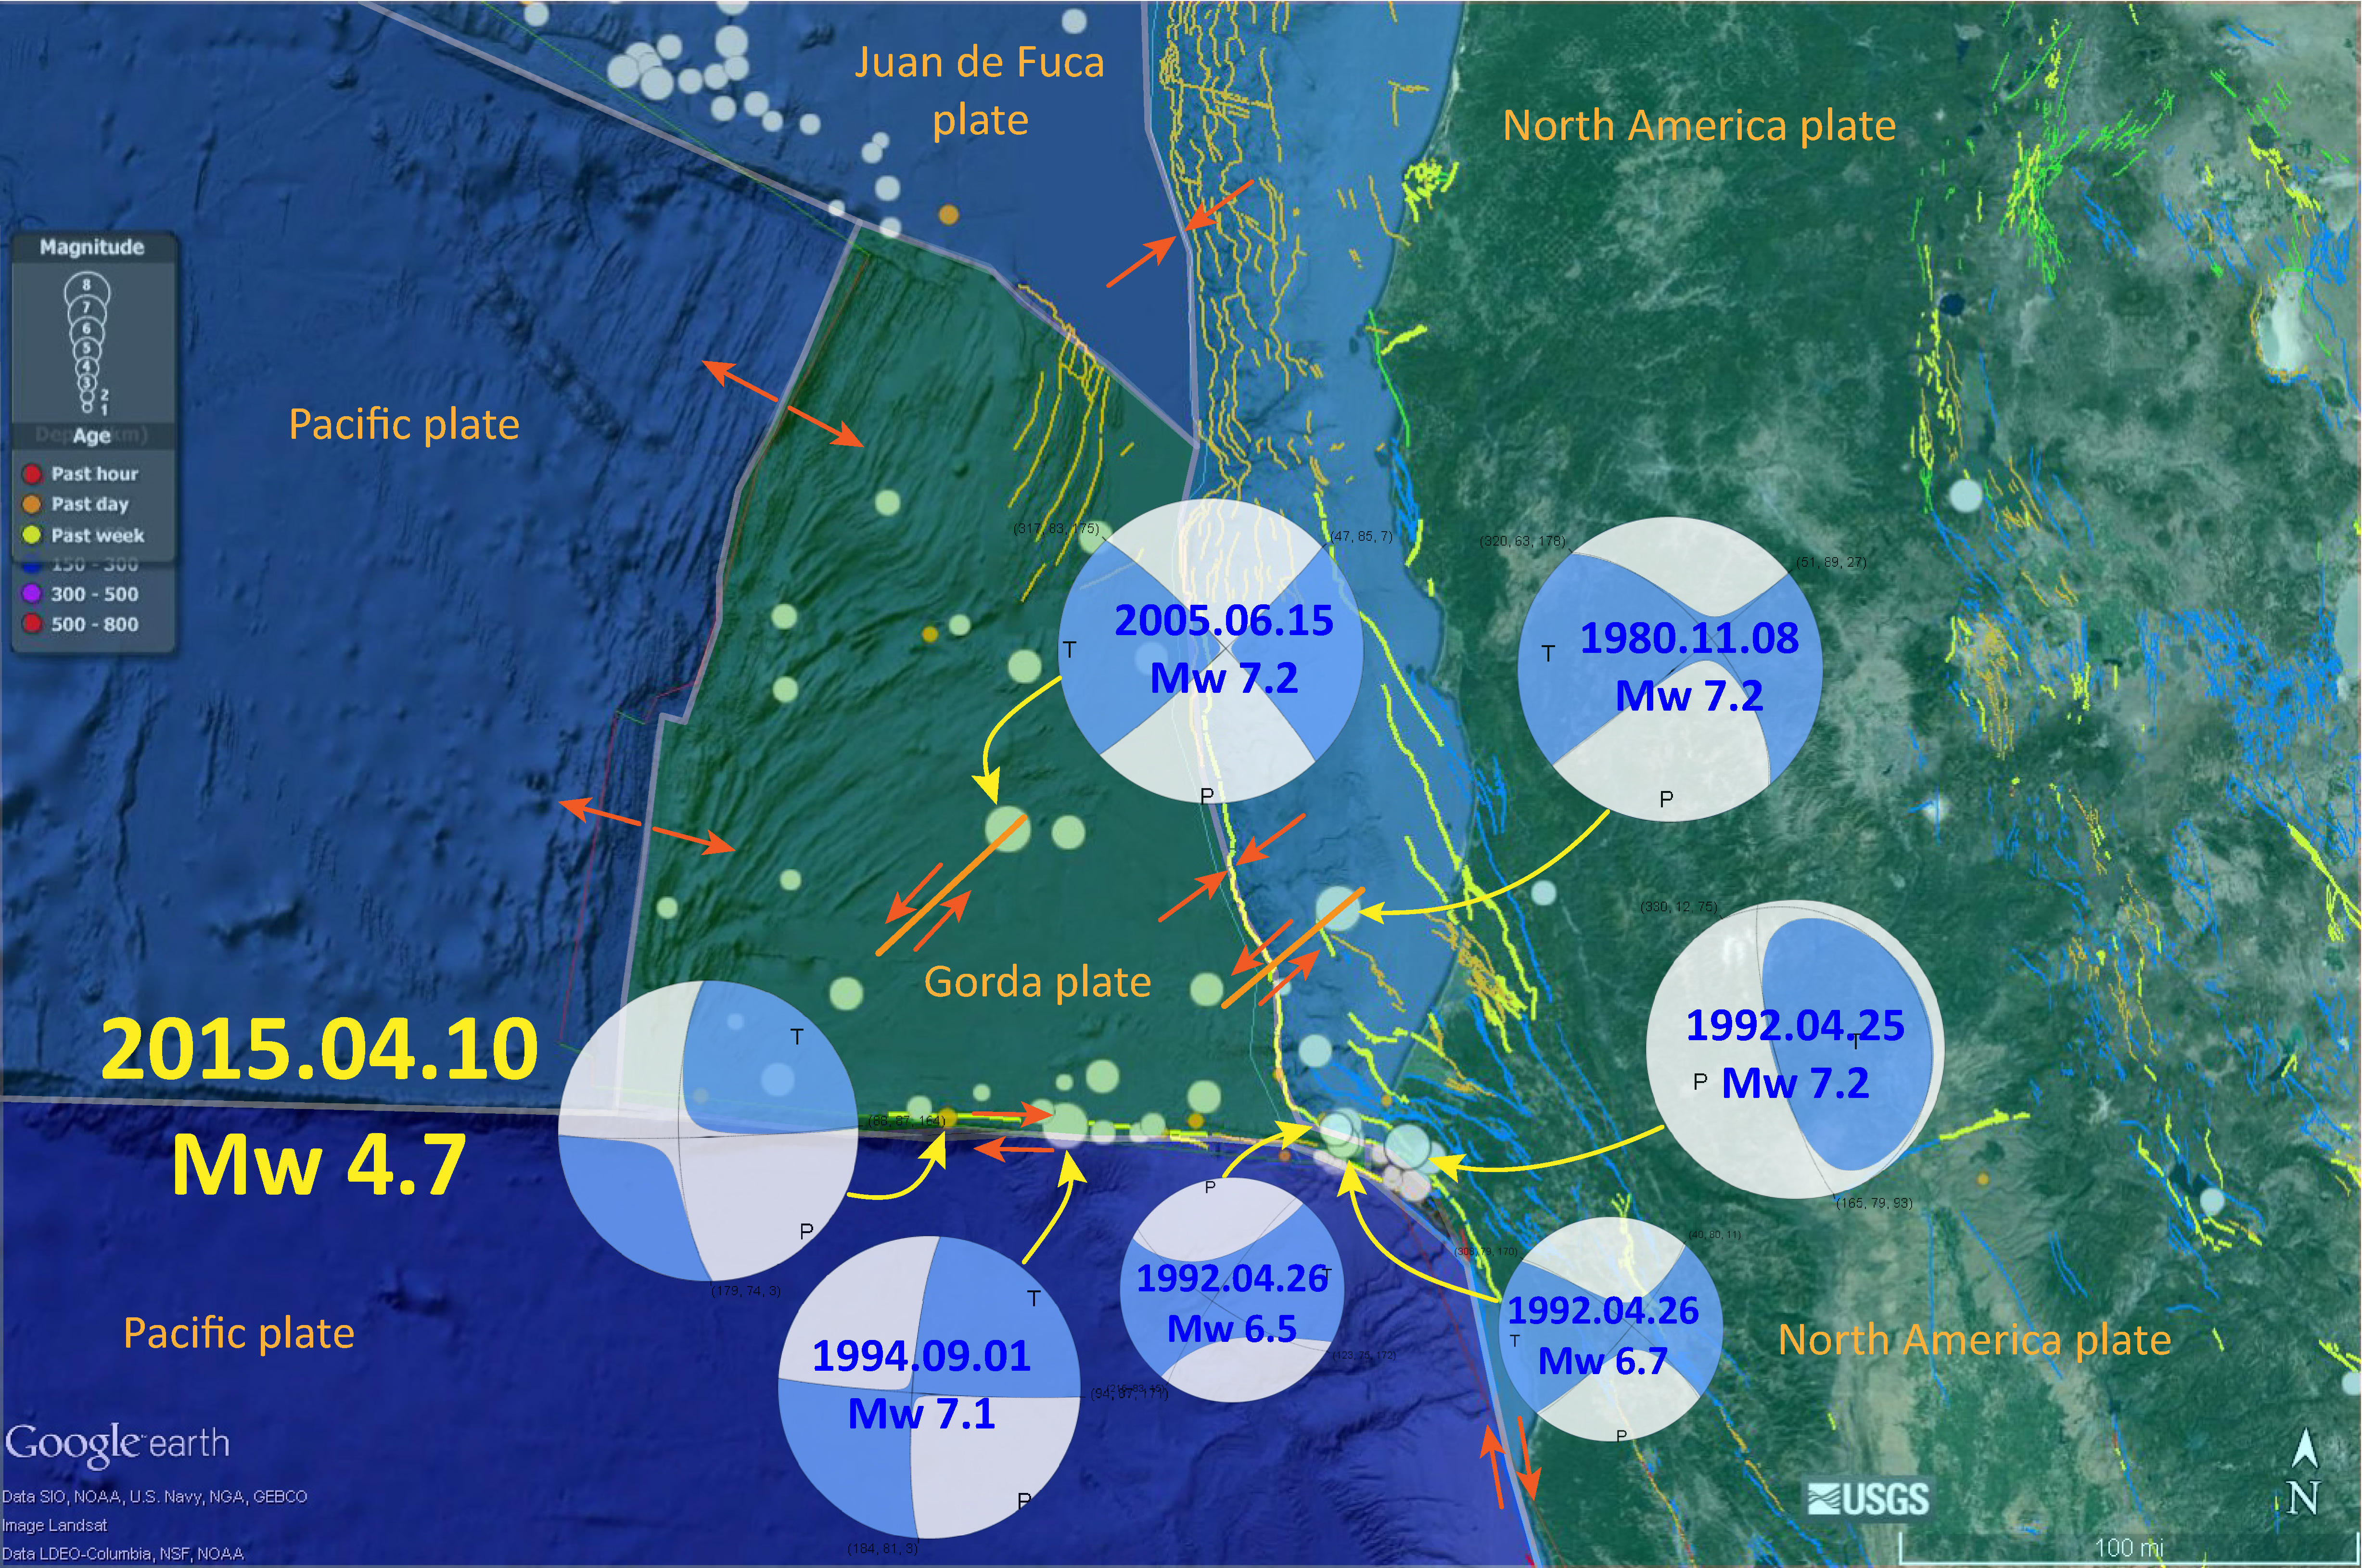
The Gorda and Juan de Fuca plates subduct beneath the North America plate to form the Cascadia subduction zone fault system. In 1992 there was a swarm of earthquakes with the magnitude Mw 7.2 Mainshock on 4/25. Initially this earthquake was interpreted to have been on the Cascadia subduction zone (CSZ). The moment tensor shows a compressional mechanism. However the two largest aftershocks on 4/26/1992 (Mw 6.5 and Mw 6.7), had strike-slip moment tensors. These two aftershocks align on what may be the eastern extension of the Mendocino fault.
There have been several series of intra-plate earthquakes in the Gorda plate. Two main shocks that I plot of this type of earthquake are the 1980 (Mw 7.2) and 2005 (Mw 7.2) earthquakes. I place orange lines approximately where the faults are that ruptured in 1980 and 2005. These are also plotted in the Rollins and Stein (2010) figure above. The Gorda plate is being deformed due to compression between the Pacific plate to the south and the Juan de Fuca plate to the north. Due to this north-south compression, the plate is deforming internally so that normal faults that formed at the spreading center (the Gorda Rise) are reactivated as left-lateral strike-slip faults. In 2014, there was another swarm of left-lateral earthquakes in the Gorda plate. I posted some material about the Gorda plate setting on this page.
There are three types of earthquakes, strike-slip, compressional (reverse or thrust, depending upon the dip of the fault), and extensional (normal). Here is are some animations of these three types of earthquake faults. Many of the earthquakes people are familiar with in the Mendocino triple junction region are either compressional or strike slip. The following three animations are from IRIS.
Strike Slip:
Compressional:
Extensional:
This figure shows what a transform plate boundary fault is. Looking down from outer space, the crust on either side of the fault moves side-by-side. When one is standing on the ground, on one side of the fault, looking across the fault as it moves… If the crust on the other side of the fault moves to the right, the fault is a “right lateral” strike slip fault. The Mendocino and San Andreas faults are right-lateral (dextral) strike-slip faults.
![]()
Here is an IRIS animation showing a transform plate boundary fault as it relates to spreading ridges.
-
References:
- Chaytor, J.D., Goldfinger, C., Dziak, R.P., and Fox, C.G., 2004. Active deformation of the Gorda plate: Constraining deformation models with new geophysical data: Geology v. 32, p. 353-356.
- Nelson, A.R., Asquith, A.C., and Grant, W.C., 2004. Great Earthquakes and Tsunamis of the Past 2000 Years at the Salmon River Estuary, Central Oregon Coast, USA: Bulletin of the Seismological Society of America, Vol. 94, No. 4, pp. 1276–1292
- Rollins, J.C. and Stein, R.S., 2010. Coulomb stress interactions among M ≥ 5.9 earthquakes in the Gorda deformation zone and on the Mendocino Fault Zone, Cascadia subduction zone, and northern San Andreas Fault: Journal of Geophysical Research, v. 115, B12306, doi:10.1029/2009JB007117, 2010.
10 thoughts on “Earthquake Report: Mendocino fault and Gorda plate!”