Today there was an earthquake offshore of southern Japan. Here is the USGS website for the M 6.0 earthquake. It is difficult to tell if this earthquake was on the megathrust or not.
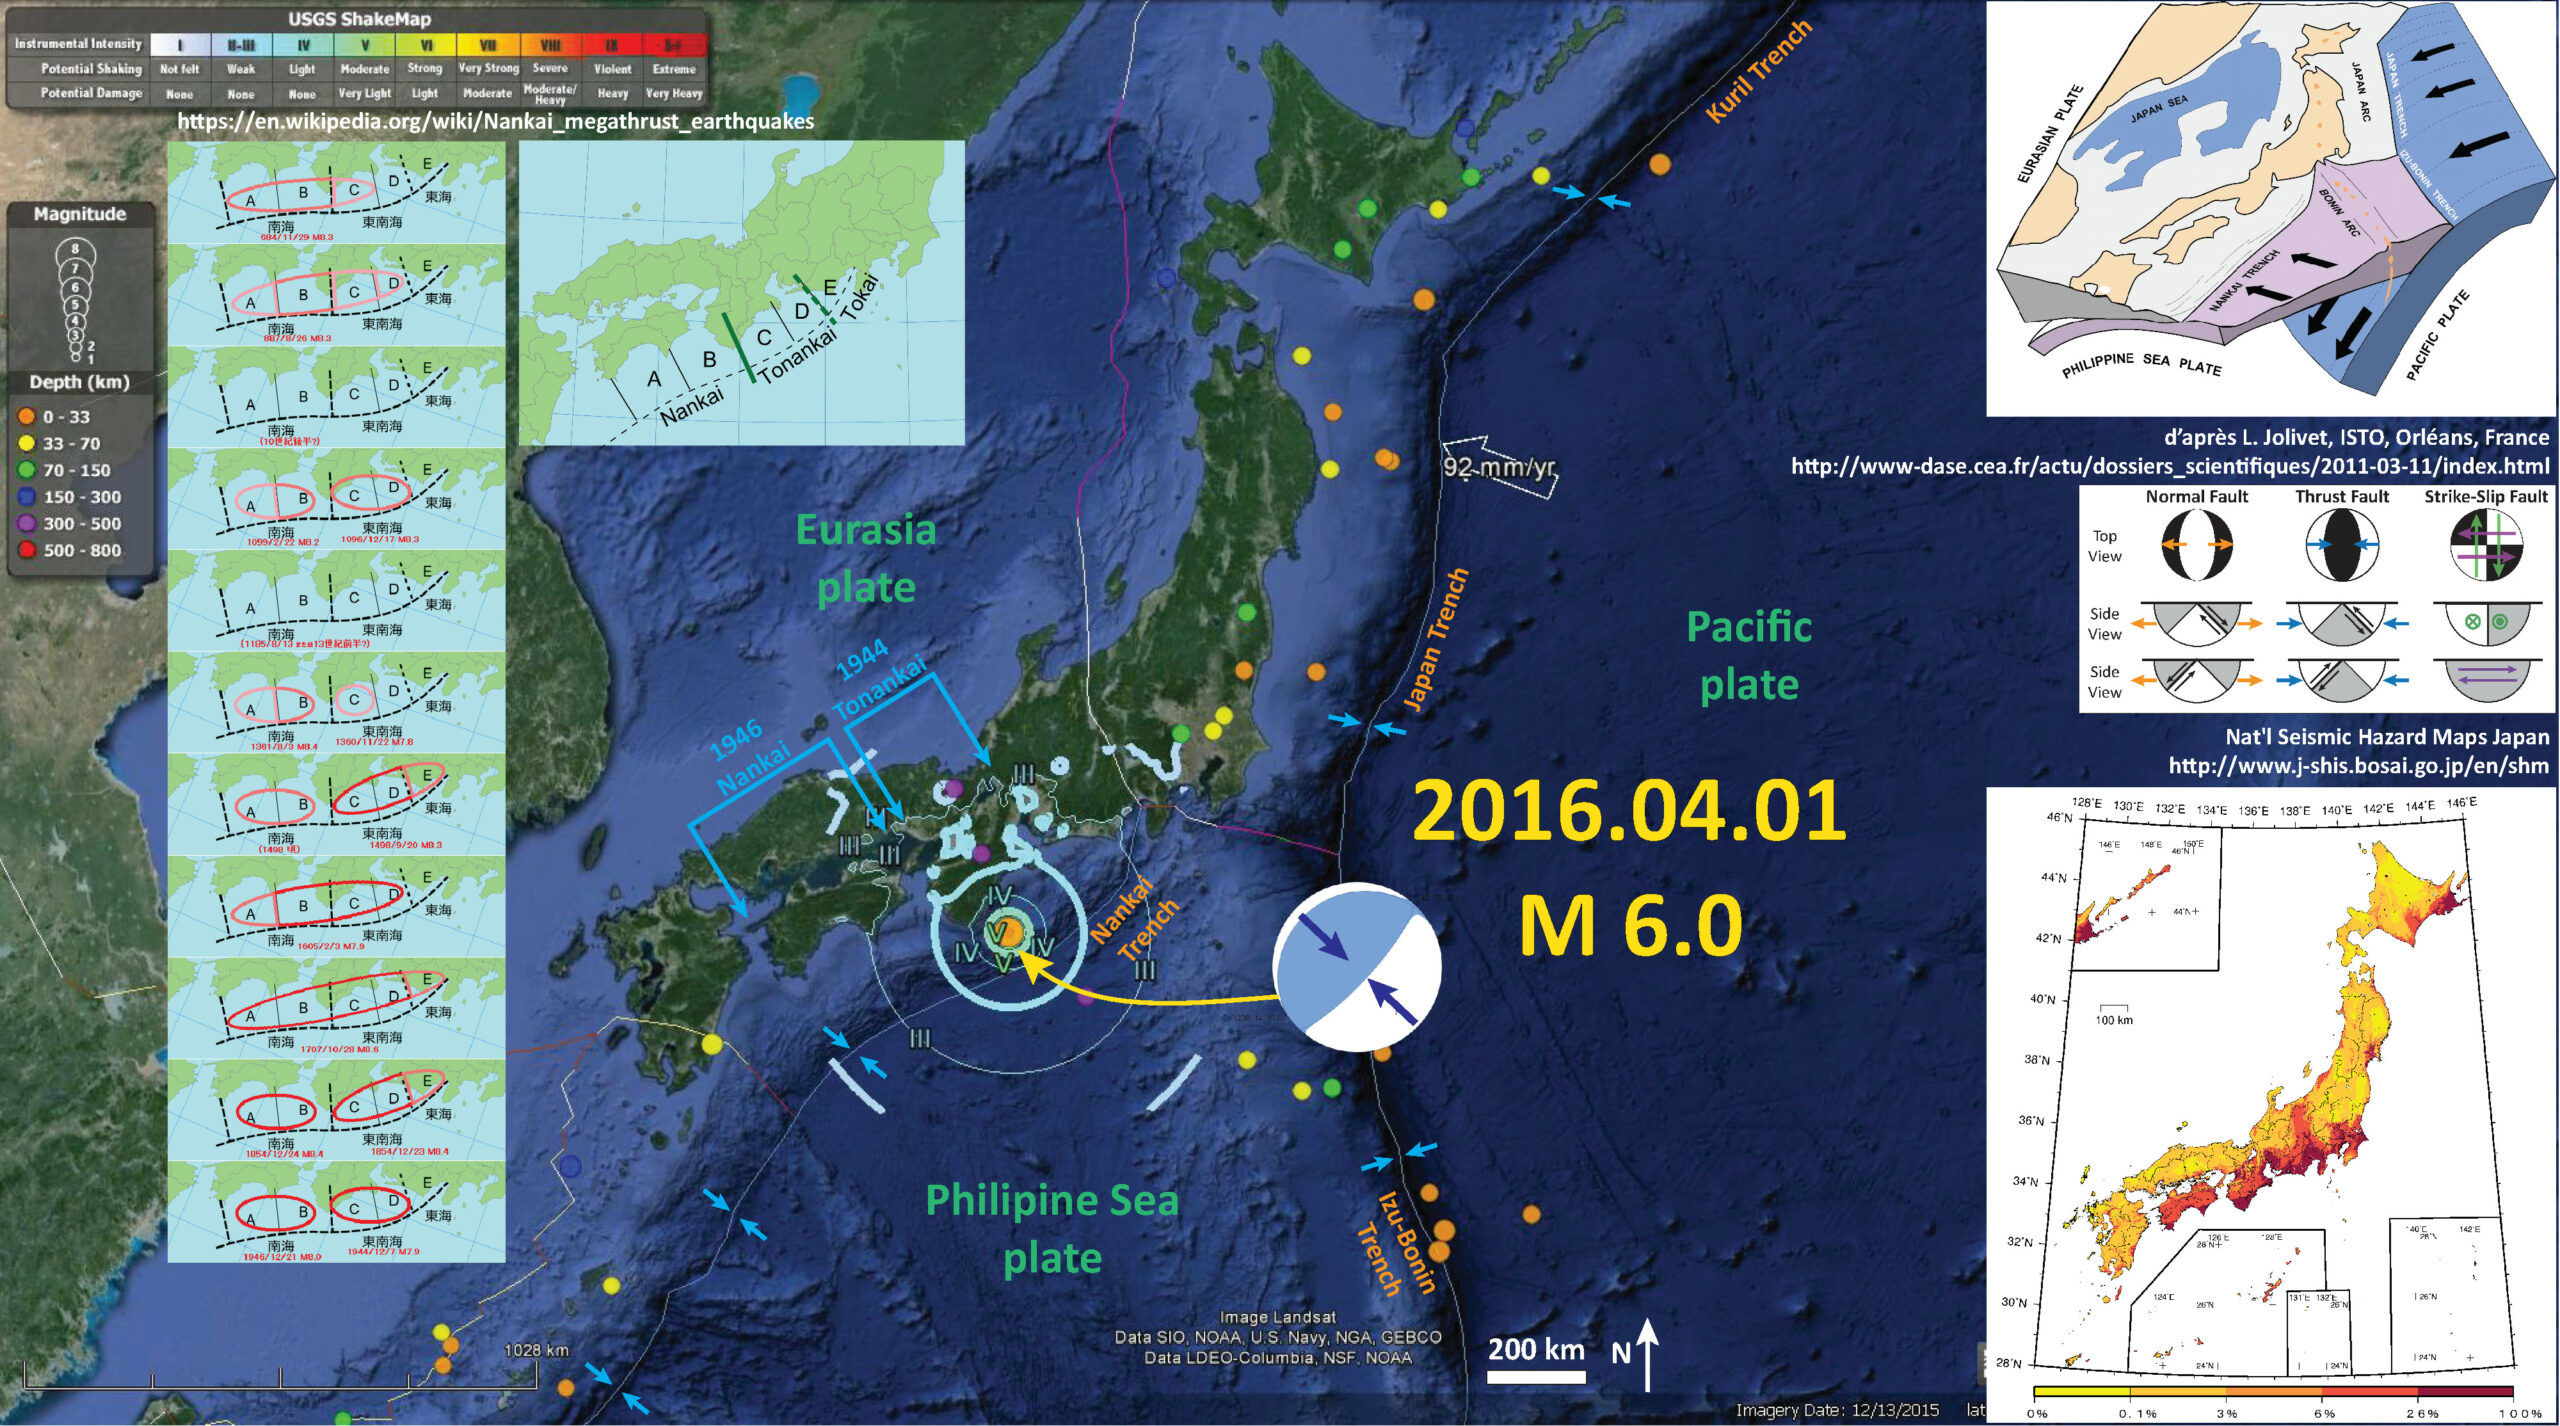
Below is my interpretive map. I plot the USGS moment tensor for this earthquake. I show the general location for the 1944 and 1946 subduction zone earthquakes mentioned below. I also include the Modified Mercalli Intensity (MMI) contours. The MMI is a qualitative measure of shaking intensity. More on the MMI scale can be found here and here.
There is a legend that shows how moment tensors can be interpreted. Moment tensors are graphical solutions of seismic data that show two possible fault plane solutions. One must use local tectonics, along with other data, to be able to interpret which of the two possible solutions is correct. The legend shows how these two solutions are oriented for each example (Normal/Extensional, Thrust/Compressional, and Strike-Slip/Shear). There is more about moment tensors and focal mechanisms at the USGS.
-
I include some inset figures.
- In 1944 and 1946 there was a pair of M 8.1 damaging large subduction zone earthquakes, the Tonankai and Nankai earthquakes respectively. These earthquakes were the impetus for the efforts in Japan to learn and mitigate for earthquake and tsunami hazards. On the left are two maps. The upper right map shows the segments of the Nankai subduction zone that have ruptured historically and prehistorically. On the left is a panel that shows how these fault segments have ruptured through the years (684, 887, 1096, 1099, 1360, 1361, 1498, 1605, 1707, 1854, 1944, and 1946). This is the source for these images.
- In the upper right corner is a figure that shows the 3-D view of the plate configuration in this region. This is from d’après L. Jolivet, ISTO, Orléans, France (source here).
- In the lower right corner I place a seismic hazard map for Japan. This map shows the probability of exceedance for ground motion (percent g, where g = gravitational acceleration of 9.8 m/s^2) within the next 30 years. If the ground motions exceed 100% g, then objects can be thrown into the air. Here is the source of this map, from the Japan Seismic Hazard Information Station (JSHIS).

Here is the same map that shows the slab contours. The red-orange-yellow lines are slab contour lines from Hayes et al. (2012). These lines are a best estimate for the depth to the subduction zone fault. These are based largely upon seismicity and there is currently an effort to update these contours to integrate other data types.

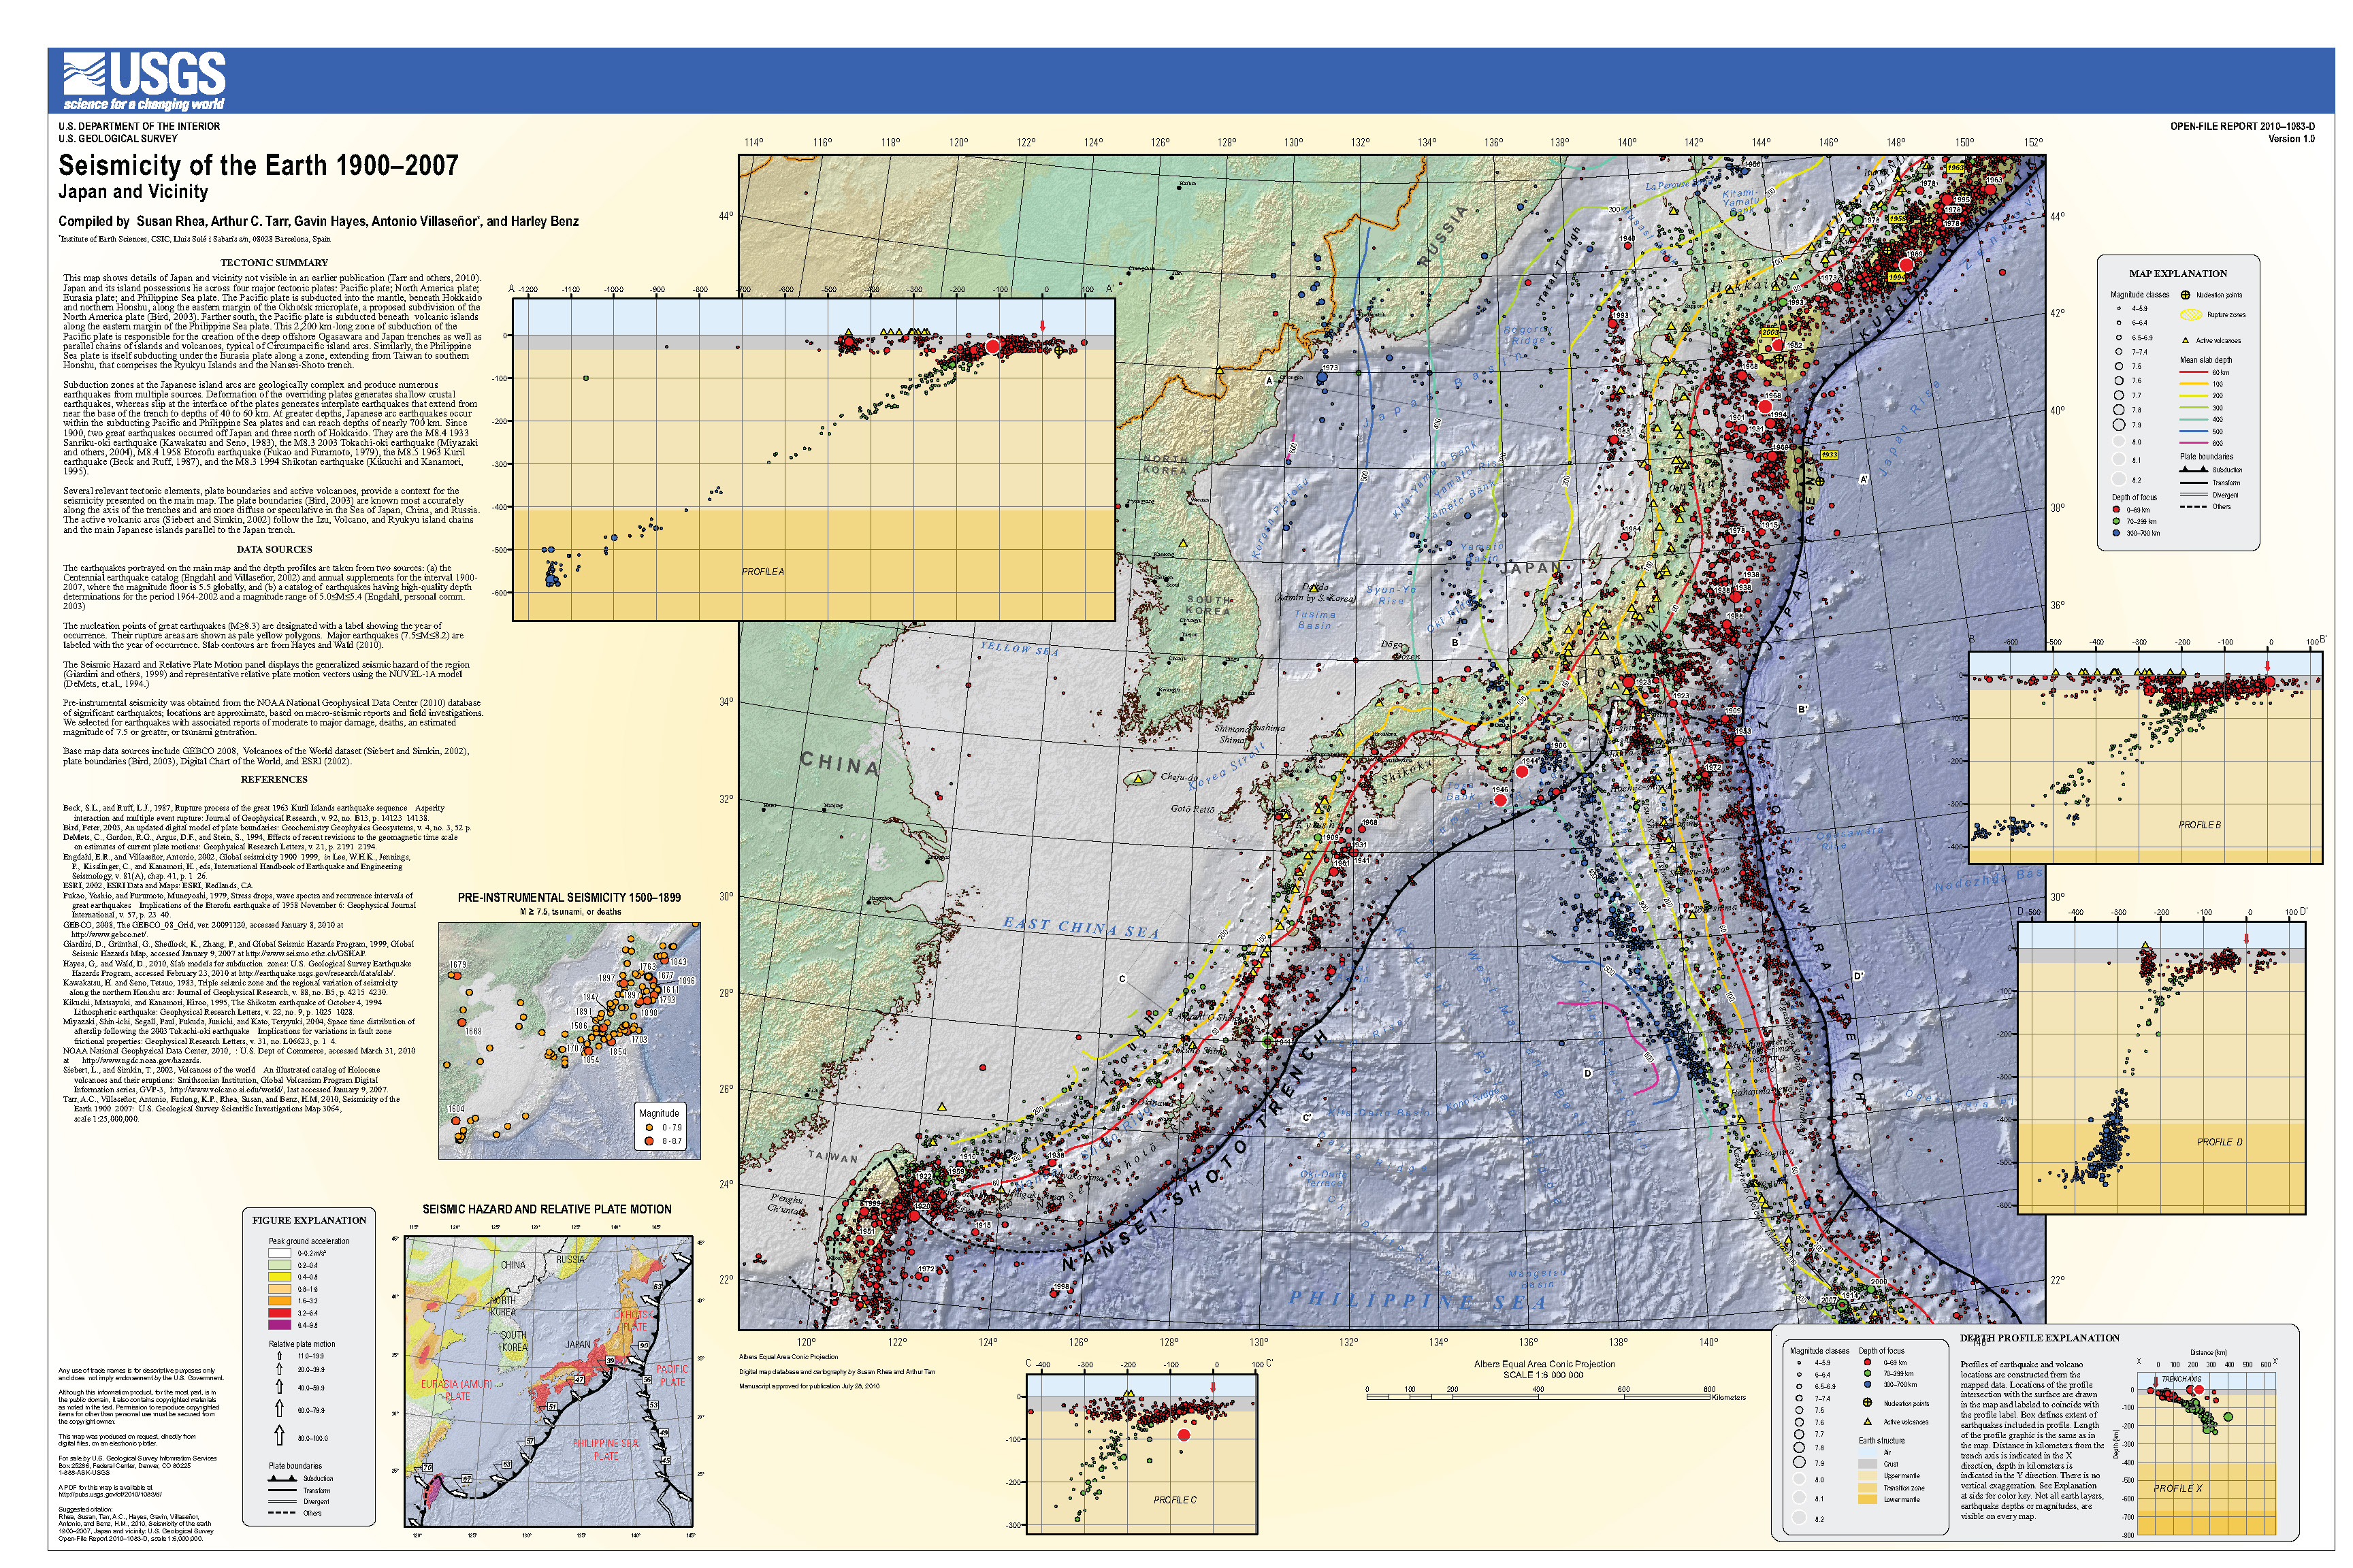
Here is a USGS poster than summarizes the earthquake history and plate geometry for this region. This is the USGS Open File Report 2010-1083-D (Rhea et al., 2010).
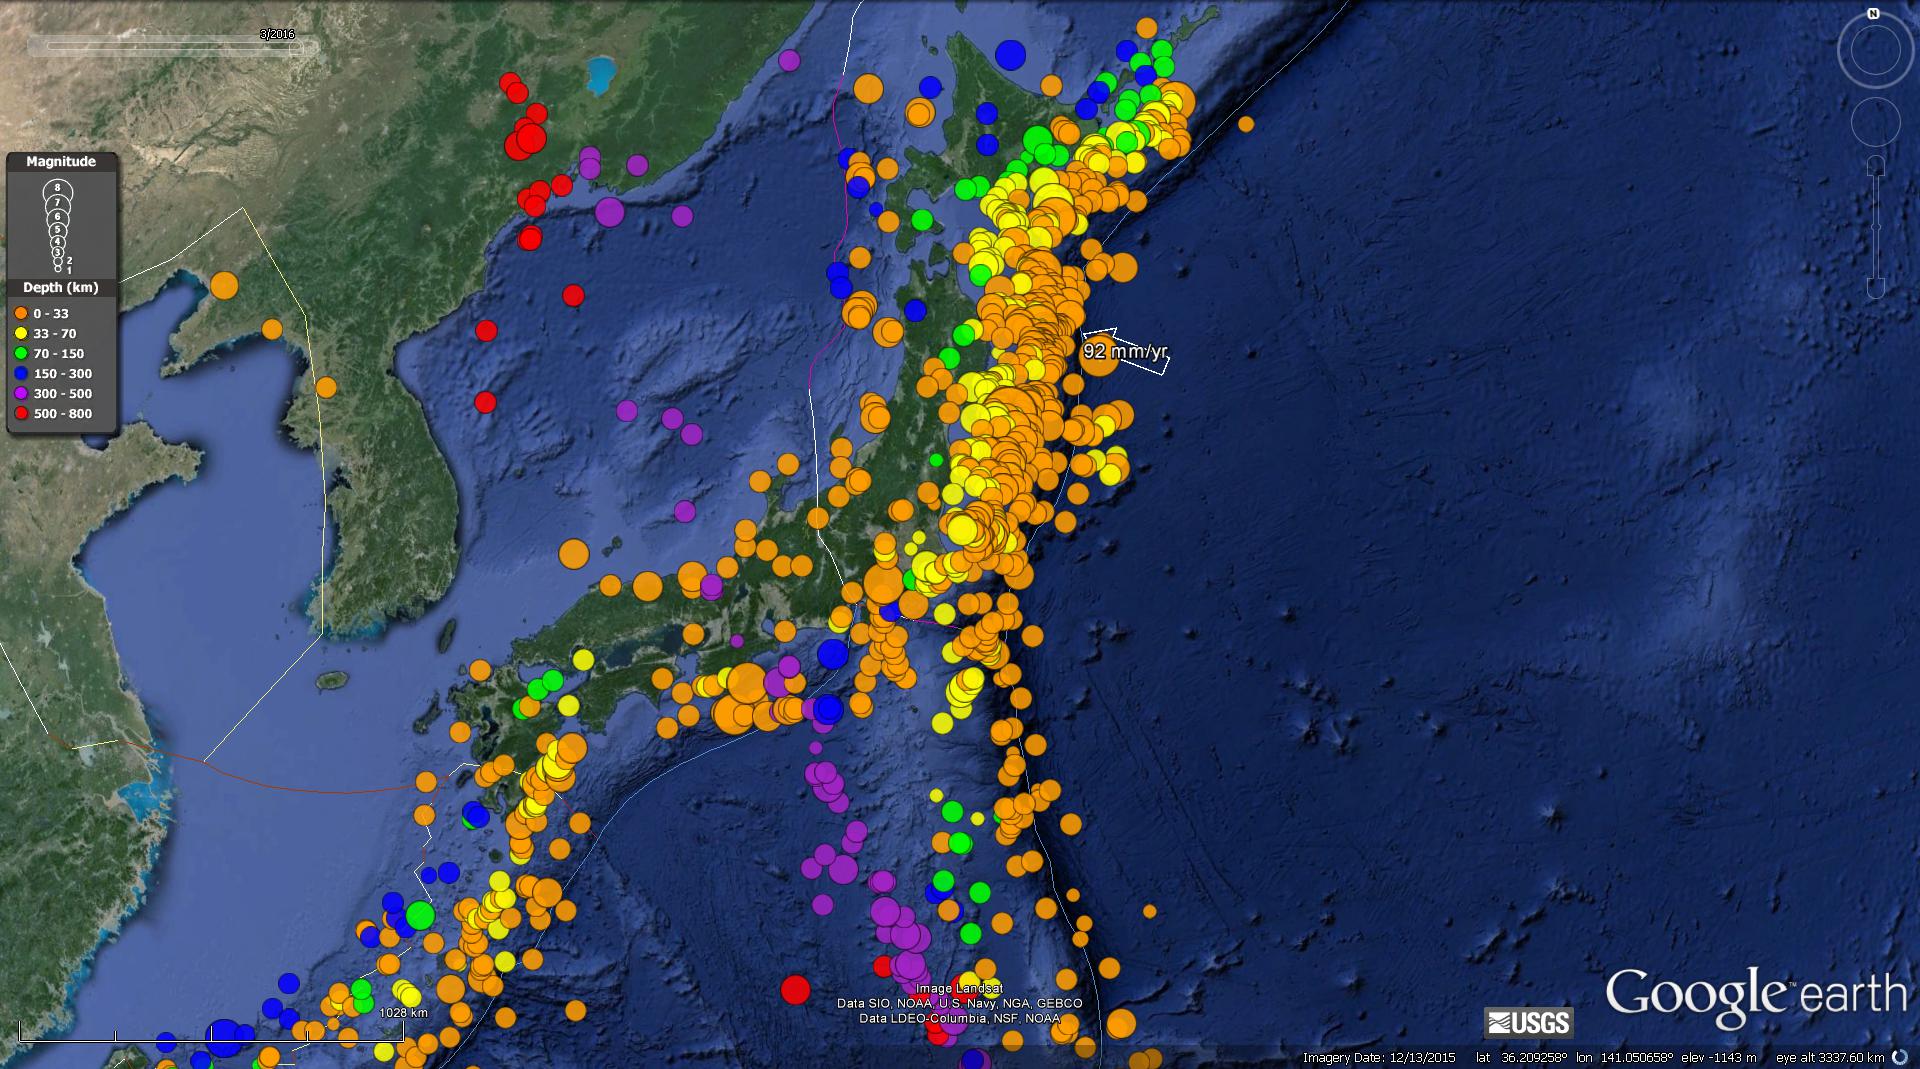
I put together an animation that shows the earthquake epicenters in Japan from 1900-2016/04/01. I include earthquakes with magnitude ≥ 6.0. Below is a screenshot of all these earthquakes, followed by the video. Here is the kml that I made using a USGS earthquake query. Here is the query that I used. The animation has an additional cross section showing the Japan trench, where the 2011/03/11 Tohoku-Oki M 9.0 subduction zone earthquake occurred. Here is a summary of the observations made following that 2011 earthquake.
- Here is a link to the embedded video below (for download). (20 MB mp4)
-
There have been many IODP investigations along the Nankai Trough. These investigations include 3-D seismic and scientific drilling in this region. Here are a couple reports from Moore et al. (2009) and Kinoshita, et al. (2007).
- Here is an image that shows a 3-D view of the seafloor and seismic data. This comes from Moore et al. (2007). First is a map showing the location of this 3-D seismic survey, then the survey results, then their interpretation of the evolution of this margin. I include their figures caption below as a blockquote.
- This is an image from Jin-Oh Park (University of Tokyo) that shows the Decollement (the megathrust fault) and the seafloor. I include their figure caption below as a blockquote.
- Some think that the 1944 earthquake slipped along a splay fault, a fault that splays off of the megathrust. Here is an image that shows how the megasplay fault is configured. This is the source of this figure. I include their figure caption below as a blockquote.

Location map showing the regional setting of the Nankai Trough (upper right inset). PSP, Philippine Sea Plate; KPR, Kyushu-Palau Ridge; IBT, Izu-Bonin Trench; KP, Kii Peninsula. Conver gence direction between the Philippine Sea Plate and Japan is shown at the lower right.

3D seismic data volume depicting the location of the megasplay fault (black lines) and its relationship to older in sequence thrusts of the frontal accretionary prism (blue lines). Steep sea-floor topography and numerous slumps above the splay fault are shown.

(A to C) Summary diagram showing the development of the Nankai accretionary prism in the Kumano Basin area. After “normal” in-sequence thrusting and building of an accretionary prism, an out-of-sequence (splay) fault system broke through at the back of the prism, a, b, and c refer to sequential sedimentary sequences.

3-D prestack depth migration images (inline slice, crossline slice, and depth slice) of the Nankai accretionary wedge off Shikoku Island. Miocene to Pliocene Shikoku Basin sediments underthrusts the overlying accretionary prism along a decollement as the Philippine Sea Plate subducts beneath the Eurasian Plate. The oceanic crust of the subducting Philippine Sea Plate (PSP) is traceable over the entire inlines. Several imbricate thrust faults are observed in the overlying accretionary wedge. The Décollement steps down on the top of subducting oceanic crust around ~30 km landward from the deformation front.

A: Tectonic setting of Nankai Trough subduction zone. Large earthquakes (magnitude 8-class) have repeatedly occurred along the Nankai Trough. The orange shaded segment caused the 1944 Tonankai earthquake. The NanTroSEIZE project is underway along the red line B.
B: Cross section (red line in A). Detailed seismic profiles illustrate the plate boundary fault and the megasplay fault.
C: Locations of core samples from Sites C0004 and C0008, taken from hanging wall and the footwall, respectively.
-
Here is a great documentary about slow earthquakes and the Nankai subduction zone. The yt link is here.
- This is a downloadable file for the embedded video below. The video may load slowly as it is a large file. One may want to download the file to view from their computer, depending upon one’s internet speed. (~500 MB mp4)
-
References:
- Hayes, G.P., Wald, D.J., and Johnson, R.L., 2012. Slab1.0: A three-dimensional model of global subduction zone geometries in, J. Geophys. Res., 117, B01302, doi:10.1029/2011JB008524
- Moore, G.F., Bangs, N.L., Taira, A., Kuramoto, S., Pangborn, E., and Tobin, H.J., 2007. Three-Dimensional Splay Fault Geometry and Implications for Tsunami Generation in Science, v. 318, p. 1128-1131.
- Rhea, S., Tarr, A.C., Hayes, G., Villaseñor, A., and Benz, H.M., 2010. Seismicity of the earth 1900–2007, Japan and vicinity: U.S. Geological Survey Open-File Report 2010–1083-D, scale 1:6,000,000.
And the Chikyu was right on top of it! People on the ship felt the earthquake, even though they were in 2000 meters’ water depth. Downhole and seafloor instruments have recorded the earthquake (which may be a bit deeper than the plate interface, but we’ll see). Stay tuned for more on this one.
Very very cool!!! Look fwd to hearing more. Wow they felt it. Very interesting.
Hey Harold, sound like a triggered event, ha!
Shhhhh. (Actually for the record, they had not yet lowered anything to the seafloor, so were just floating above!)