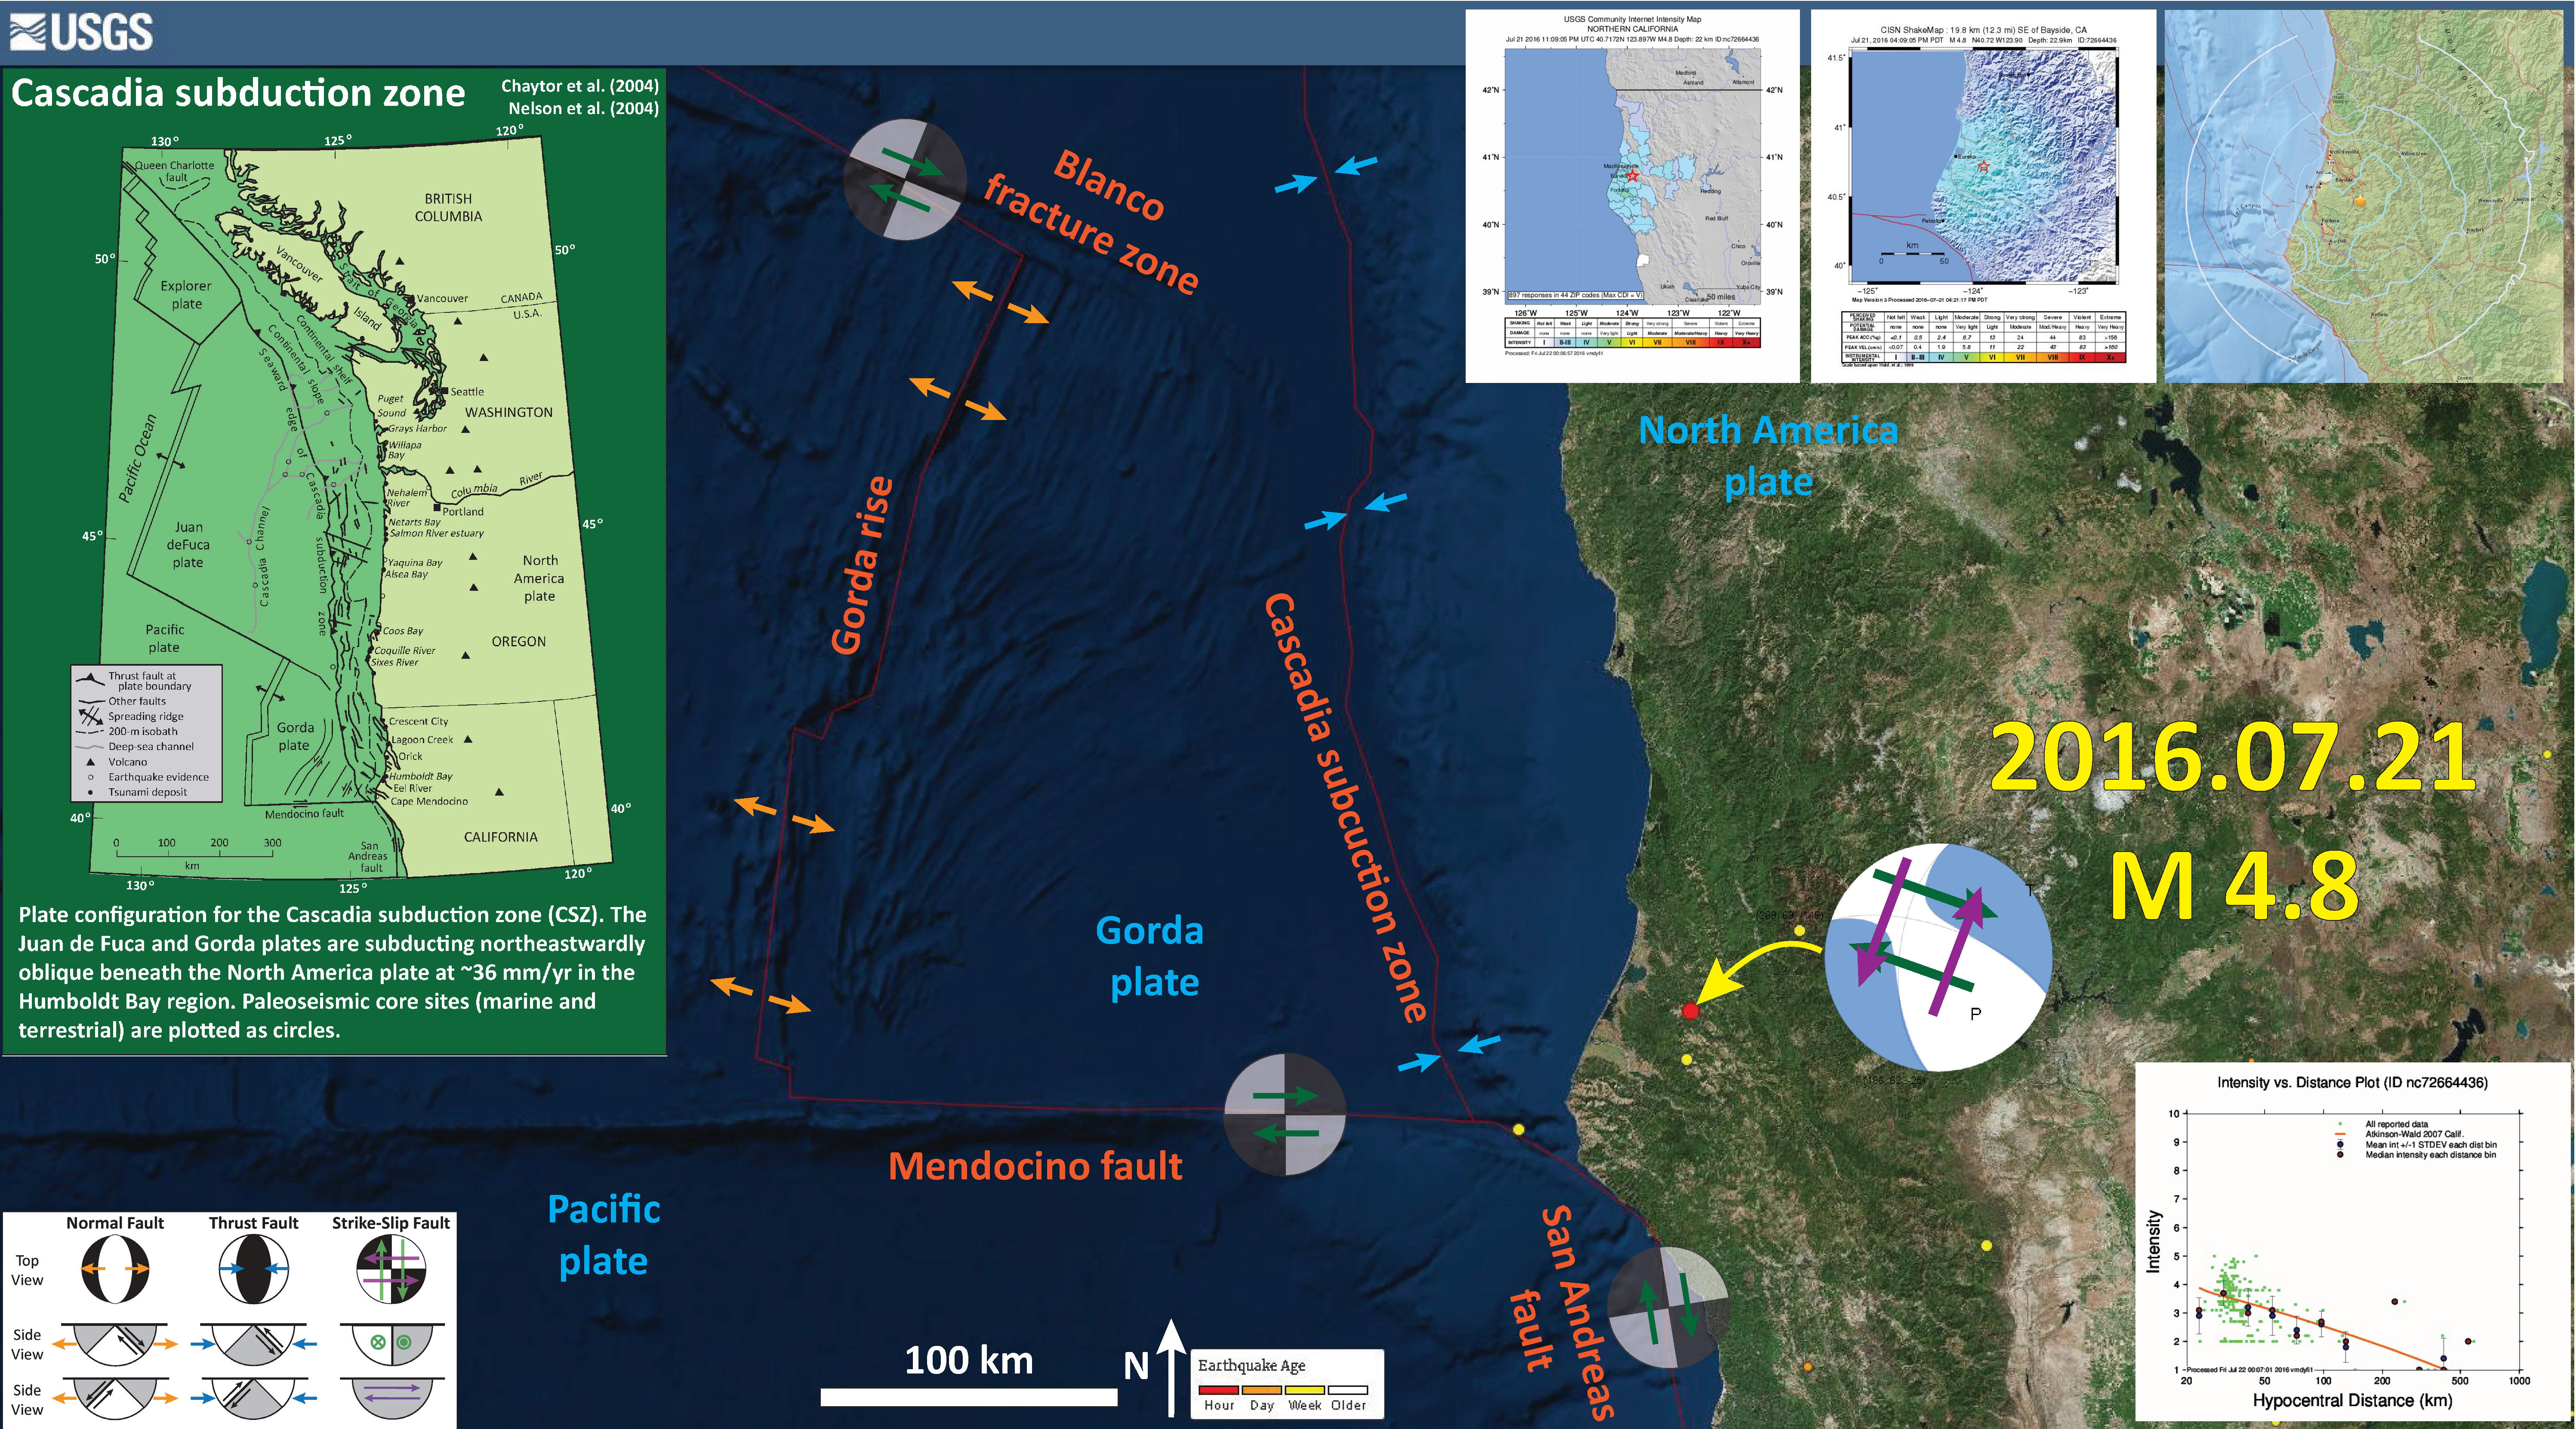
So, I put together another map with today’s earthquake in context with the historic seismicity and some other factors. Now the USGS magnitude is M = 4.7 and there is a moment tensor for this earthquake (that looks very similar to the focal mechanism, which is not always the case.). Here is my initial earthquake report here.
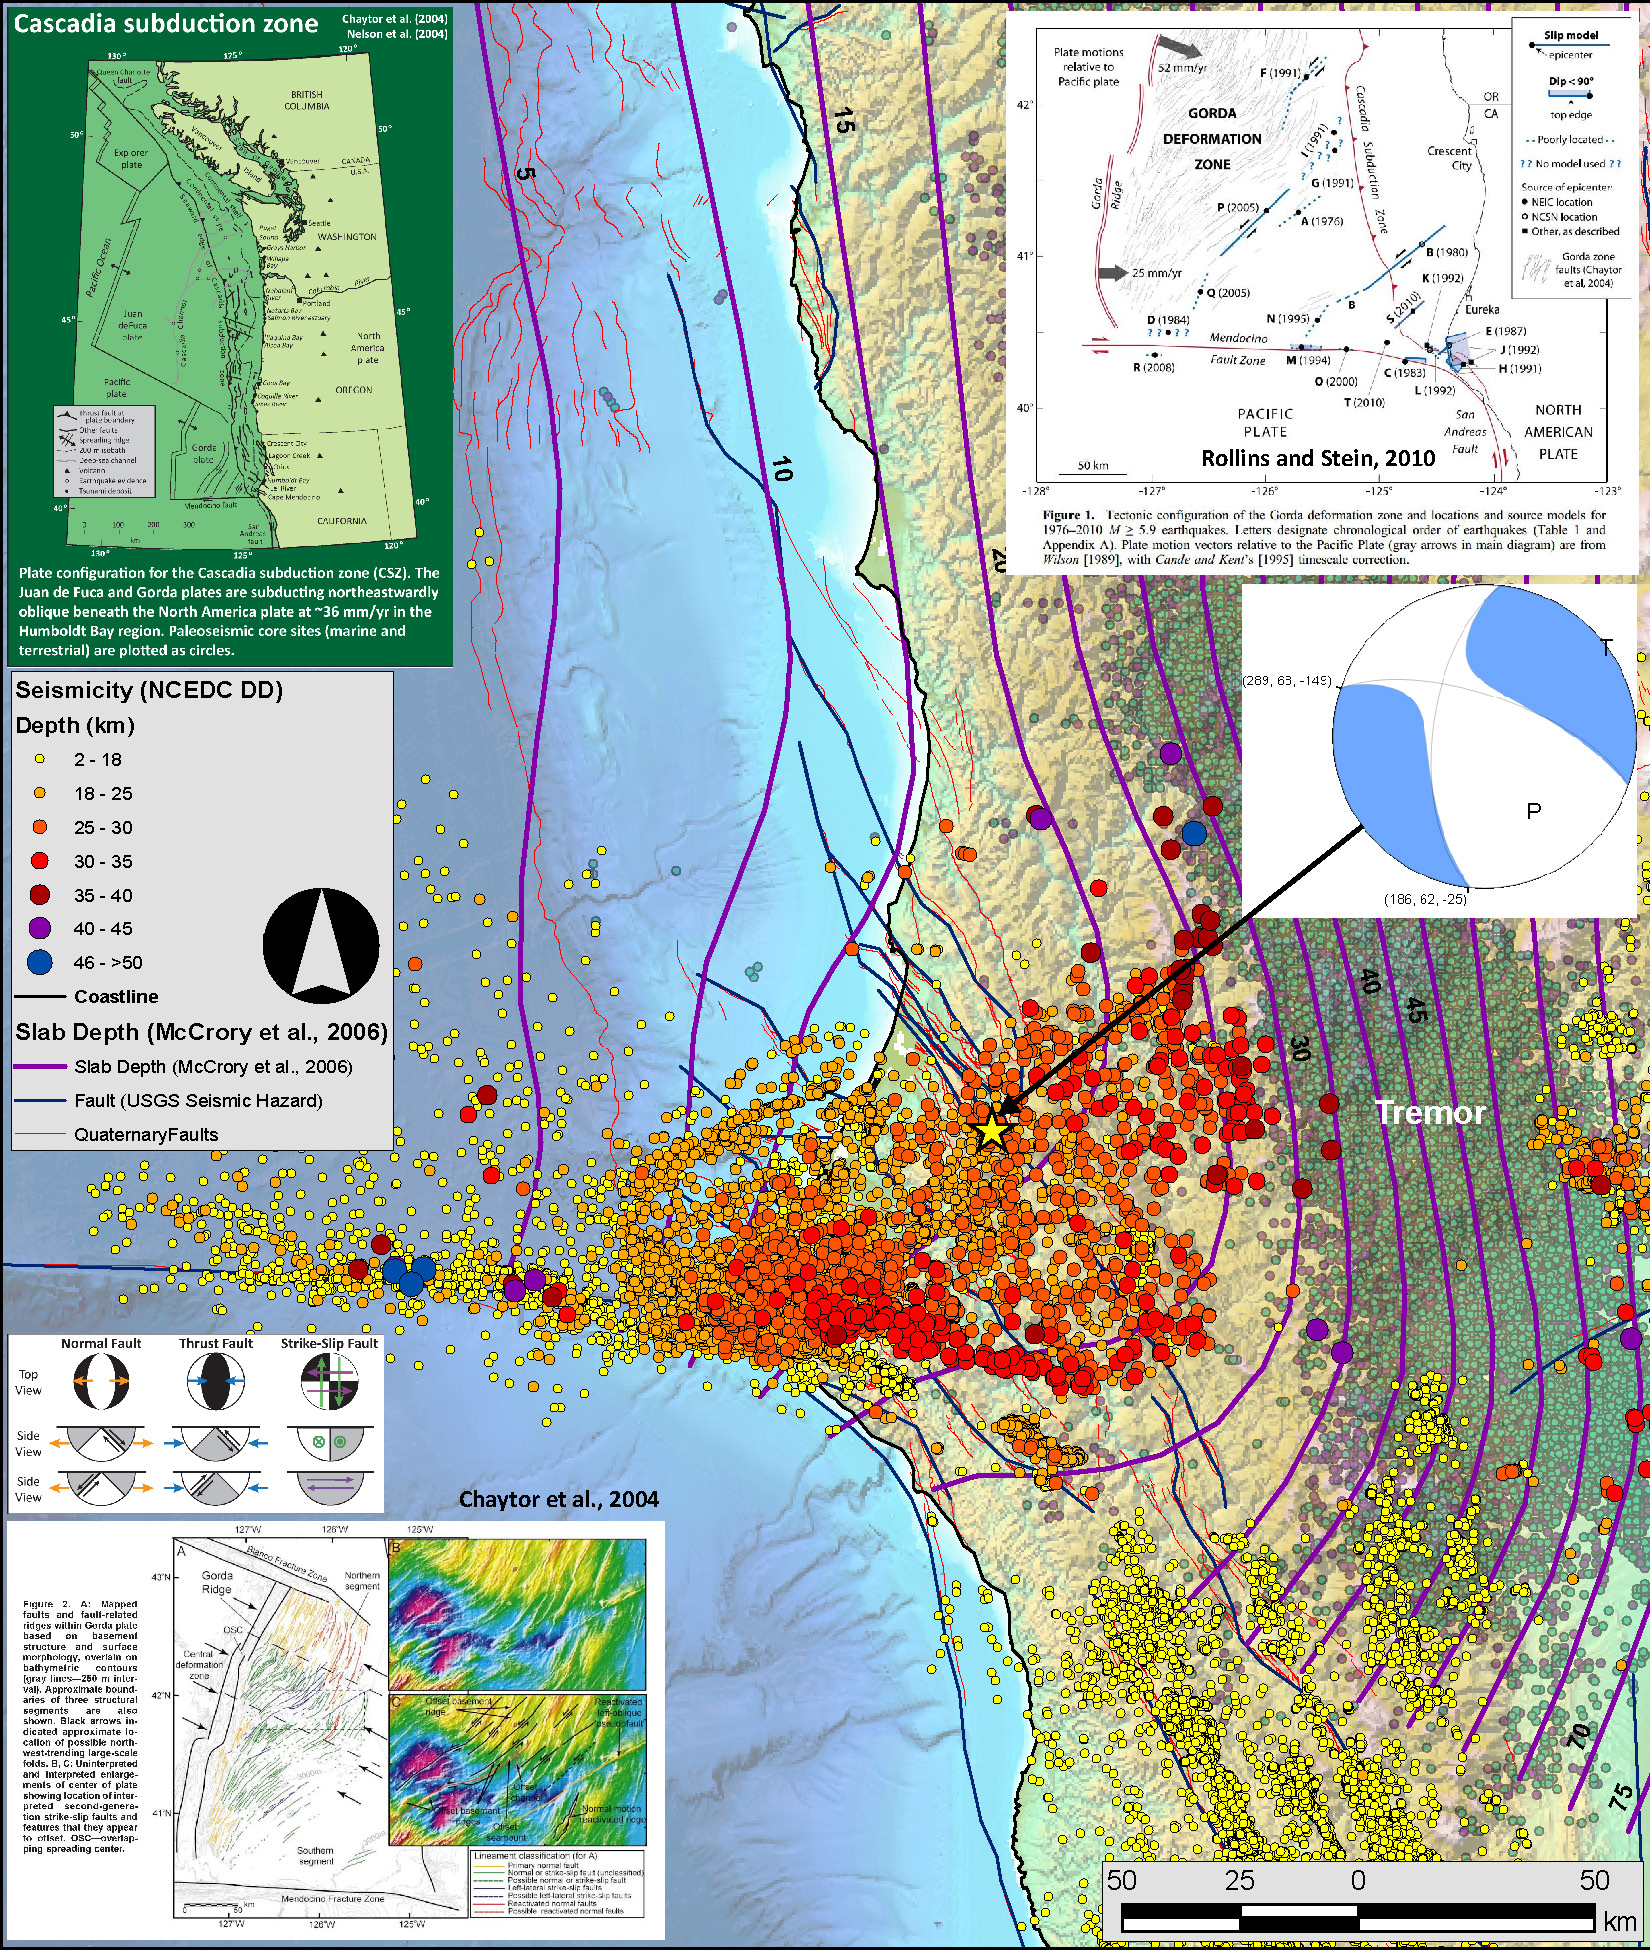
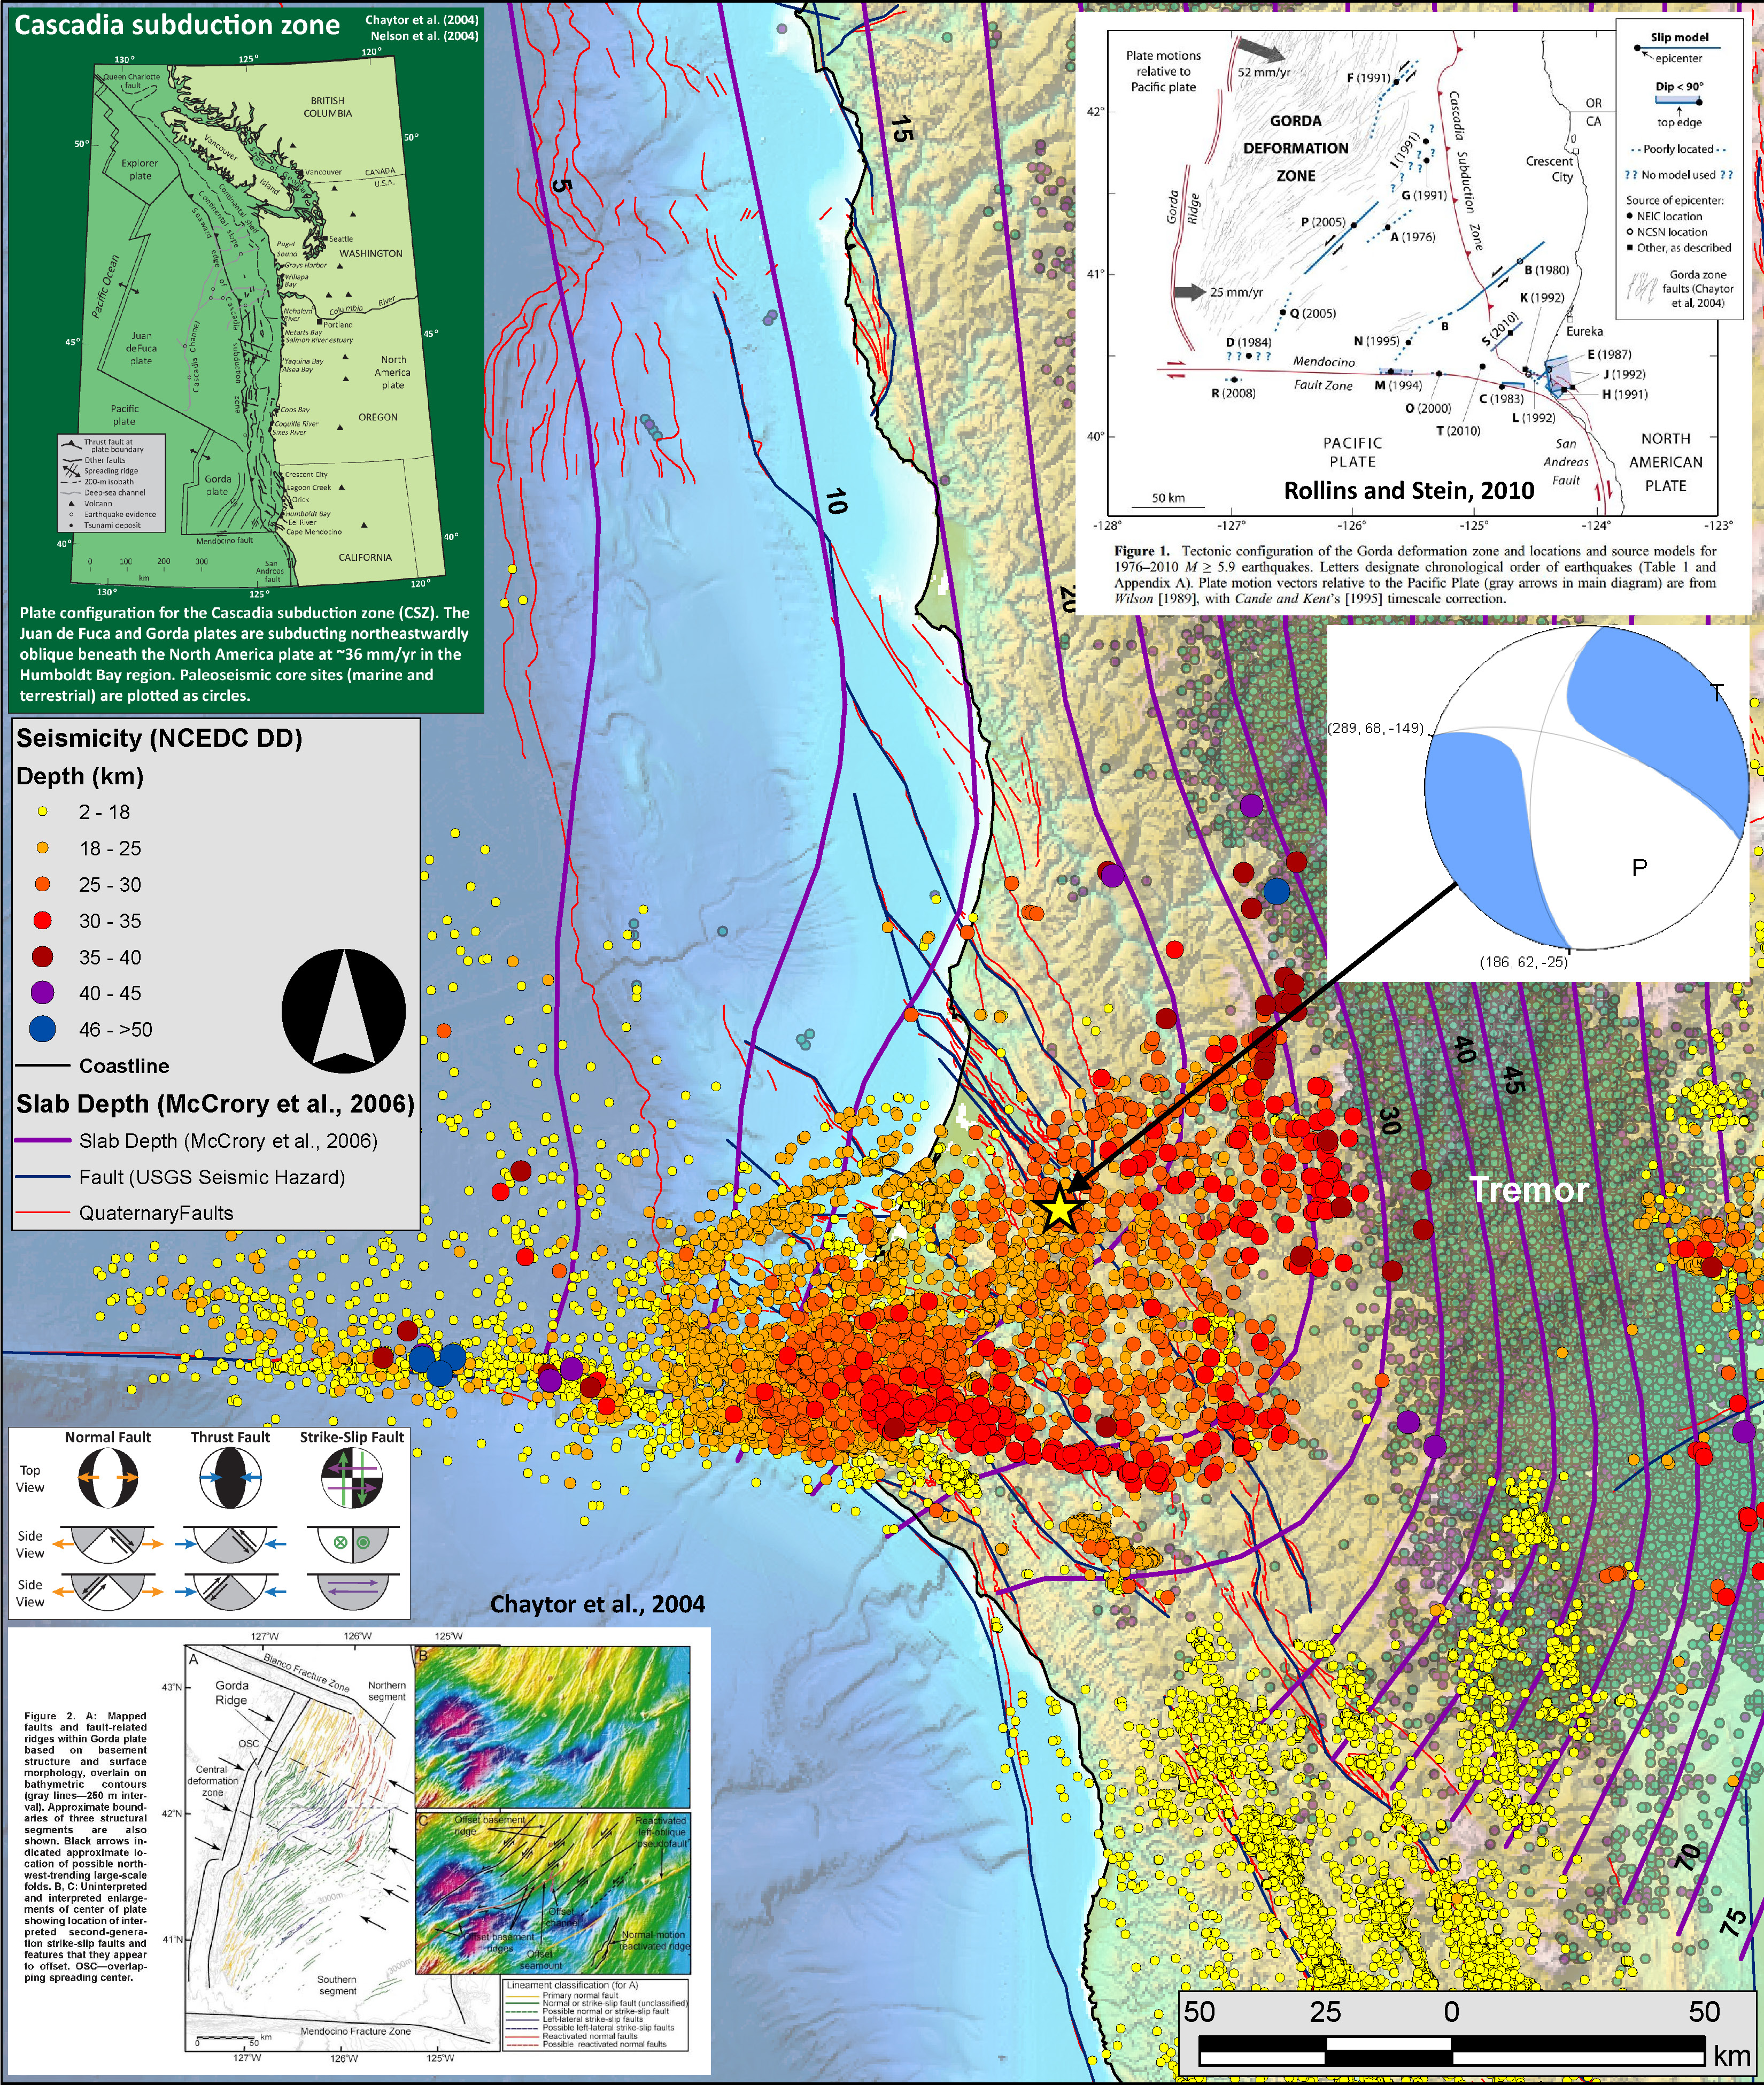
Below is a map showing the Northern California Earthquake Data Center (NCEDC) seismicity plotted. Today’s M 4.7 earthquake is plotted as a yellow star. This earthquake is similar to other earthquakes plotted in this region.
-
Here are the data plotted on the map.
- Northern California Earthquake Data Center Double Differenced earthquake epicenters, using the Northern California Earthquake Catalog (1984-2014). These epicenters are located by using the double difference method. Basically, earthquakes from a similar region are processed in such a way that, because they are in a similar region it is assumed that the seismic waves/rays travel through the same material (i.e. with the same seismic velocity). With this assumption, their positions can be better determined. These better positions are better relative to each other, but not in an absolute way. Here is an overview of the double difference method from Lamont Doherty. There is a software program that people use to process seismic data for this method (HypoDD).
- These earthquake epicenters are plotted vs depth with color and magnitude with circle diameter.
- I plot the depth to the slab in purple. These lines represent an estimate of the depth of the Cascadia subduction zone fault (McCrory et al., 2006).
- I also plot the current USGS active fault and fold database. The offshore fault map is incomplete, but has been remapped by Dr. Chris Goldfinger and will be released by the USGS in the coming months. I cannot plot the new faults until it is officially released. These faults are in red and then I also plot the faults used by the USGS national seismic hazard map team in black.
- On the eastern part of the map one may observe the non-volcanic tremor interpreted by the Pacific Northwest Seismic Network. These data can be downloaded by anyone. There is also a great online interface that lets one create animations. These tremor are basically small earthquakes that are not as resolvable on seismographs, so they cannot be located like regular earthquakes. Because of this, these tremor locations are only epicenters (no depth information).
- The background data are topographic data and bathmetric data compiled by Dr. Jason Chaytor when he was working at the Active Tectonics Lab at Oregon State University.
-
I also include some inset figures.
- In the upper left corner I place a map of the Cascadia subduction zone. This map shows the Cascadia subduction zone, along with other major plate boundary faults in the region (Gorda Rise, Mendocino fault, San Andreas fault). The Juan de Fuca and Gorda plates subduct norteastwardly beneath the North America plate at rates ranging from 29- to 45-mm/yr. Sites where evidence of past earthquakes (paleoseismology) are denoted by white dots. Where there is also evidence for past CSZ tsunami, there are black dots. These paleoseismology sites are labeled (e.g. Humboldt Bay). Some submarine paleoseismology core sites are also shown as grey dots. The two main spreading ridges are not labeled, but the northern one is the Juan de Fuca ridge (where oceanic crust is formed for the Juan de Fuca plate) and the southern one is the Gorda rise (where the oceanic crust is formed for the Gorda plate). The map also shows the interpretation of faults that are part of the internally deforming Gorda plate. These faults within the Gorda plate are responsible for the large damaging earthquakes in 1980, 2005, and 2010 (others also in 2014, and 2015).
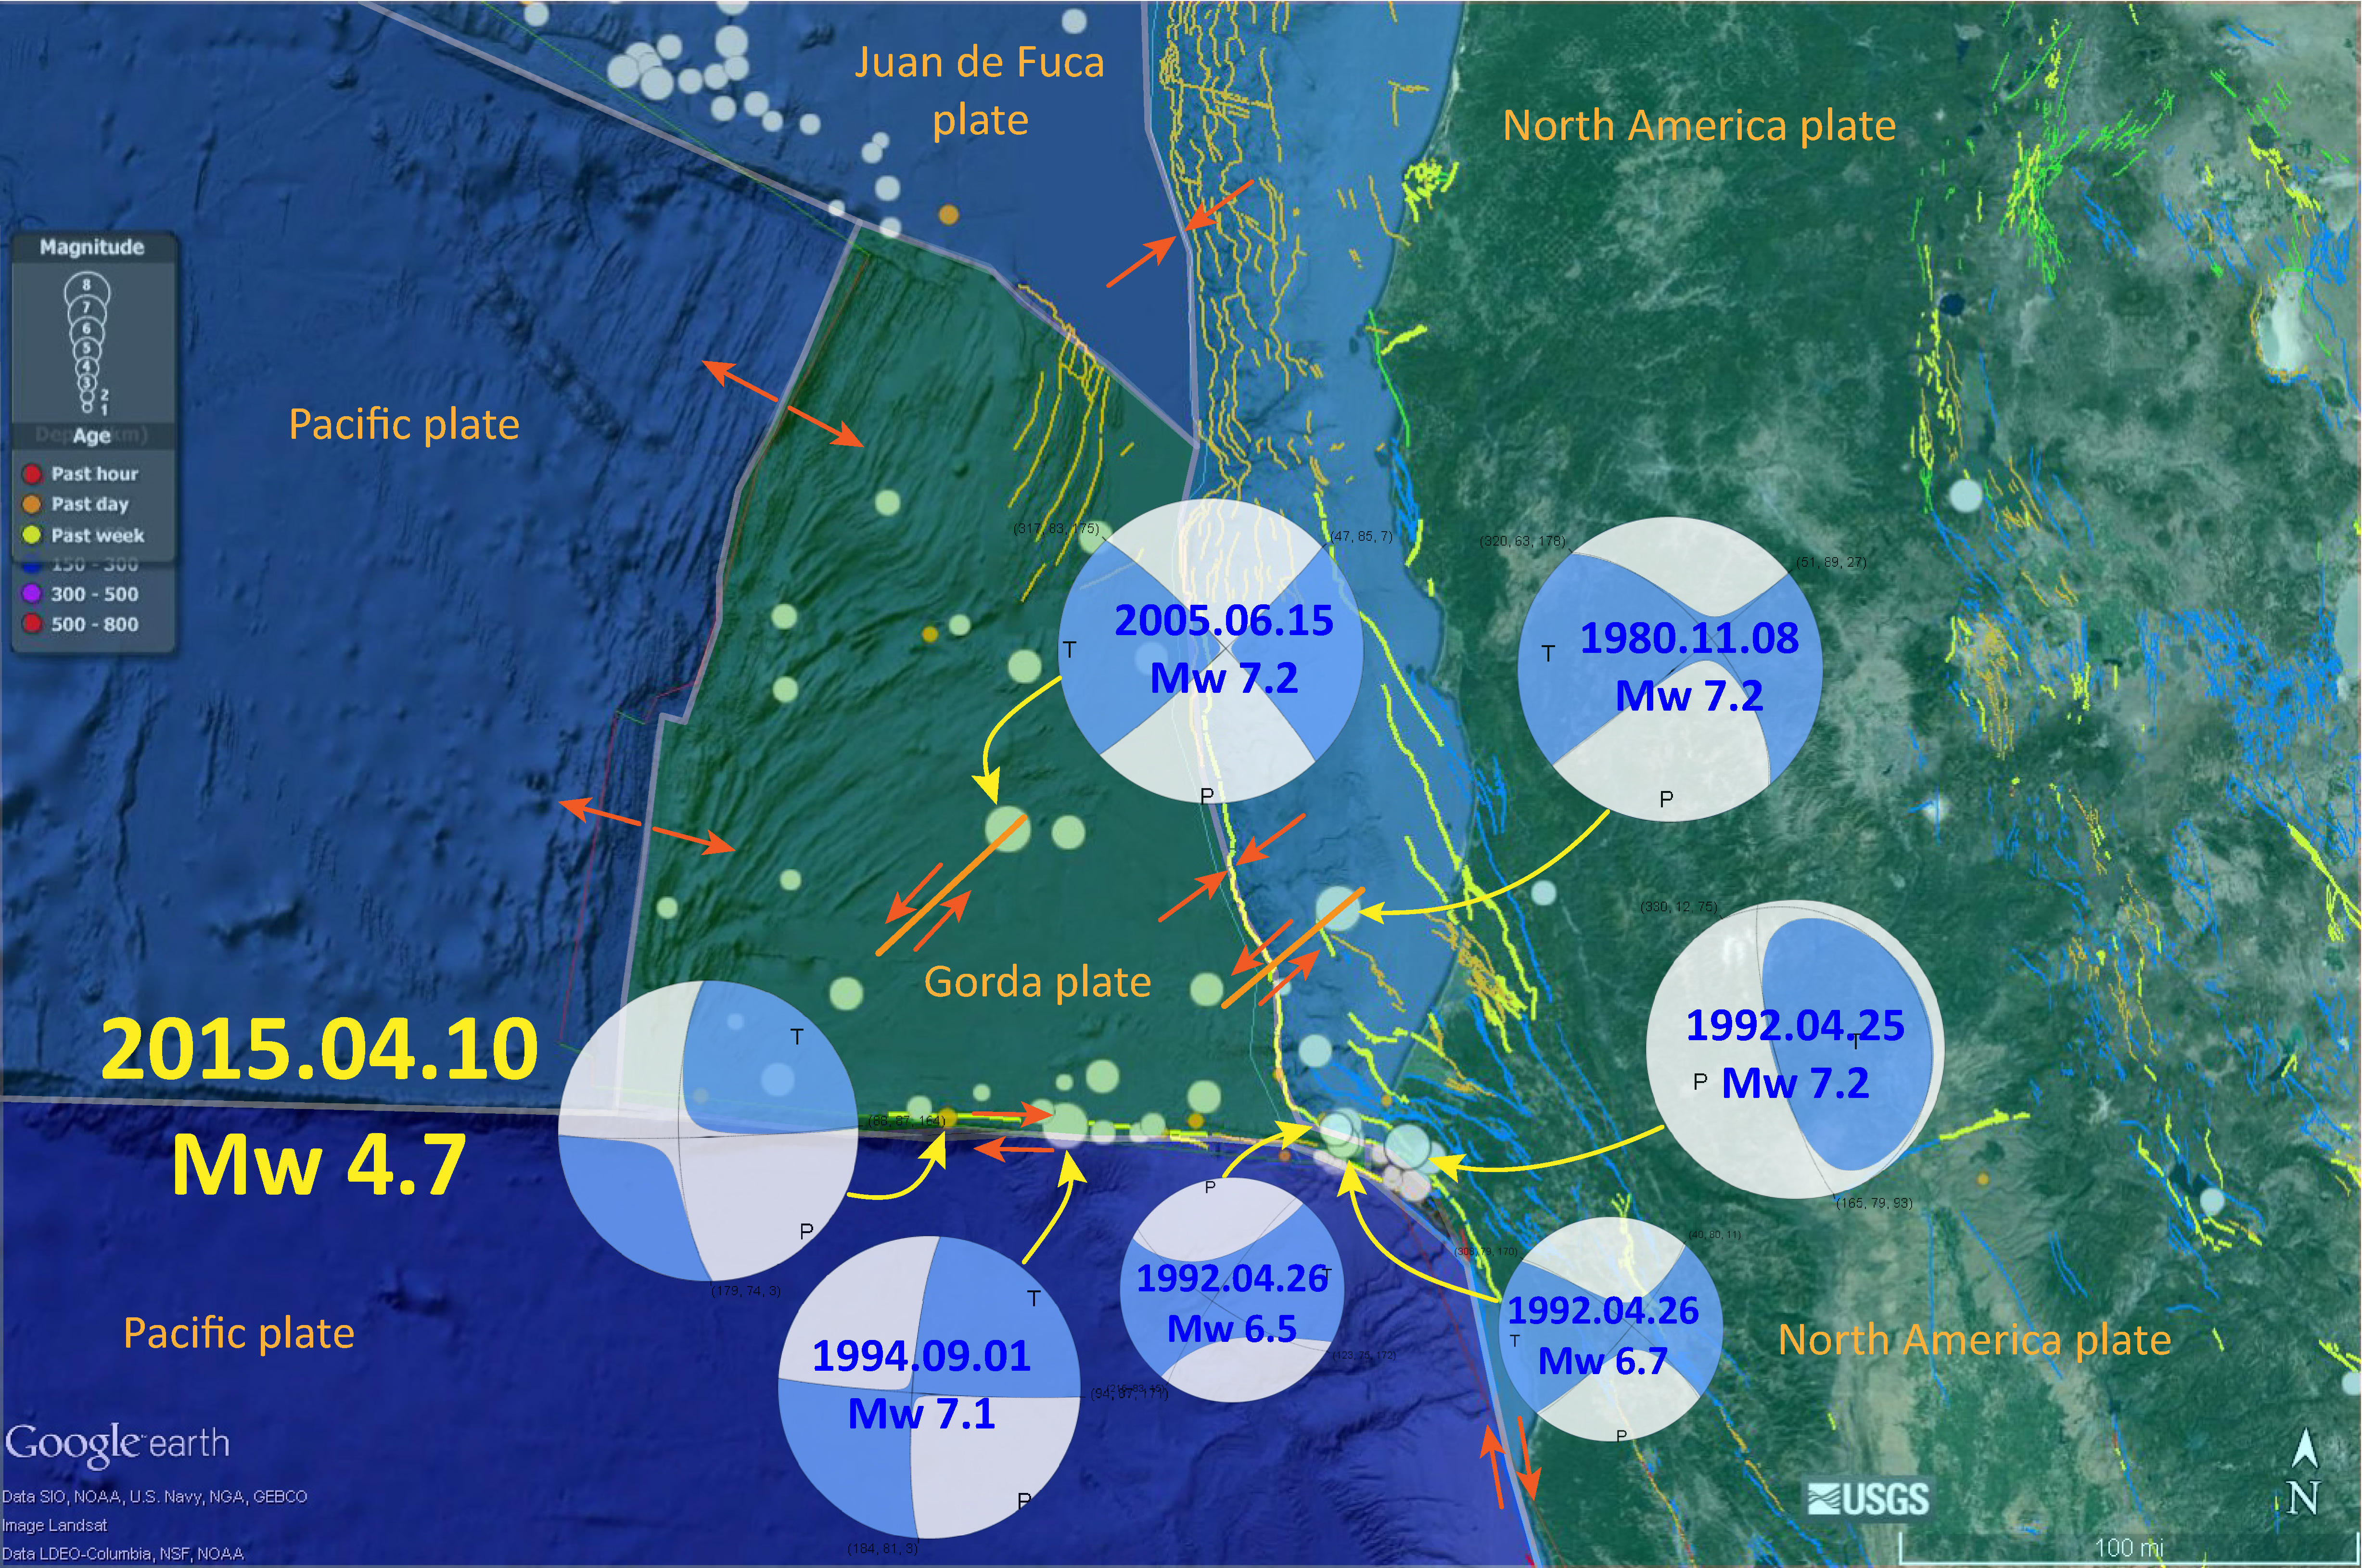
- In the upper right corner I place a figure from Rollins and Stein (2010) that shows their interpretations for some earthquakes in this region. This was published in response to the January 2010 Gorda plate earthquake. The faults are from Chaytor et al. (2004). The 1980, 1992, 1994, 2005, and 2010 earthquakes are plotted and labeled.
- In the lower left corner I place a figure from Chaytor et al. (2004) that shows their interpretation of the tectonics of the Gorda plate based upon high resolution bathymetric data (showing the shape of the seafloor).
- I also include the moment tensor and a moment tensor legend. There is more material from the USGS web sites about moment tensors and focal mechanisms (the beach ball symbols). Both moment tensors and focal mechanisms are solutions to seismologic data that reveal two possible interpretations for fault orientation and sense of motion. One must use other information, like the regional tectonics, to interpret which of the two possibilities is more likely.
Here is my initial earthquake report map as presented in the first earthquake report here.
Here is the seismic record from Jaime Wayne’s Netquake Seismometer. Here is a link to the netquake page. The seismometer is located near Orick.
In this map below (from a Mendocino fault earthquake on 2016/01/01), I label a number of other significant earthquakes in this Mendocino triple junction region. Another historic right-lateral earthquake on the Mendocino fault system was in 1994. There was a series of earthquakes possibly along the easternmost section of the Mendocino fault system in late January 2015, here is my post about that earthquake series.
References:
- Chaytor, J.D., Goldfinger, C., Dziak, R.P., Fox, C.G., 2004. Active deformation of the Gorda plate: Constraining deformation models with new geophysical data. Geology 32, 353-356.
- McCrory, P. A., Blair, J. L., Oppenheimer, D. H., and Walter, S. R., 2006. Depth to the Juan de Fuca slab beneath the Cascadia subduction margin; a 3-D model for sorting earthquakes U. S. Geological Survey
- Nelson, A.R., Kelsey, H.M., Witter, R.C., 2006. Great earthquakes of variable magnitude at the Cascadia subduction zone. Quaternary Research 65, 354-365.
- Rollins, J.C., Stein, R.S., 2010. Coulomb Stress Interactions Among M ≥ 5.9 Earthquakes in the Gorda Deformation Zone and on the Mendocino Fault Zone, Cascadia Subduction Zone, and Northern San Andreas Fault. Journal of Geophysical Research 115, 19 pp.
bit messy up there!
My wife only felt the very strong jolt like a truck had bumped the house, and no rollers others reported. I see the epicenter was nearby.
yeah, me too
Nice! I like how you presented the seismicity with all the different dynamics of the triple junction.