There was just another earthquake in Italy. This one is a larger magnitude M = 6.6. This region has been especially seismically active since August 2016.
-
Here are the USGS websites and Earthquake reports for this region of Italy.
- 2016.08.23 M 6.2 USGS website and Earthjay Earthquake Report
- 2016.10.26 M 5.5 USGS website and Earthjay Earthquake Report
- 2016.10.26 M 6.1 USGS website and Earthjay Earthquake Report
- 2016.10.30 M 6.6 USGS website and Earthjay Earthquake Report
This earthquake is north of the region that had an M 6.3 earthquake in 2009 that led to an interesting (putting it nicely) interaction between scientists, public employees/politicians, and the legal system. Basically, several seismologists were sentenced to prison. More on this is found online, for example, here and here.
Below is my interpretive map that shows the epicenter, along with the shaking intensity contours. These contours use the Modified Mercalli Intensity (MMI) scale. The MMI is a qualitative measure of shaking intensity. More on the MMI scale can be found here and here. This is based upon a computer model estimate of ground motions, different from the “Did You Feel It?” estimate of ground motions that is actually based on real observations. There is a legend for MMI intensities in the upper part of the interpretive poster below.
I placed a moment tensor / focal mechanism legend on the poster. There is more material from the USGS web sites about moment tensors and focal mechanisms (the beach ball symbols). Both moment tensors and focal mechanisms are solutions to seismologic data that reveal two possible interpretations for fault orientation and sense of motion. One must use other information, like the regional tectonics, to interpret which of the two possibilities is more likely. The tectonics of this region has many normal (extensional) faults, which explain the extensional moment tensor.
-
I include some inset figures and maps.
- In the upper left corner I include estimates of damage to people (possible fatalities) and their belongings from the Rapid Assessment of an Earthquake’s Impact (PAGER) report. More on the PAGER program can be found here. An explanation of a PAGER report can be found here. PAGER reports are modeled estimates of damage. On the top is a histogram showing estimated casualties and on the right is an estimate of possible economic losses. This PAGER report suggests that there will be quite a bit of damage from this earthquake (and casualties). This earthquake has a high probability of damage to people and their belongings.
- In the upper right corner is a map showing the faulting mapped in the region surrounding and including Italy (Billi et al., 2006). There is a convergent plate boundary along the eastern part of Italy (part of the Alpide belt, a convergent boundary that extends from the Straits of Gibraltar to Australia). This fault system dips westward and is onshore in the south, but extends offshore into the Adriatic Sea in central-northern Italy. In the central part of Italy is a series of north-northwest striking extensional faults. It is these extensional (normal) faults that are responsible for the damaging seismicity in this region of central Italy. This includes the 1915, 1997, 2009, and 2016 earthquakes.
- To the right of the Billi et al. (2006) fault map is a plot showing the seismicity from the last year. Today’s earthquakes are plotted as orange circles and the epicenters from August are plotted as gray circles.
- To the left of this map is a figure that shows the median PGA (Peak Ground Acceleration, units of g where g = 9.8 m/s2) that has a 10% probability of exceedance (PE) in the next 50 years. This model assumes a Vs30 greater than 800 m/s. Vs is the average seismic velocity in the upper 30 meters. Vs30 is a proxy used for global to regional estimates of seismic hazard.I include their original figure captions as blockquote. This is from Stucchi et al., 2011.
- In the lower right corner are two panels with results from the USGS “Did You Feel It?” website. The upper panel shows results from felt reports. The circles are colored vs. MMI intensity. The lower panel is a plot that shows these reports as their MMI values vary with distance from the earthquake (the horizontal axis). There are Ground Motion Prediction Equations that are empirical models (that model shaking intensity vs. distance) that are used to estimate shaking for this earthquake. The output from this model is the source of data for the shakemaps and the PAGEr damage estimates. Note how the attenuation relations (how the seismic energy is absorbed with distance from the earthquake) fit the green line (GMPE relations for lithosphere and earthquakes in California).
- In the lower left corner is a map that shows seismicity for this region on maps and cross sections. I placed orange stars in the approximate location of the October, 2016 earthquakes. These earthquakes happen to appear right on the center of cross section b (the lowermost cross section on the right). It appears that these earthquakes are rupturing along the Mt. Vettore fault.
- Here is the shaking intensity map (using the MMI color scale).
- This is the GMPE regression for the above map.


- Here is the USGS PAGER alert.

-
Here are some other maps that might help. (well, one so far)
- This Billi et al. (2006) map shows some of these west dipping normal faults in central Italy, just south of the Apennines.
- There are some excellent maps and figures from a study from 2004 (Boncio et al, 2004). This material was posted on twitter here.

- Below is my interpretive poster from the August swarm. For more information about the figures displayed on this poster, here is the complete report for this swarm.
- David Schwartz (USGS) noted that August’s earthquake is “between the 1997 Assisi aftershock zone and the north end of the 2009 l’aquila rupture” and may be a “foreshock to a 1915-like Fucino rupture.” So we need to look at these two earthquakes to learn more about what Schwartz is talking about. Here is a web post about an INQUA workshop held in “Pescina, to commemorate the centenary of the 13/1/1915 M7 Fucino Earthquake.” This was posted by Stephanie Baize who is also on twitter. Follow him to learn more about tonight’s earthquake. There is a great paper that discusses the 1915 earthquake sequence that Schwartz was talking about here (Galadini and Galli, 1999). A more recent paper also discusses the faulting in this region (Palumbo et al., 2004). Today’s earthquakes also lie in this seismic gap.
- Below is my interpretive poster from the earthquakes from a few days ago. For more information about the figures displayed on this poster, here is the complete report for this swarm.
- Here is a map that shows the earthquakes from the past few months, for magnitudes greater than or equal to M = 2.5. Note the M 6.6 earthquake (the largest orange circle) is between the 2016.08.23 M 6.2 earthquake (the largest gray circle in the south) and the 2016/10/28 M 6.2 earthquake (the largest yellow circle in the north).

- Boncio et a. (2004) present a remarkable assessment of the seismic hazard in this region based on a 3-D model for seismogenic sources. I present some of their figures below. I include their original figure captions as blockquotes.
- This map shows a detailed view of the normal faults in the region. Today’s earthquake is in the region shown in box 3, east of the Umbra Valley.
- This map shows an even more detailed and large scale view of the faults and seismicity in this region. Today’s earthquakes align to the north of Norcia, approximately along the cross section labeled “sec B.” The two cross sections are in the lower right part of the figure, with section B the lowermost cross section. Today’s earthquake may be on the AF2, the C-NFs (Colfiorito-Norcia fault systems), or MVf (Mt. Vettore fault). The AF2 fault is a proposed low angle detachment fault. These types of faults are controversial in that there are arguments about whether they are seismogenic or not. This year’s Pacific Cell Friends of the Pleistocene field trip in Panamint Valley presented research results that attempted to address this question. In Panamint Valley there are faults that have similar configurations as these faults in Italy.
- This map shows a smaller scaled view (than the above figure) with focal mechanisms and cross sections (with structural interpretations). Hypocenters are also plotted on these cross sections. Today’s earthquakes are just south of cross section b. (earthquakes happened here in 1997)

Digital elevation model of central Italy with active normal faults of the Umbria-Marche-Abruzzo Apennines and parameters of active stress tensors obtained by inversion of focal mechanisms of background microseismicity (1), aftershock sequences (2, 3, 4, 5) or striated active faults in seismic areas (6); stress data from Brozzetti and Lavecchia (1994), Boncio and Lavecchia (2000a) and Pace et al. (2002a); the stress axes are given as trend (first three numbers) and plunge (last two numbers).

Geological cross sections from seismic reflection profiles across the Gubbio, Gualdo T. and Colfiorito seismic areas (from Boncio et al., 1998; Boncio and Lavecchia, 2000b); epi- and hypocentral distribution of back-ground microseismicity recorded in the Umbria-Marche Apennines and rheological profiles (strength envelopes in critical stress difference, σ1–σ3) built for two different thermal contexts (50 and 40 mW/m2 surface heat flow, see Figure 3 for location); the depth of the brittle-plastic transition on rheological profiles is indicated by arrows; the used rheological parameters are indicated: crustal layering is from DSS data; A (empirical material constant), n (stress exponent) and E (activation energy) are creep parameters; ´ε = longitudinal strain rate (calculated by balancing of a regional geologic section; Figure 5 in Boncio et al., 2000); see text for further details.

Epicentres of the major seismic sequences of the last twenty years (Gubbio, 1984; Colfiorito, 1997; Norcia, 1979; Sangro, 1984) plus three small seismic sequences in the L’Aquila area (1992, 1994 and 1996); seismotectonic sections and rheological profiles built according to the local thermal context. The dashed line (sections ‘a’ and ‘b’) represents the AF low-angle extensional detachment; arrows in seismotectonic sections indicate the maximum depth-extent of the activated seismogenic faults as suggested by the best defined aftershock volume; rheological parameters as in Figure 7; in the southern Abruzzo area, creep strengths for geologic and geodetic longitudinal strain rates are compared (geologic strain rate calculated from data of Galadini and Galli, 2000; geodetic strain rate from D’Agostino et al., 2001); seismological data from Amato et al. (1998); Boncio (1998); Boncio et al. (2004); Cattaneo et al. (2000); De Luca et al. (2000); Deschamps et al. (1984); Ekstrom et al. (1998); Haessler et al. (1988); Harvard CMT database at www.seismology.harvard.edu.
- Here is a poster that shows the seismic hazard for Europe (Giardini et al., 2013).

- Here is a more detailed seismic hazard map for Italy (Stucchi et al., 2011). This shows the median PGA (Peak Ground Acceleration, units of g where g = 9.8 m/s2) that has a 10% probability of exceedance (PE) in the next 50 years. This model assumes a Vs30 greater than 800 m/s. Vs is the average seismic velocity in the upper 30 meters. Vs30 is a proxy used for global to regional estimates of seismic hazard.I include their original figure captions as blockquote.
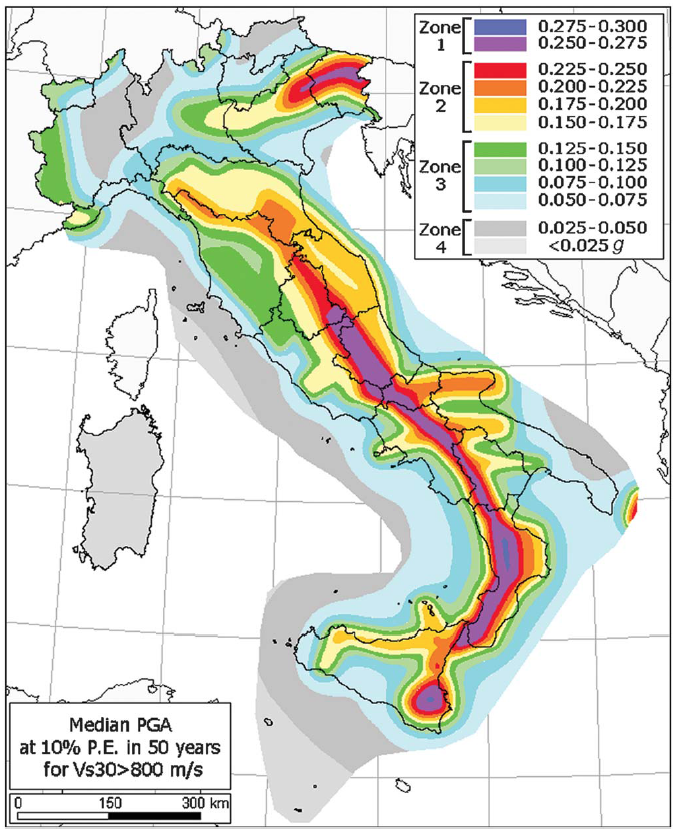
The seismic hazard map showing the PGA distribution with 10% probability of exceedance in 50 years, computed on hard ground (VS30 > 800 m=s).
- Billi et al., 2006.
- Boncio et al., 2004. Defining a model of 3D seismogenic sources for Seismic Hazard Assessment applications: The case of central Apennines (Italy) in Journal of Seismology, v. 8, p. 417-125.
- Galadini, F. and Galli, P., 1999. The Holocene paleoearthquakes on the 1915 Avezzano earthquake faults (central Italy): implications for active tectonics in the central Apennines in Tectonophysics, v. 308, p. 143-170.
- Giardini, D., Woessner, J., Danciu, L., Cotton, F., Grünthal, G., Pinho, R., and Valensise, L.., and the SHARE Consortium, 2013. SHARE European Seismic Hazard Map for Peak Ground Acceleration, 10% Exceedance Probabilities in 50 years, doi: 10.2777/30345, ISBN-13, 978-92-79-25148-1.
- Palumbo et al., 2004. Slip history of the Magnola fault (Apennines, Central Italy) from 36Cl surface exposure dating: evidence for strong earthquakes over the Holocene in Earth and Planetary Science Letters, v. 225, p. 163–176.
- Stucci, M., Meletti, C., Montaldo, V., Crowley, H., Calvi, G.M., and Boschi, E., 2011. Seismic Hazard Assessment (2003–2009) for the Italian Building Code in BSSA, v. 101, no. 4, p. 1885-1911.
- Woudloper, 2009. Tectonic map of southern Europe and the Middle East, showing tectonic structures of the western Alpide mountain belt.
Poor Italy❤️
yeah