
Last night we had a shallow crustal earthquake along the Alaska Peninsula.
Here is the USGS website for this M = 6.2 earthquake.
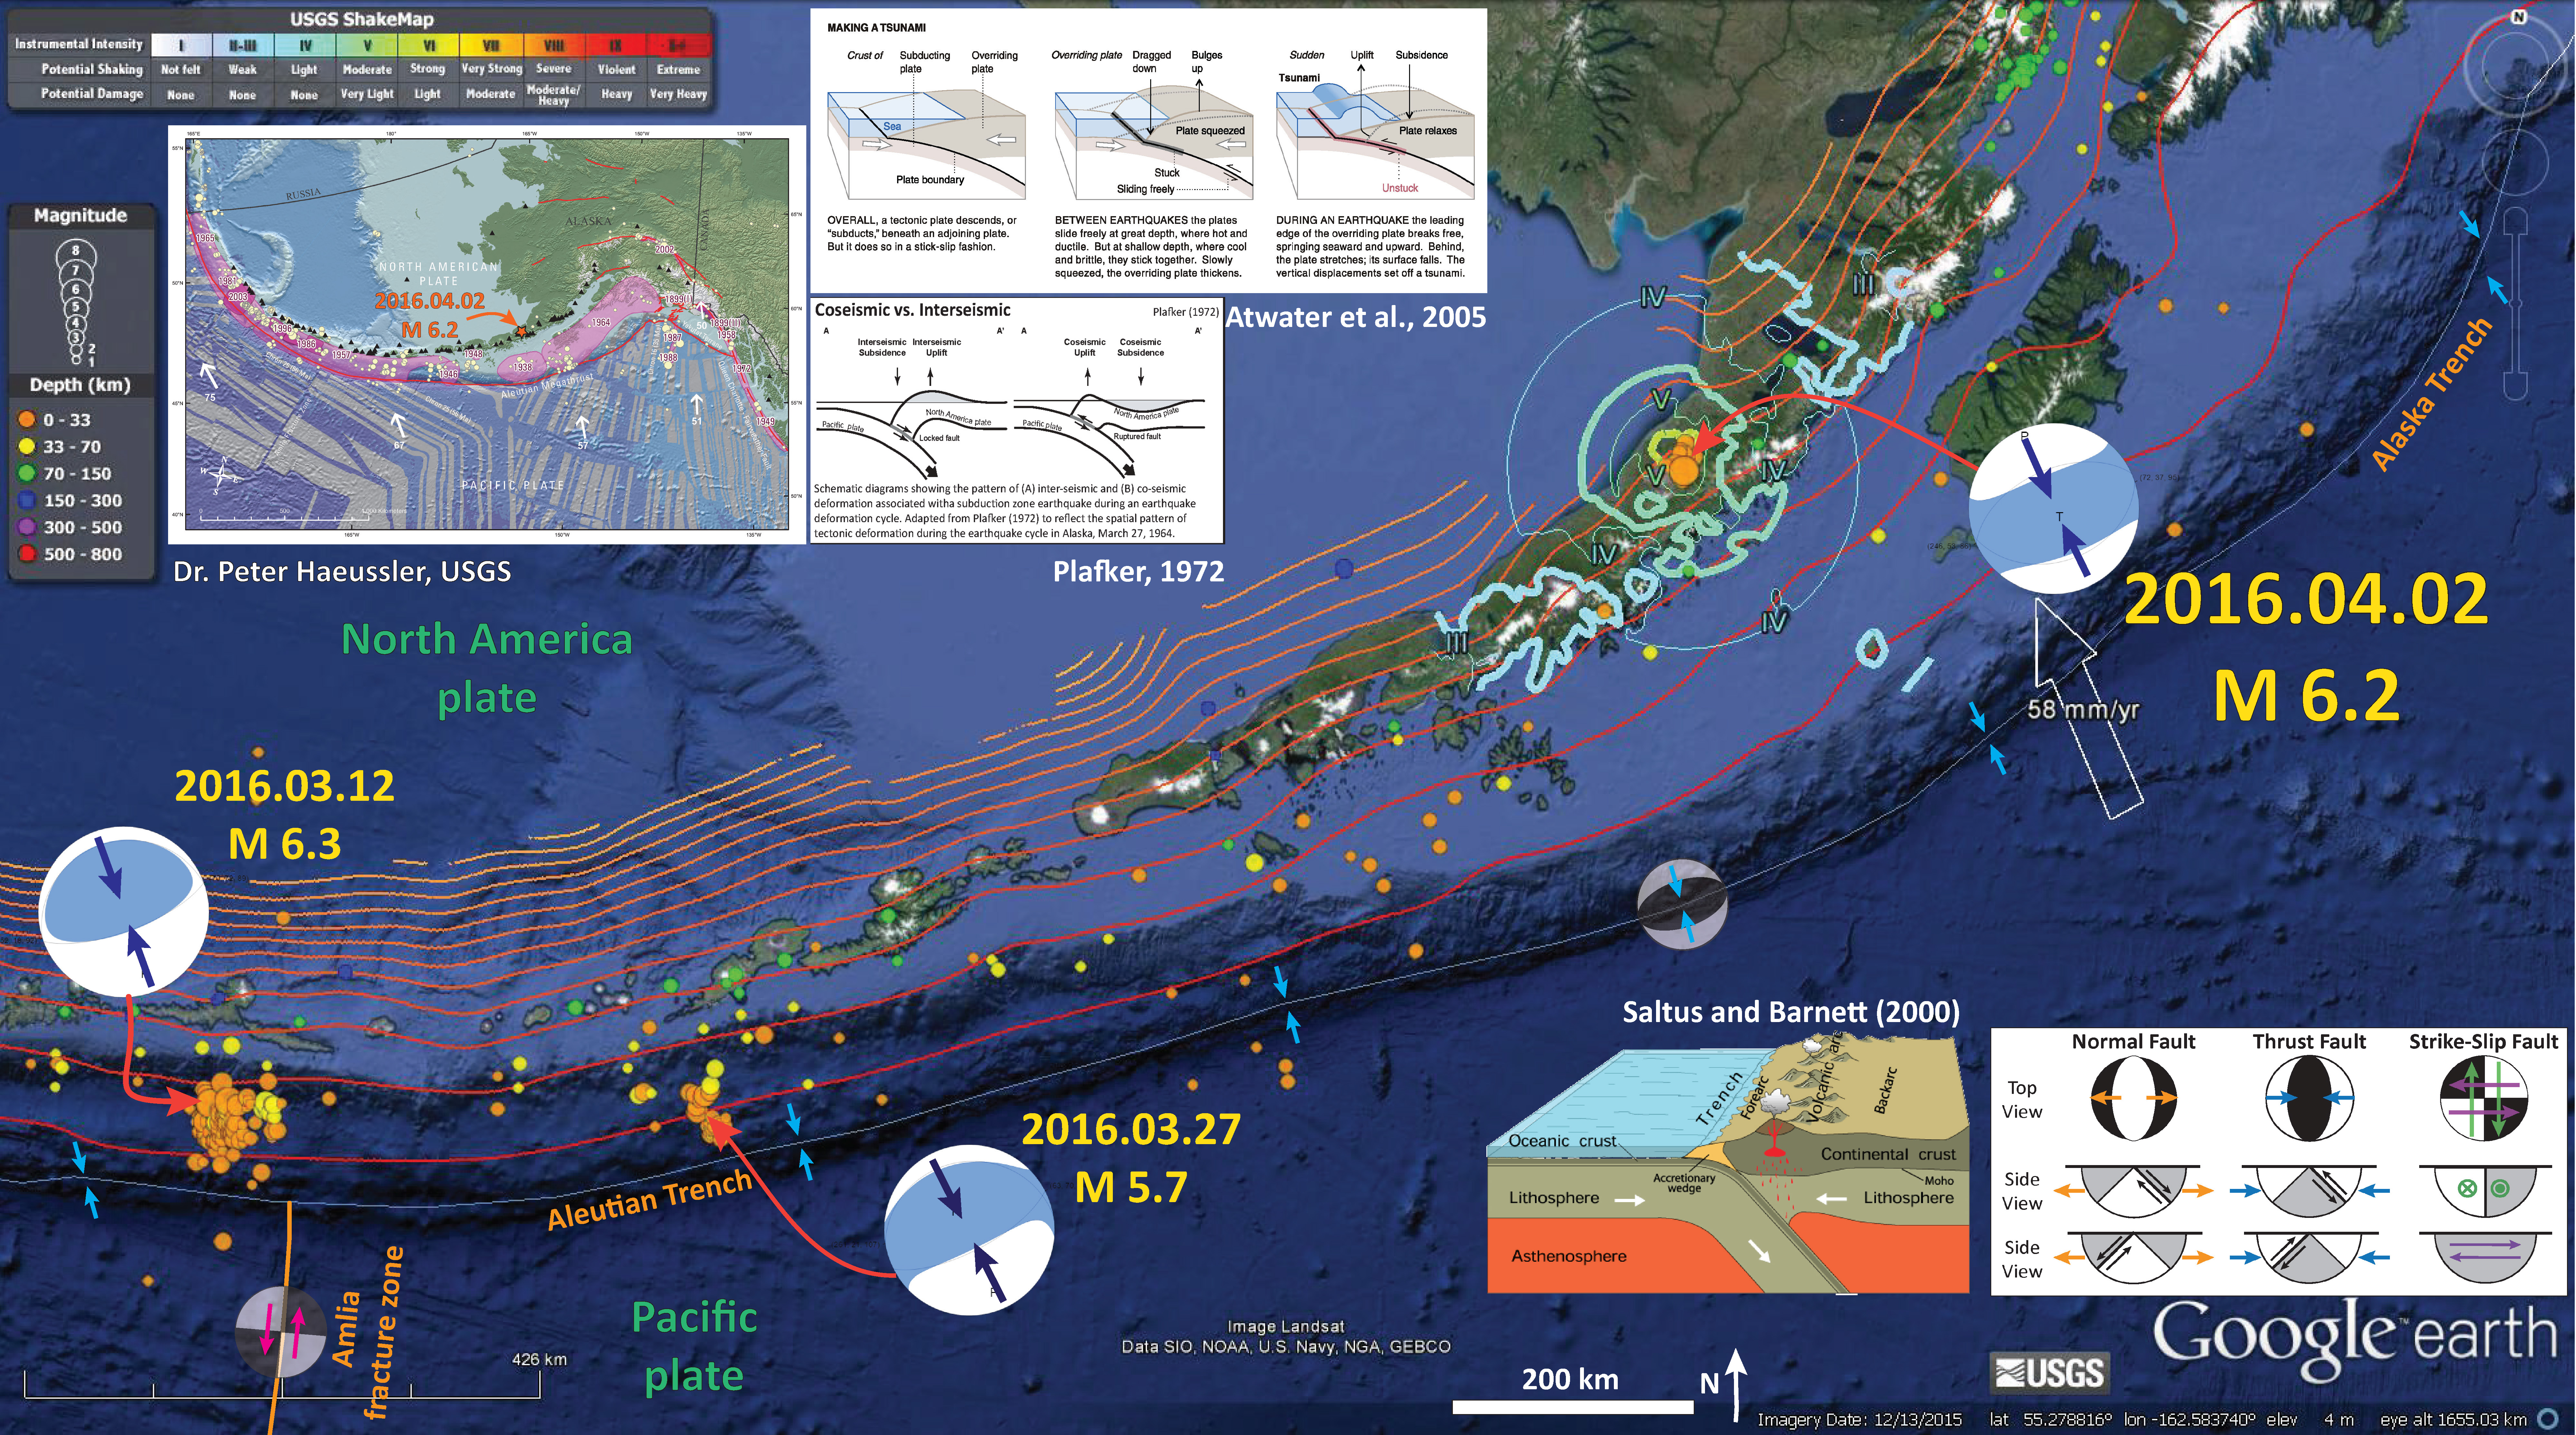
Below is my interpretive map where I use Google Earth and the kml (keyhole markup language) files from the USGS to plot epicenters, Modified Mercalli Intensity Scale (MMI) contours, and the subduction zone slab contours for this region (Hayes et al., 2012). I plot the USGS moment tensor from this M 6.2 earthquake, along with moment tensors for earthquakes further west along the Aleutian Trench (see below).
The MMI is a qualitative measure of shaking intensity. More on the MMI scale can be found here and here.
The red-orange-yellow lines are slab contour lines from Hayes et al. (2012). These lines are a best estimate for the depth to the subduction zone fault. These are based largely upon seismicity and there is currently an effort to update these contours to integrate other data types. This M 6.2 earthquake is too shallow to be on the megathrust, so it is clearly a crustal earthquake in the North America plate. The USGS depth is 17.9 km, but the slab depth is between 80 and 100 km at this location (the slab contours have 20 km intervals).
There is a legend that shows how moment tensors can be interpreted. Moment tensors are graphical solutions of seismic data that show two possible fault plane solutions. One must use local tectonics, along with other data, to be able to interpret which of the two possible solutions is correct. The legend shows how these two solutions are oriented for each example (Normal/Extensional, Thrust/Compressional, and Strike-Slip/Shear). There is more about moment tensors and focal mechanisms at the USGS.
-
I include some inset figures.
- In the upper left corner, I place a map created by Dr. Peter Haeussler, USGS, which shows the historic earthquakes along the Alaska and Aleutian subduction zones. I place the epicenter from today’s earthquake as a red star. Note that this earthquake is near the possible segment boundary shown as the boundary between the 1938 and 1964 earthquakes.
- To the right of Hauessler’s map is a figure from Atwater et al. (2005) that shows the earthquake cycle and how a tsunami can be generated at a subduction zone.
- Below the Atwater figure I show a cross section of a subduction zone through the two main parts of the earthquake cycle. The interseismic part (in-between earthquakes) and the coseismic part (during earthquakes). This was developed by George Plafker and published in his 1972 paper on the Good Friday Earthquake.
- In the lower right corner, I include the moment tensor legend.
- To the left of that is from Saltus and Barnett (2000) shows an oblique cross section of the Aleutian subduction zone that is a part of the “Eastern Aleutian Volcanic Arc Digital Model.’
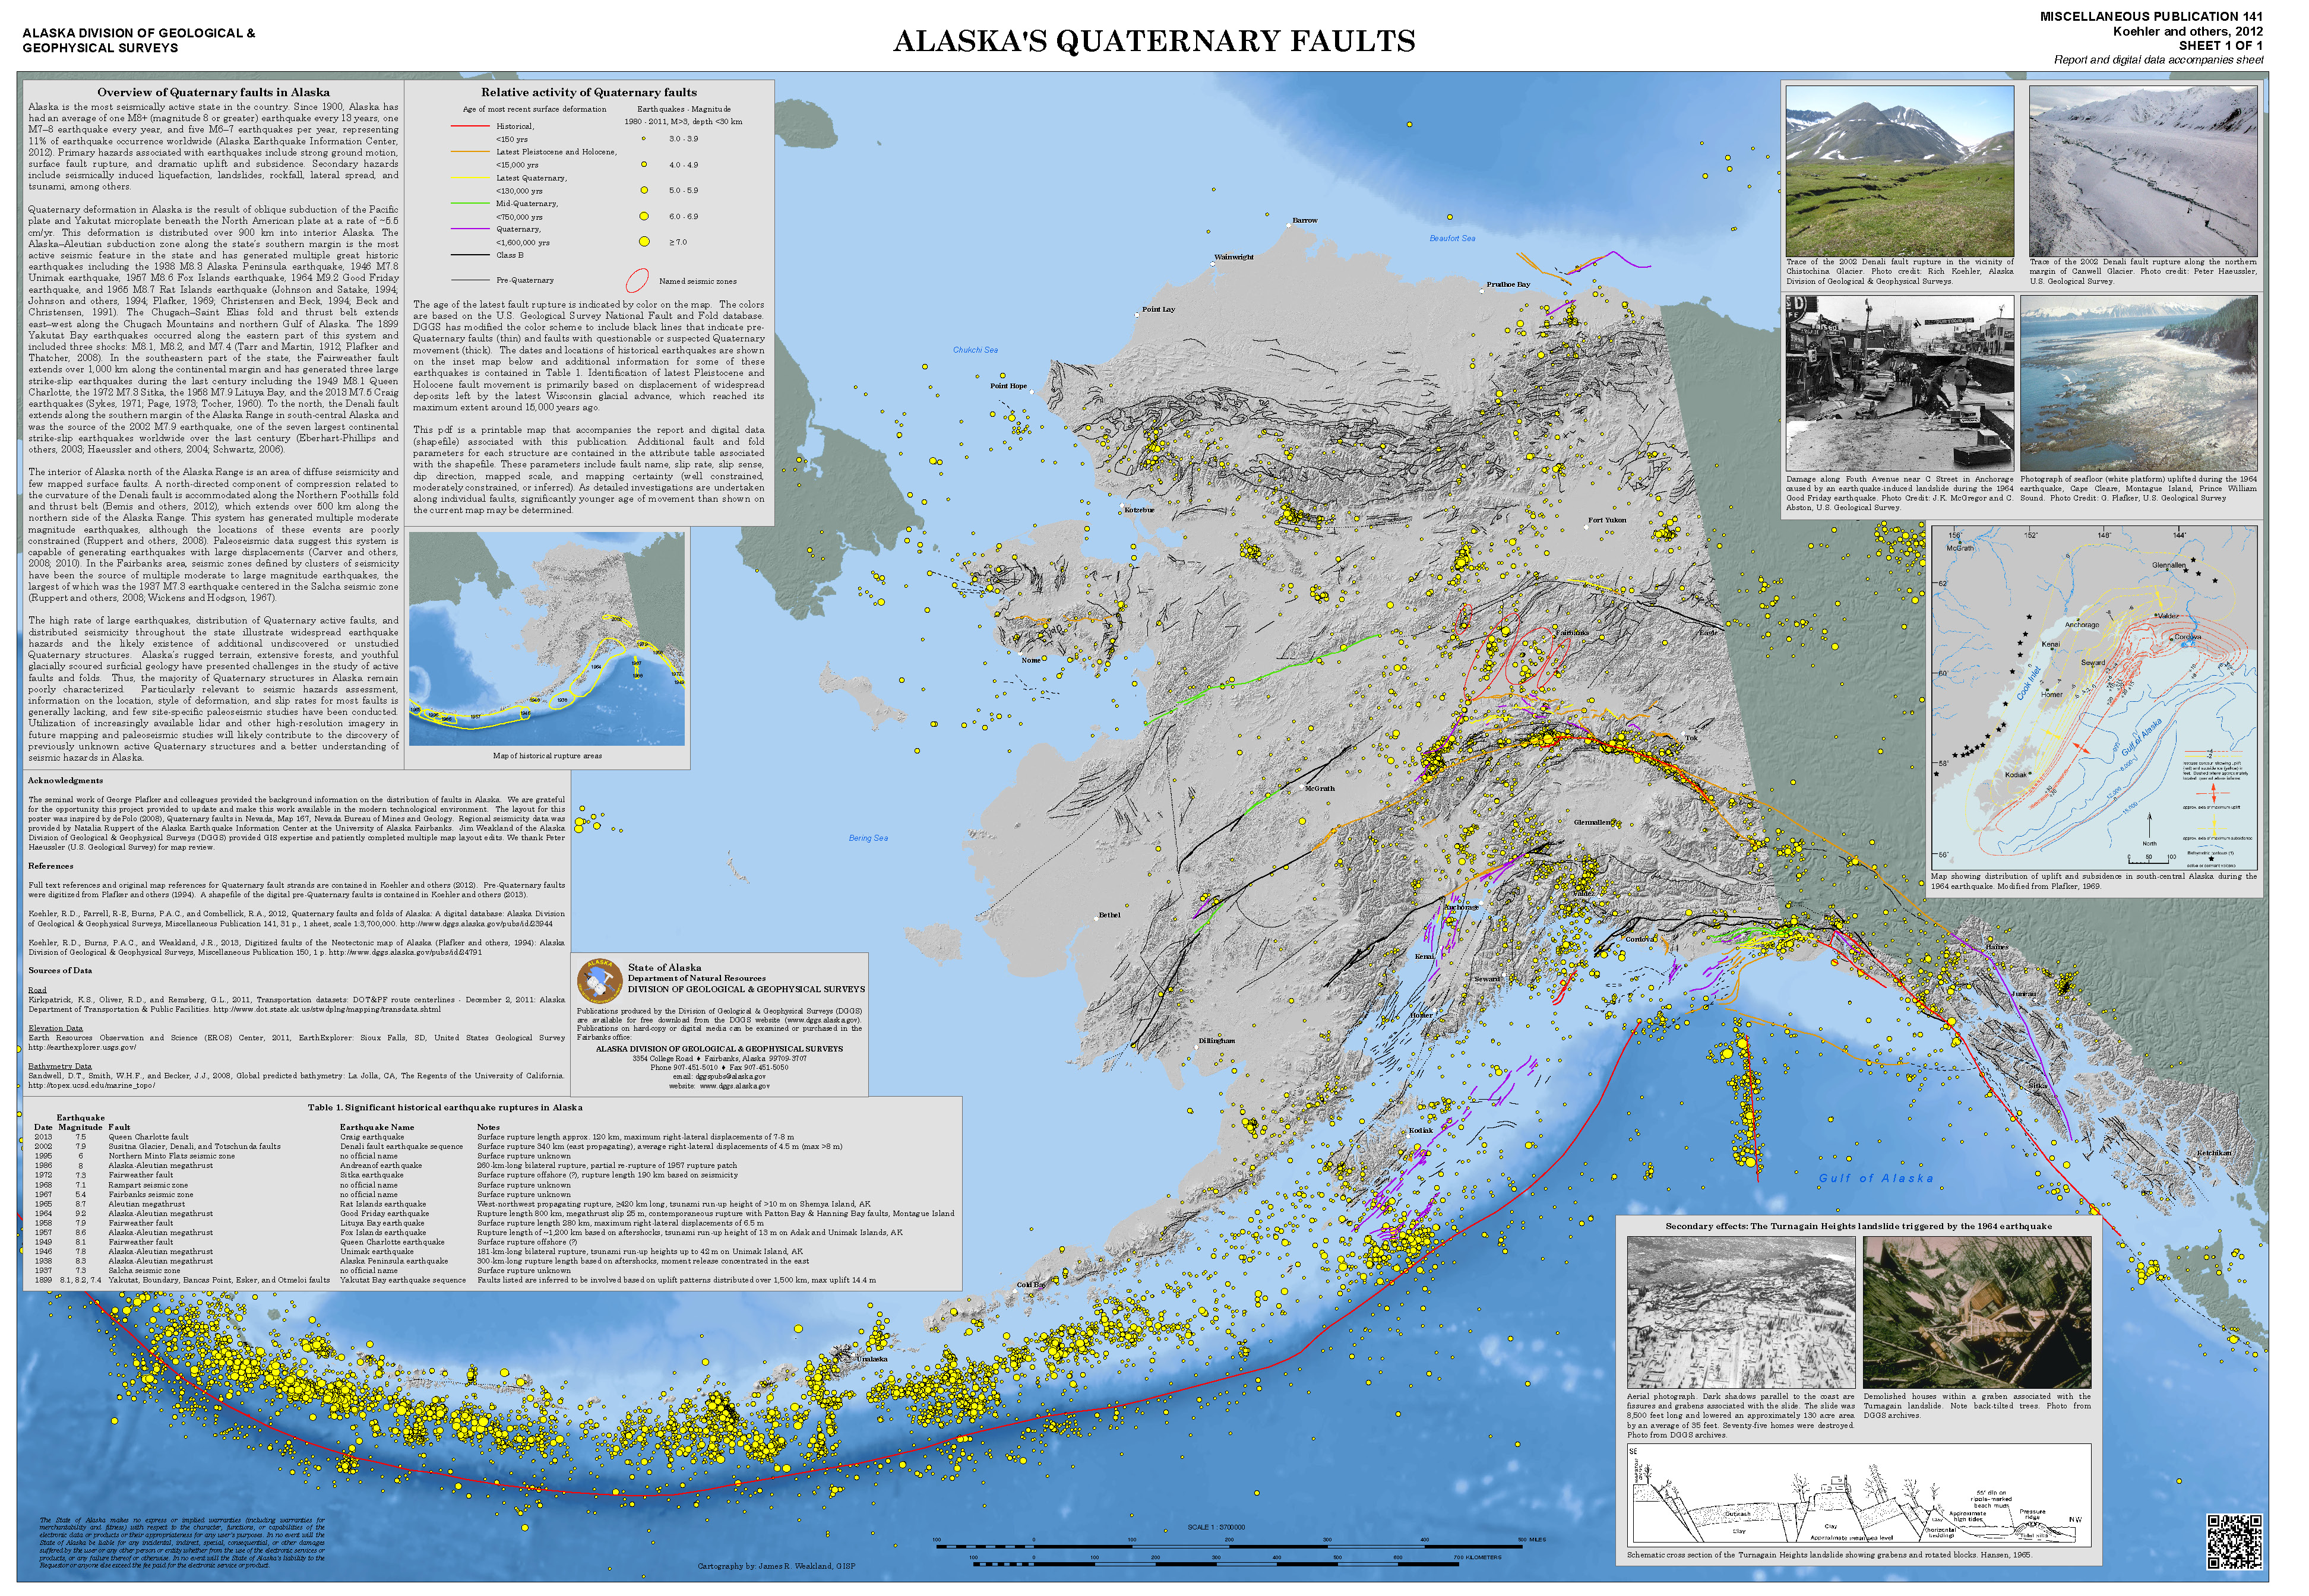
Here is a map from Michael West at the Alaska Earthquake Center. This shows today’s earthquake in reference to the Quaternary faults and folds in Alaska: A digital database (Koehler et al., 2012). Dr. Rick Koehler is currently at the University of Nevada Reno and The Nevada Bureau of Mines and Geology.

Here is the map poster from Koehler et al. (2012). The link is to a 63 MB pdf file.
-
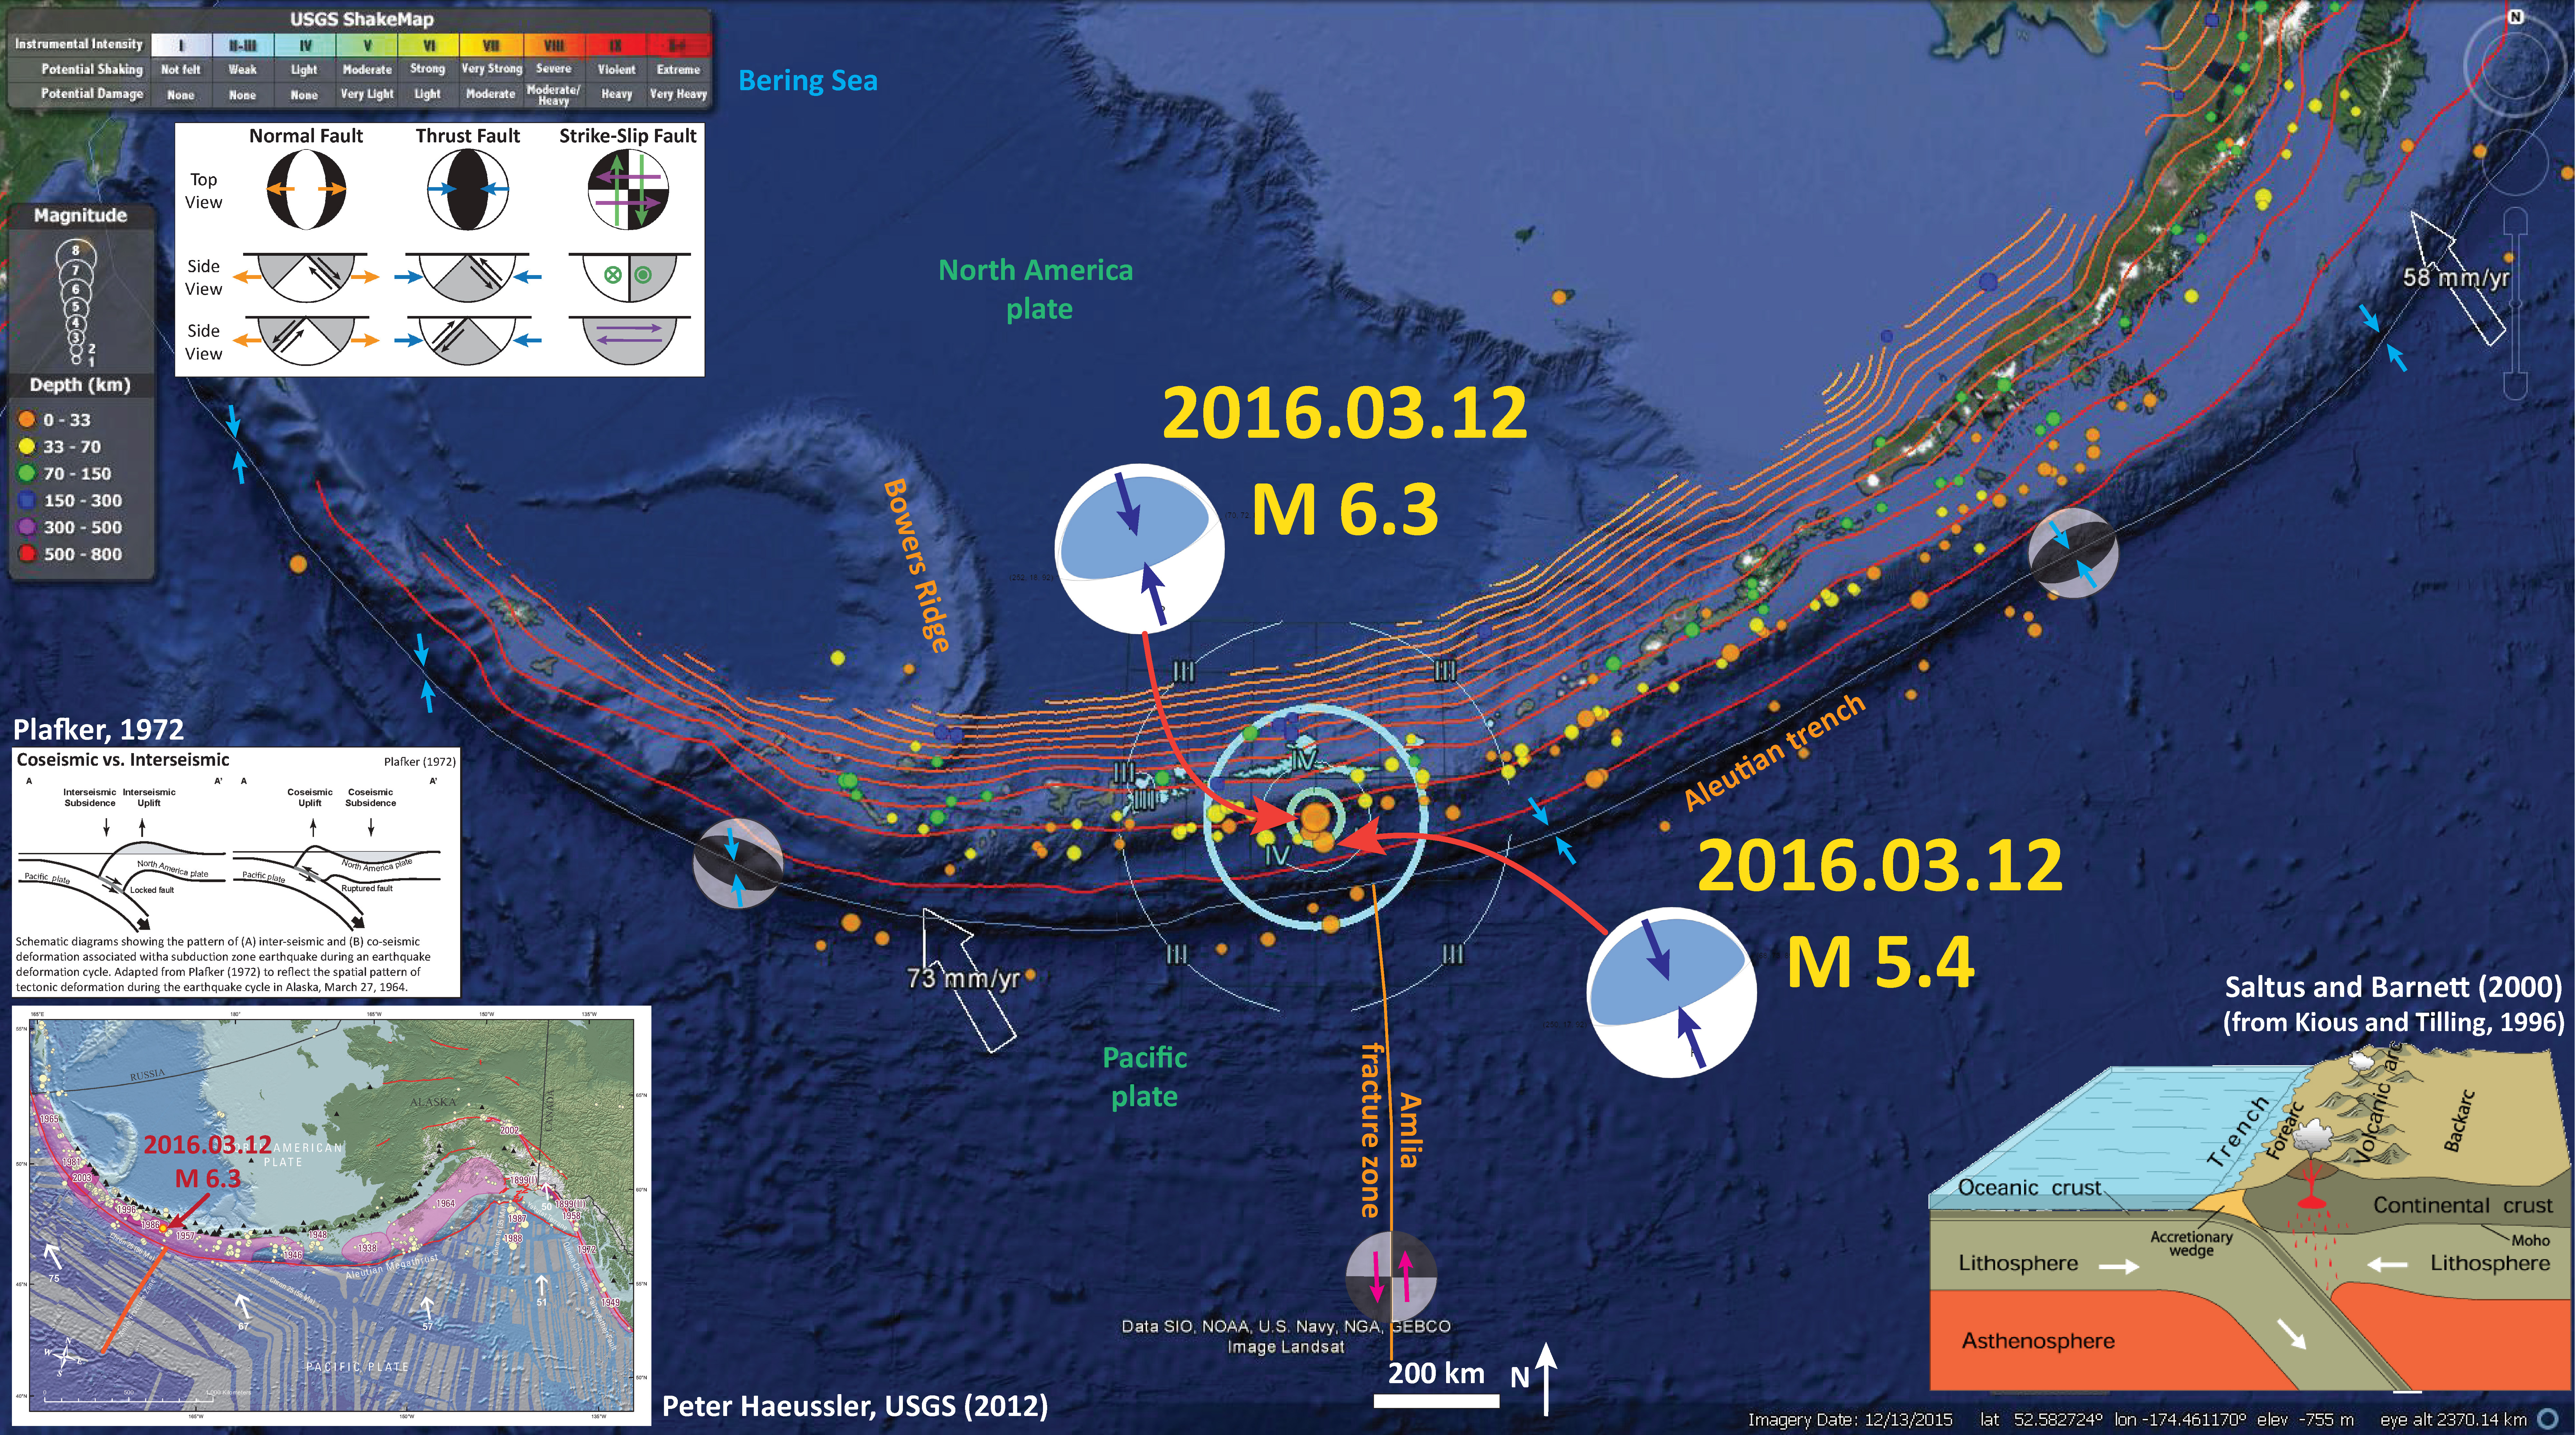
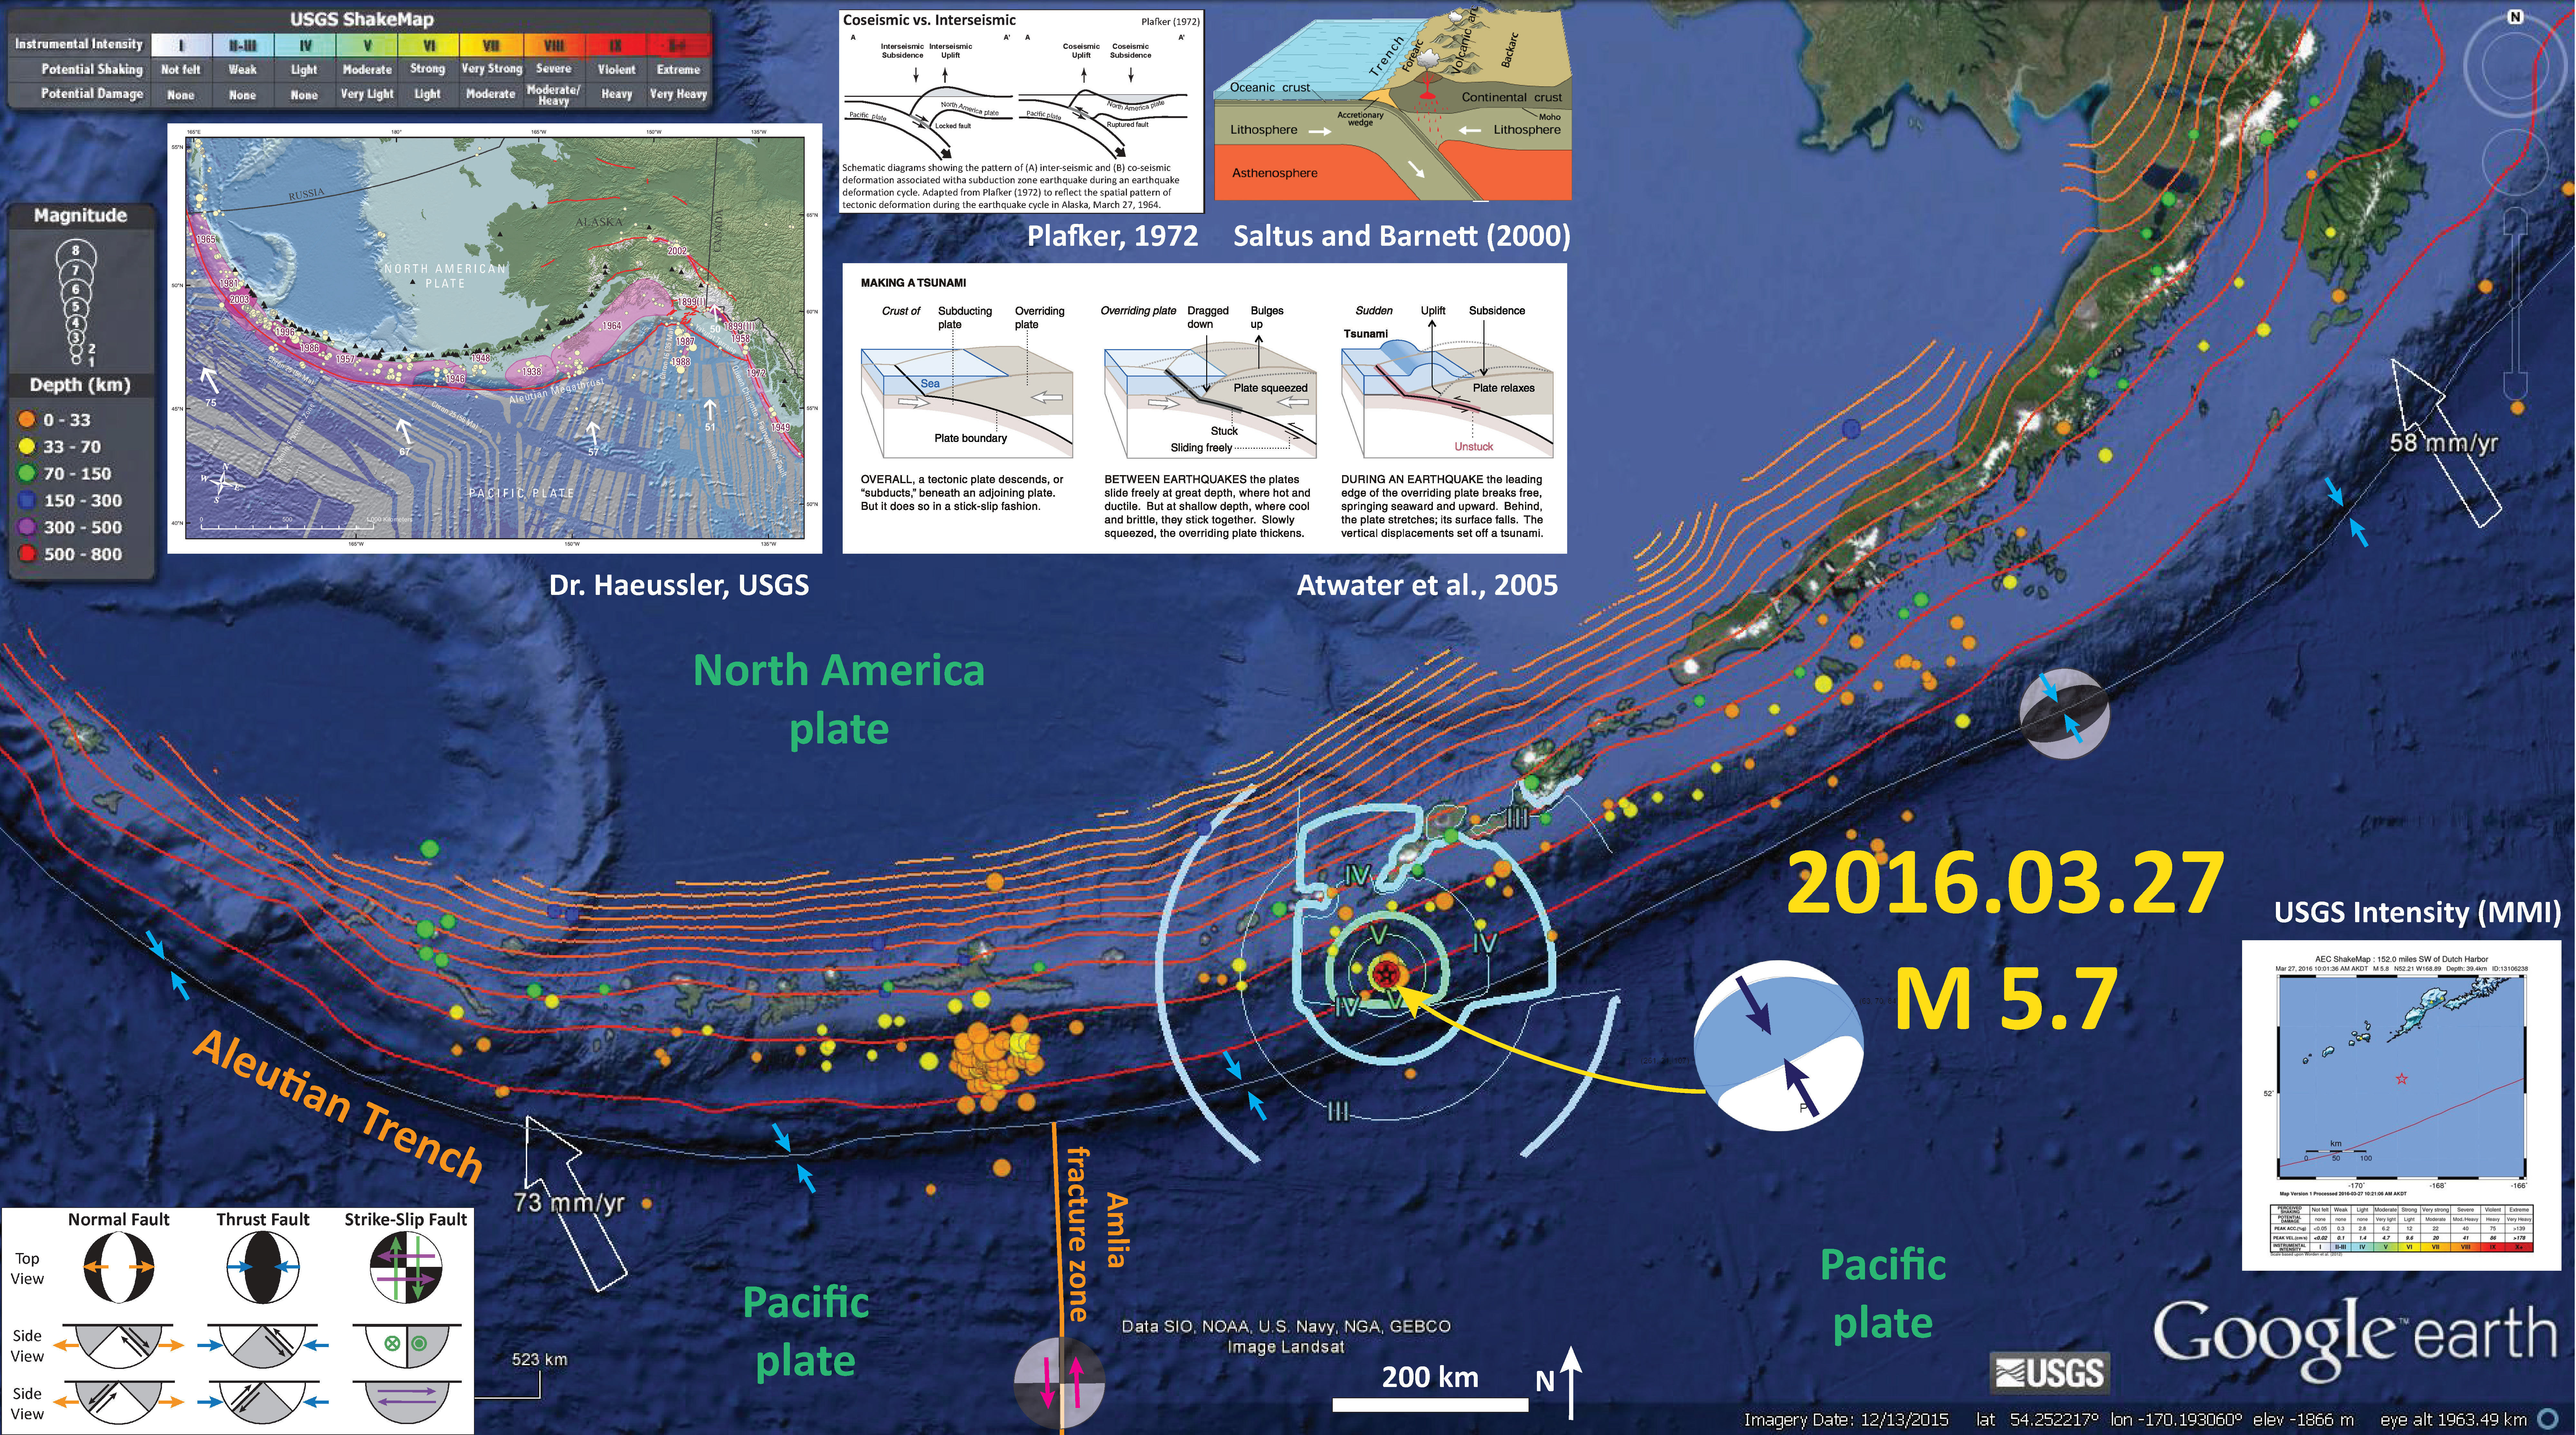
Here are the Earthquake Reports for those Aleutian Trench earthquakes. I include report posters for each of those reports below.
- 2016.03.12 M 6.3 near the Amlia fracture zone
- 2016.03.27 M 5.7 near Nikolski
I recently prepared a summary Earthquake Report for the 1964/03/27 Great Alaska Earthquake here.
More Alaska-Aleutian related earthquakes can be found in my earthquake reports posted here.
-
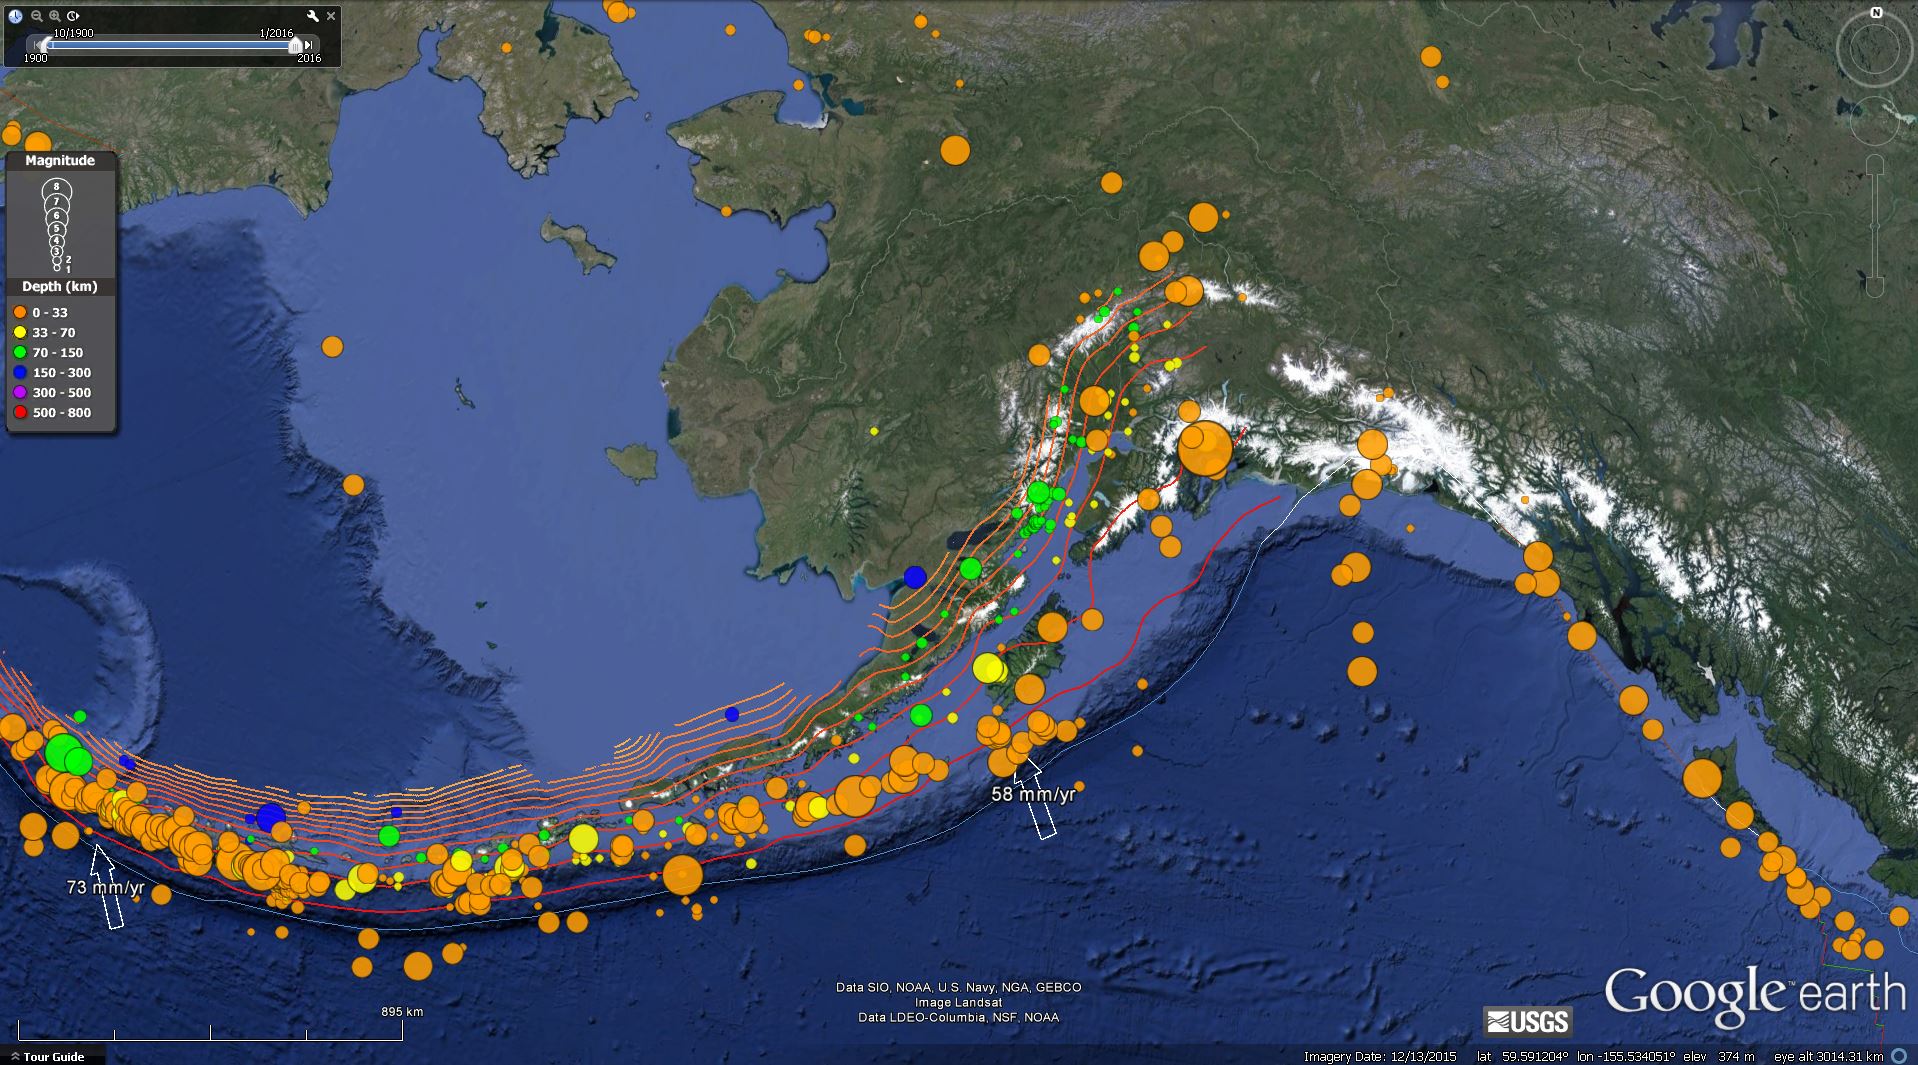
Here is an animation that shows earthquakes of magnitude > 6.5 for the period from 1900-2016. Above is a map showing the region and below is the animation. This is the URL for the USGS query that I used to make this animation in Google Earth.
- Here is a link to the file for the embedded video below (5 MB mp4)
-
References:
- Atwater, B.F., Yamaguchi, D.K., Bondevik, S., Barnhardt, W.A., Amidon, L.J., Benson, B.E., Skjerdal, G., Shulene, J.A., and Nanalyama ,F., 2001. Rapid resetting of an estuarine recorder of the 1964 Alaska earthquake in Geology, v. 113, no. 9, p. 1193-1204.
- Benz, H.M., Tarr, A.C., Hayes, G.P., Villaseñor, Antonio, Hayes, G.P., Furlong, K.P., Dart, R.L., and Rhea, Susan, 2011. Seismicity of the Earth 1900–2010 Aleutian arc and vicinity: U.S. Geological Survey Open-File Report 2010–1083-B, scale 1:5,000,000.
- Hayes, G.P., Wald, D.J., and Johnson, R.L., 2012. Slab1.0: A three-dimensional model of global subduction zone geometries in, J. Geophys. Res., 117, B01302, doi:10.1029/2011JB008524
- Haeussler, P., Leith, W., Wald, D., Filson, J., Wolfe, C., and Applegate, D., 2014. Geophysical Advances Triggered by the 1964 Great Alaska Earthquake in EOS, Transactions, American Geophysical Union, v. 95, no. 17, p. 141-142.
- Koehler, R.D., Farrell, Rebecca-Ellen, Burns, P.A.C., and Combellick, R.A., 2012. Quaternary faults and folds in Alaska: A digital database, in Koehler, R.D., Quaternary Faults and Folds (QFF): Alaska Division of Geological & Geophysical Surveys Miscellaneous Publication 141, 31 p., 1 sheet, scale 1:3,700,000. doi:10.14509/23944
- Plafker, G., 1969. Tectonics of the March 27, 1964 Alaska earthquake: U.S. Geological Survey Professional Paper 543–I, 74 p., 2 sheets, scales 1:2,000,000 and 1:500,000, http://pubs.usgs.gov/pp/0543i/.
- Plafker, G., 1972. Alaskan earthquake of 1964 and Chilean earthquake of 1960: Implications for arc tectonics in Journal of Geophysical Research, v. 77, p. 901-925.
- Saltus, R.W., and Barnett, A., 2000. Eastern Aleutian Volcanic Arc Digital Model – Version 1.0: U.S. Geological Survey Open-File Report 00