
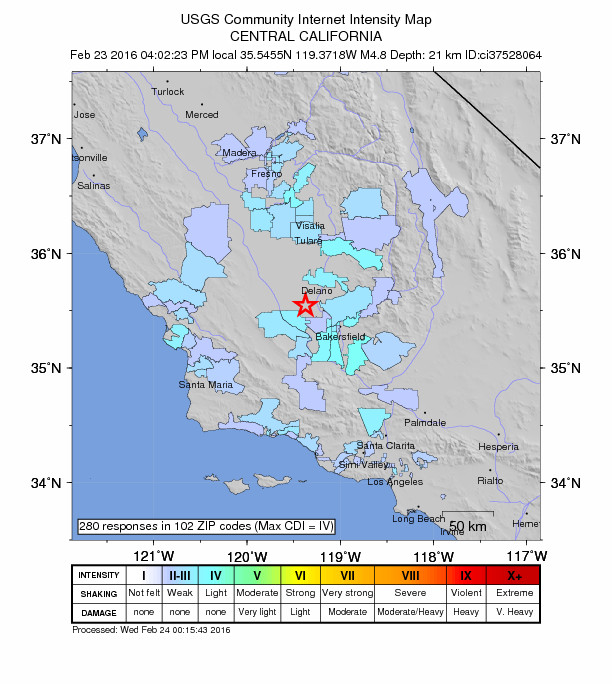
Today we had a M 4.9 earthquake northwest of Bakersfield in the middle of the southern San Joaquin Valley. At first, it looked like there were no faults here because I was looking at the USGS fault and fold database. However, upon looking at the California Geological Survey Jennings (1977) map, updated by Saucedo et al. (2010), I found that there are some pre-Quaternary faults mapped in this region. Here is the online fault map. Here is the USGS website for this earthquake, that was broadly felt across the entire region. Based upon the PAGER alert, there is actually a 24% chance of between 1 and 10 casualties. The felt area may include as many as 2.2 million people.
Here is my interpretive map that shows the epicenter, along with the shaking intensity contours. These contours use the Modified Mercalli Intensity (MMI) scale. The MMI is a qualitative measure of shaking intensity. More on the MMI scale can be found here and here. I plot the moment tensor and I interpret this earthquake to be a northwest striking right lateral strike-slip earthquake. This is based upon the mapped faults in the region and their sense of motion, which is synthetic to the San Andreas fault system to the west. I used this kml to make this map.
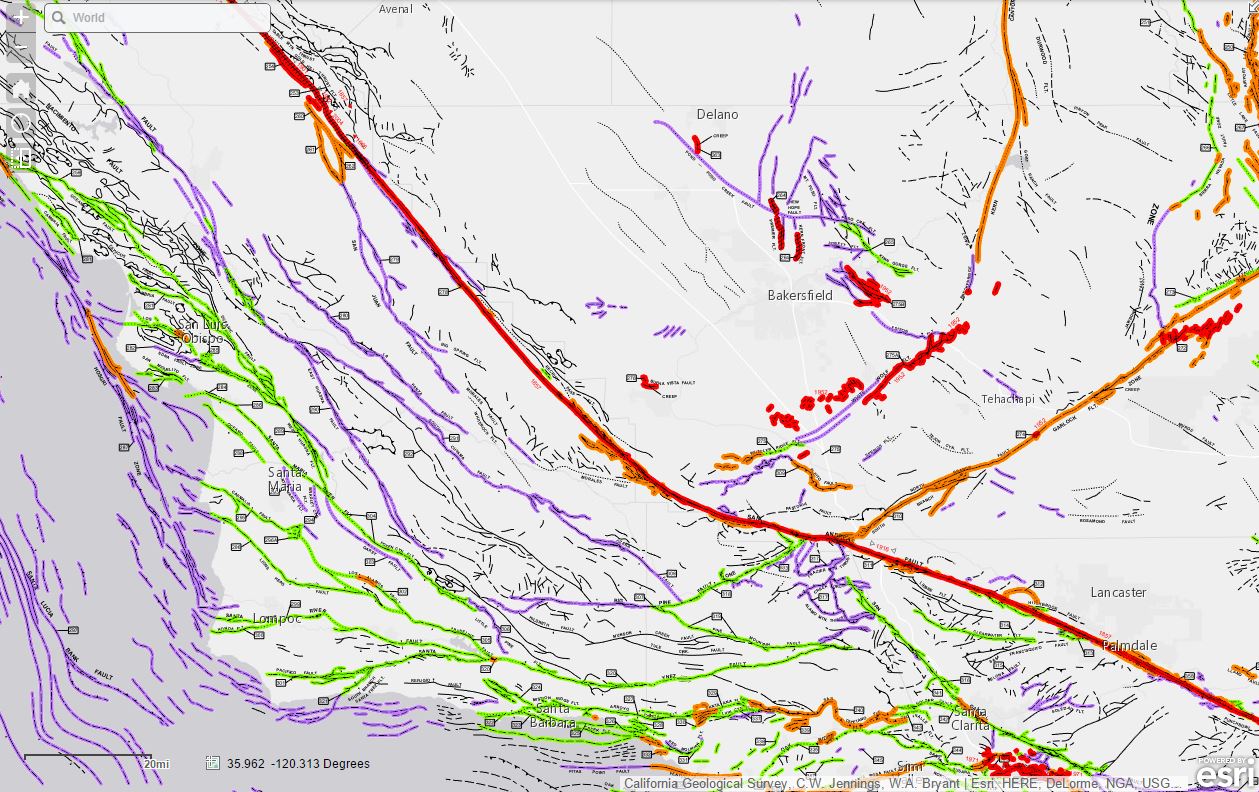
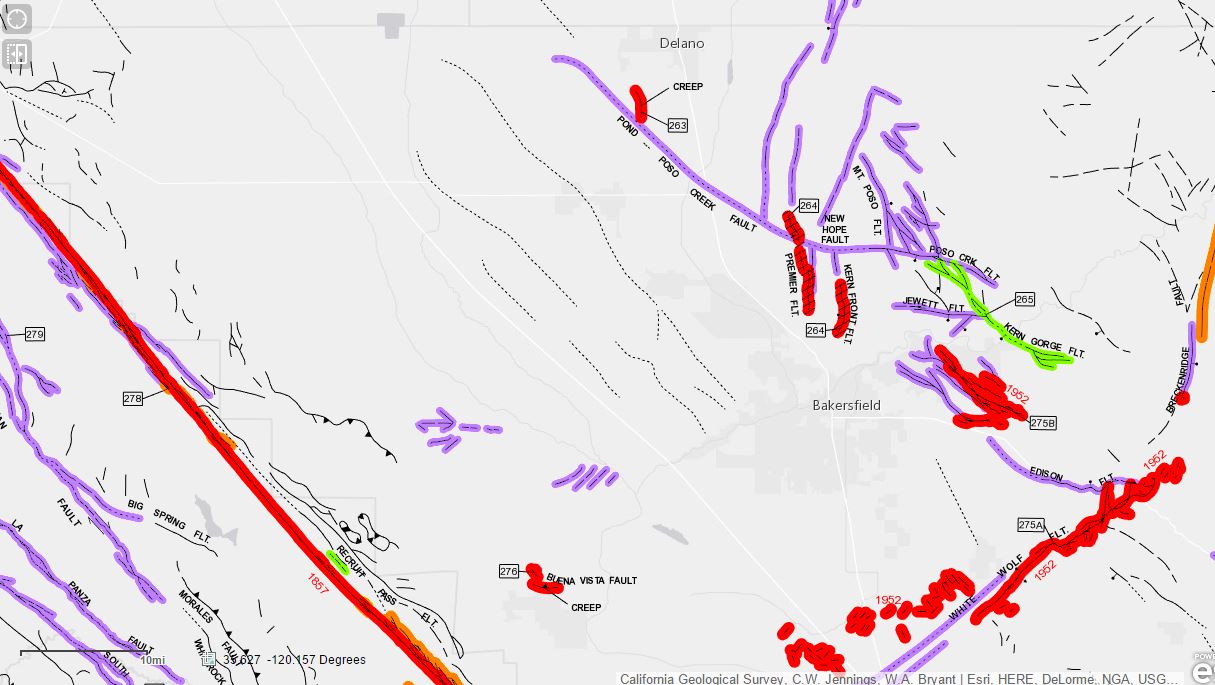
I include inset maps of the Saucedo et al. (2010) fault map, with larger scale maps for the southern San Joaquin Valley (upper center) and Bakersfield (lower left) areas. I plot the epicenter for today’s earthquake as a blue dot. In the Bakersfield scale map (lower left corner), one can see that there are several pre-Quaternary faults mapped in this region. Also, the other, more recently active faults are named and labeled with their most recent event age (e.g. the San Andreas to the west ruptured in 1857 and the White Wolf fault to the southeast ruptured in 1952).
There is a legend that shows how moment tensors can be interpreted. Moment tensors are graphical solutions of seismic data that show two possible fault plane solutions. One must use local tectonics, along with other data, to be able to interpret which of the two possible solutions is correct. The legend shows how these two solutions are oriented for each example (Normal/Extensional, Thrust/Compressional, and Strike-Slip/Shear). There is more about moment tensors and focal mechanisms at the USGS.
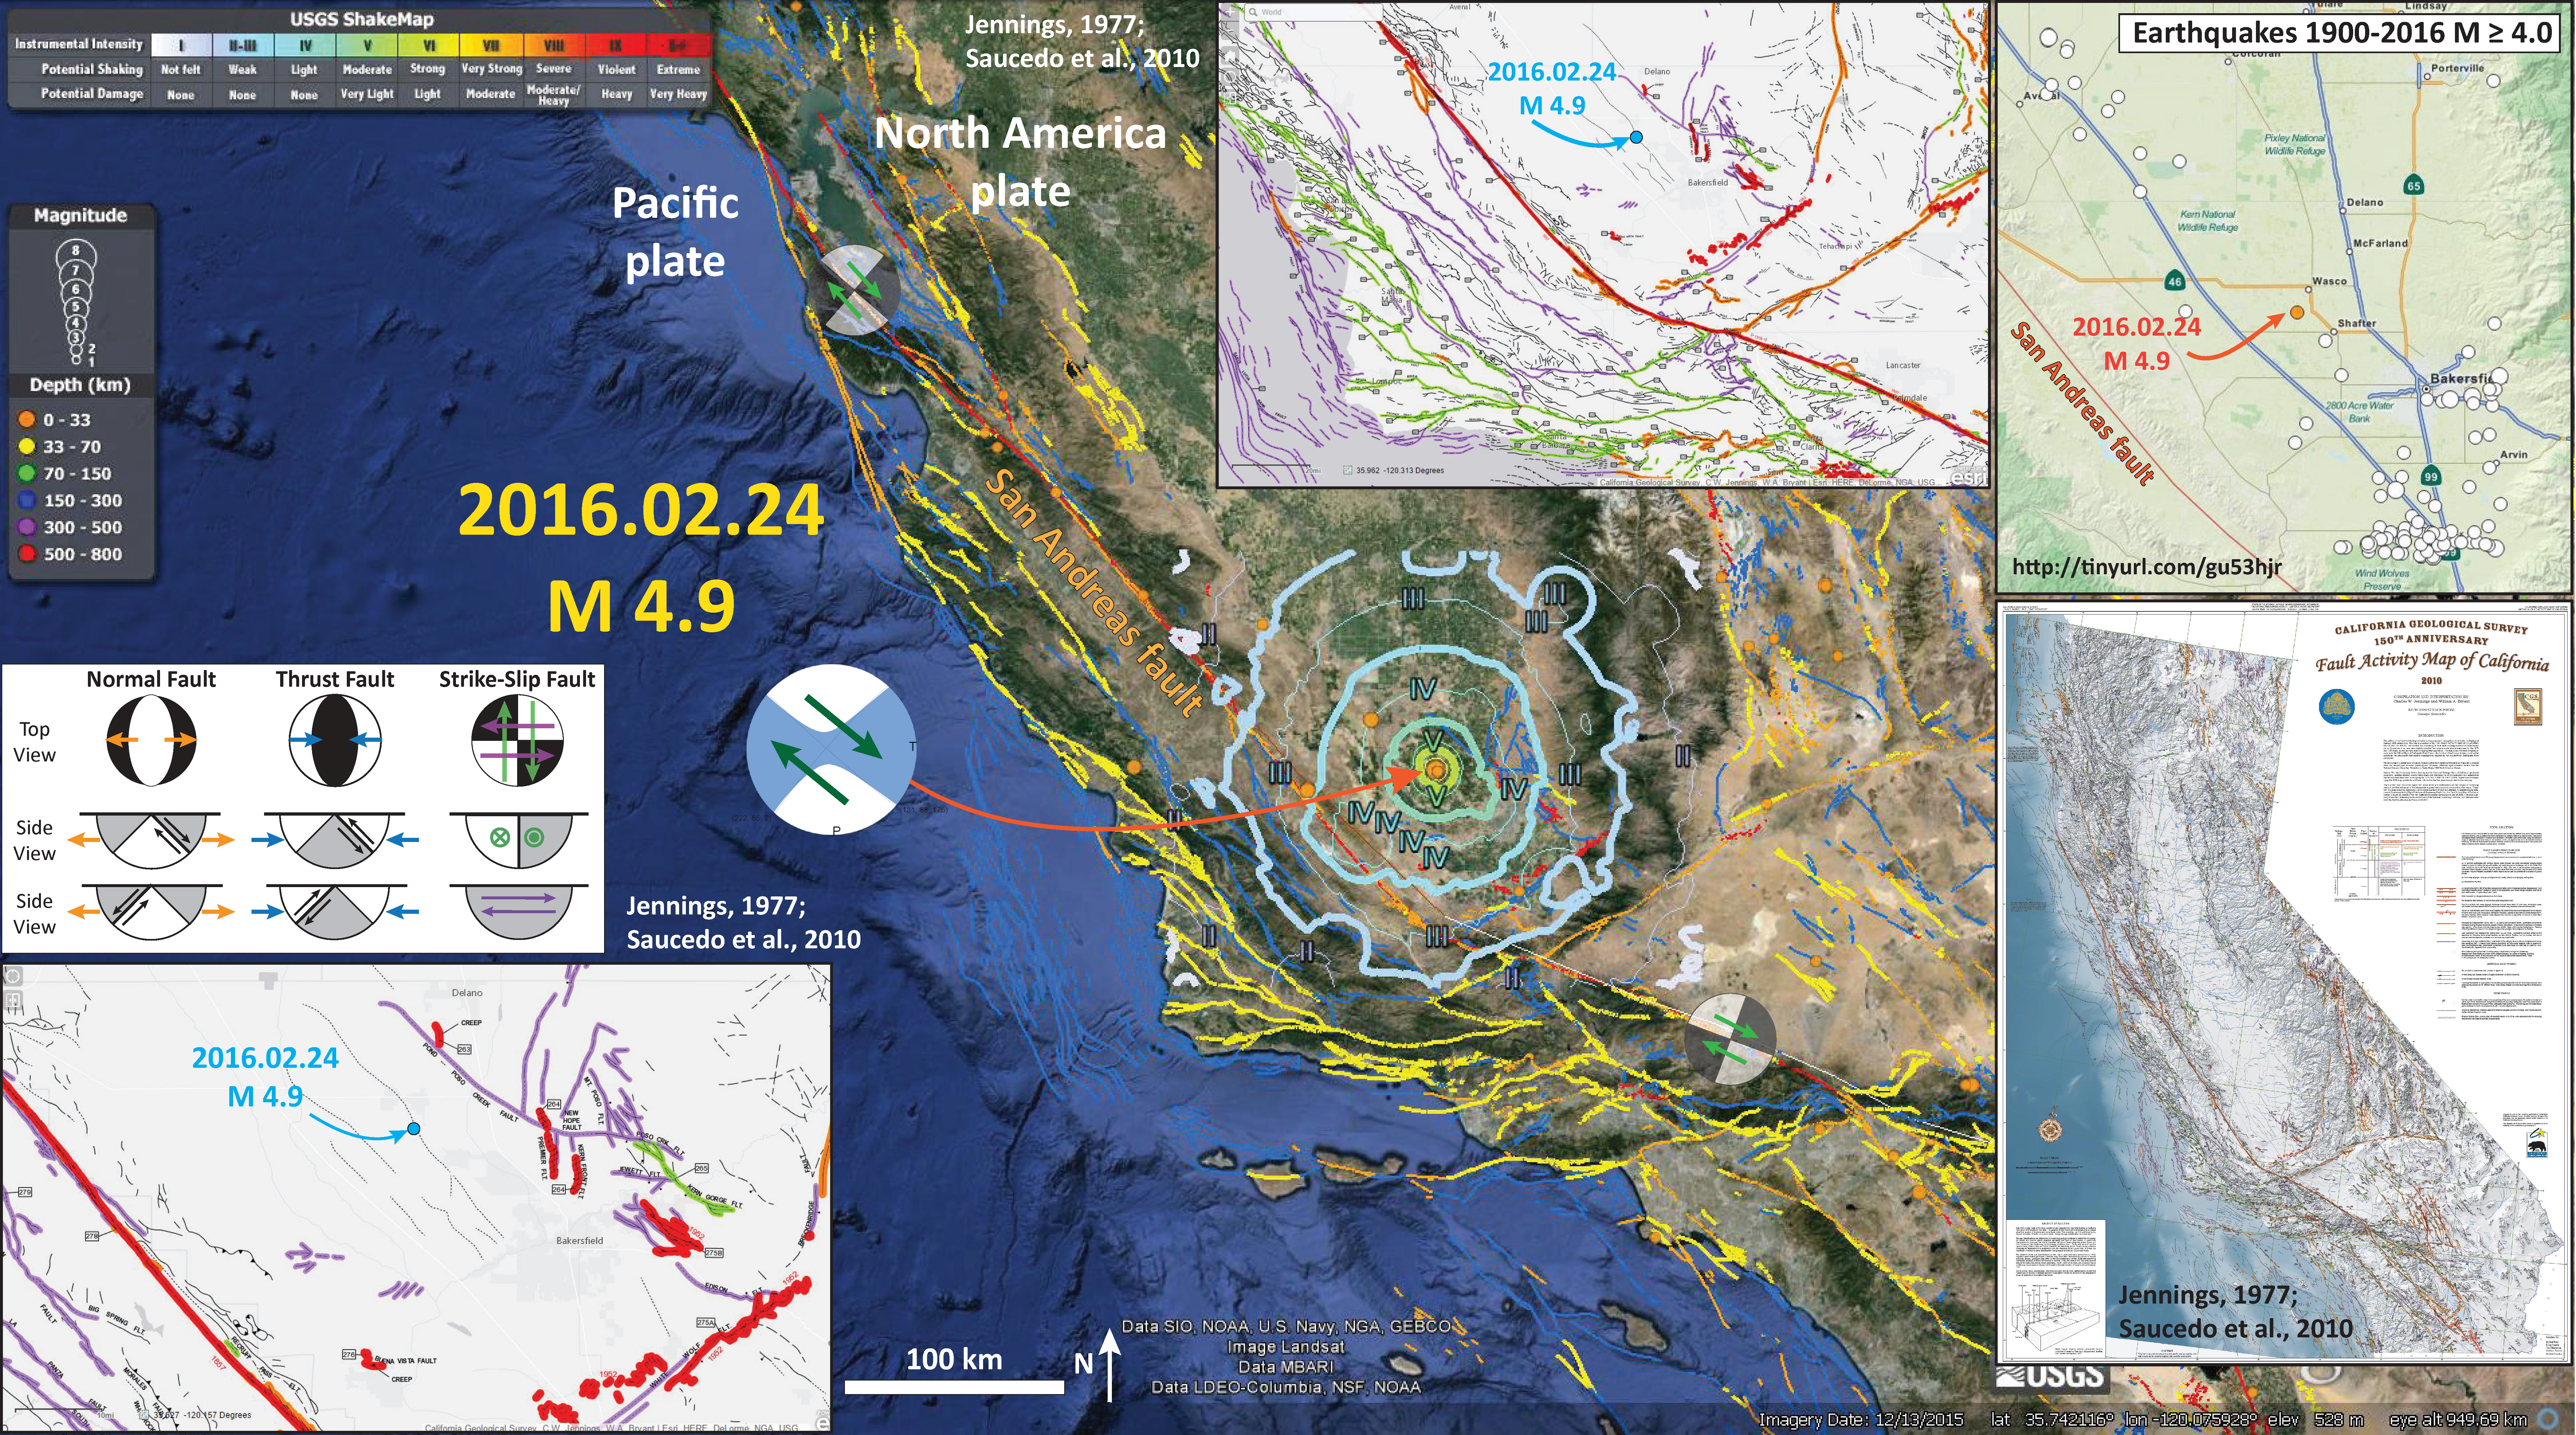
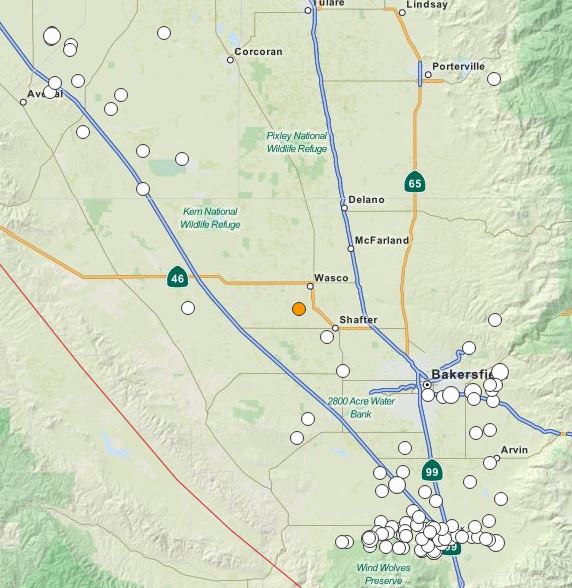
Also as an inset, I include a map that shows earthquake epicenters for earthquakes of magnitude M ≥ 4.0 in this region. Here is the query that I used to create this map. There is a paucity of seismicity in this region.
Here are the two Saucedo et al. (2010) large scale maps. I made these using this fault interface.
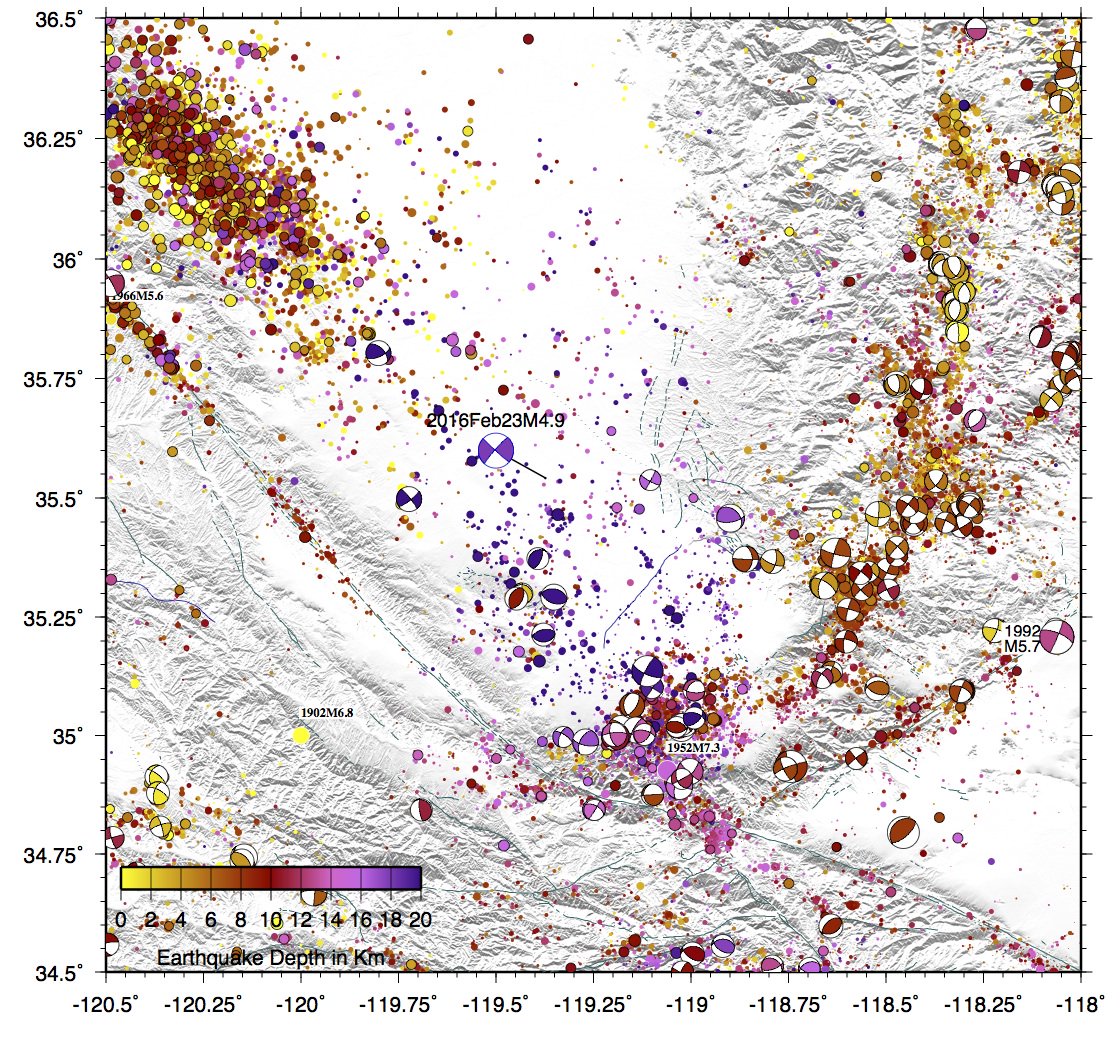
Here is a map from Jascha Polet (Cal Poly Pomona Seismologist). Dr. Polet plots moment tensors and seismicity in this region, showing the lack of seismicity in this region. earthquakes are colored vs. depth (most earthquakes in this region are deep).
This earthquake was felt broadly, including my friends on the east side of the Sierra Nevada mountains. H/T Cindy Pridmore (California Geological Survey) who shared with me this paper by Namson and Davis (1988). Cross section in Figure 11 is just north of this region. Pridmore suggested that this earthquake may have ruptured the deep basement (22 km epicenter).
-
References:
- Jennings, C.W., 1975. (1977) Fault map of California with location of volcanoes, thermal springs and thermal wells, 1:750,000: California Division of Mines and Geology, Geologic Data
Map No. 1. - Jennings, C.W., and Bryant, W.A., 2010. Fault activity map of California: California Geological Survey Geologic Data Map No. 6, map scale 1:750,000.
- Namson, J.S. and Davis, T.L., 1988. Seismically active fold and thrust belt in the San Joaquin Valley, central California in Geological Society of America Bulletin, v. 100, p. 257-273.
Even in the 60s they were pumping sea water (and probably worse more recently) into the oil-bearing rock on the west side of the S.J. Valley to get more oil out of the ground. How is that sort of thing affecting seismic activity in the area?
possibly some linkages, but i have not researched that….
where today’s ew occurred is in the center of the valley. no oil fields there… no fracking… all ag fields…