
As I was preparing an aftershock map for yesterday’s earthquake, an earthquake with a magnitude of M = 7.0 happened. This turns all other earthquakes into foreshocks, though this terminology may not really be important (foreshock vs aftershock). The M 7.0 will be much more damaging since it is a much larger earthquake. A M 7.0 earthquake releases ~32 times as much energy as a M 6.0, or about 26 times as much energy as a M 6.2. Here is my report from yesterday’s earthquake.
-
Here are the USGS websites for the larger earthquakes in this region for today and yesterday.
- 2016.04.15 M 7.0
- 2016.04.14 M 6.2
- 2016.04.14 M 6.0
- 2016.04.14 M 5.3
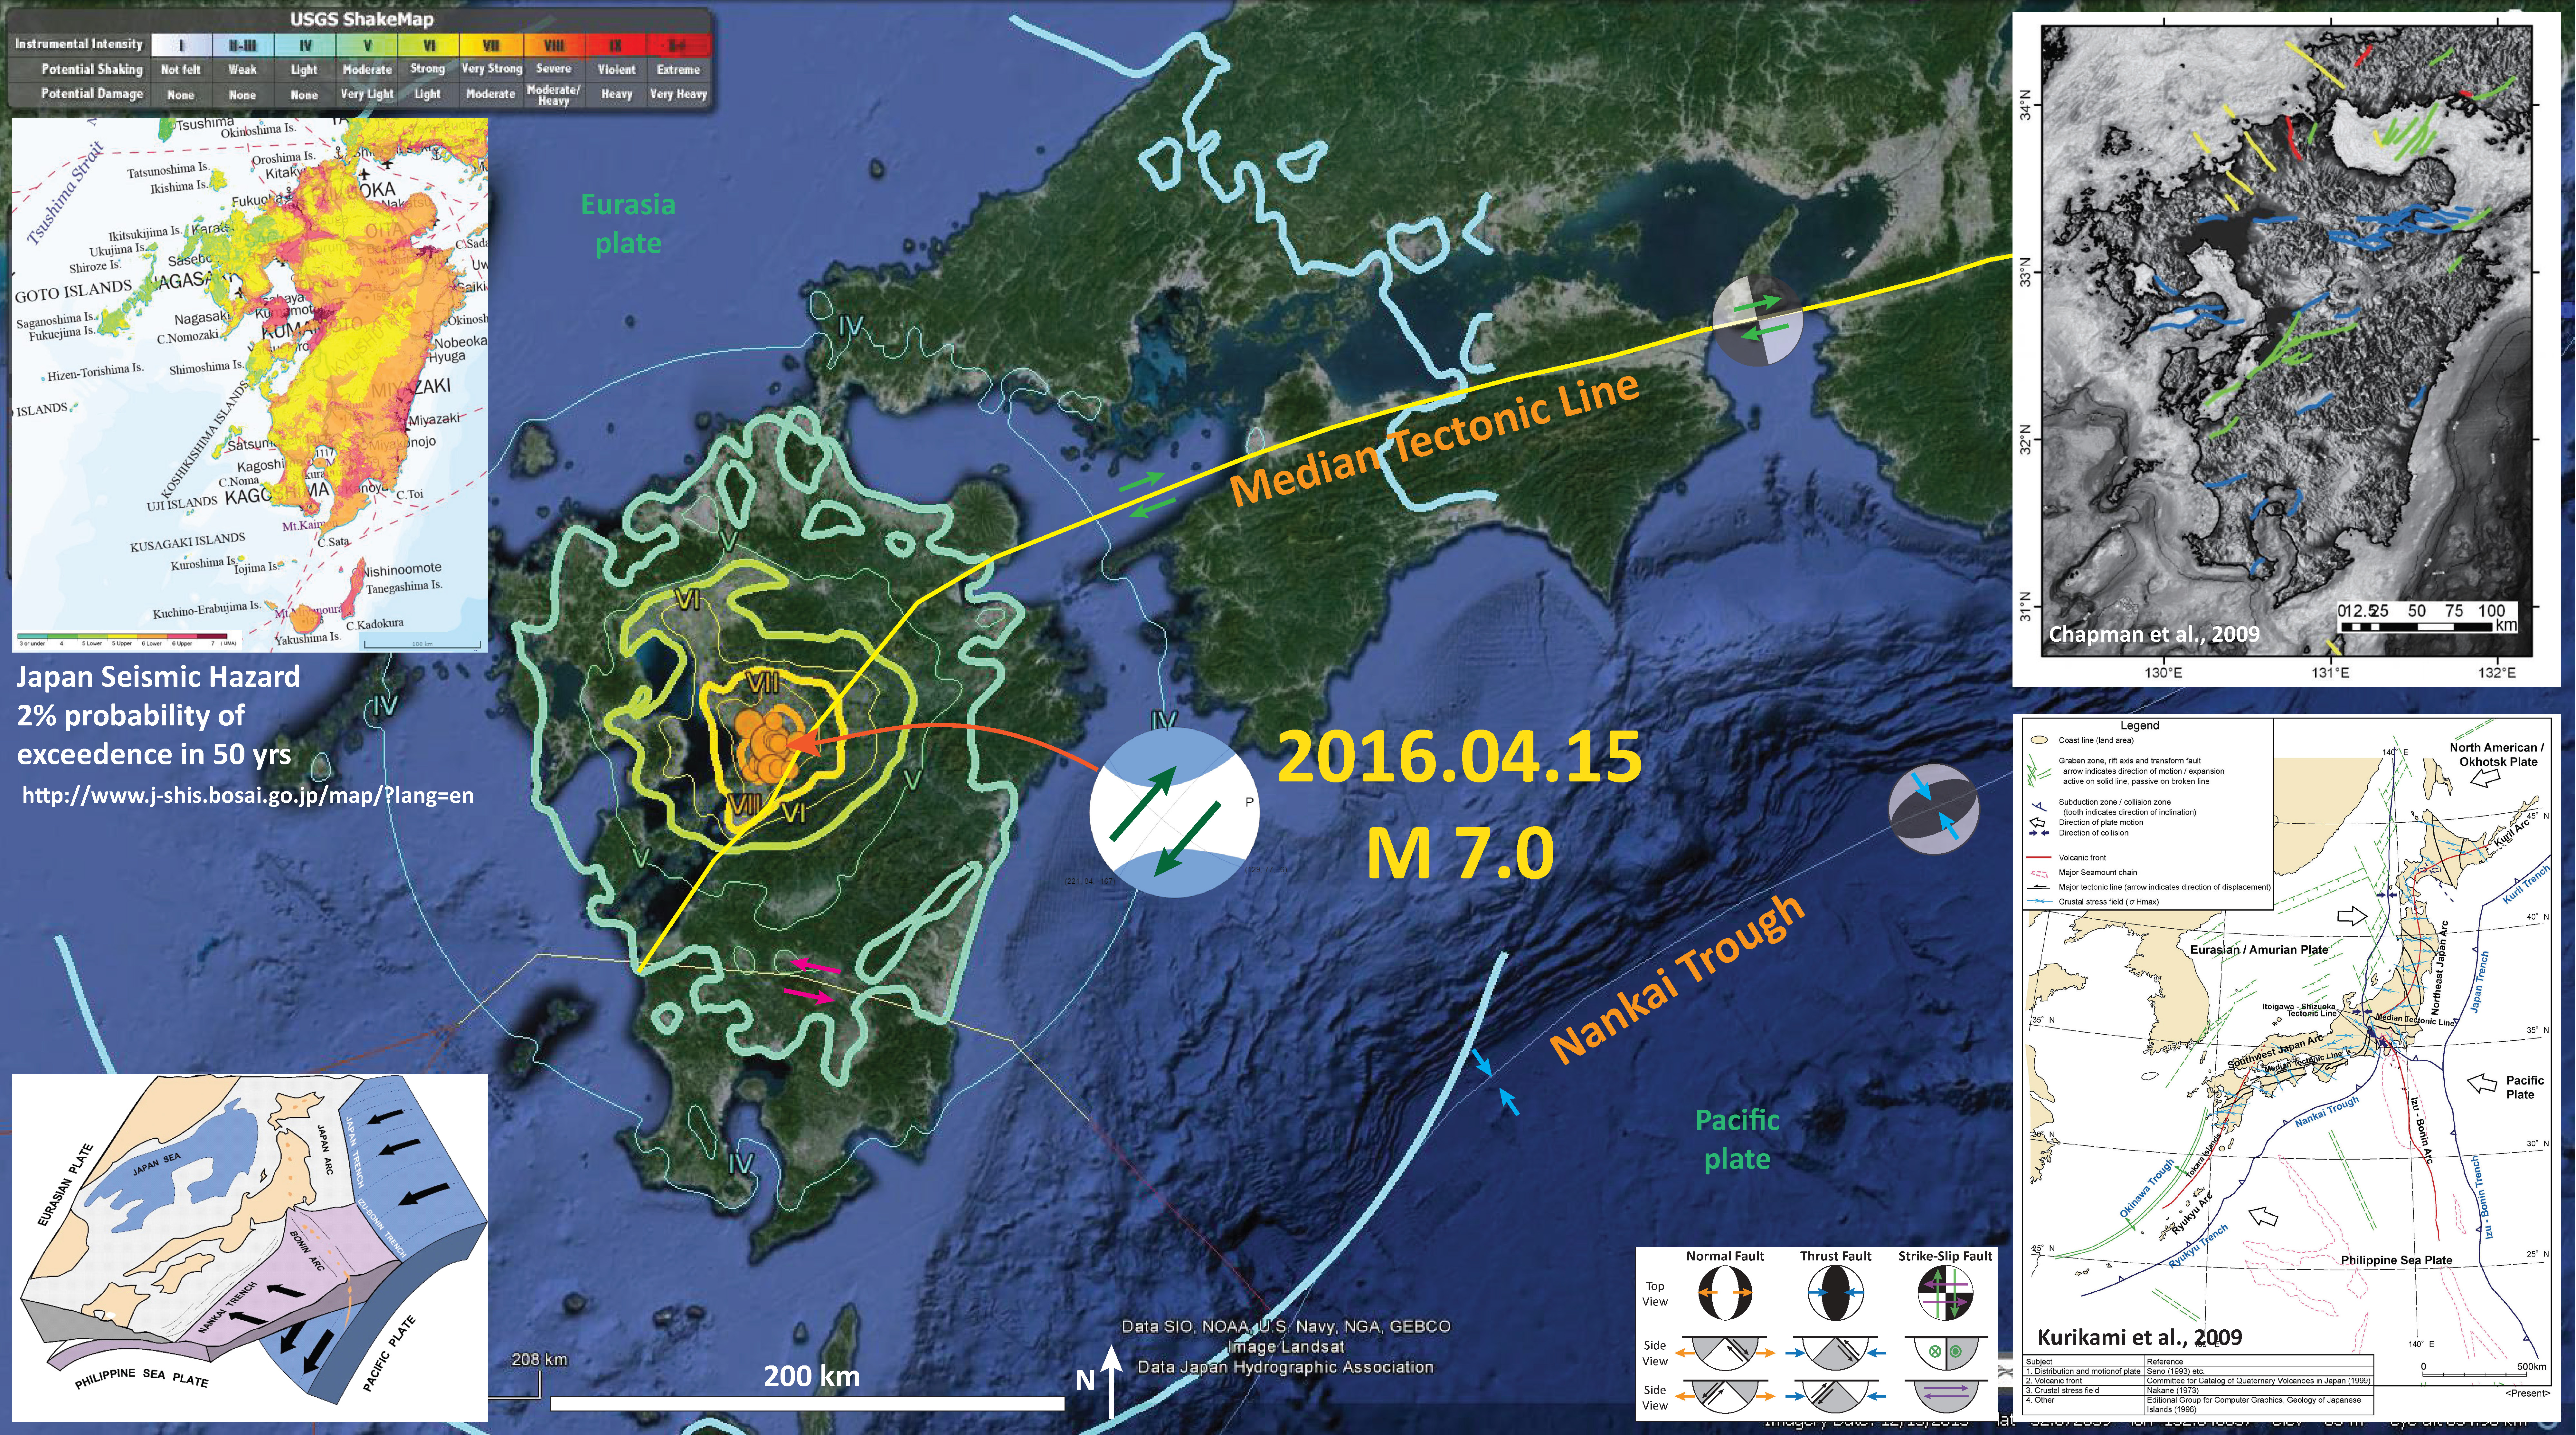
Here is the poster for today’s earthquake. Much of the material is explained on the report from yesterday. I plot the moment tensor for the M 7.0 earthquake. Based upon the proximity to the Median Tectonic Line (MTL), I interpret these earthquakes to be northeast striking right lateral earthquakes. This may be incorrect. There is also a left-lateral strike-slip fault system to the south (see map).
I also include the Modified Mercalli Intensity (MMI) contours. The MMI is a qualitative measure of shaking intensity. More on the MMI scale can be found here and here.
There is a legend that shows how moment tensors can be interpreted. Moment tensors are graphical solutions of seismic data that show two possible fault plane solutions. One must use local tectonics, along with other data, to be able to interpret which of the two possible solutions is correct. The legend shows how these two solutions are oriented for each example (Normal/Extensional, Thrust/Compressional, and Strike-Slip/Shear). There is more about moment tensors and focal mechanisms at the USGS.
-
I include some inset maps.
- In the upper left corner is a map from the Japan Seismic Hazard Information Station. This shows the 2% probability of exceedance for ground motions exceeding the JMA ground shaking intensity scale at any given location. Basically, the warmer (red) colors mean that, in the next 50 years, these areas are likely to shake stronger than the lighter colors (yellow).
- In the lower right corner is a map showing the plate tectonics of the region. Note the Median Tectonic Line (MTL), a right-lateral (dextral) strike slip fault system. Todays earthquakes appear aligned with this fault system (Kurikami et al., 2009). I plot the epicenter in the approximate location as a blue dot.
- In the upper right corner is a map that shows the mapped faults in the region (Chapman et al., 2009). The faults are color coded by sense of movement (green = dextral; blue = normal, red = reverse, yellow = sinistral). I plot the epicenter in the approximate location as a blue dot.
-
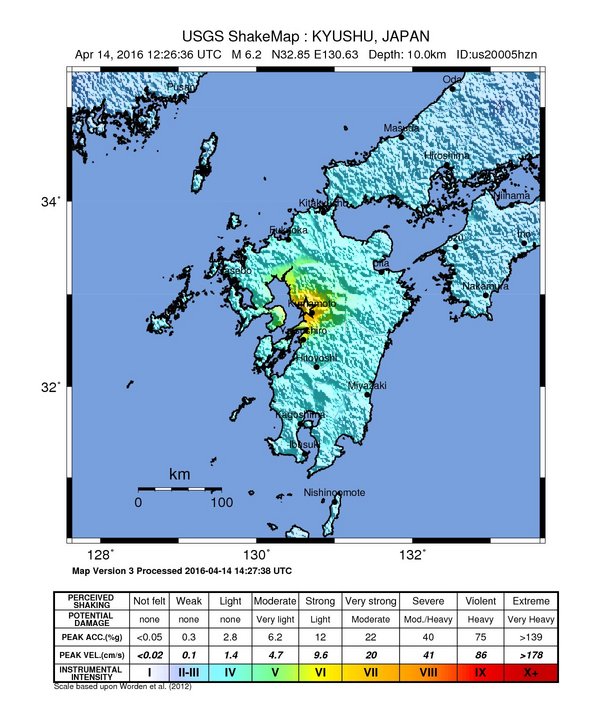
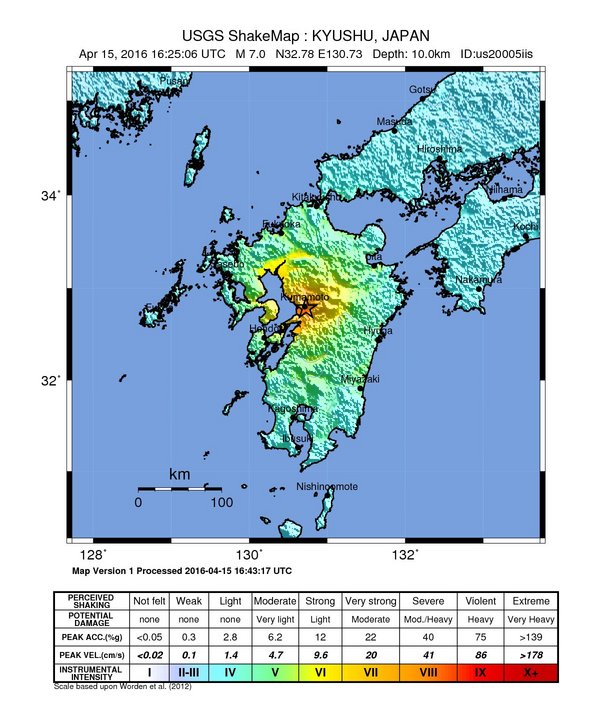
This earthquake will be more damaging that the M 6.2. Below is a comparison of the shakemaps for these two earthquakes. Here is the USGS web page that explains the process that leads to these shakemaps.
- M 6.2
- M 7.0
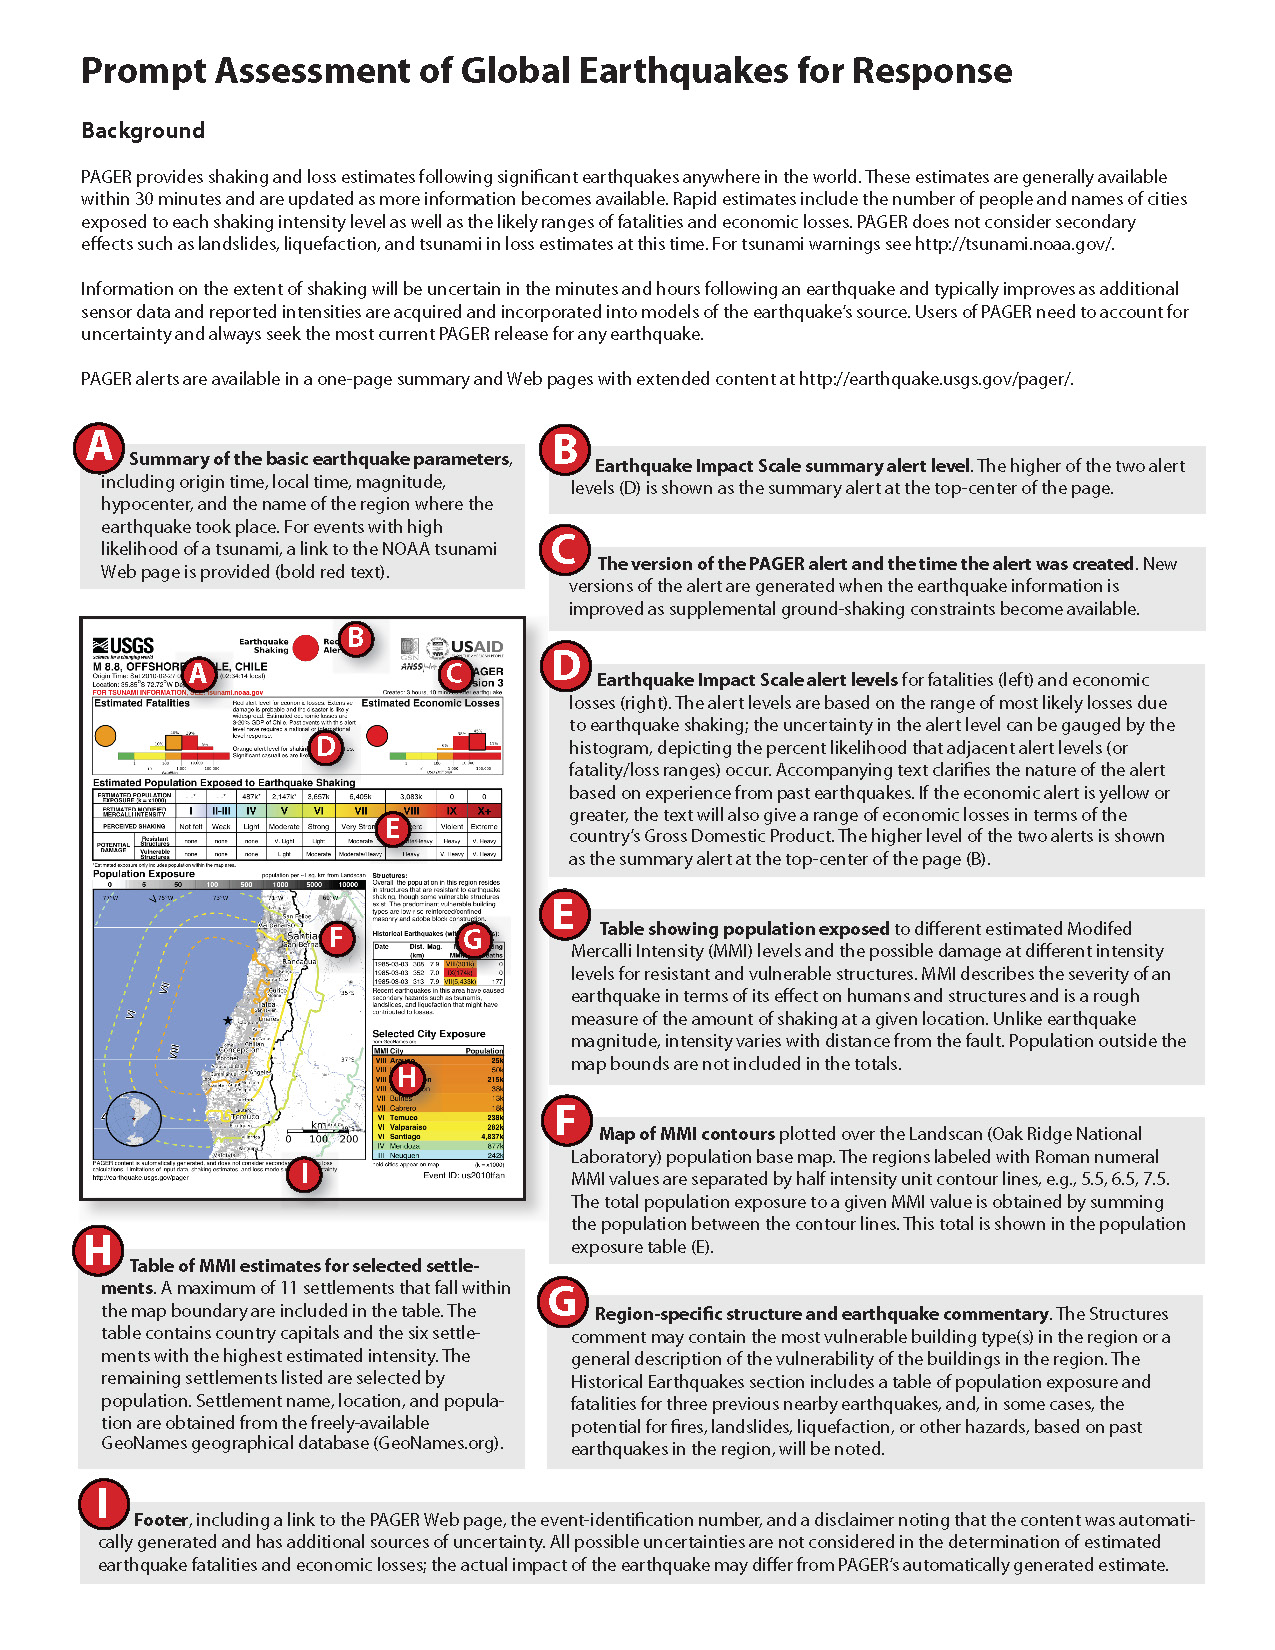
Here is the PAGER report, which is an estimate of damages to people and their belongings (infrastructure, like buildings and roads). The PAGER report for this M 7.0 shows a higher probability for greater damage than the M 6.2 earthquake. Here is the USGS web page that explains the PAGER program and how these estimates are made.
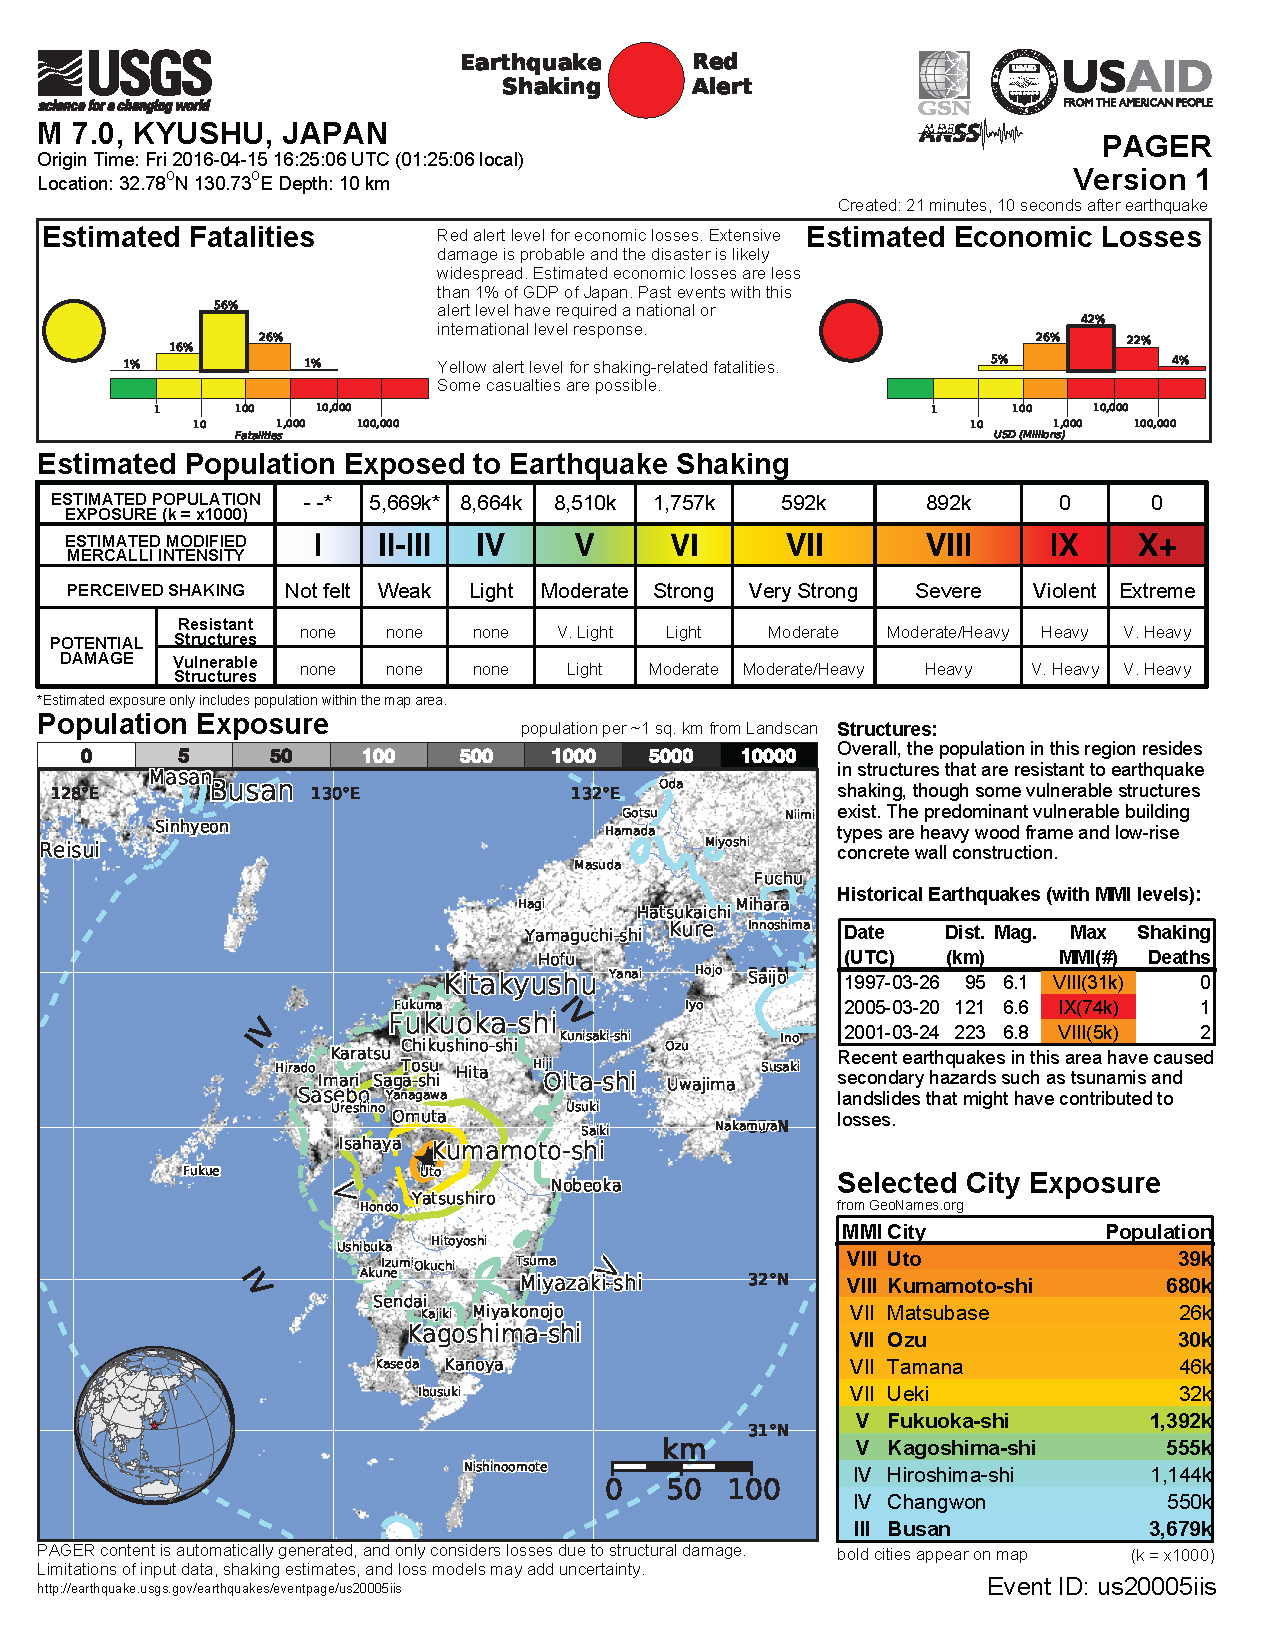
This poster below explains the PAGER alert page.
- Here is the figure showing the tectonic setting (Kurikami et al., 2009). I include their figure caption as a blockquote.

Current tectonic situation of Japan and key tectonic features.
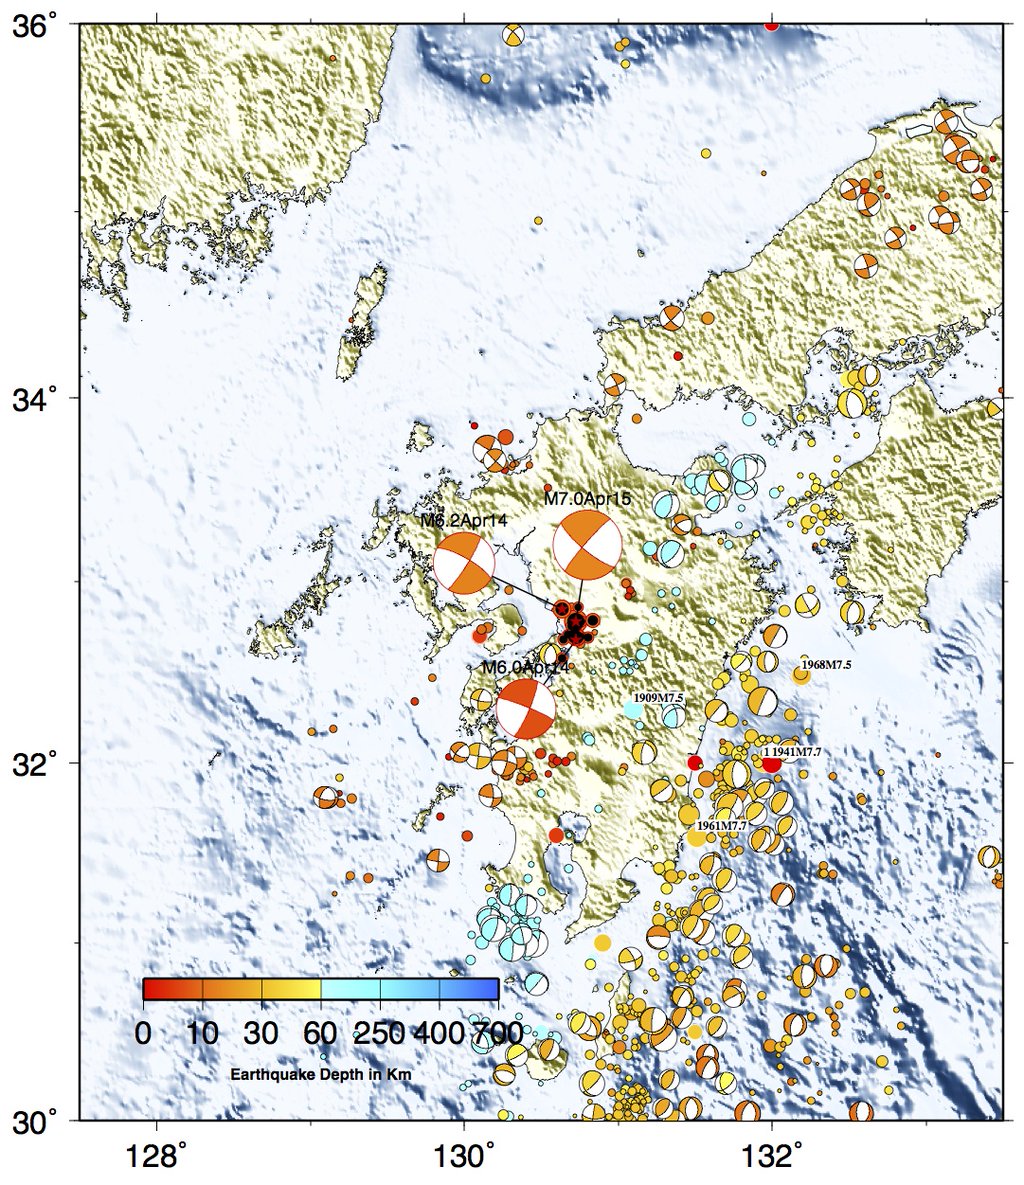
Here is a plot of historic earthquakes and focal mechanisms for this region from Jacha Polet, a seismologist at Cal Poly Pomona. Color refers to depth in km.
-
References:
- Chapman et al., 2009. Development of Methodologies for the Identification of Volcanic and Tectonic Hazards to Potential HLW Repository Sites in Japan –The Kyushu Case Study-, NUMO-TR-09-02, NOv. 2009, 192 pp.
- Kurikami et al., 2009. Study on strategy and methodology for repository concept development for the Japanese geological disposal project, NUMO-TR-09-04, Sept. 20-09, 101 pp.
- Rhea, S., Tarr, A.C., Hayes, G., Villaseñor, A., and Benz, H.M., 2010. Seismicity of the earth 1900–2007, Japan and vicinity: U.S. Geological Survey Open-File Report 2010–1083-D, scale 1:6,000,000.
1 thought on “Earthquake Report: Kyushu, Japan!”