There was an earthquake in Japan tonight (tomorrow morning there). Here is the USGS website for this M 6.2 earthquake. The earthquake was shallow and widely felt with moderate intensity, so some casualties are expected.
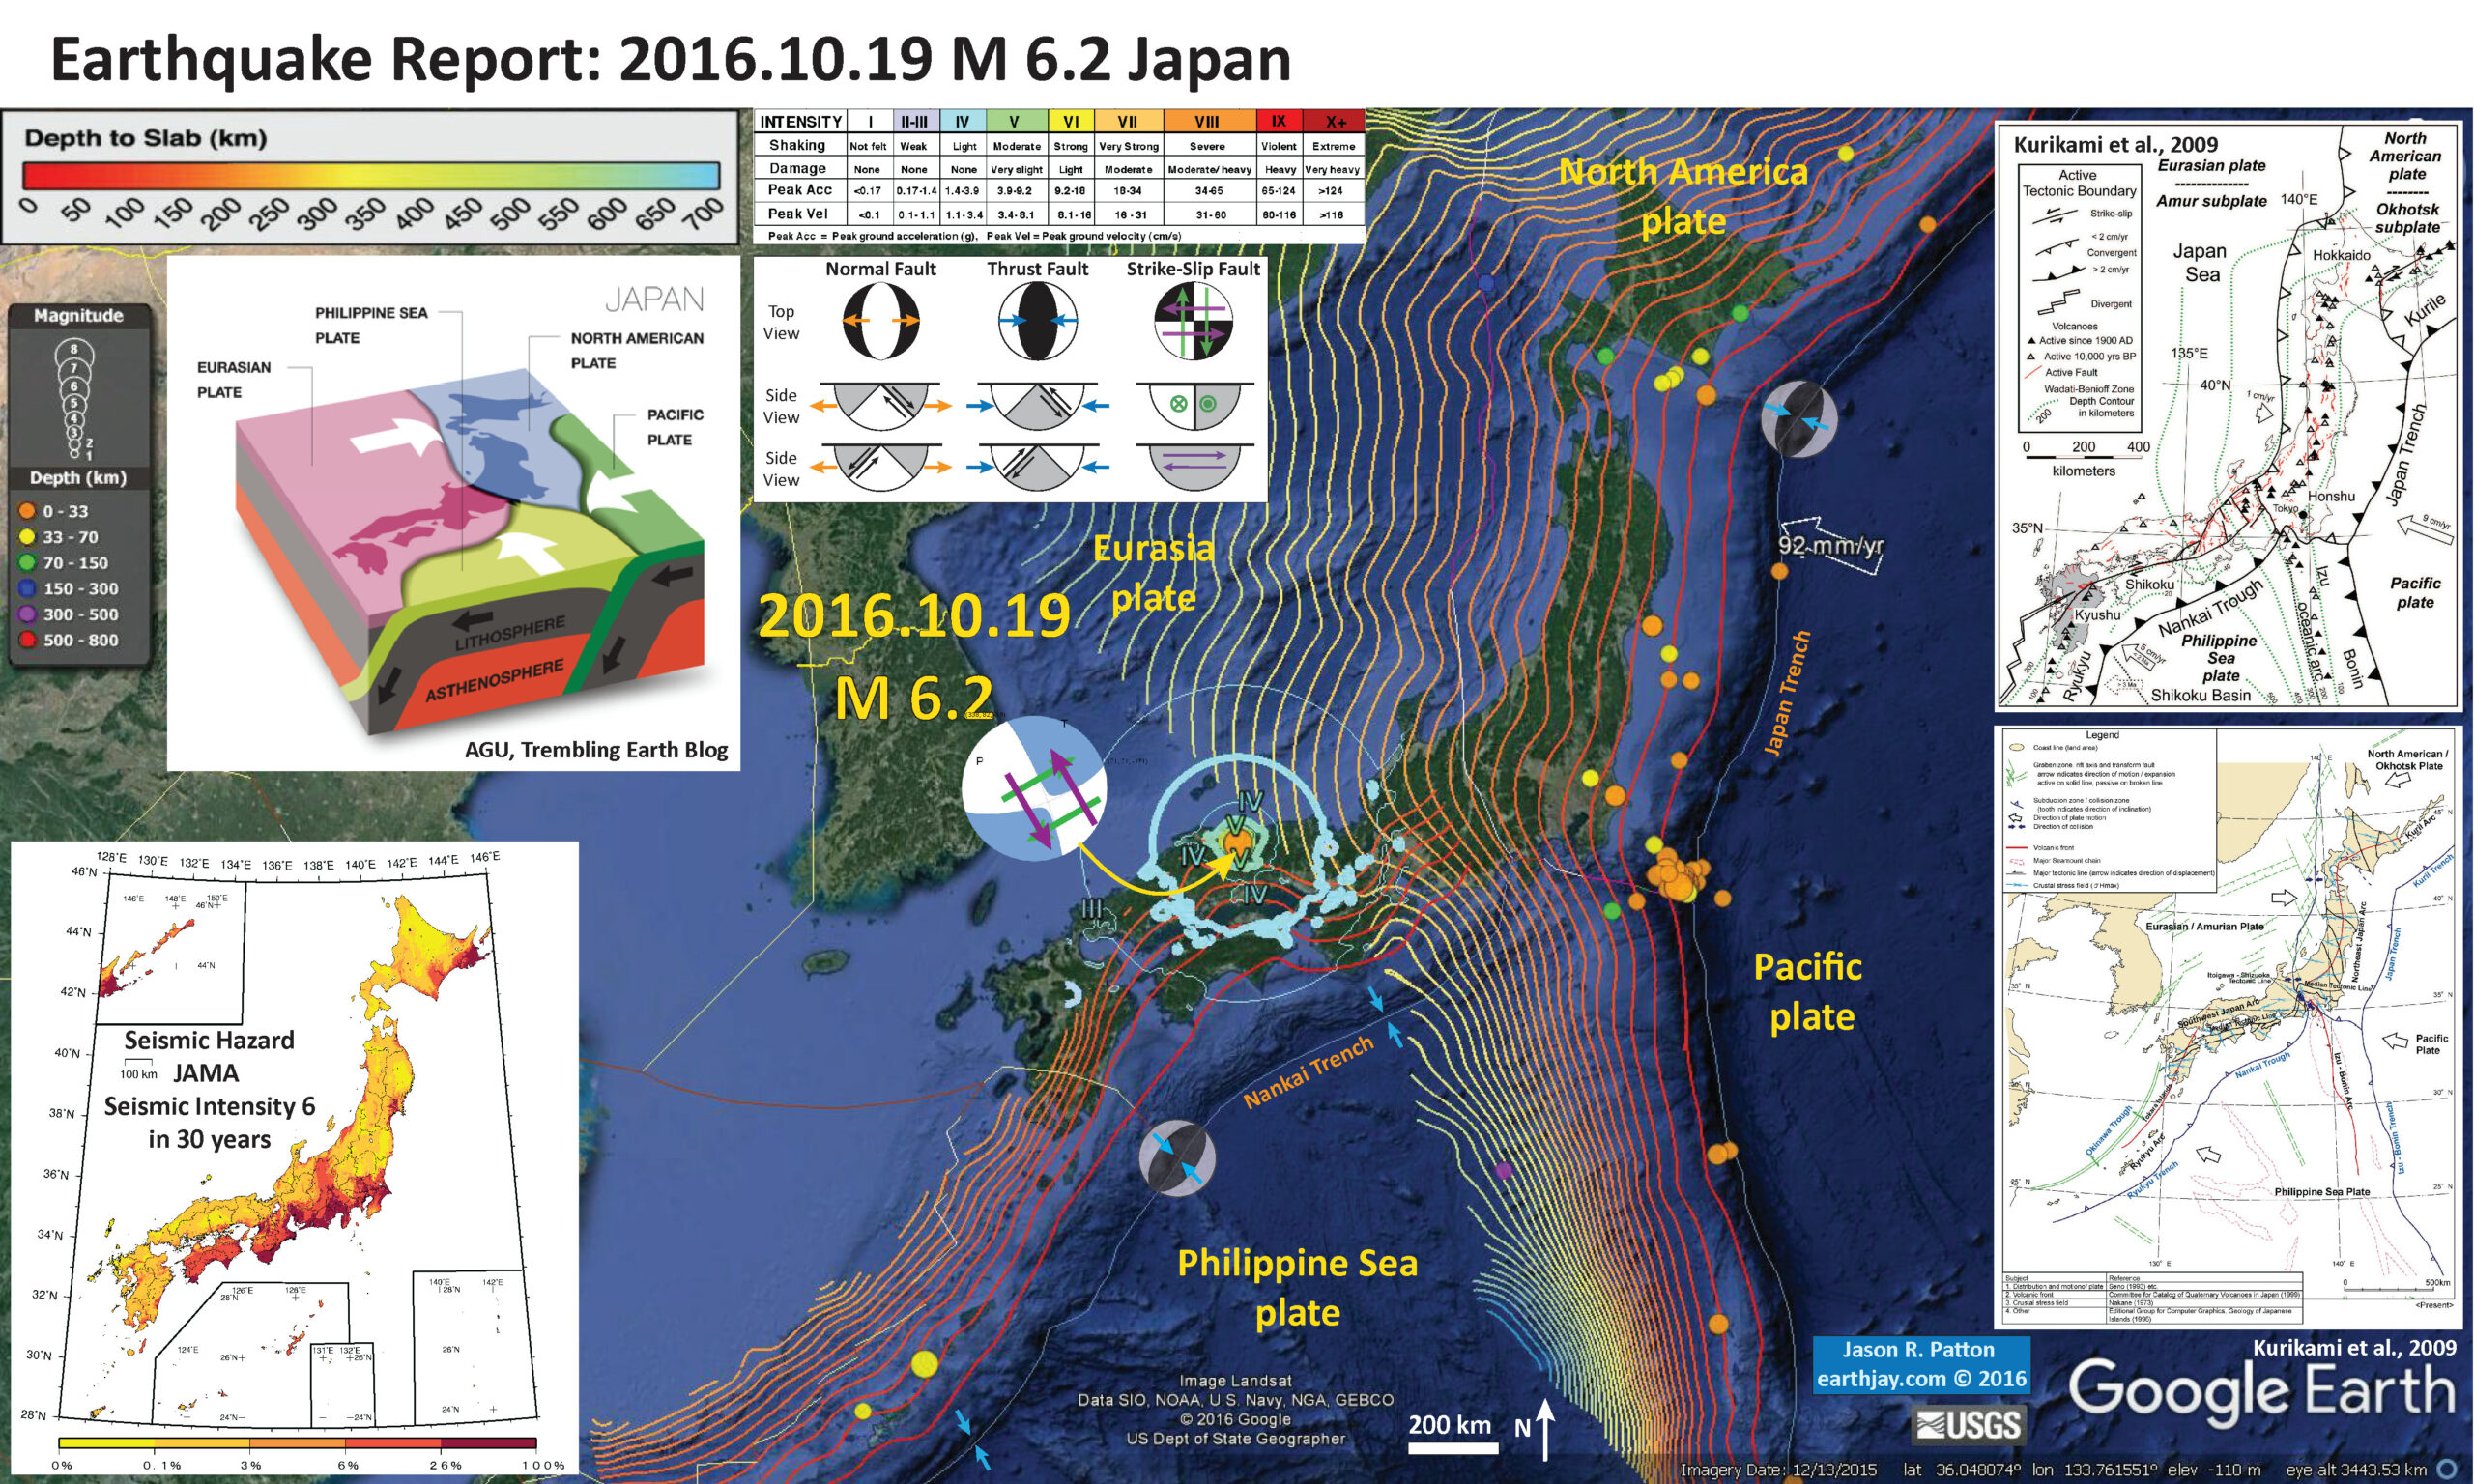
In the map below I plot the epicenters of earthquakes from the past 30 days of magnitude greater than M = 2.5. The epicenters have colors representing depth in km. The USGS plate boundaries are plotted vs color. The USGS modeled estimate for ground shaking is plotted with contours of equal ground shaking using the Modified Mercalli Intensity (MMI) scale. The MMI is a qualitative measure of shaking intensity. More on the MMI scale can be found here and here. This is based upon a computer model estimate of ground motions, different from the “Did You Feel It?” estimate of ground motions that is actually based on real observations.
I placed a moment tensor / focal mechanism legend in the lower left corner of the map. There is more material from the USGS web sites about moment tensors and focal mechanisms (the beach ball symbols). Both moment tensors and focal mechanisms are solutions to seismologic data that reveal two possible interpretations for fault orientation and sense of motion. One must use other information, like the regional tectonics, to interpret which of the two possibilities is more likely.
I include the slab contours plotted (Hayes et al., 2012), which are contours that represent the depth to the subduction zone fault. These are mostly based upon seismicity. The depths of the earthquakes have considerable error and do not all occur along the subduction zone faults, so these slab contours are simply the best estimate for the location of the fault. The hypocentral depth plots this close to the location of the fault as mapped by Hayes et al. (2012). So, the earthquake is either in the downgoing slab, or in the upper plate and a result of the seismogenic locked plate transferring the shear strain from a fracture zone in the downgoing plate to the upper plate.
Today’s earthquake may either be a left-lateral or a right-lateral strike-slip earthquake. There are some faults mapped in the area and seismicity (in map below) suggests this is probably an east-northeast striking right_lateral strike_slip earthquake.
-
I include some inset figures.
- In the right hand of the poster are two maps showing the tectonics of the region(Kurikami et al., 2009). I include these maps below.
- In the lower left corner I place a seismic hazard map for Japan. This map shows the probability of exceedance for ground motion (percent g, where g = gravitational acceleration of 9.8 m/s^2) within the next 30 years. If the ground motions exceed 100% g, then objects can be thrown into the air. Here is the source of this map, from the Japan Seismic Hazard Information Station (JSHIS). I find it interesting that today’s earthquake is in a region of low seismic hazard.
- In the upper left corner is a low angle oblique view of the tectonic configuration in this region. This is from the AGU blog, “Trembling Earth.”

- Here is a plot of seismicity (Ohmi et al., 2002). Today’s earthquake plots along the N80W striking seismicity at ~35°30’ (M 6.2 epicenter: 35.358°N 133.801°E).

Seismicity in the Tottori and surrounding region. Earthquakes from 1976 until the end of September 2000 from the catalogue of DPRI are plotted. Epicenter of the 2000 Western Tottori Earthquake is shown by a star.
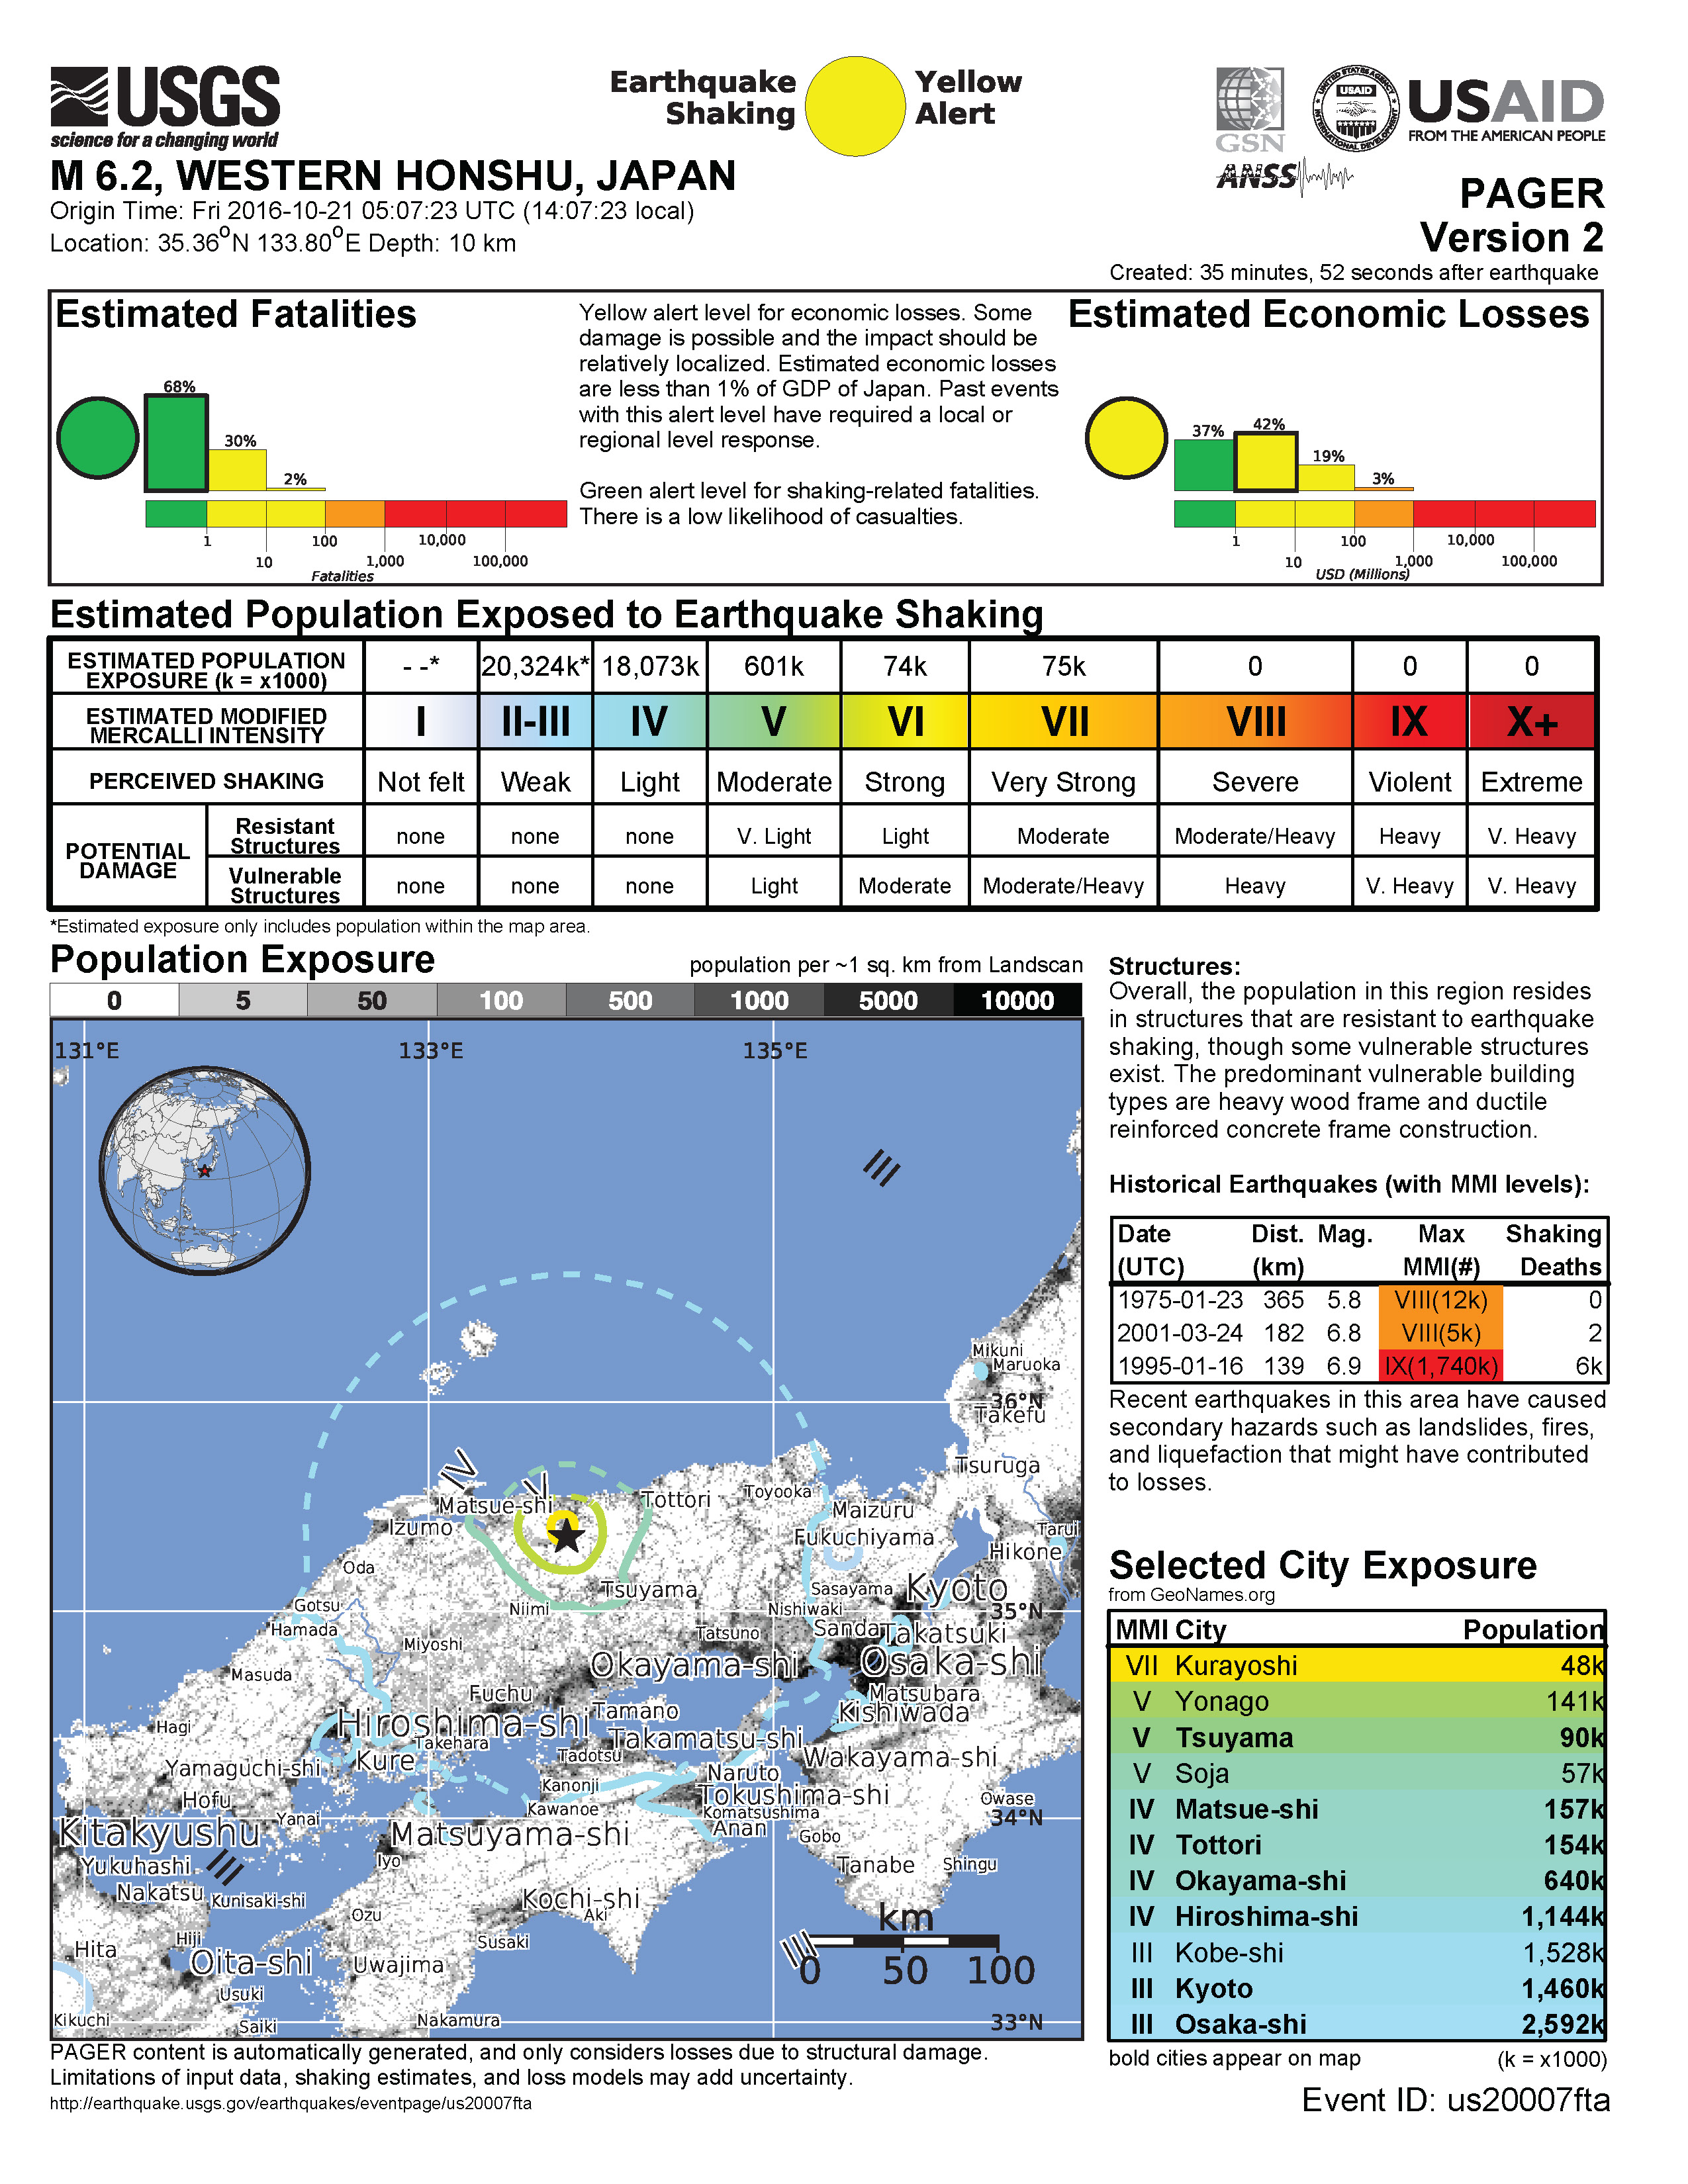
Here is the PAGER report, which is an estimate of damages to people and their belongings (infrastructure, like buildings and roads). Here is the USGS web page that explains the PAGER program and how these estimates are made.
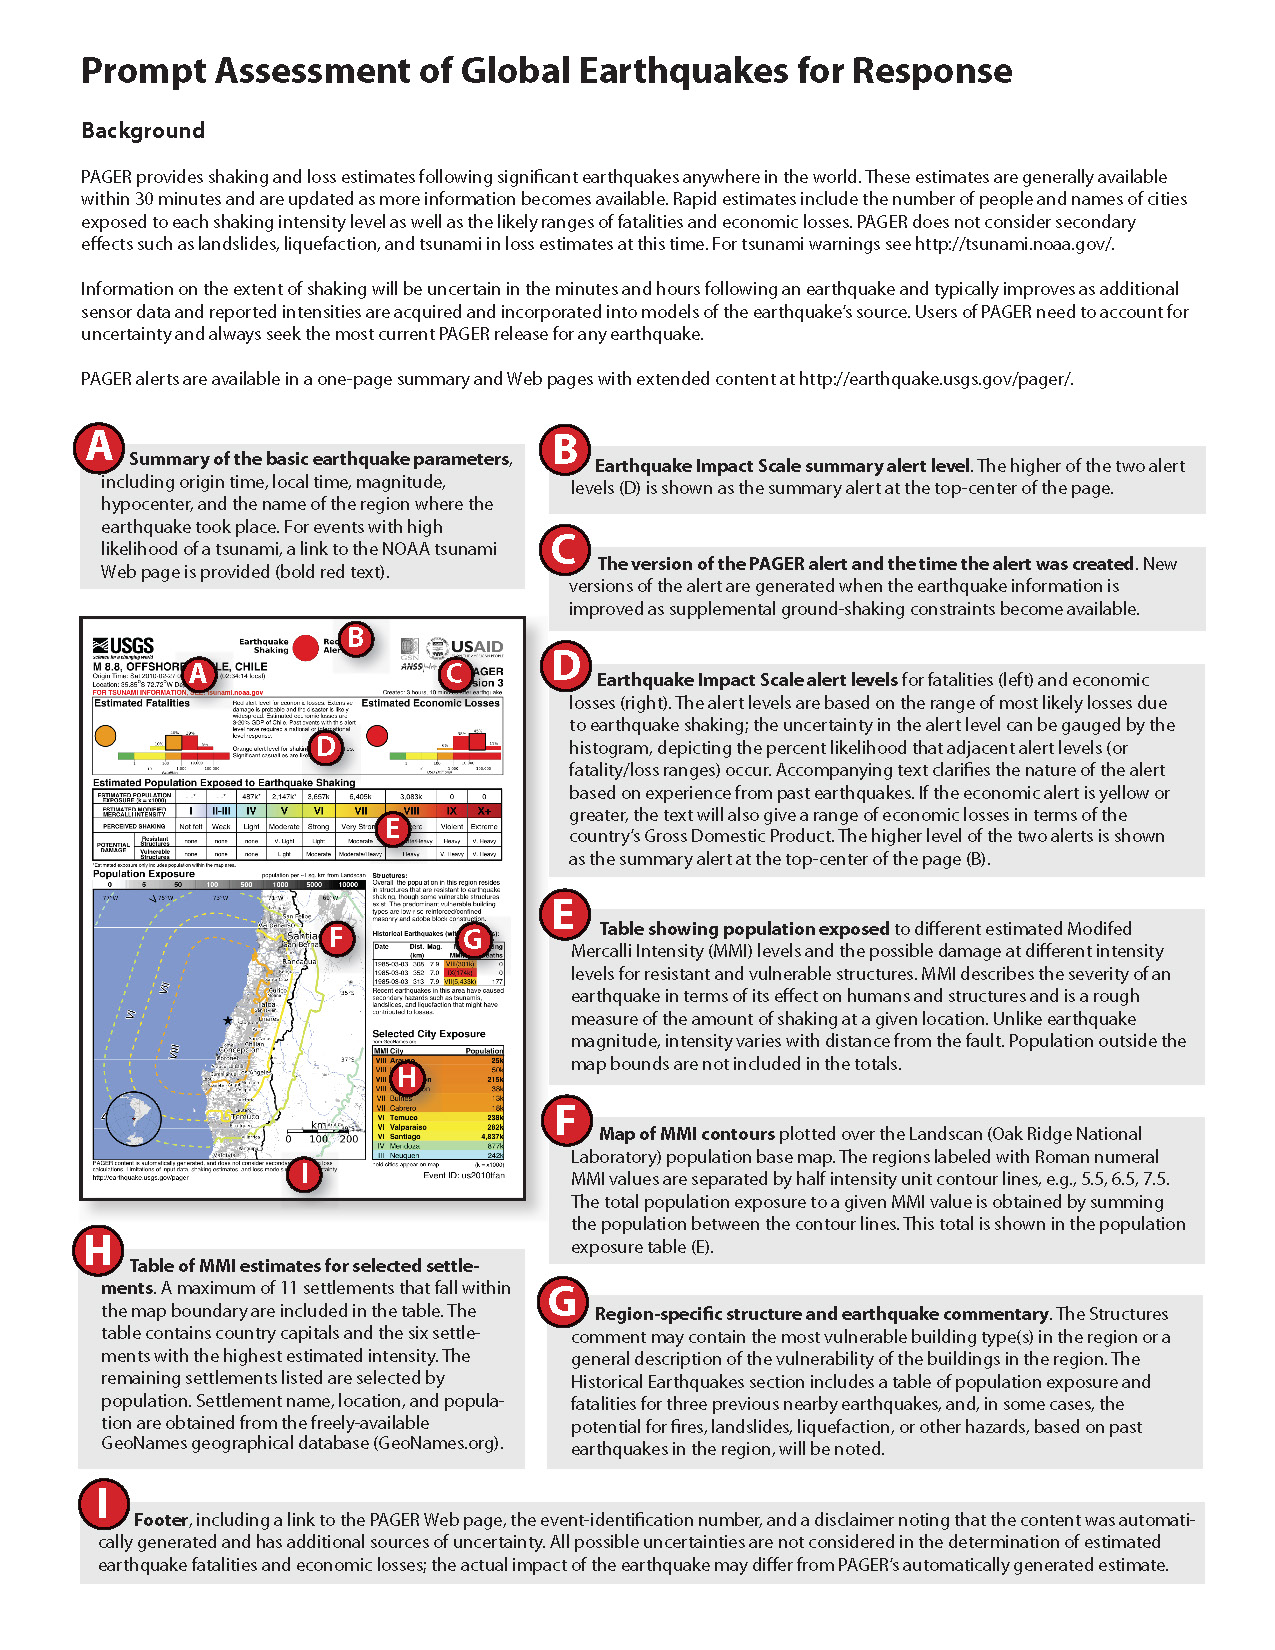
This poster below explains the PAGER alert page.
- Here is the upper figure showing the tectonic setting (Kurikami et al., 2009). I include their figure caption as a blockquote.
Tectonic setting of Kyushu within the Japanese island arc. The locations of active faults and volcanoes that have been active in the last 10,000 years are also shown.
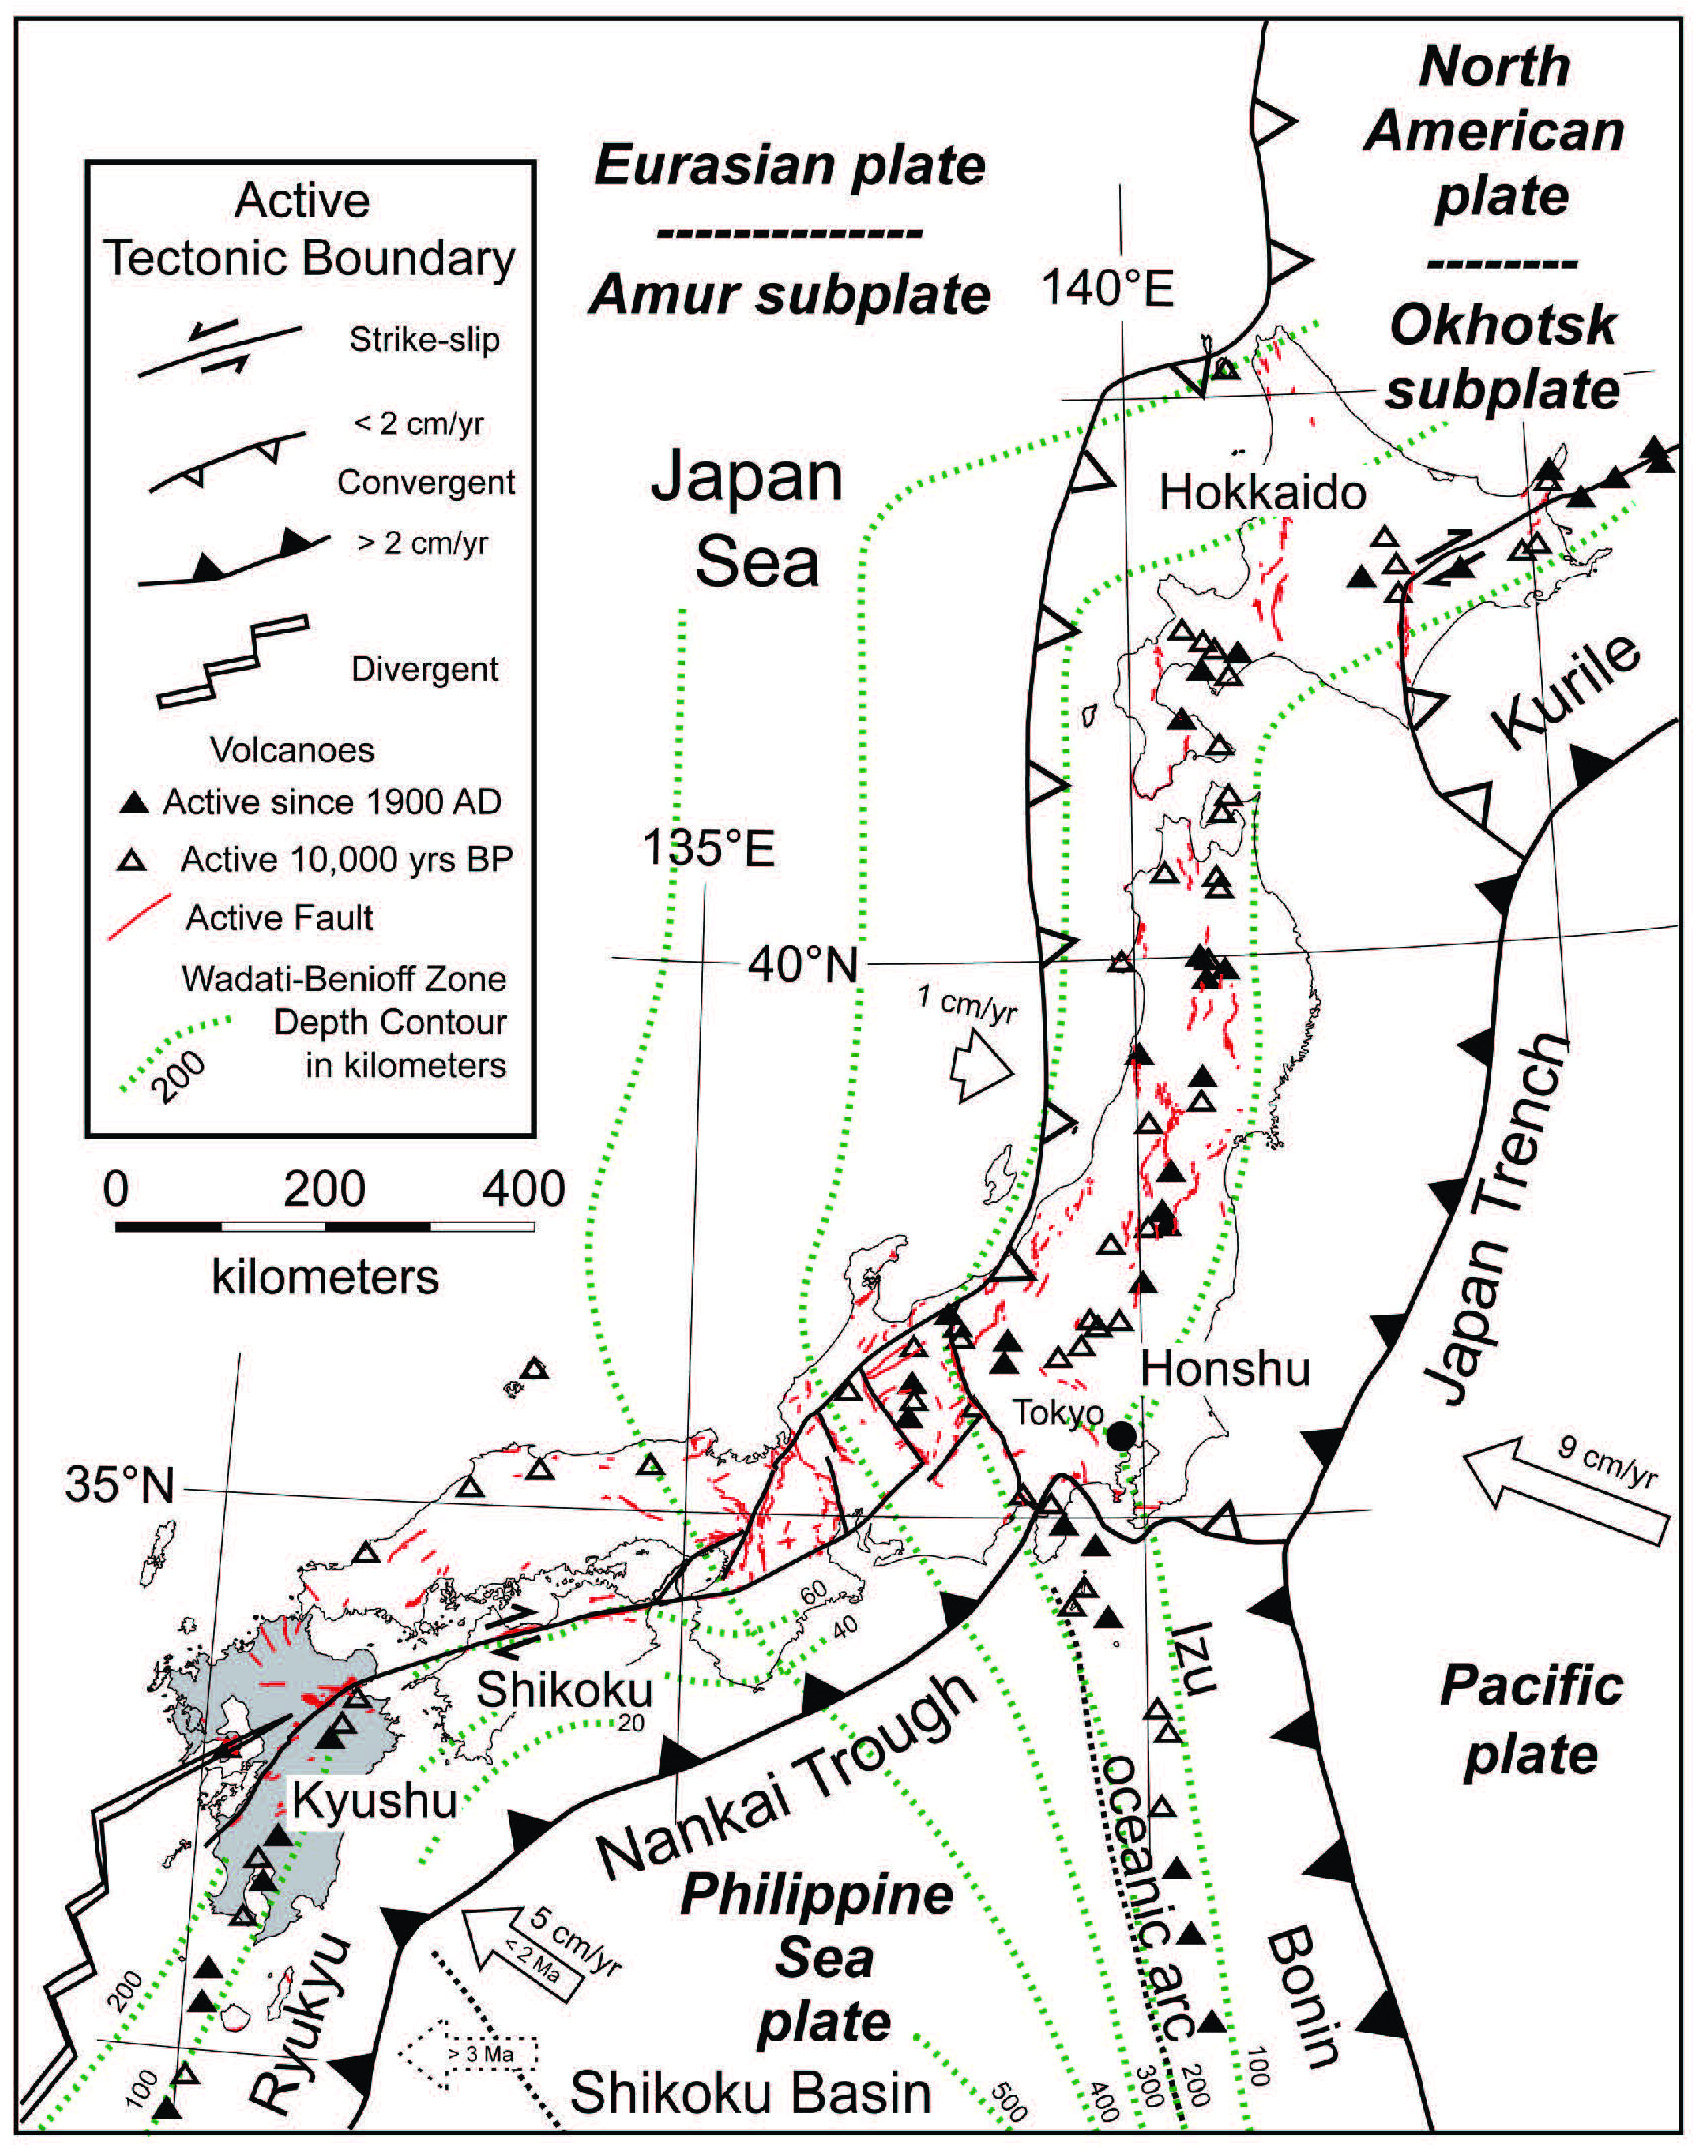
- Here is the lower figure showing the tectonic setting (Kurikami et al., 2009). I include their figure caption as a blockquote.
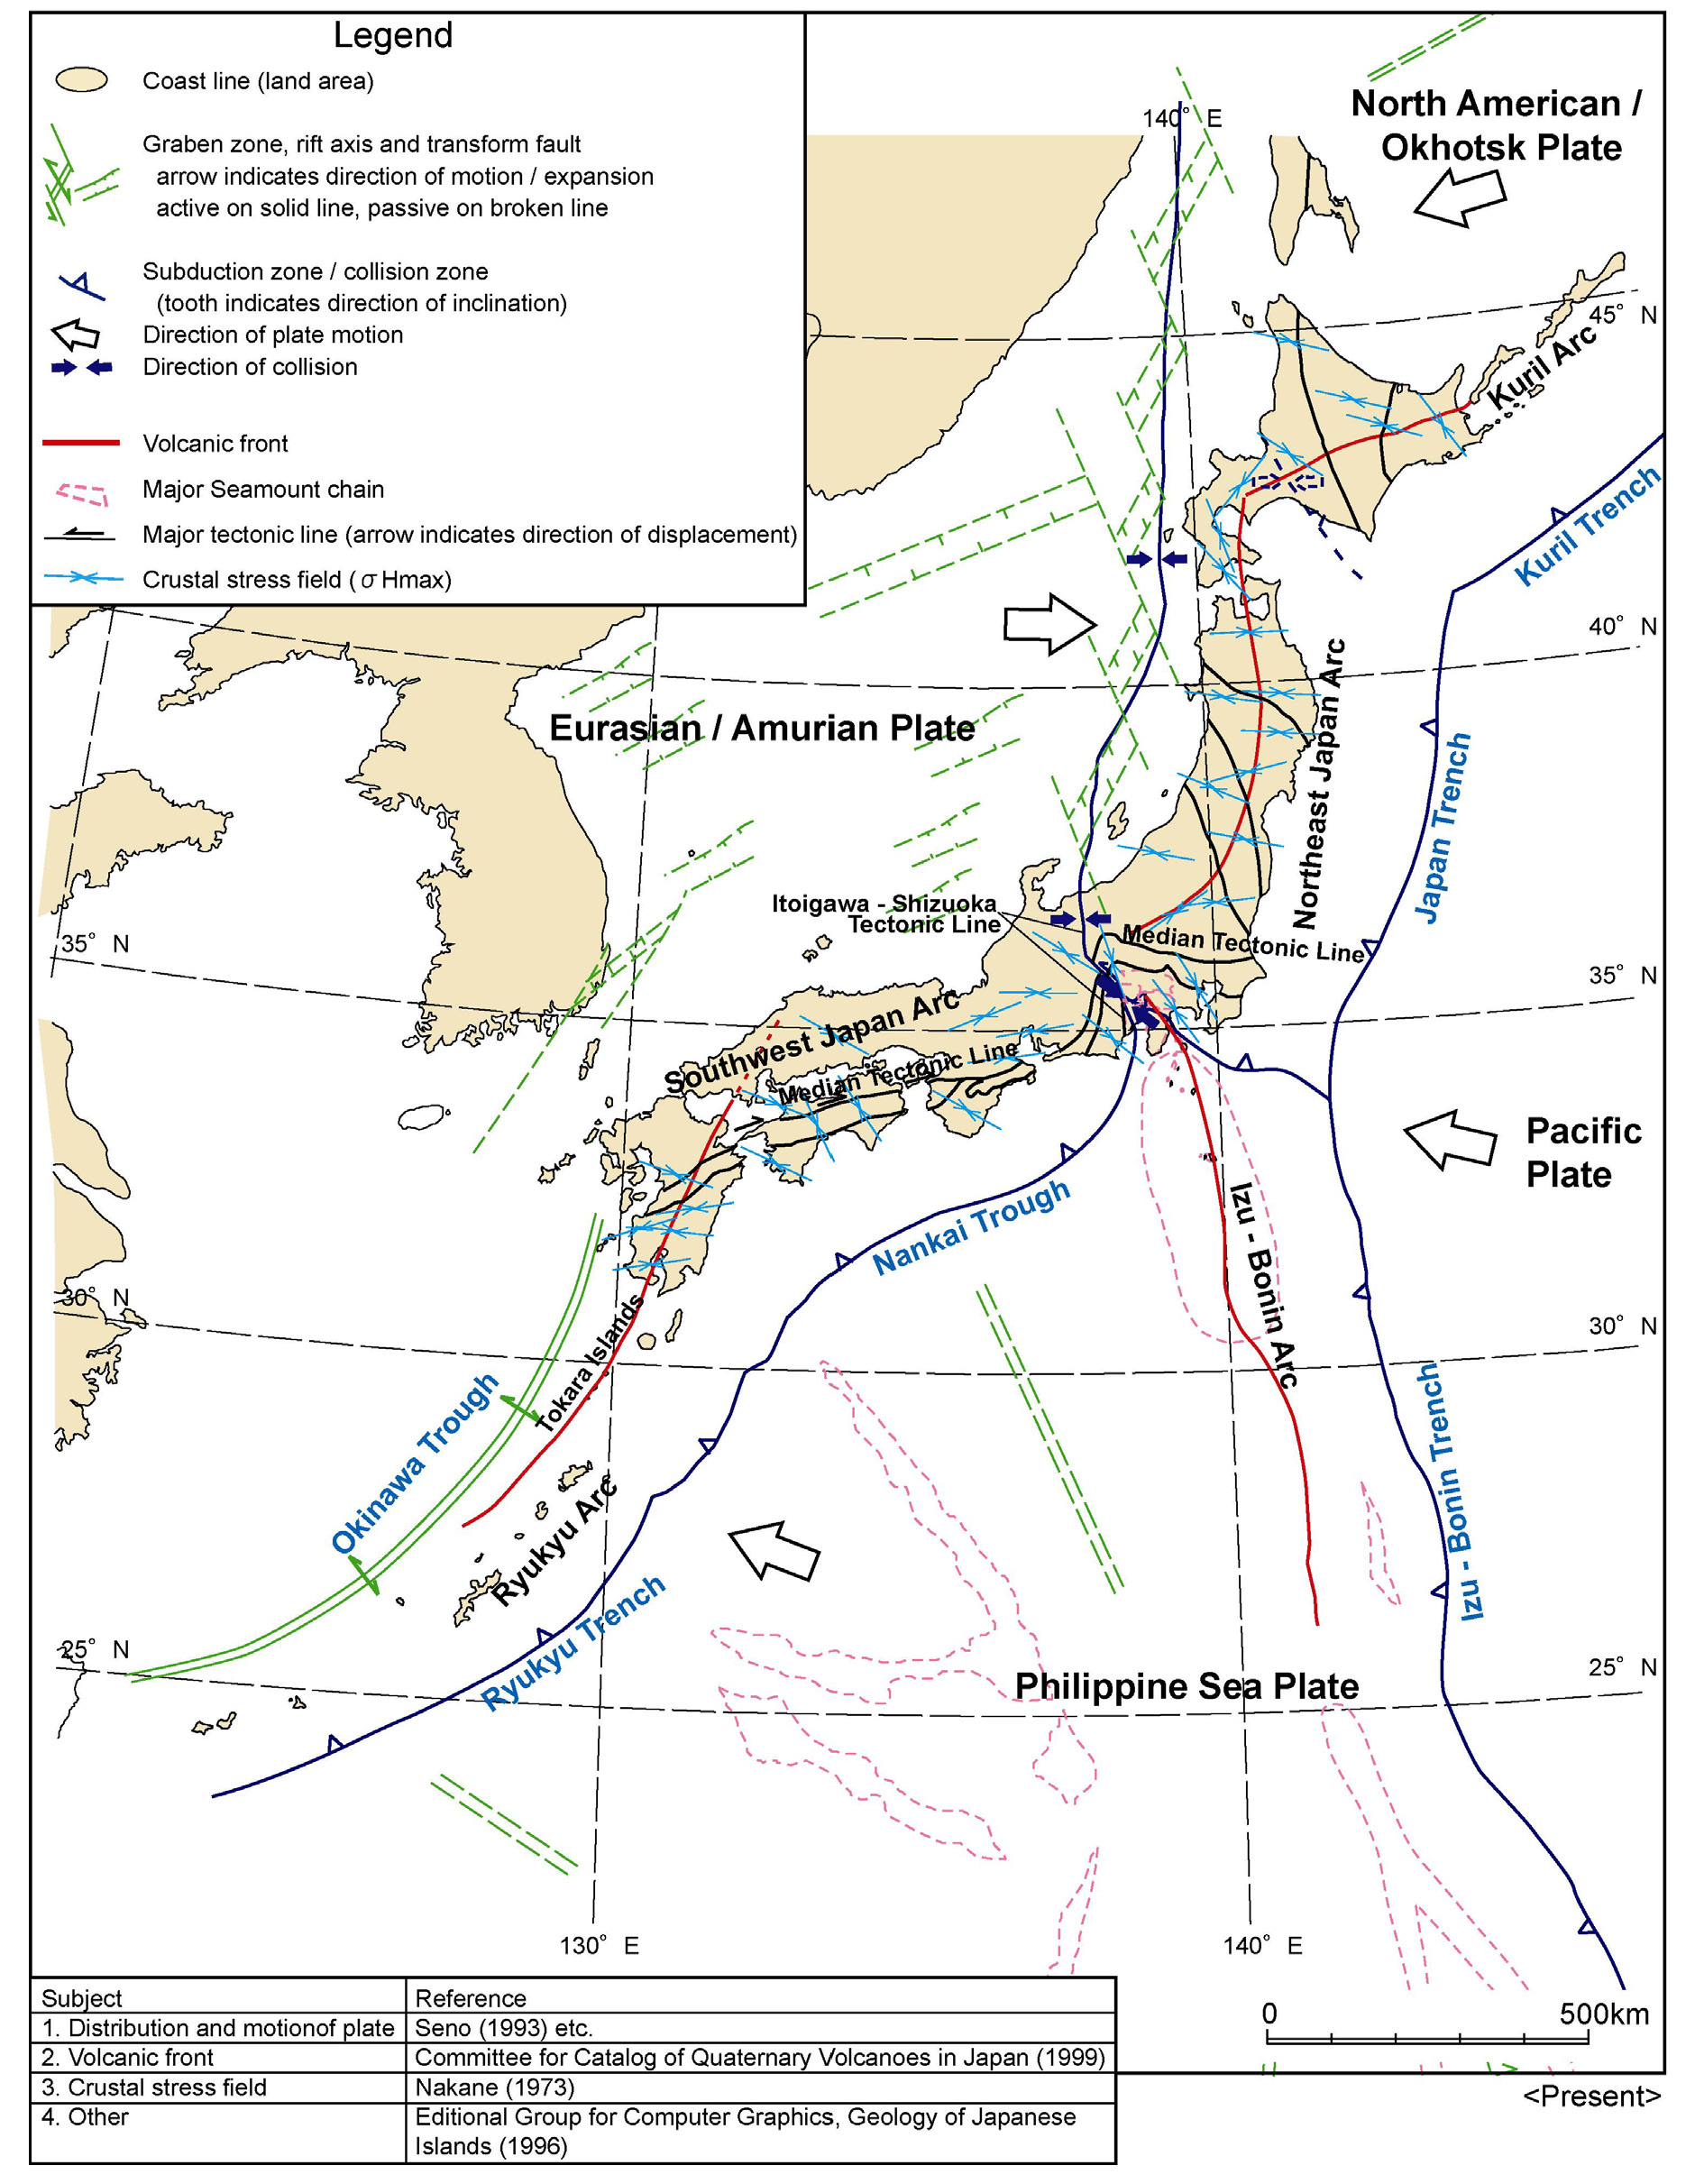
Current tectonic situation of Japan and key tectonic features.
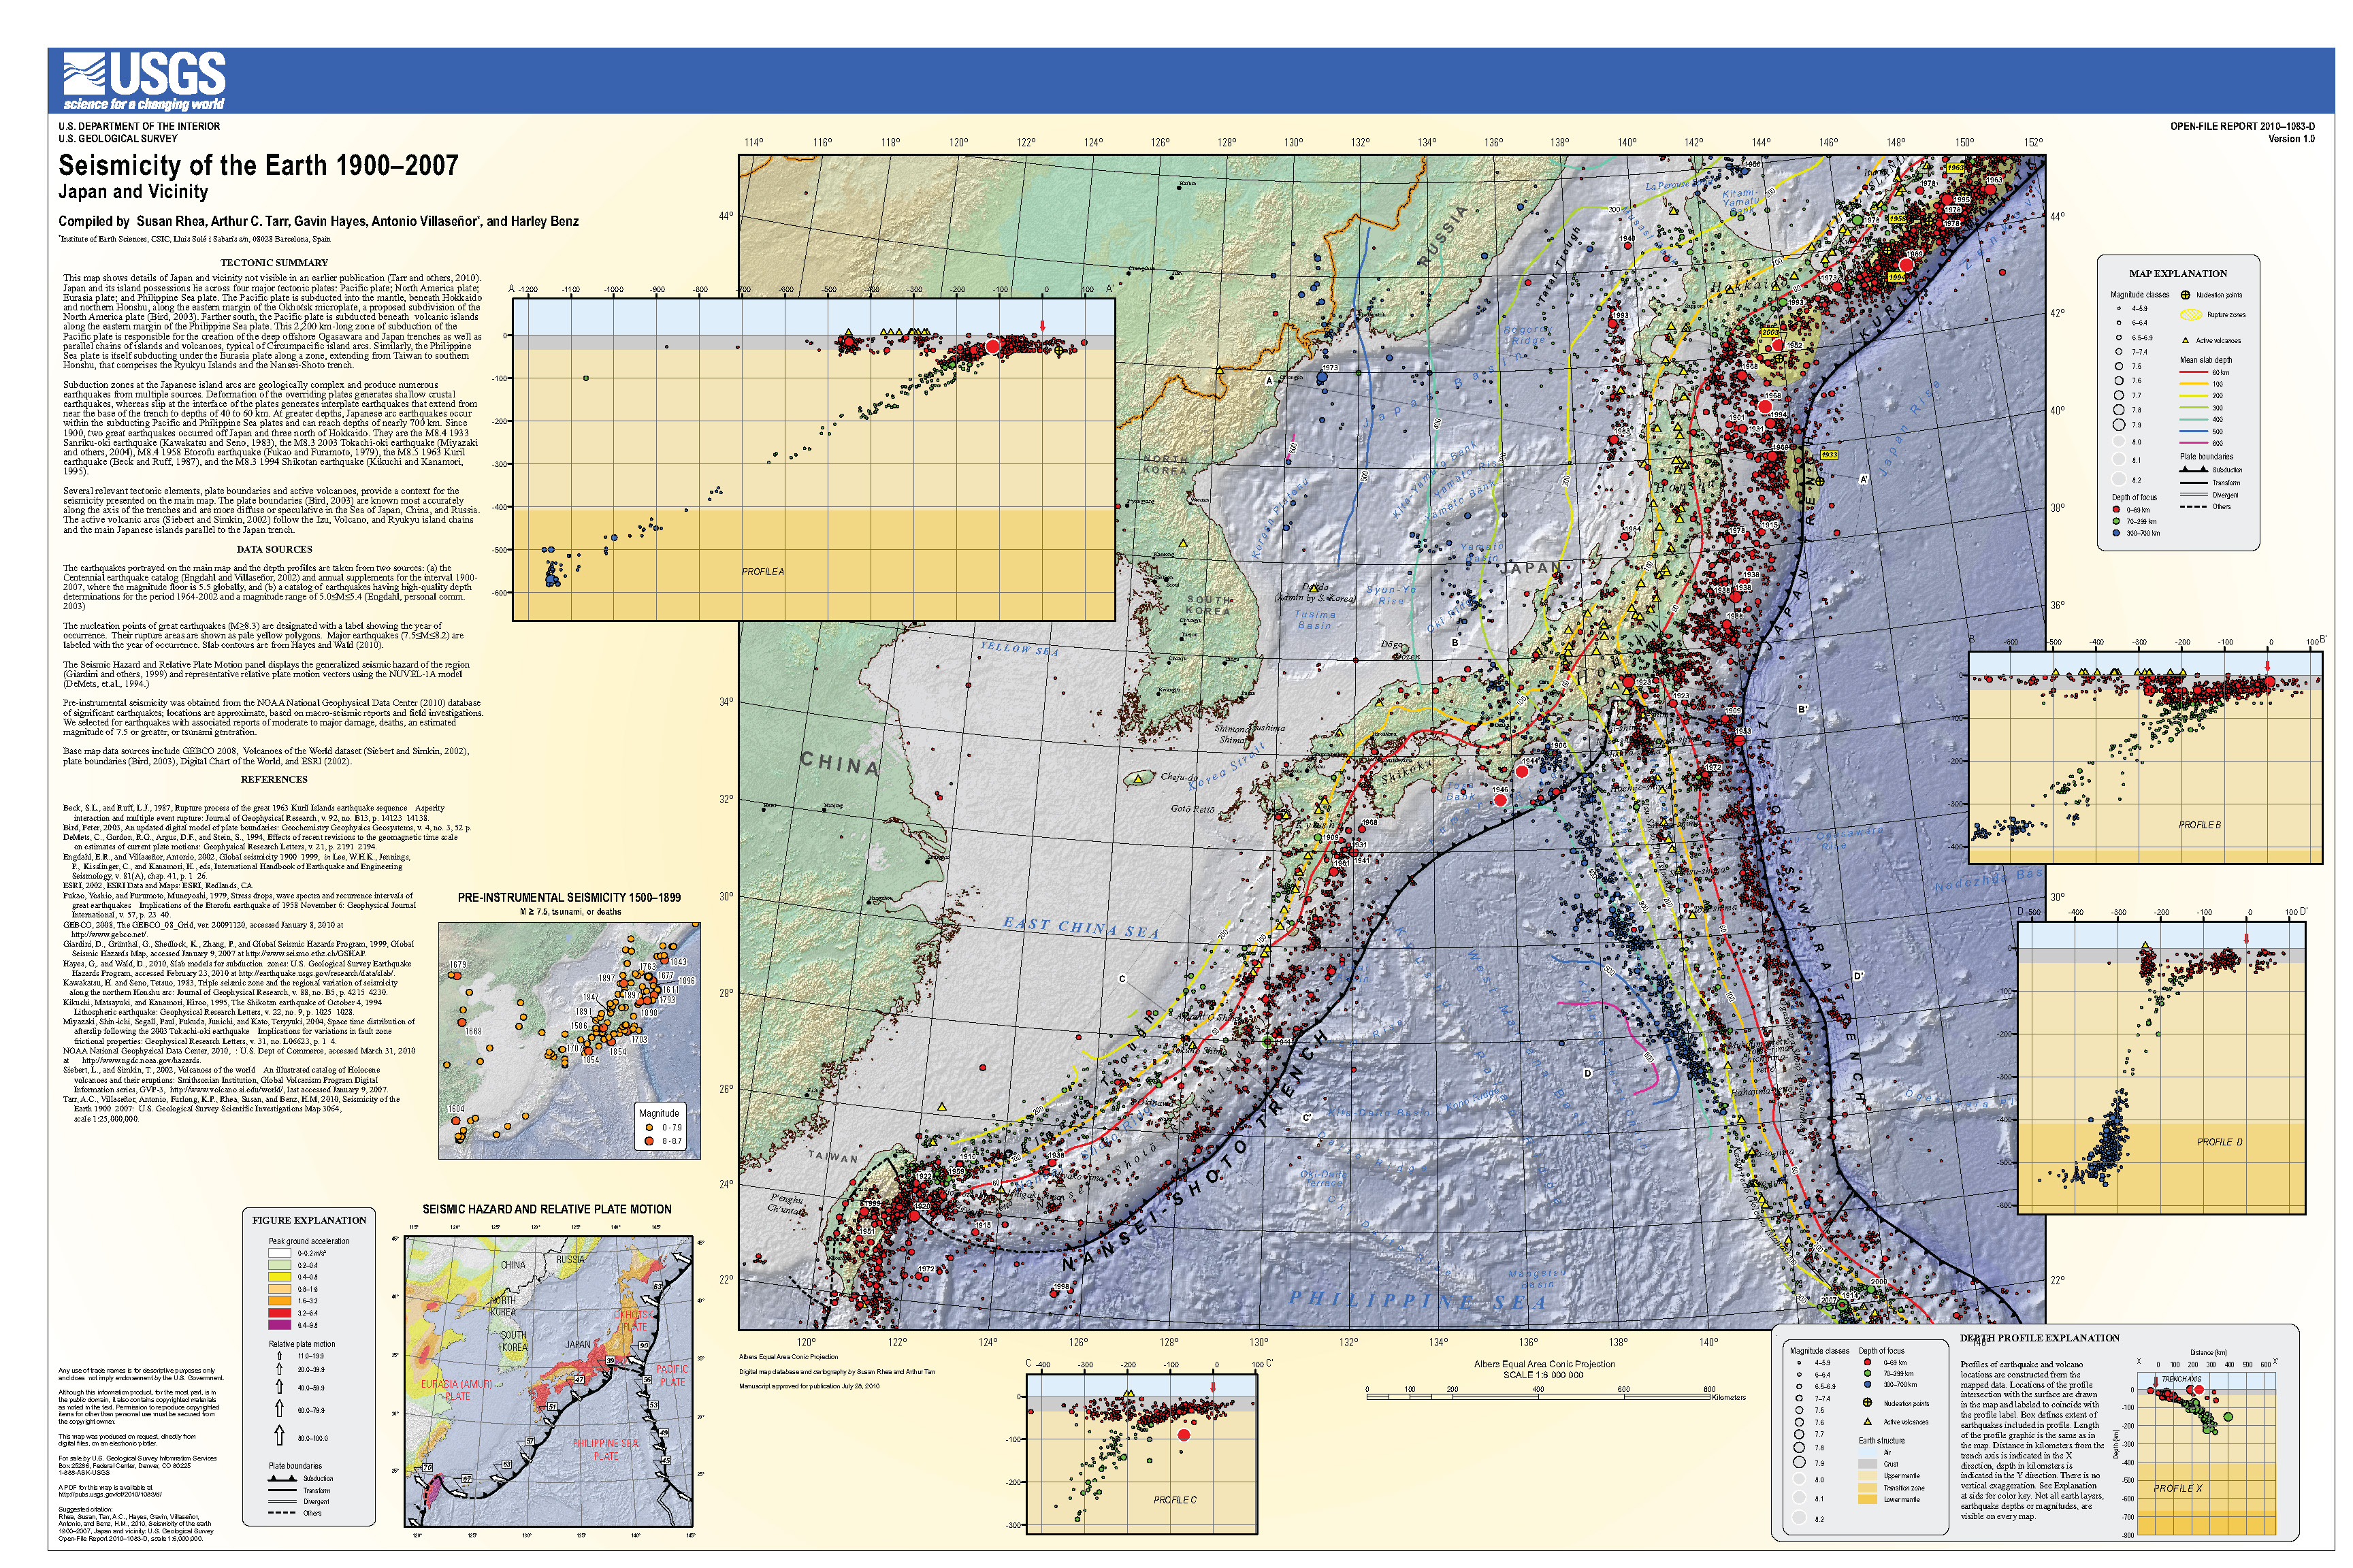
Here is a USGS poster than summarizes the earthquake history and plate geometry for this region. This is the USGS Open File Report 2010-1083-D (Rhea et al., 2010).
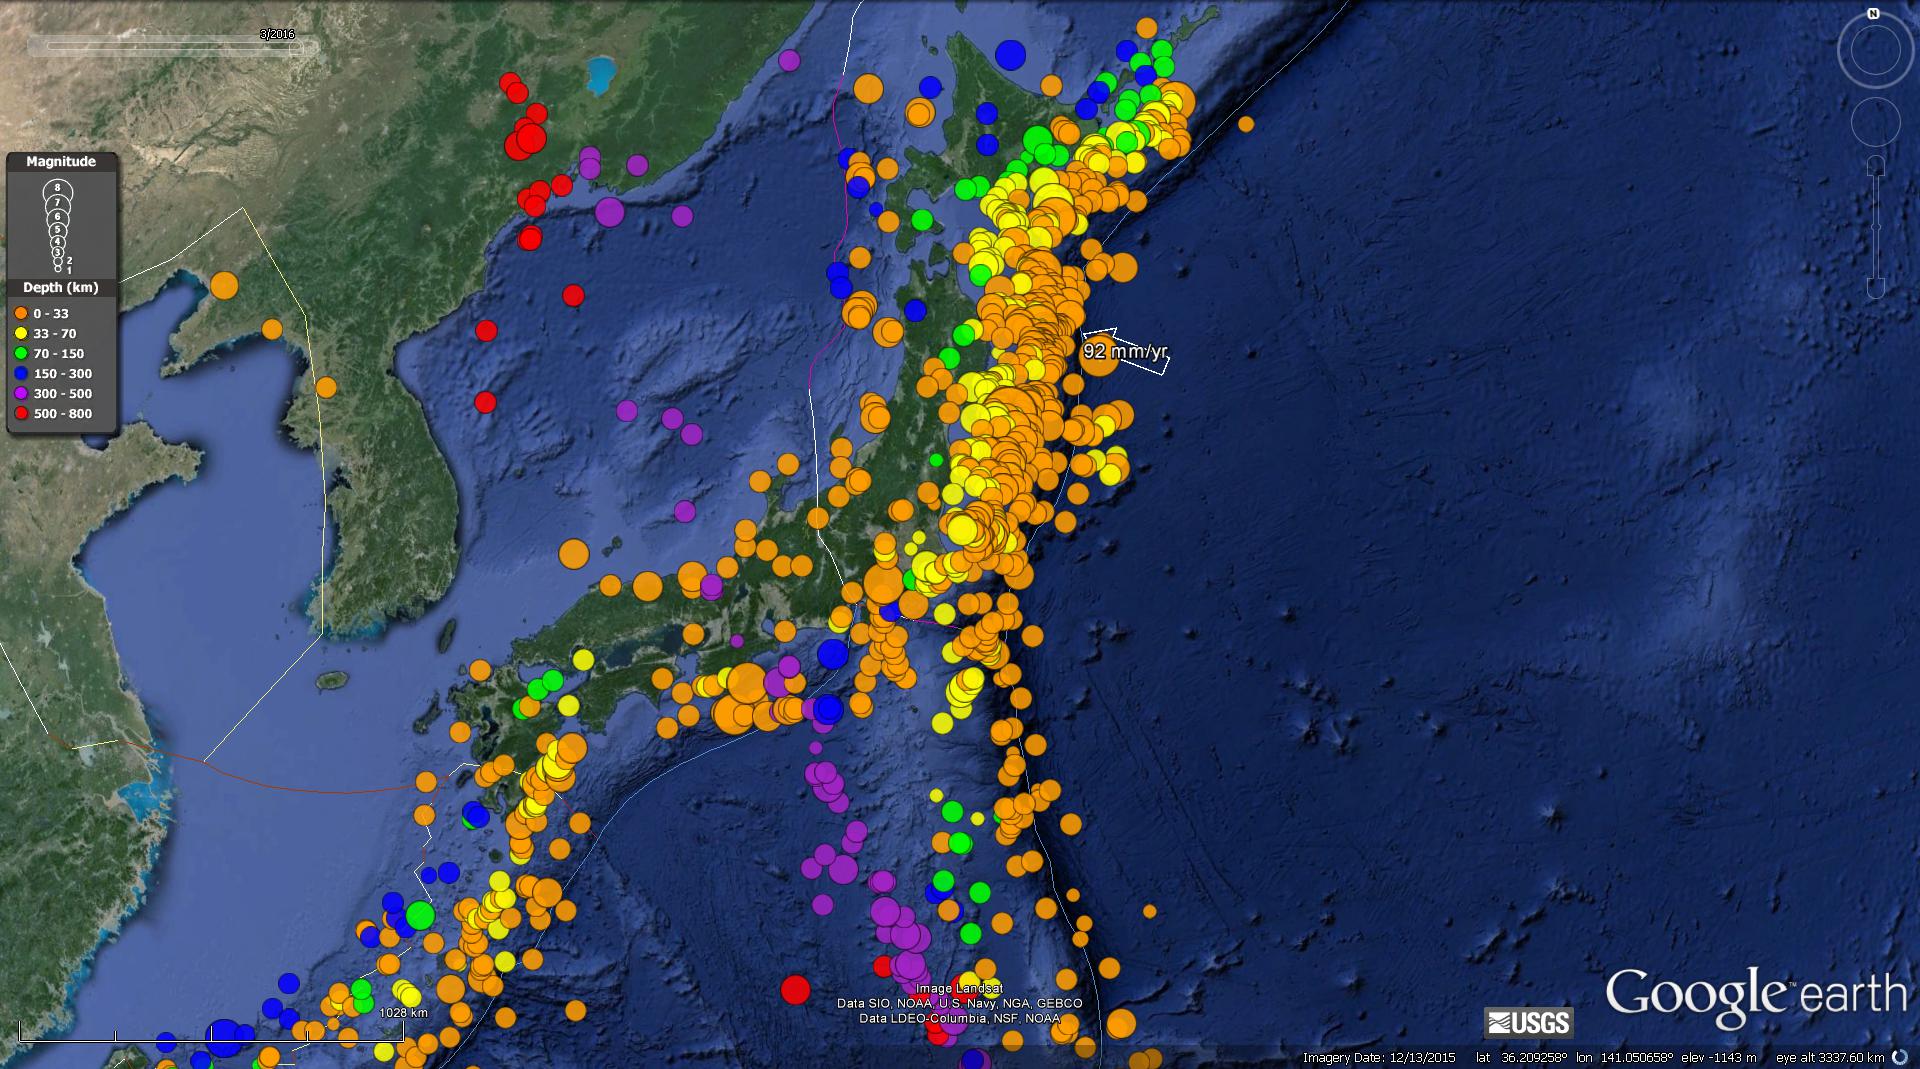
I put together an animation that shows the earthquake epicenters in Japan from 1900-2016/04/01. I include earthquakes with magnitude ≥ 6.0. Below is a screenshot of all these earthquakes, followed by the video. Here is the kml that I made using a USGS earthquake query. Here is the query that I used. The animation has an additional cross section showing the Japan trench, where the 2011/03/11 Tohoku-Oki M 9.0 subduction zone earthquake occurred. Here is a summary of the observations made following that 2011 earthquake.
- Here is a link to the embedded video below (for download). (20 MB mp4)
- 2016.10.19 M 6.2 Japan
- 2016.08.20 M 6.0 Japan
- 2016.04.14 M 6.2 Japan
- 2016.04.01 M 6.0 Japan
- 2015.02.25 M 6.3 Japan (Sanriku Coast Update #5)
- 2015.02.21 M 6.7 Japan (Sanriku Coast Update #4)
- 2015.02.20 M 6.7 Japan (Sanriku Coast Update #3)
- 2015.02.16 M 6.7 Japan (Sanriku Coast Update #2)
- 2015.02.16 M 6.7 Japan (Sanriku Coast Update #1)
- 2015.02.16 M 6.7 Japan (Sanriku Coast)
- 2013.10.25 M 7.1 Japan (Honshu)
- 2011.03.11 M 9.0 Japan (Tohoku-Oki)
Earthquakes of Japan
General Overview
Earthquake Reports
-
References:
- Chapman et al., 2009. Development of Methodologies for the Identification of Volcanic and Tectonic Hazards to Potential HLW Repository Sites in Japan –The Kyushu Case Study-, NUMO-TR-09-02, NOv. 2009, 192 pp.
- Kurikami et al., 2009. Study on strategy and methodology for repository concept development for the Japanese geological disposal project, NUMO-TR-09-04, Sept. 20-09, 101 pp.
- Ohmi, S., Watanabe, K., Shibutani, T., Hirano, N., and Nakano, S., 2002. The 2000 Western Tottori Earthquake—Seismic activity revealed by the regional seismic networks in Earth Planets Space, v. 54, p. 819-830.
- Rhea, S., Tarr, A.C., Hayes, G., Villaseñor, A., and Benz, H.M., 2010. Seismicity of the earth 1900–2007, Japan and vicinity: U.S. Geological Survey Open-File Report 2010–1083-D, scale 1:6,000,000.