We just had an earthquake along a fracture zone within the Explorer plate. The Explorer plate is the northernmost subducting plate in the Cascadia subduction zone system. I post material about the CSZ here and here.
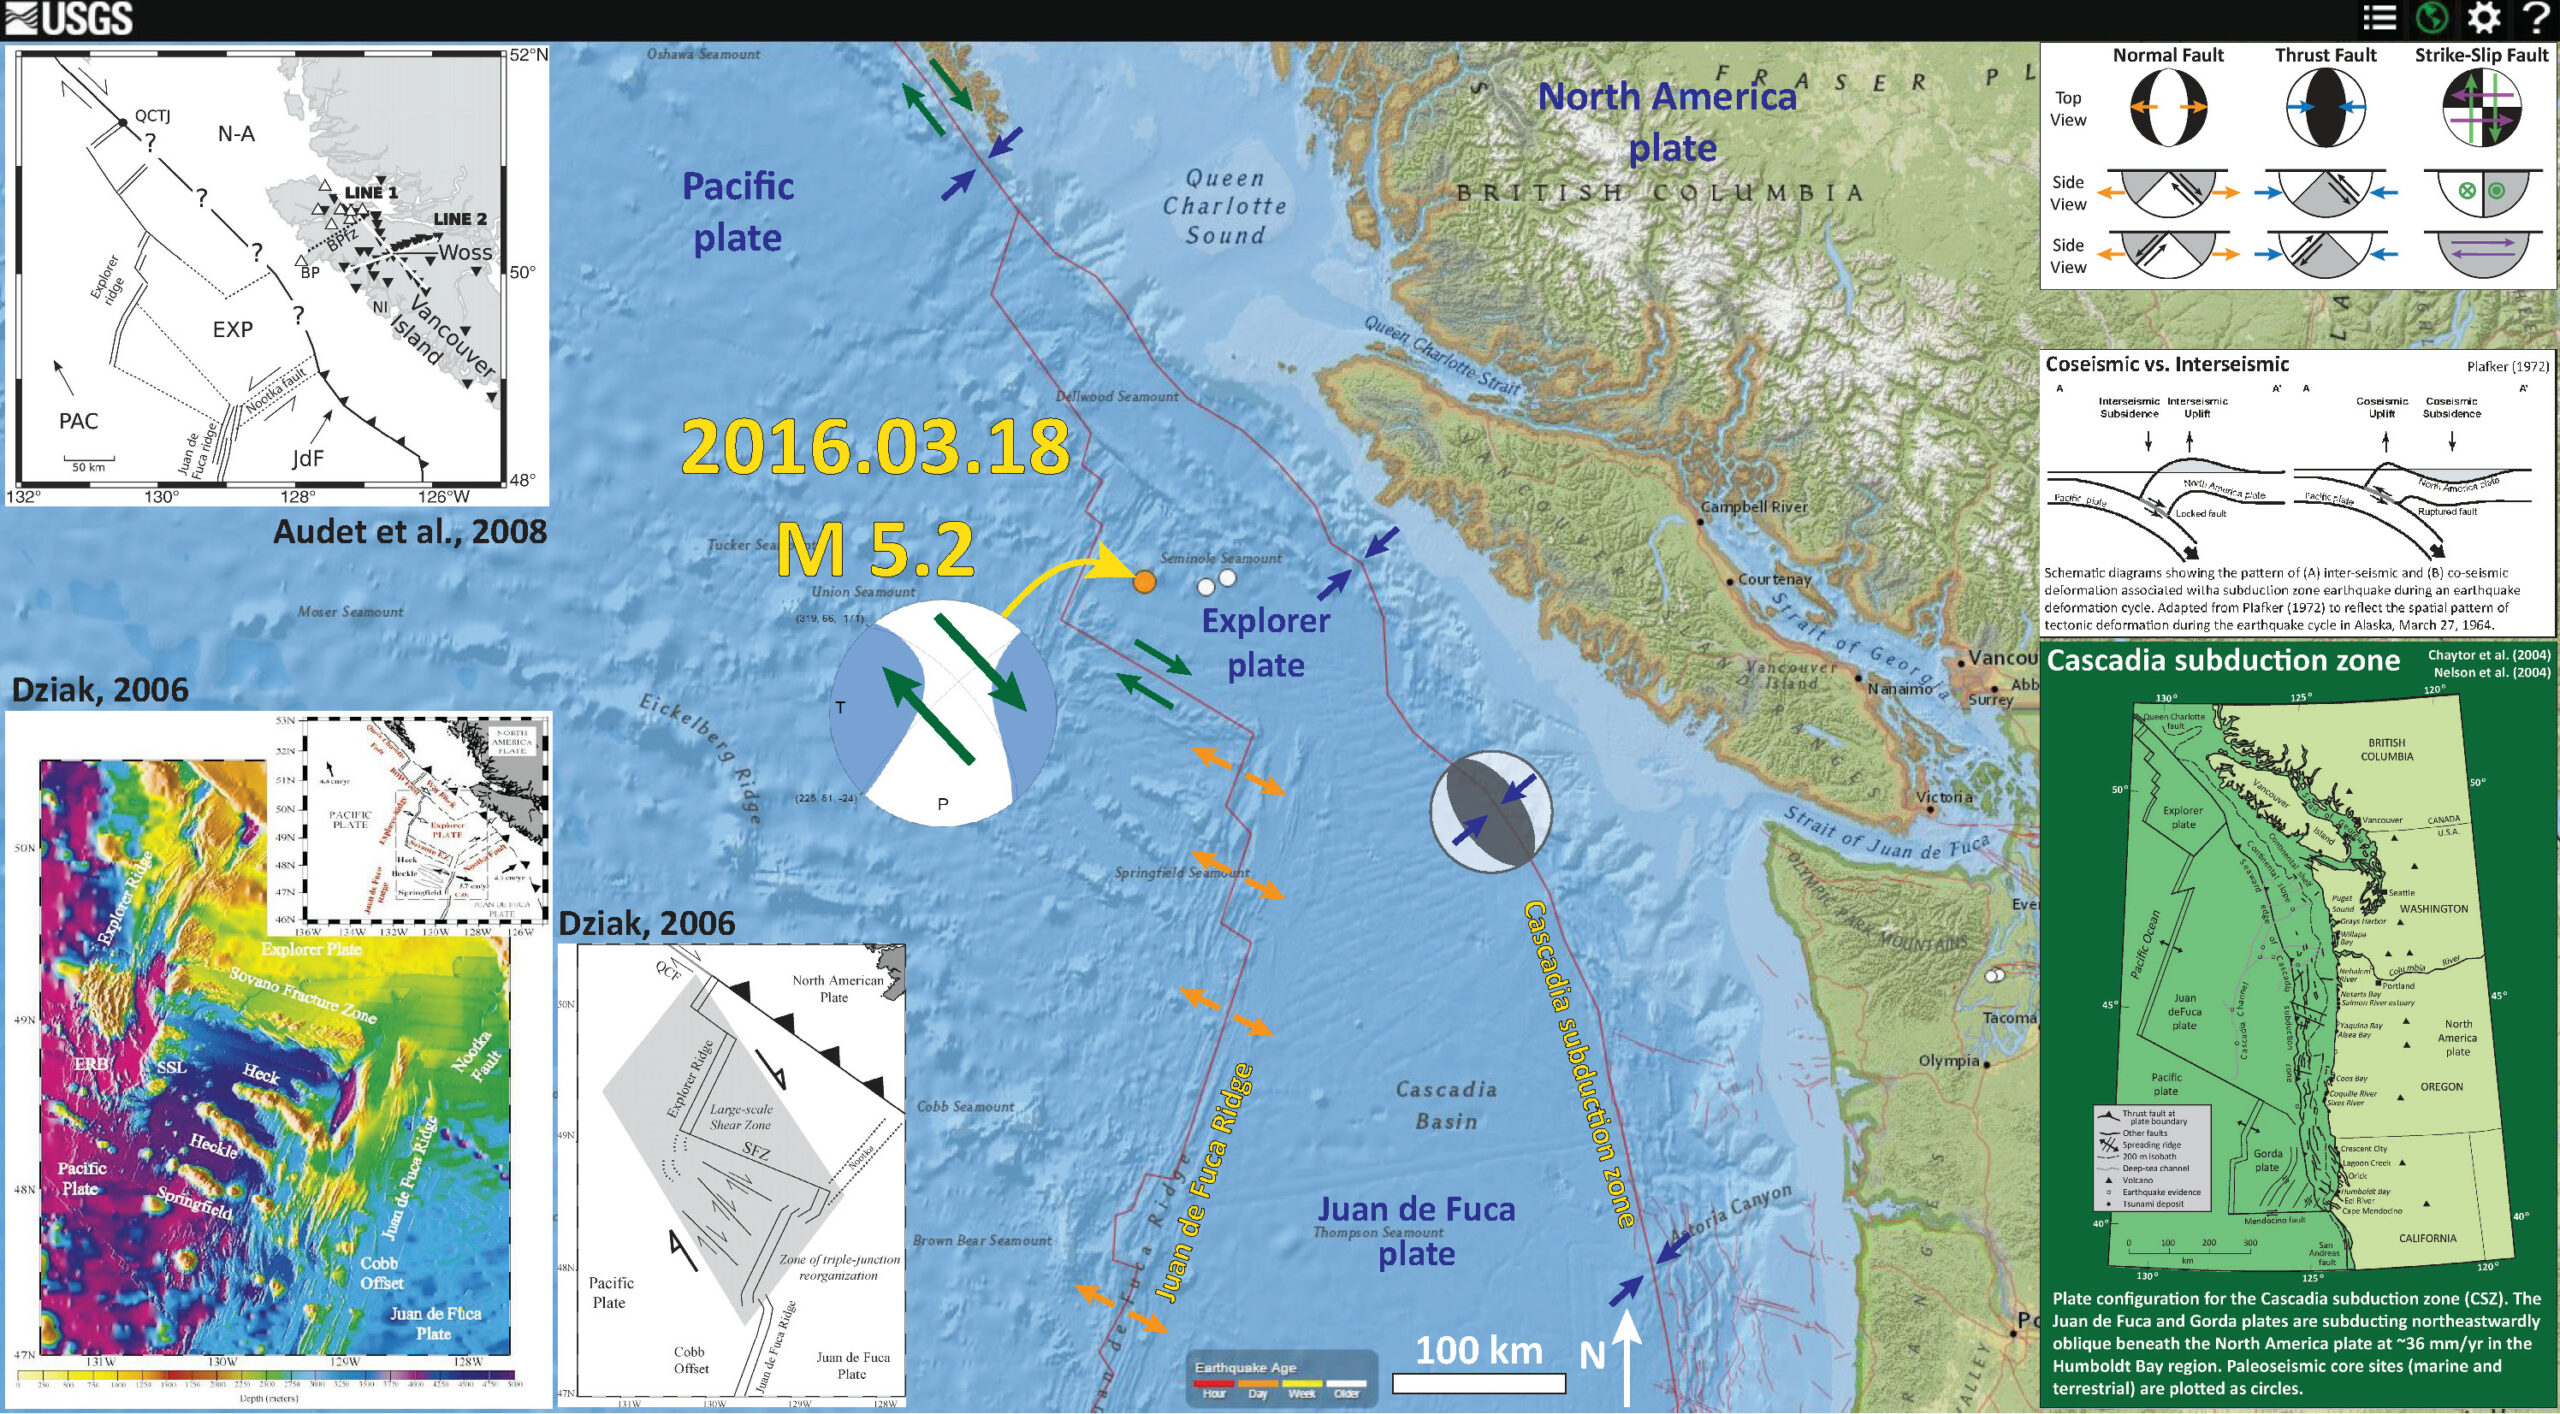
Below is my earthquake report poster for this earthquake. The M 5.2 earthquake is plotted as an orange circle and I include the USGS moment tensor. Here is the USGS web page for this M 5.2 earthquake. Based upon the bathymetry and the papers below (Dziak, 2006; Audet et al., 2008 ), I interpret this earthquake to be a right-lateral strike-slip earthquake.
There is a legend that shows how moment tensors can be interpreted. Moment tensors are graphical solutions of seismic data that show two possible fault plane solutions. One must use local tectonics, along with other data, to be able to interpret which of the two possible solutions is correct. The legend shows how these two solutions are oriented for each example (Normal/Extensional, Thrust/Compressional, and Strike-Slip/Shear). There is more about moment tensors and focal mechanisms at the USGS.
In 2012/10/22 there was a subduction zone earthquake along the plate boundary near Haida Gwaii, the island to the northwest of the label “Queen Charlotte Sound.” Here is the USGS web site for the M 7.8 Haida Gwaii earthquake. Earlier maps show this boundary to be strike slip (large earthquakes to the north were strike slip), but the M 7.8 clearly shows that there is compressional tectonics here. Looking at the bathymetry available, there is also an accretionary prism here as well. Note that I label this boundary as strike-slip and convergent.
I include some inset maps from Audet et al. (2008 ) and Dziak (2006). Each of these authors have published papers about the Explorer plate. Dziak (2006) used bathymetric and seismologic data to evaluate the faulting in the region and discussed how the Explorer plate is accommodating a reorganization of the plate boundary. Audet et al. (2008 ) use terrestrial seismic data to evaluate the crust along northern Vancouver Island and present their tectonic map as part of this research (though they do not focus on the offshore part of the Explorer plate). I include these figures below along with their figure captions.
The Cascadia subduction zone is an approximately 1,200-kilometer convergent plate boundary that extends from northern California to Vancouver Island, Canada (inset figure). The Explorer, Juan de Fuca, and Gorda plates are subducting eastwardly below the North American plate. Seismicity, crustal deformation, and geodesy provide evidence that the Cascadia subduction zone is locked and is capable of producing a great (magnitude greater than or equal to 8.5) earthquake (Heaton and Kanamori, 1984; McPherson, 1989; Clarke and Carver, 1992; Hyndman and Wang, 1995; Flück and others, 1997).

- Dziak, 2006
- Dziak, 2006
- Dziak, 2006
- Dziak, 2006
- Audet et al., 2008
- AUdet, P., Bostock, M.G., Mercier, J.-P., and Cassidy, J.F., 2008., Morphology of the Explorer–Juan de Fuca slab edge in northern Cascadia: Imaging plate capture at a ridge-trench-transform triple junction in Geology, v. 36, p. 895-898.
- Clarke, S. H., and Carver, G. C., 1992. Late Holocene Tectonics and Paleoseismicity, Southern Cascadia Subduction Zone, Science, vol. 255:188-192.
- Dziak, R.P., 2006. Explorer deformation zone: Evidence of a large shear zone and reorganization of the Pacific–Juan de Fuca–North American triple junction in Geology, v. 34, p. 213-216.
- Flück, P., Hyndman, R. D., Rogers, G. C., and Wang, K., 1997. Three-Dimensional Dislocation Model for Great Earthquakes of the Cascadia Subduction Zone, Journal of Geophysical Research, vol. 102: 20,539-20,550.
- Heaton, f f., Kanamori, F. F., 1984. Seismic Potential Associated with Subduction in the Northwest United States, Bulletin of the Seismological Society of America, vol. 74: 933-941.
- Hyndman, R. D., and Wang, K., 1995. The rupture zone of Cascadia great earthquakes from current deformation and the thermal regime, Journal of Geophysical Research, vol. 100: 22,133-22,154.
- McPherson, R. M., 1989. Seismicity and Focal Mechanisms Near Cape Mendocino, Northern California: 1974-1984: M. S. thesis, Arcata, California, Humboldt State University, 75 p
- Plafker, G., 1972. Alaskan earthquake of 1964 and Chilean earthquake of 1960: Implications for arc tectonics in Journal of Geophysical Research, v. 77, p. 901-925.
- Wang, K., Wells, R., Mazzotti, S., Hyndman, R. D., and Sagiya, T., 2003. A revised dislocation model of interseismic deformation of the Cascadia subduction zone Journal of Geophysical Research, B, Solid Earth and Planets v. 108, no. 1.

Bathymetric map of northern Juan de Fuca and Explorer Ridges. Map is composite of multibeam bathymetry and satellite altimetry (Sandwell and Smith, 1997). Principal structures are labeled: ERB—Explorer Ridge Basin, SSL—strike-slip lineation. Inset map shows conventional tectonic interpretation of region. Dashed box shows location of main figure. Solid lines are active plate boundaries, dashed line shows Winona-Explorer boundary, gray ovals represent seamount chains. Solid arrows show plate motion vectors from NUVEL-1A (DeMets et al., 1994) for Pacific–North America and from Wilson (1993) for Pacific–Juan de Fuca and Juan de Fuca–North America. Open arrows are Explorer relative motion averaged over past 1 m.y. (Riddihough, 1984). Abbreviations: RDW—Revere-Dellwood-Wilson,Win—Winona block, C.O.—Cobb offset, F.Z.—fracture zone. Endeavour segment is northernmost section of Juan de Fuca Ridge.

Structural interpretation map of Explorer–Juan de Fuca plate region based on composite multibeam bathymetry and satellite altimetry data (Fig. 1). Heavy lines are structural (fault) lineations, gray circles and ovals indicate volcanic cones and seamounts, dashed lines are turbidite channels. Location of magnetic anomaly 2A is shown; boundaries are angled to show regional strike of anomaly pattern.

Earthquake locations estimated using U.S. Navy hydrophone arrays that occurred between August 1991 and January 2002. Focal mechanisms are of large (Mw>4.5) earthquakes that occurred during same time period, taken from Pacific Geoscience Center, National Earthquake Information Center, and Harvard moment-tensor catalogs. Red mechanism shows location of 1992 Heck Seamount main shock.

Tectonic model of Explorer plate boundaries. Evidence presented here is consistent with zone of shear extending through Explorer plate well south of Sovanco Fracture Zone (SFZ) to include Heck, Heckle, and Springfield seamounts, and possibly Cobb offset (gray polygon roughly outlines shear zone). Moreover, Pacific– Juan de Fuca–North American triple junction may be reorganizing southward to establish at Cobb offset. QCF—Queen Charlotte fault.
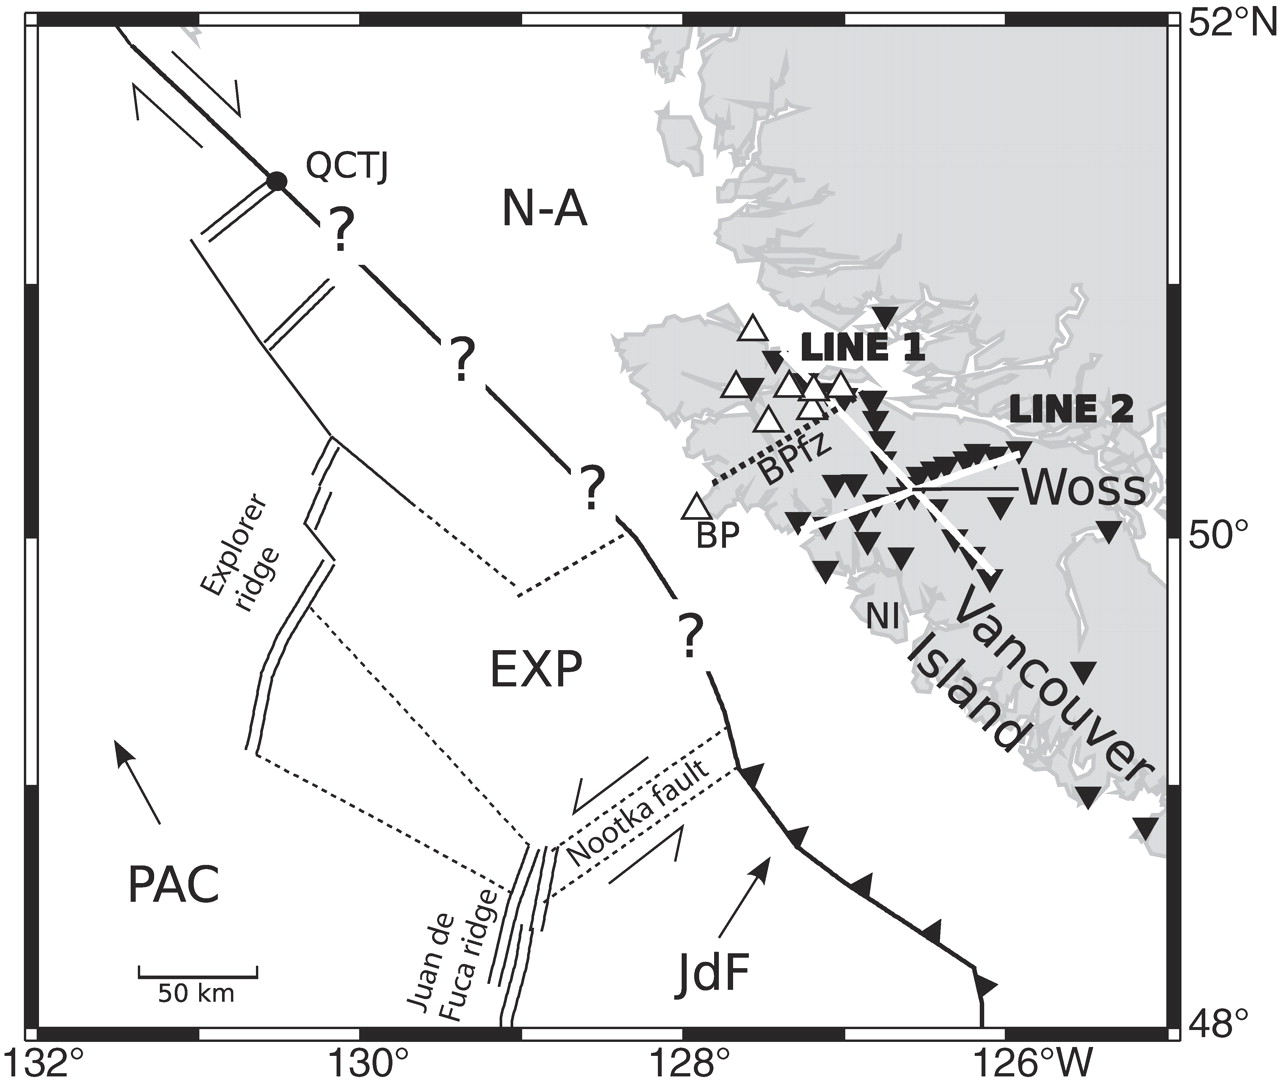
Identification of major tectonic features in western Canada. BP—Brooks Peninsula, BPfz—Brooks Peninsula fault zone, NI— Nootka Island, QCTJ—Queen Charlotte triple junction. Dotted lines delineate extinct boundaries or shear zones. Seismic stations are displayed as inverted black triangles. Station projections along line 1 and line 2 are plotted as thick white lines. White triangles represent Alert Bay volcanic field centers. Center of array locates town of Woss. Plates: N-A—North America; EXP—Explorer; JdF—Juan de Fuca; PAC—Pacific.
-
References:
2 thoughts on “Earthquake Report: Explorer plate!”