Today is one of my busiest days of the semester. I am administering a final and my two classes are presenting their video projects. Then, we had this M 6.5 earthquake in the wee hours and a M 7.7 (prelim USGS Mw) in the Solomons (I will post about this later).
Here is an update. For more background on the regional tectonics and the initial Earthquake Report, head here.
- Here are the USGS websites for the main shock and larger aftershocks
- 2016.12.08 14:47 UTC M 6.5
- 2016.12.08 16:24 UTC M 2.4
- 2016.12.08 16:32 UTC M 4.7
- 2016.12.08 18:08 UTC M 2.9
- and an earthquake that I will mention below
- 2016.12.08 18:33 UTC M 4.3
There was an earthquake to the east on 2016.12.05. This M 4.3 seems to have occurred on a segment of the Mendocino fault. Here is my Earthquake Report for that earthquake. The M 4.3 was not a foreshock to the M 6.5 and probably did not affect the fault in that region.
UPDATE: 13:15 PST: figure notes:
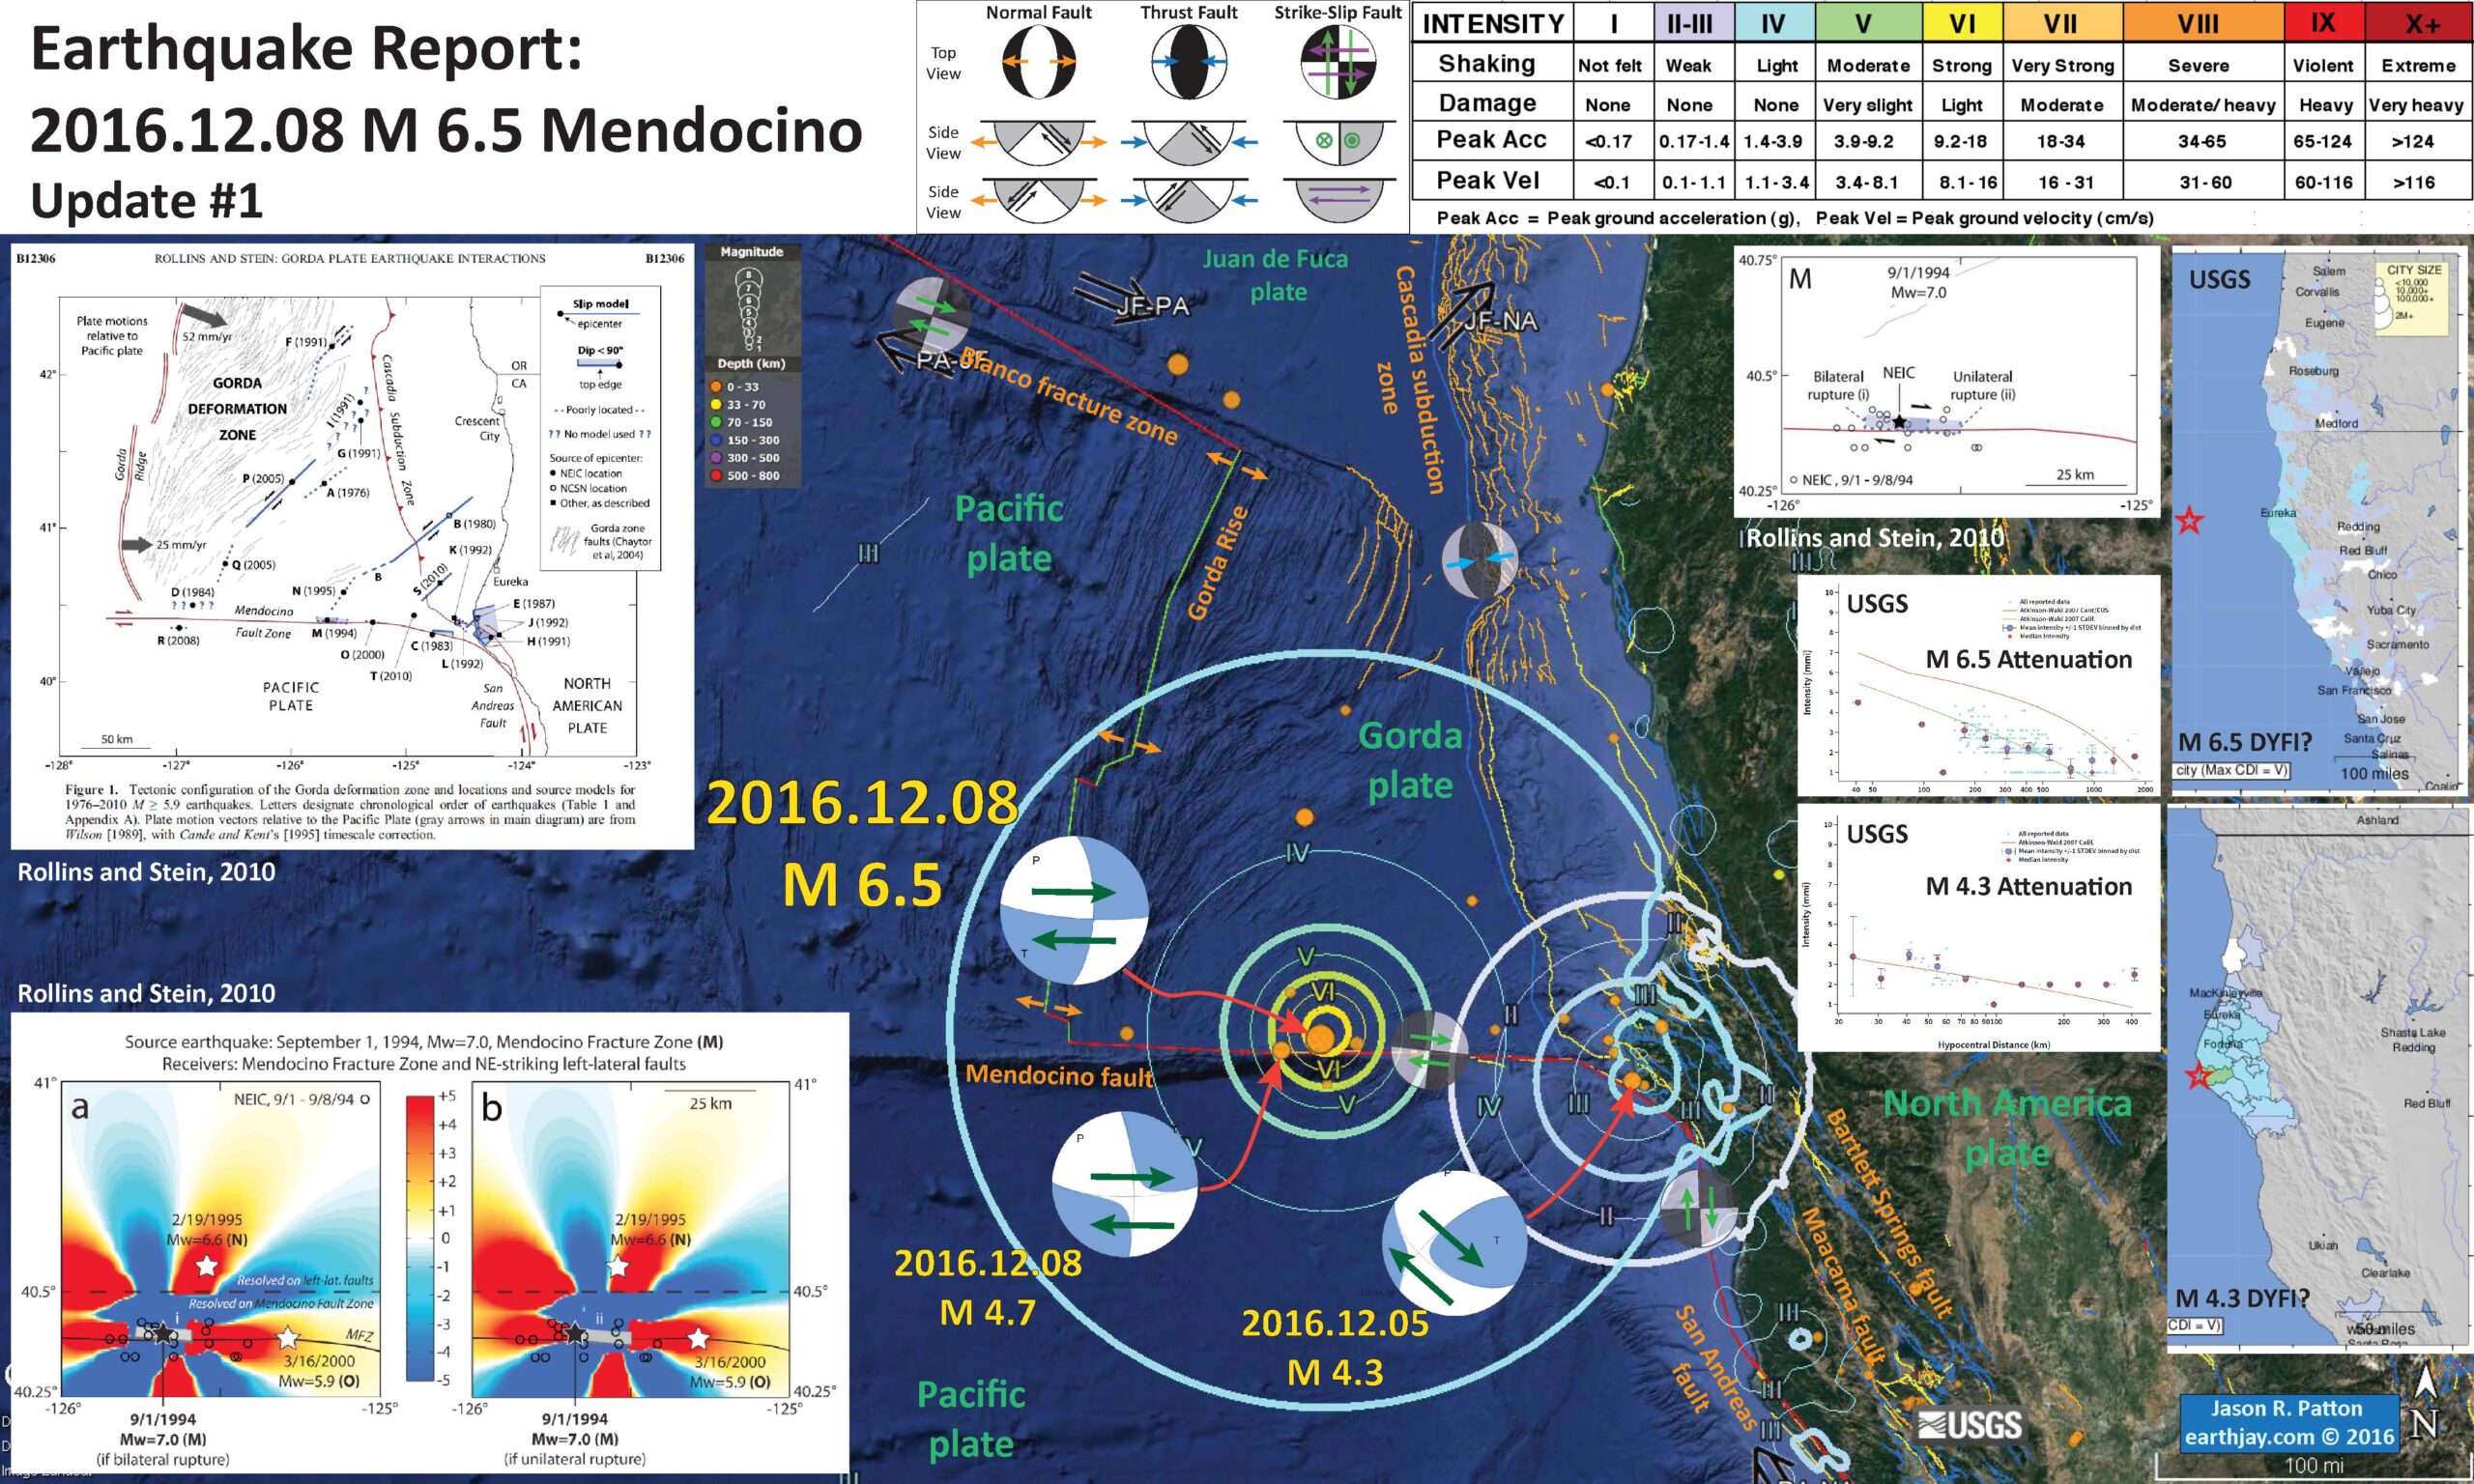
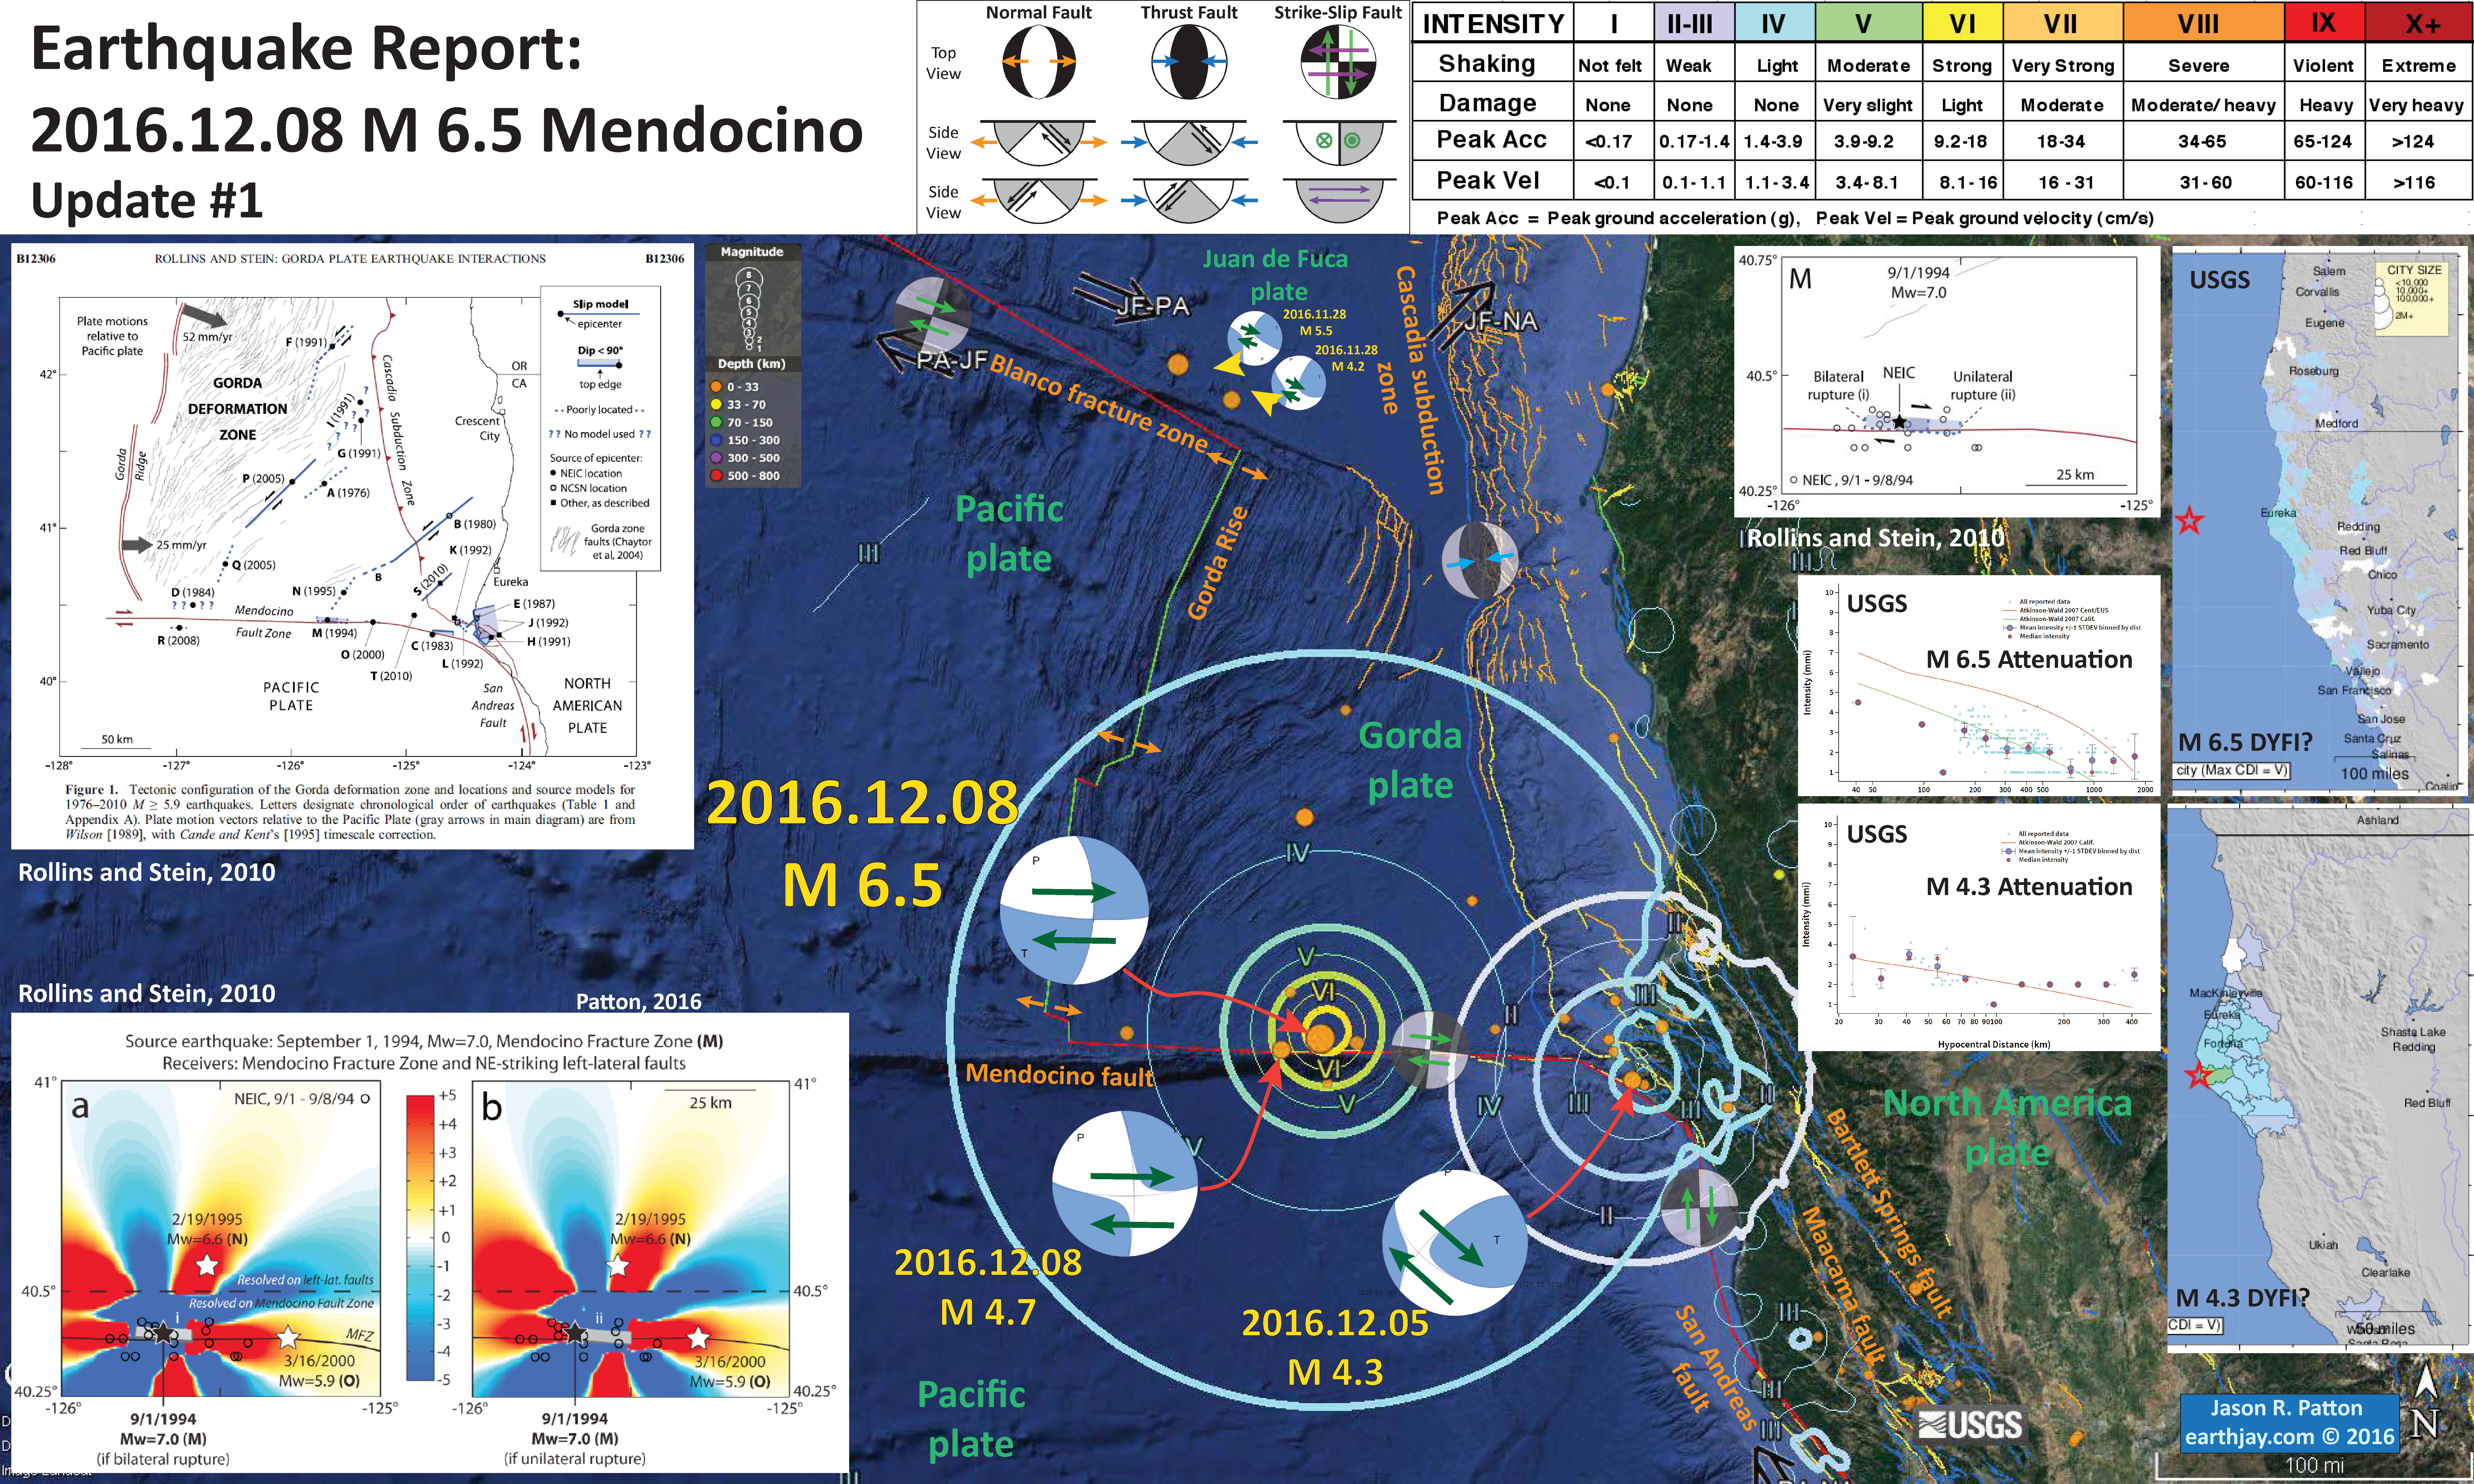
- I have prepared an updated map. I include some inset figures. I will update this report shortly as I need to get to my class to admin a final.
- I include the USGS “Did You Feel It?” report maps for these two earthquakes on the right side of the map. I also include screen shots of the attenuation plots (these show how the ground motions diminish with distance from the earthquake).
- In the upper left corner I include the first figure from Rollins and Stein (2010). In their paper they evaluate (as stated in the title), “Coulomb stress interactions among M ≥ 5.9 earthquakes in the Gorda deformation zone and on the Mendocino Fault Zone, Cascadia subduction zone, and northern San Andreas Fault.” In this figure they present the major earthquakes in this region from 1976-2010. We have had several large earthquakes since this paper was published, but they behaved very similarly to the ones discussed in this paper. Note the location of teh 1994 Mendocino fault earthquake. Today’s M 6.5 happened in a region very close to the 1994 earthquake (albeit further offshore than the ’94 quake).
- In the lower left corner is a figure where Rollins and Stein (2010) show their modeling results for the 1994 earthquake. The colors represent changes in static stress imparted upon faults/crust from rupture on the Mendocino fault in 1994. The 1994 earthquake was significantly larger than today’s M 6.5 (e.g. an M 7.0 is 32 releases ~32 times more energy than an M 6.0), so the static stress changes from today’s earthquakes could be assumed to be less than from the ’94 earthquake. Red designates faults/crust with an increased stress and blue designates a decreased stress. The left panel shows the model results when they generate bilateral rupture (the earthquake starts in one location and slips on either side of the fault) and the right panel shows the model results from unilateral rupture (the fault nucleates at one spot, but instead, slips to only one side of the fault). Note that the increased stresses extend about 1/4 to 1/2 a degree of longitude. This equates to about 15 to 30 miles or 28 to 56 km. The CSZ and SAF are at a much further distance than this, so would not “feel” this earthquake. However, there could be dynamic changes in stress (dynamic triggering), but they would be small and would not last very long (basically the time that the seismic waves are traveling through an area). SO, the fact that we have not had any earthquakes in these other regions suggests that the threat of dynamic triggering are over.
Below I plot the seismicity from the past week, with color representing depth and diameter representing magnitude (see legend). I use the USGS Quaternary fault and fold database for the faults.
I also include the shaking intensity contours on the map for the two earthquakes. Note how these MMI contours are quite different between the two earthquakes.
These contours are based upon the Modified Mercalli Intensity Scale (MMI; see the legend on the map). This is based upon a computer model estimate of ground motions, different from the “Did You Feel It?” estimate of ground motions that is actually based on real observations. The MMI is a qualitative measure of shaking intensity. More on the MMI scale can be found here and here. This is based upon a computer model estimate of ground motions, different from the “Did You Feel It?” estimate of ground motions that is actually based on real observations.
I placed a moment tensor / focal mechanism legend on the poster. There is more material from the USGS web sites about moment tensors and focal mechanisms (the beach ball symbols). Both moment tensors and focal mechanisms are solutions to seismologic data that reveal two possible interpretations for fault orientation and sense of motion. One must use other information, like the regional tectonics, to interpret which of the two possibilities is more likely.
I also include a figure from Rollins and Stein (2010). This figure shows how the 1994 earthquake (similar to today’s M 6.5) imparted stresses on the adjacent faults and crust.
- UPDATE: I added a version of the Rollins and Stein (2010) figure of the regional earthquakes. I include their figure caption as blockquote below.
Tectonic configuration of the Gorda deformation zone and locations and source models for 1976–2010 M ≥ 5.9 earthquakes. Letters designate chronological order of earthquakes (Table 1 and Appendix A). Plate motion vectors relative to the Pacific Plate (gray arrows in main diagram) are from Wilson [1989], with Cande and Kent’s [1995] timescale correction.
- Here is the Rollins and Stein (2010) figure that is in the report above. I include their figure caption as blockquote below.
Coulomb stress changes imparted by our models of (a) a bilateral rupture and (b) a unilateral eastward rupture for the 1994 Mw = 7.0 Mendocino Fault Zone earthquake to the epicenters of the 1995 Mw = 6.6 southern Gorda zone earthquake (N) and the 2000 Mw = 5.9 Mendocino Fault Zone earthquake (O). Calculation depth is 5 km.
UPDATE 13:15 PST: Notes about the seismicity from the past month or so.
Here is something that I thought was interesting about this series of earthquakes in the past week or so. There were a couple earthquakes along the Blanco fracture zone that are too distant to impart changes in static stress on the CSZ, MF, or SAF (though people always want to seek relations where there are none). There was also a M 4.3 earthquake at the mouth of the Mattole River, near Petrolia. This is also a very very small earthquake that does not implicate other fault zones. However, following the M 6.5 today, there was an aftershock (at least 2) near the M 4.3. SO, I thought that perhaps these happened in a region that had seen an increase in static coulomb stress following the M 4.3. They are very close to the M 4.3. So, it seems reasonable that they were ready to go when the M 6.5 happened.
- Atwater, B.F., Musumi-Rokkaku, S., Satake, K., Tsuju, Y., Eueda, K., and Yamaguchi, D.K., 2005. The Orphan Tsunami of 1700—Japanese Clues to a Parent Earthquake in North America, USGS Professional Paper 1707, USGS, Reston, VA, 144 pp.
- Chaytor, J.D., Goldfinger, C., Dziak, R.P., and Fox, C.G., 2004. Active deformation of the Gorda plate: Constraining deformation models with new geophysical data: Geology v. 32, p. 353-356.
- Dengler, L.A., Moley, K.M., McPherson, R.C., Pasyanos, M., Dewey, J.W., and Murray, M., 1995. The September 1, 1994 Mendocino Fault Earthquake, California Geology, Marc/April 1995, p. 43-53.
- Geist, E.L. and Andrews D.J., 2000. Slip rates on San Francisco Bay area faults from anelastic deformation of the continental lithosphere, Journal of Geophysical Research, v. 105, no. B11, p. 25,543-25,552.
- Irwin, W.P., 1990. Quaternary deformation, in Wallace, R.E. (ed.), 1990, The San Andreas Fault system, California: U.S. Geological Survey Professional Paper 1515, online at: http://pubs.usgs.gov/pp/1990/1515/
- McLaughlin, R.J., Sarna-Wojcicki, A.M., Wagner, D.L., Fleck, R.J., Langenheim, V.E., Jachens, R.C., Clahan, K., and Allen, J.R., 2012. Evolution of the Rodgers Creek–Maacama right-lateral fault system and associated basins east of the northward-migrating Mendocino Triple Junction, northern California in Geosphere, v. 8, no. 2., p. 342-373.
- Nelson, A.R., Asquith, A.C., and Grant, W.C., 2004. Great Earthquakes and Tsunamis of the Past 2000 Years at the Salmon River Estuary, Central Oregon Coast, USA: Bulletin of the Seismological Society of America, Vol. 94, No. 4, pp. 1276–1292
- Rollins, J.C. and Stein, R.S., 2010. Coulomb stress interactions among M ≥ 5.9 earthquakes in the Gorda deformation zone and on the Mendocino Fault Zone, Cascadia subduction zone, and northern San Andreas Fault: Journal of Geophysical Research, v. 115, B12306, doi:10.1029/2009JB007117, 2010.
- Stoffer, P.W., 2006, Where’s the San Andreas Fault? A guidebook to tracing the fault on public lands in the San Francisco Bay region: U.S. Geological Survey General Interest Publication 16, 123 p., online at http://pubs.usgs.gov/gip/2006/16/
- Wallace, Robert E., ed., 1990, The San Andreas fault system, California: U.S. Geological Survey Professional Paper 1515, 283 p. [http://pubs.usgs.gov/pp/1988/1434/].


This information is awesome, do you believe that we’re on the brink of the big one along the ring of fire today
These earthquakes are too distant from each other to effect the faults elsewhere on the “Ring of Fire.” The only thing that the Ring of Fire shares in common is that there are subduction zone faults surrounding the Pacific Ocean.