Yesterday there began a swarm of seismic activity along the southern Solomon trench. What began with a M 7.8 earthquake on 2016.12.08, there have been many aftershocks including a M 6.9 this morning (my time).
Below is my interpretive poster for this earthquake.
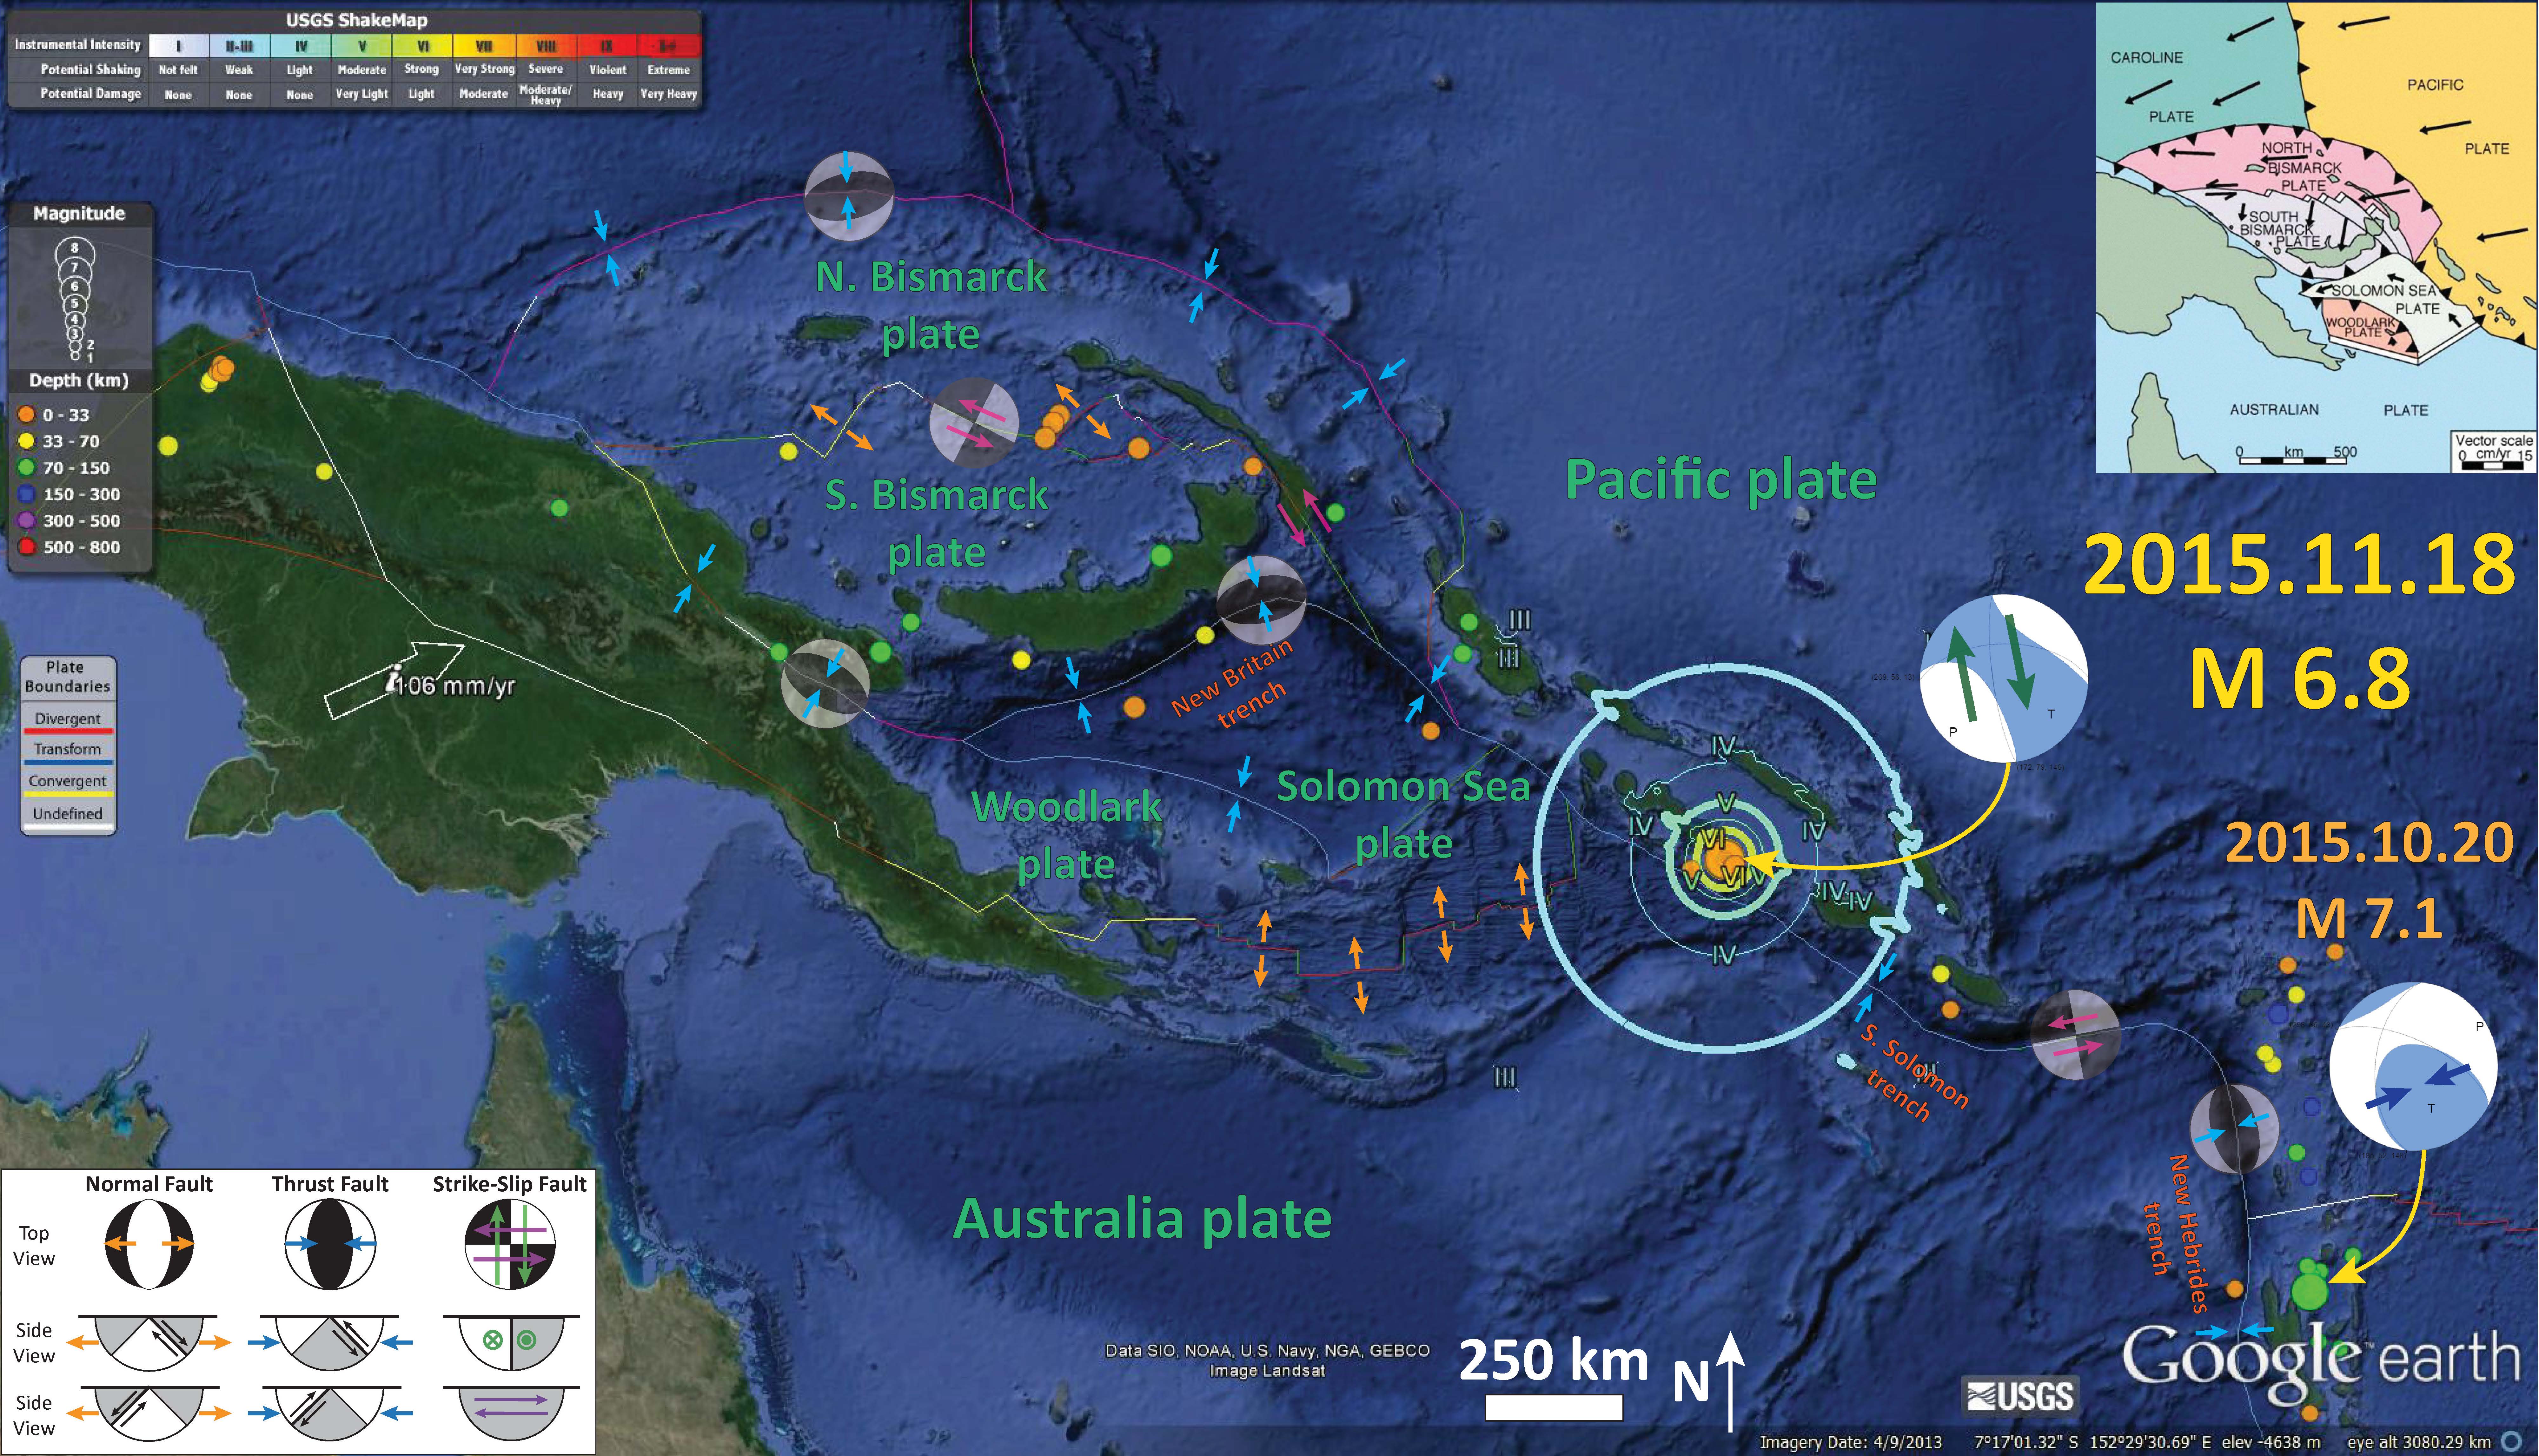
I plot the seismicity from the past month, with color representing depth and diameter representing magnitude (see legend). I also plot the moment tensor and rupture slip patch for the 2007.04.01 M 8.1 subduction zone tsunamigenic earthquake.
- I placed a moment tensor / focal mechanism legend on the poster. There is more material from the USGS web sites about moment tensors and focal mechanisms (the beach ball symbols). Both moment tensors and focal mechanisms are solutions to seismologic data that reveal two possible interpretations for fault orientation and sense of motion. One must use other information, like the regional tectonics, to interpret which of the two possibilities is more likely. The moment tensor shows northeast-southwest compression, perpendicular to the convergence at this plate boundary. Most of the recent seismicity in this region is associated with convergence along the New Britain trench or the South Solomon trench.
- I also include the shaking intensity contours on the map. These use the Modified Mercalli Intensity Scale (MMI; see the legend on the map). This is based upon a computer model estimate of ground motions, different from the “Did You Feel It?” estimate of ground motions that is actually based on real observations. The MMI is a qualitative measure of shaking intensity. More on the MMI scale can be found here and here. This is based upon a computer model estimate of ground motions, different from the “Did You Feel It?” estimate of ground motions that is actually based on real observations.
- I include the slab contours plotted (Hayes et al., 2012), which are contours that represent the depth to the subduction zone fault. These are mostly based upon seismicity. The depths of the earthquakes have considerable error and do not all occur along the subduction zone faults, so these slab contours are simply the best estimate for the location of the fault. The hypocentral depth plots this close to the location of the fault as mapped by Hayes et al. (2012). So, the earthquake is either in the downgoing slab, or in the upper plate and a result of the seismogenic locked plate transferring the shear strain from a fracture zone in the downgoing plate to the upper plate.
- Here are the USGS web pages for the larger magnitude earthquakes. The earthquakes with plotted moment tensors are in bold.
-
I include some inset figures.
- In the upper right corner is a generalized tectonic map of the region from Holm et al., 2015. This map shows the major plate boundary faults including the New Britain trench (NBT), one of the main culprits for recent seismicity of this region.
- To the left of this map is the USGS fault plane solution. This figure shows their model results with color representing the spatial variation in earthquake fault slip for this M 7.8 earthquake. This model is calibrated using seismologic observations. The MMI contours reflect the rectangular fault plane used in their model. Smaller earthquake are modeled using a point source (imagine an hypocenter as a source instead of a rectangular fault slip source). These point source MMI contours are generally more circular looking (except where they intersect topography or regions with bedrock that might amplify seismic waves).
- Below the Holm et al. (2015) map is a map that shows the region of this subduction zone that ruptured in 2007 (USGS, 2007). This M 8.1 earthquake caused a damaging tsunami. Here is the USGS website for this earthquake.
- In the lower left corner is another generalized tectonic map of the region from Benz et al., 201. This map shows historic seismicity for this region. Earthquake epicenters are colored to represent depth and sized to represent magnitude. There is a yellow star located approximately in the location of today’s M 7.8. This earthquake has a similar down-dip distance as the 2007.04.01 M 8.1 earthquake (the large red dot labeled 2007 near the intersection of the Woodlark Spreading Center and the South Solomon Trench). The 2007 earthquake generated a large damaging tsunami. I include the cross section that shows hypocentral depths for earthquakes in the region between the 2007 April and 2016 December earthquakes.

- This is an image of the HSU Baby Benioff seismograph showing the M 7.8 earthquake.
- This swarm of earthquake may be the result of a a static coulomb stress change along the subduction fault as imparted by the strike-slip earthquakes from mid-May of 2015. There is a transform plate boundary connecting the southern South Solomon Trench with the northern New Hebrides Trench. There were three earthquakes with upper M 6 magnitudes. These were left lateral strike slip faults that may have increased the stress along the subduction zone faults to the east and west of these earthquakes. This current swarm of earthquakes may be in the region of increased stress, but I have not modeled this myself (too much other stuff to do right now). There is no way to know what the state of stress along these subduction zone faults was prior to the May 2007 earthquakes, but for there to be static triggering like this, the fault would need to be at a high state of stress.
- Here are the USGS web pages for the three largest earthquakes in this May 2007 series:
- Here is a map that I put together. I plot the epicenters of the earthquakes, along with the moment tensors for the three largest magnitude earthquakes. I also place a transparent focal mechanism over the swarm, showing the sense of motion for this plate boundary fault. More is presented in my Earthquake Report for this May 2007 series.
- I also note that these three largest earthquakes happen in a time order from east to west, unzipping the fault over three +- days. I label them in order (1, 2, 3) and place an orange arrow depicting this temporal relation). Very cool!
- In addition, there was a subduction zone earthquake to the north of the current swarm. There was a M 6.0 in 2016.09.14. Here is my report for that earthquake. Below is my interpretive poster for that earthquake. This was a much smaller earthquake, but still may have contributed slightly. Coulomb modeling might help, but that would only produce estimates of stress change.
- In 2015 November, there was a strike slip earthquake even further to the north. It seems improbable that this earthquake would have directly affected the fault to encourage rupture for the current swarm. Here is my Earthquake Report for the November earthquake.
Background Figures
- Here is the generalized tectonic map of the region from Holm et al., 2015. I include the figure caption below as a blockquote.
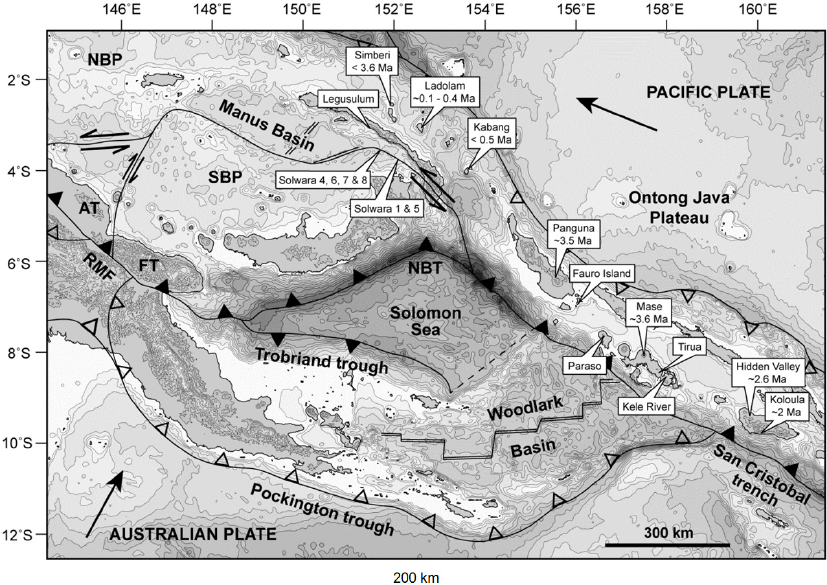
Tectonic setting and mineral deposits of eastern Papua New Guinea and Solomon Islands. The modern arc setting related to formation of the mineral deposits comprises, from west to east, the West Bismarck arc, the New Britain arc, the Tabar-Lihir-Tanga-Feni Chain and the Solomon arc, associated with north-dipping subduction/underthrusting at the Ramu-Markham fault zone, New Britain trench and San Cristobal trench respectively. Arrows denote plate motion direction of the Australian and Pacific plates. Filled triangles denote active subduction. Outlined triangles denote slow or extinct subduction. NBP: North Bismarck plate; SBP: South Bismarck plate; AT: Adelbert Terrane; FT: Finisterre Terrane; RMF: Ramu-Markham fault zone; NBT: New Britain trench.
Background Videos
- Here is an educational video (from IRIS) for this part of the western Pacific. There are many plate boundaries and these margins are very active. This is a link to the embedded video below (10.4 MB mp4)
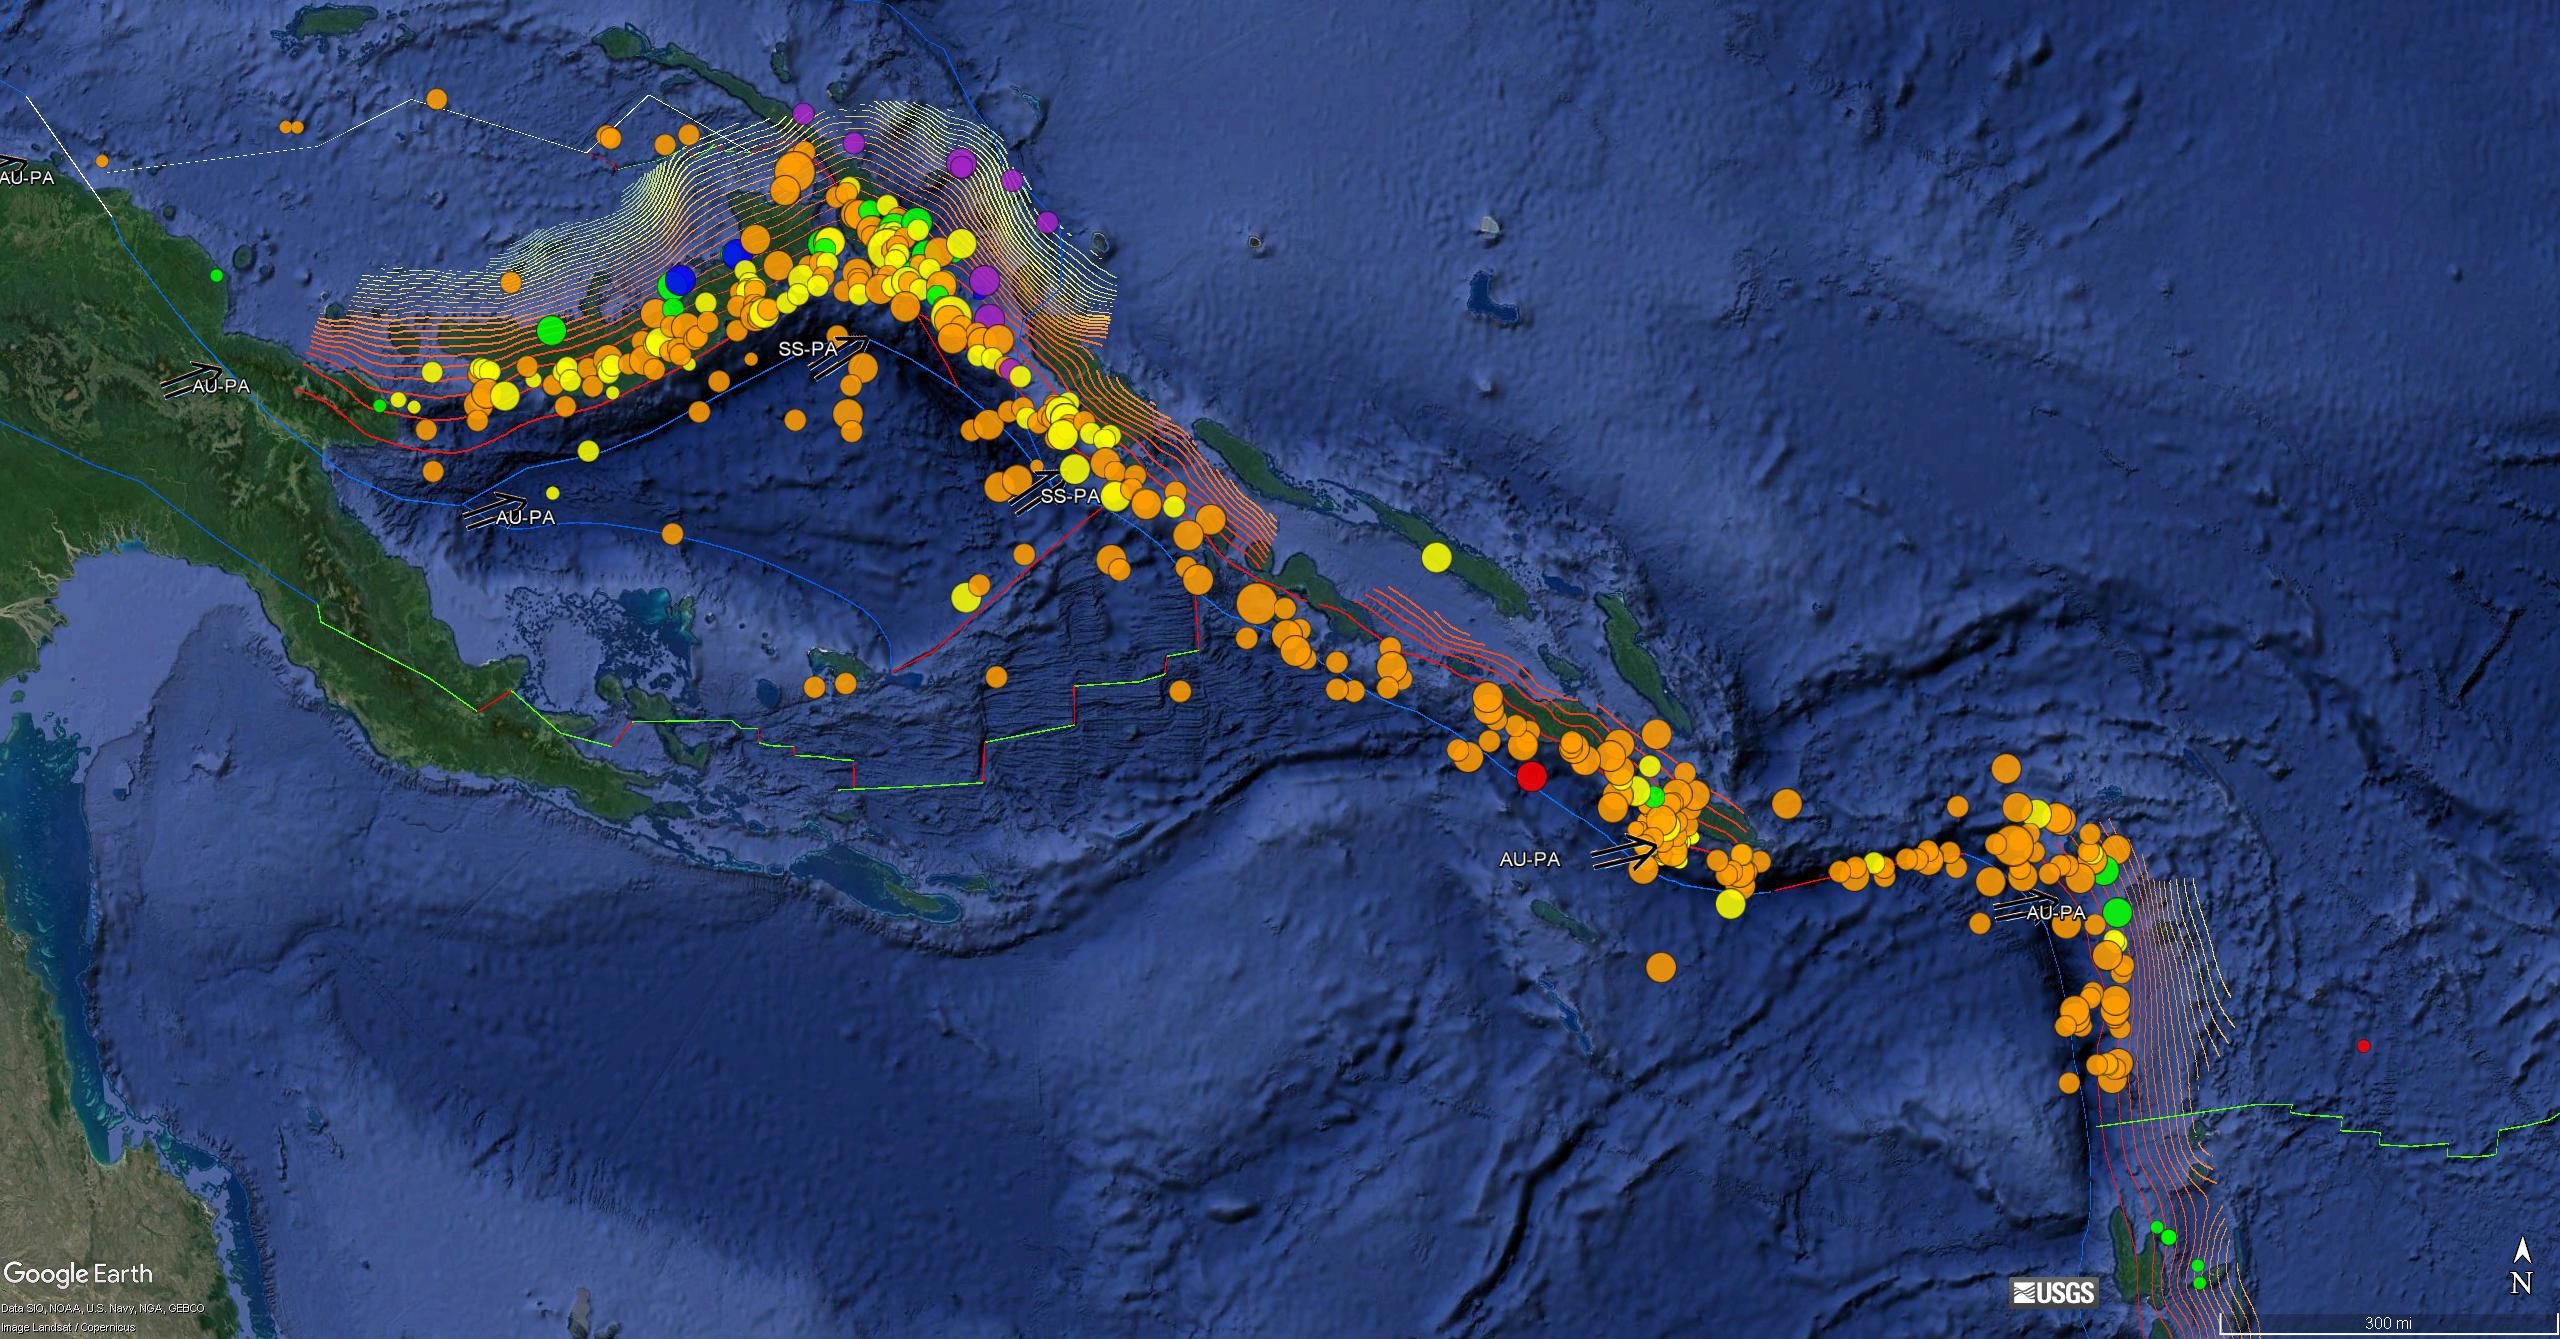
- I put together an animation that shows the seismicity for this region from 1900-2016 for earthquakes with magnitude of M ≥ 6.5. Here is the USGS query I used to search for these data used in this animation. I show the location of the Benz et al. (2011) cross section E-E’ as a yellow line on the main map.
- In this animation, I include some figures from the interpretive poster above. I also include a tectonic map based upon Hamilton (1979). Music is from copyright free music online and is entitled “Sub Strut.” Above the video I present a map showing all the earthquakes presented in the video.
- Here is a link to the embedded video below (5 MB mp4)
- Here is an animation from IRIS that shows the seismic waves propagating through a national seismometer network. Here is a link to the video embedded below (10 MB mp4)
-
In this region, there was a subduction zone earthquake that generated ground deformation and a tsunami on 2007.04.10. Below is some information about that earthquake and tsunami.
- Here is a map from the USGS that shows the rupture area of the 2007 earthquake with a hashed polygon. The epicenter is shown as a red dot. The USGS preliminary analysis of the tsunami is here. I include their text as a blockquote below.
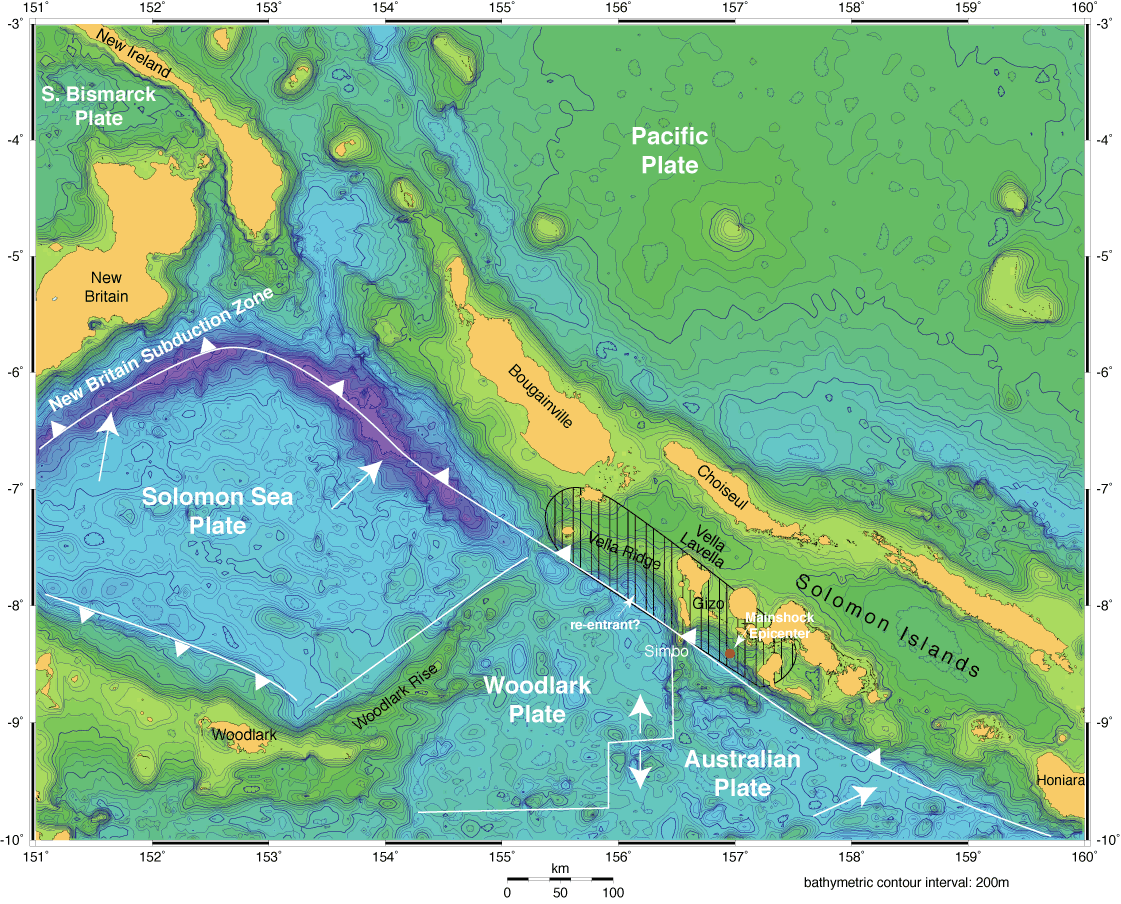
The M=8.1 earthquake that occurred in the Solomon Islands on April 1, 2007 (UTC), was located along the Solomon Islands subduction zone, part of the Pacific “Ring of Fire”. A subduction zone is a type of plate tectonic boundary where one plate is pulled (subducted) beneath another plate. For most subduction zones that make up the western half of the Ring of Fire, the Pacific plate is being subducted beneath local plates. In this case, however, the Pacific plate is the overriding or upper plate. There are three plates being subducted along the Solomon Islands subduction zone: the Solomon Sea plate, the Woodlark plate, and the Australian plate (see figure below). A spreading center separates the Woodlark and Australian plates. More detailed information on the plate tectonics of this region can be found in Tregoning and others (1998) and Bird (2003).
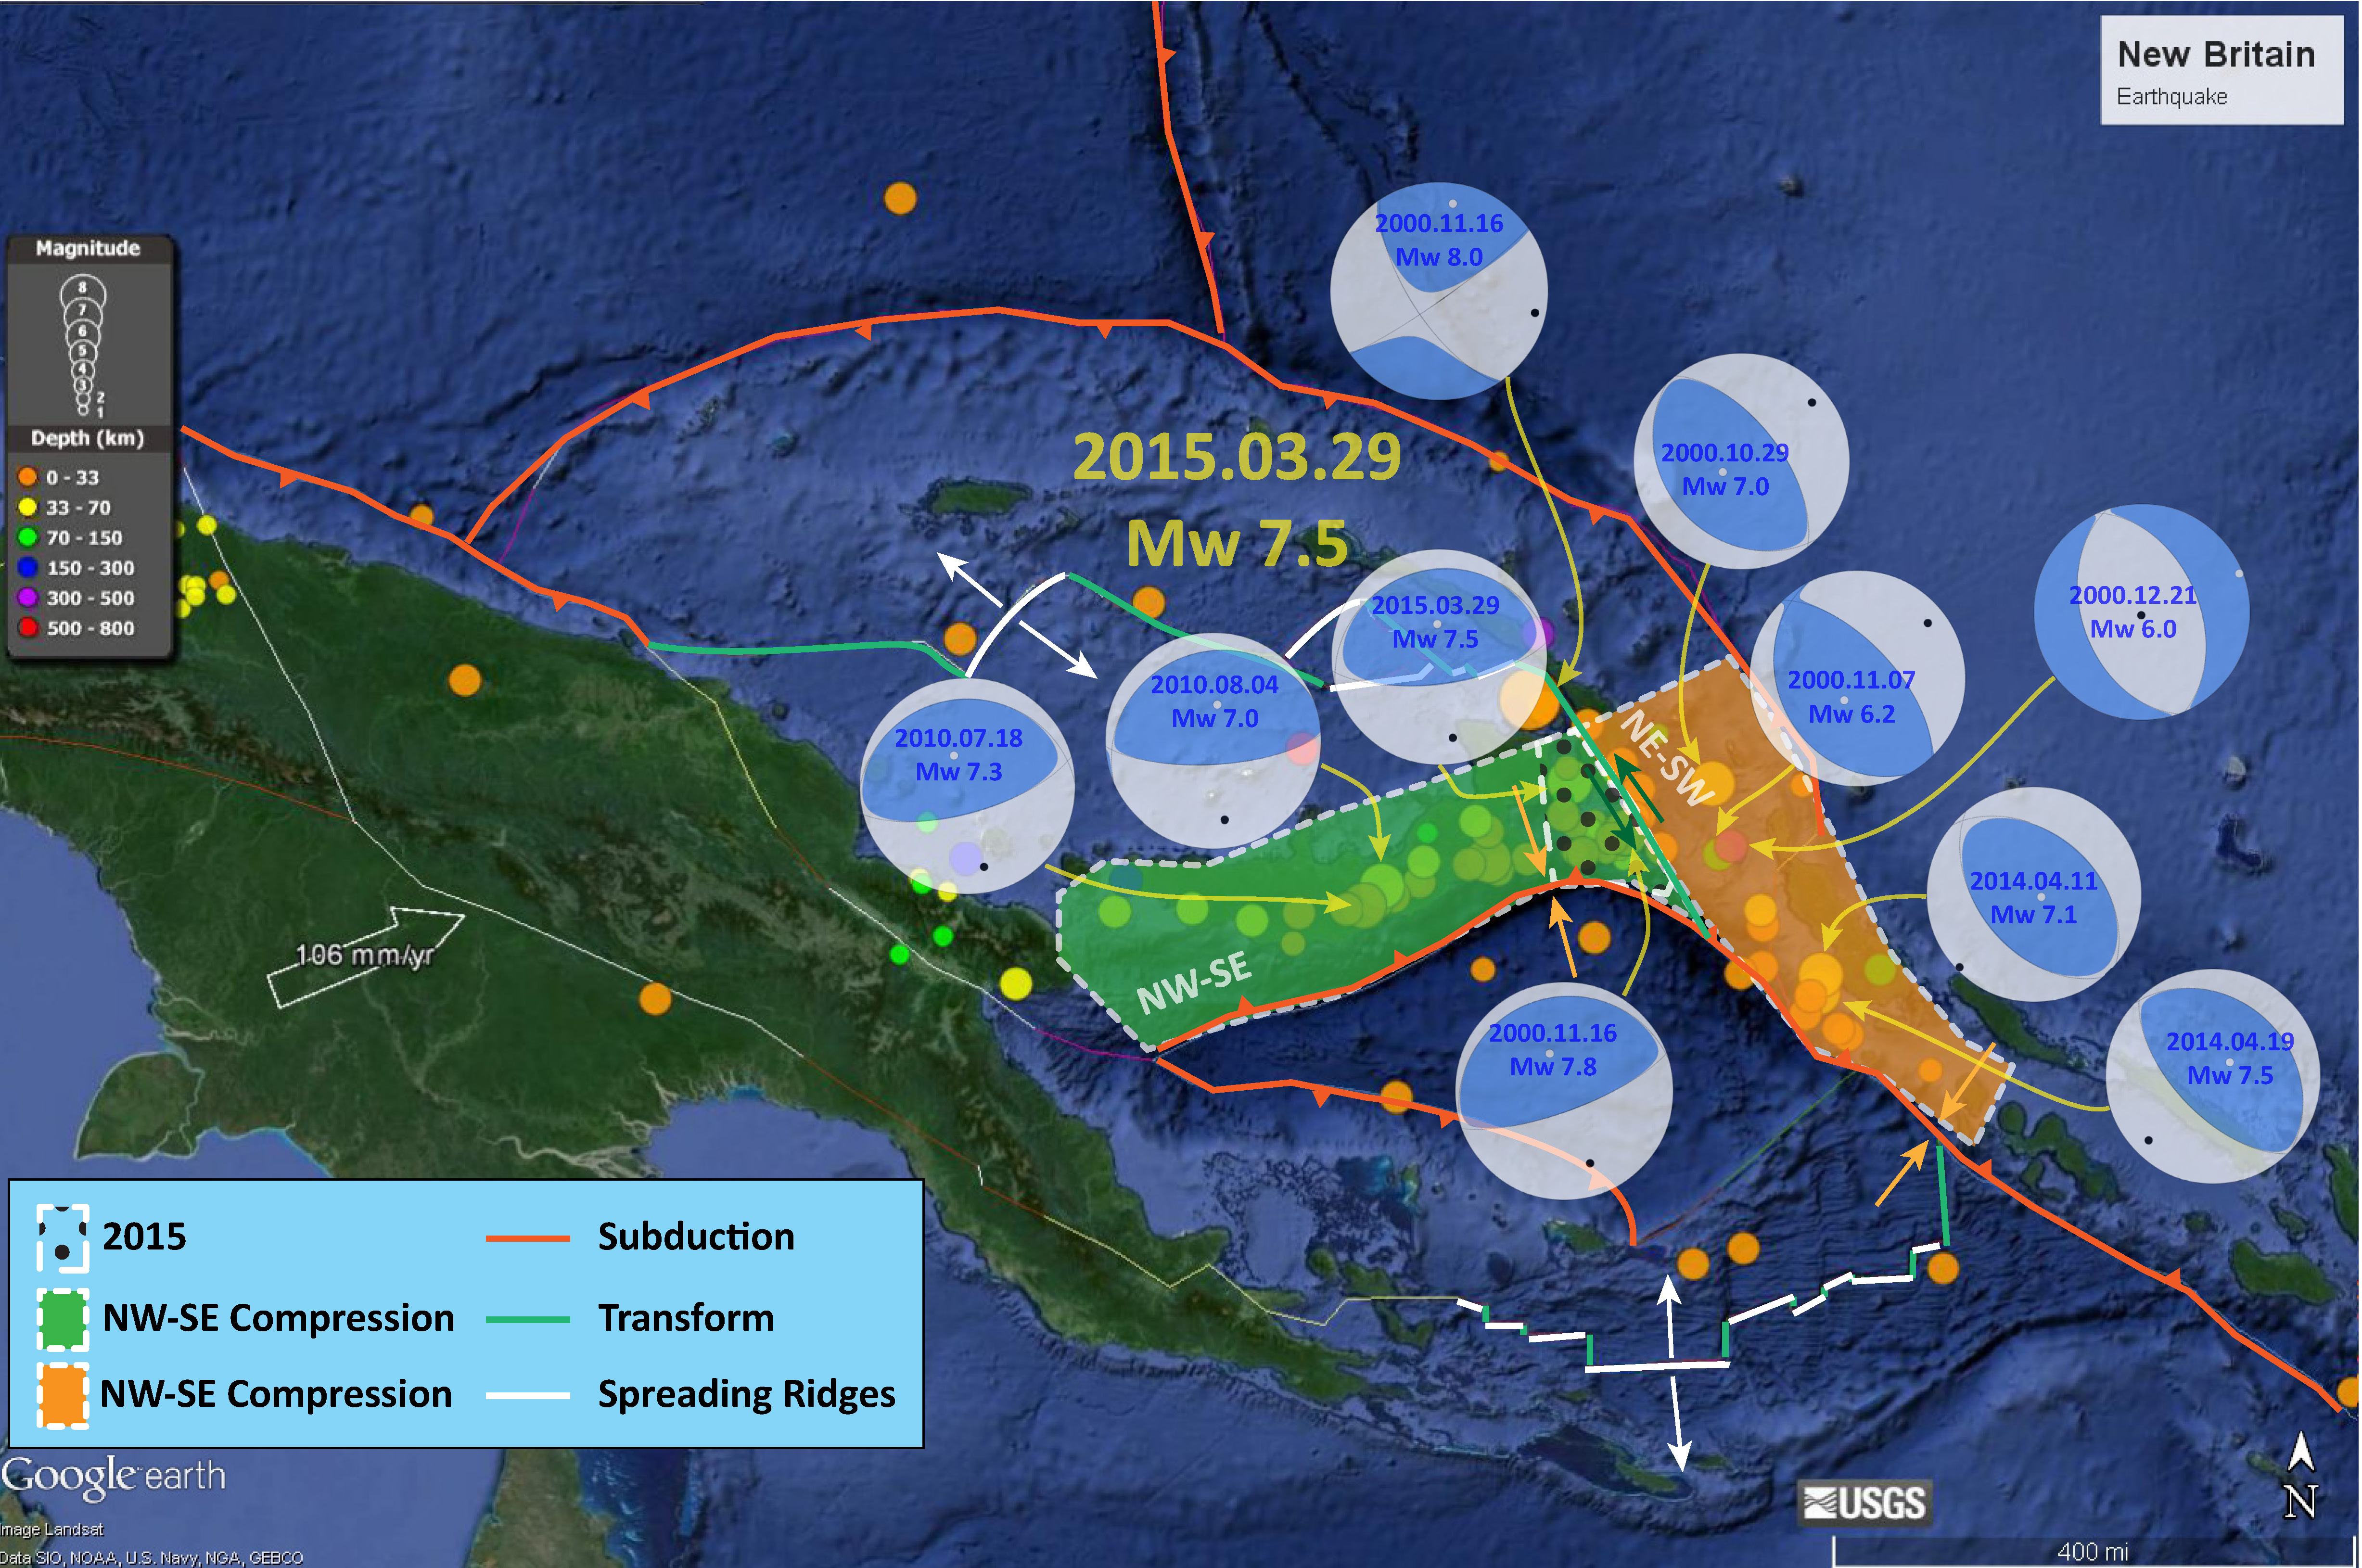
- I put together this map to show how the New Britain and Solomon trenches meet. Earthquakes along the New Britain trench have principal stress aligned perpendicular to the New Britain trench and earthquakes along the Solomon trench have principal stresses aligned perpendicular to the Solomon trench due to strain partitioning in the upper plate. I provide more links and explanations about these earthquakes on this page.
Below are some Earthquake Reports for this region of the western Pacific
- 2016.10.17 M 6.9 New Britain
- 2016.10.15 M 6.4 South Bismarck Sea
- 2016.09.14 M 6.0 Solomon Islands
- 2016.08.31 M 6.7 New Britain
- 2016.08.12 M 7.2 New Hebrides Update #2
- 2016.08.12 M 7.2 New Hebrides Update #1
- 2016.08.12 M 7.2 New Hebrides
- 2016.04.06 M 6.9 Vanuatu Update #1
- 2016.04.03 M 6.9 Vanuatu
- 2015.03.30 M 7.5 New Britain (Update #5)
- 2015.03.30 M 7.5 New Britain (Update #4)
- 2015.03.29 M 7.5 New Britain (Update #3)
- 2015.03.29 M 7.5 New Britain (Update #2)
- 2015.03.29 M 7.5 New Britain (Update #1)
- 2015.03.29 M 7.5 New Britain
- 2015.11.18 M 6.8 Solomon Islands
- 2015.05.24 M 6.8, 6.8, 6.9 Santa Cruz Islands
- 2015.05.05 M 7.5 New Britain
New Britain | Solomon | Bougainville | New Hebrides | Tonga | Kermadek
General Overview
Earthquake Reports
-
References:
- Baldwin, S.L., Fitzgerald, P.G., and Webb, L.E., 2012, Tectonics of the New Guinea Region, Annu. Rev. Earth Planet. Sci., v. 40, pp. 495-520.
- Benz, H.M., Herman, M., Tarr, A.C., Hayes, G.P., Furlong, K.P., Villaseñor, A., Dart, R.L., and Rhea, S., 2011. Seismicity of the Earth 1900–2010 New Guinea and vicinity: U.S. Geological Survey Open-File Report 2010–1083-H, scale 1:8,000,000.
- Bird, P., 2003. An updated digital model of plate boundaries in Geochemistry, Geophysics, Geosystems, v. 4, doi:10.1029/2001GC000252, 52 p.
- Geist, E.L., and Parsons, T., 2005, Triggering of tsunamigenic aftershocks from large strike-slip earthquakes: Analysis of the November 2000 New Ireland earthquake sequence: Geochemistry, Geophysics, Geosystems, v. 6, doi:10.1029/2005GC000935, 18 p. [Download PDF (6.5 MB)]
- Hamilton, W.B., 1979. Tectonics of the Indonesian Region, USGS Professional Paper 1078.
- Hayes, G. P., D. J. Wald, and R. L. Johnson (2012), Slab1.0: A three-dimensional model of global subduction zone geometries, J. Geophys. Res., 117, B01302, doi:10.1029/2011JB008524.
- Holm, R. and Richards, S.W., 2013. A re-evaluation of arc-continent collision and along-arc variation in the Bismarck Sea region, Papua New Guinea in Australian Journal of Earth Sciences, v. 60, p. 605-619.
- Holm, R.J., Richards, S.W., Rosenbaum, G., and Spandler, C., 2015. Disparate Tectonic Settings for Mineralisation in an Active Arc, Eastern Papua New Guinea and the Solomon Islands in proceedings from PACRIM 2015 Congress, Hong Kong ,18-21 March, 2015, pp. 7.
- Johnson, R.W., 1976, Late Cainozoic volcanism and plate tectonics at the southern margin of the Bismarck Sea, Papua New Guinea, in Johnson, R.W., ed., 1976, Volcanism in Australia: Amsterdam, Elsevier, p. 101-116
- Lay, T., and Kanamori, H., 1980, Earthquake doublets in the Solomon Islands: Physics of the Earth and Planetary Interiors, v. 21, p. 283-304.
- Schwartz, S.Y., 1999, Noncharacteristic behavior and complex recurrence of large subduction zone earthquakes: Journal of Geophysical Research, v. 104, p. 23,111-123,125.
- Schwartz, S.Y., Lay, T., and Ruff, L.J., 1989, Source process of the great 1971 Solomon Islands doublet: Physics of the Earth and Planetary Interiors, v. 56, p. 294-310.
- Tregoning, P., McQueen, H., Lambeck, K., Jackson, R. Little, T., Saunders, S., and Rosa, R., 2000. Present-day crustal motion in Papua New Guinea, Earth Planets and Space, v. 52, pp. 727-730.
- USGS, 2007. Preliminary Analysis of the April 2007 Solomon Islands Tsunami, Southwest Pacific Ocean
4 thoughts on “Earthquake Report: Solomons!”