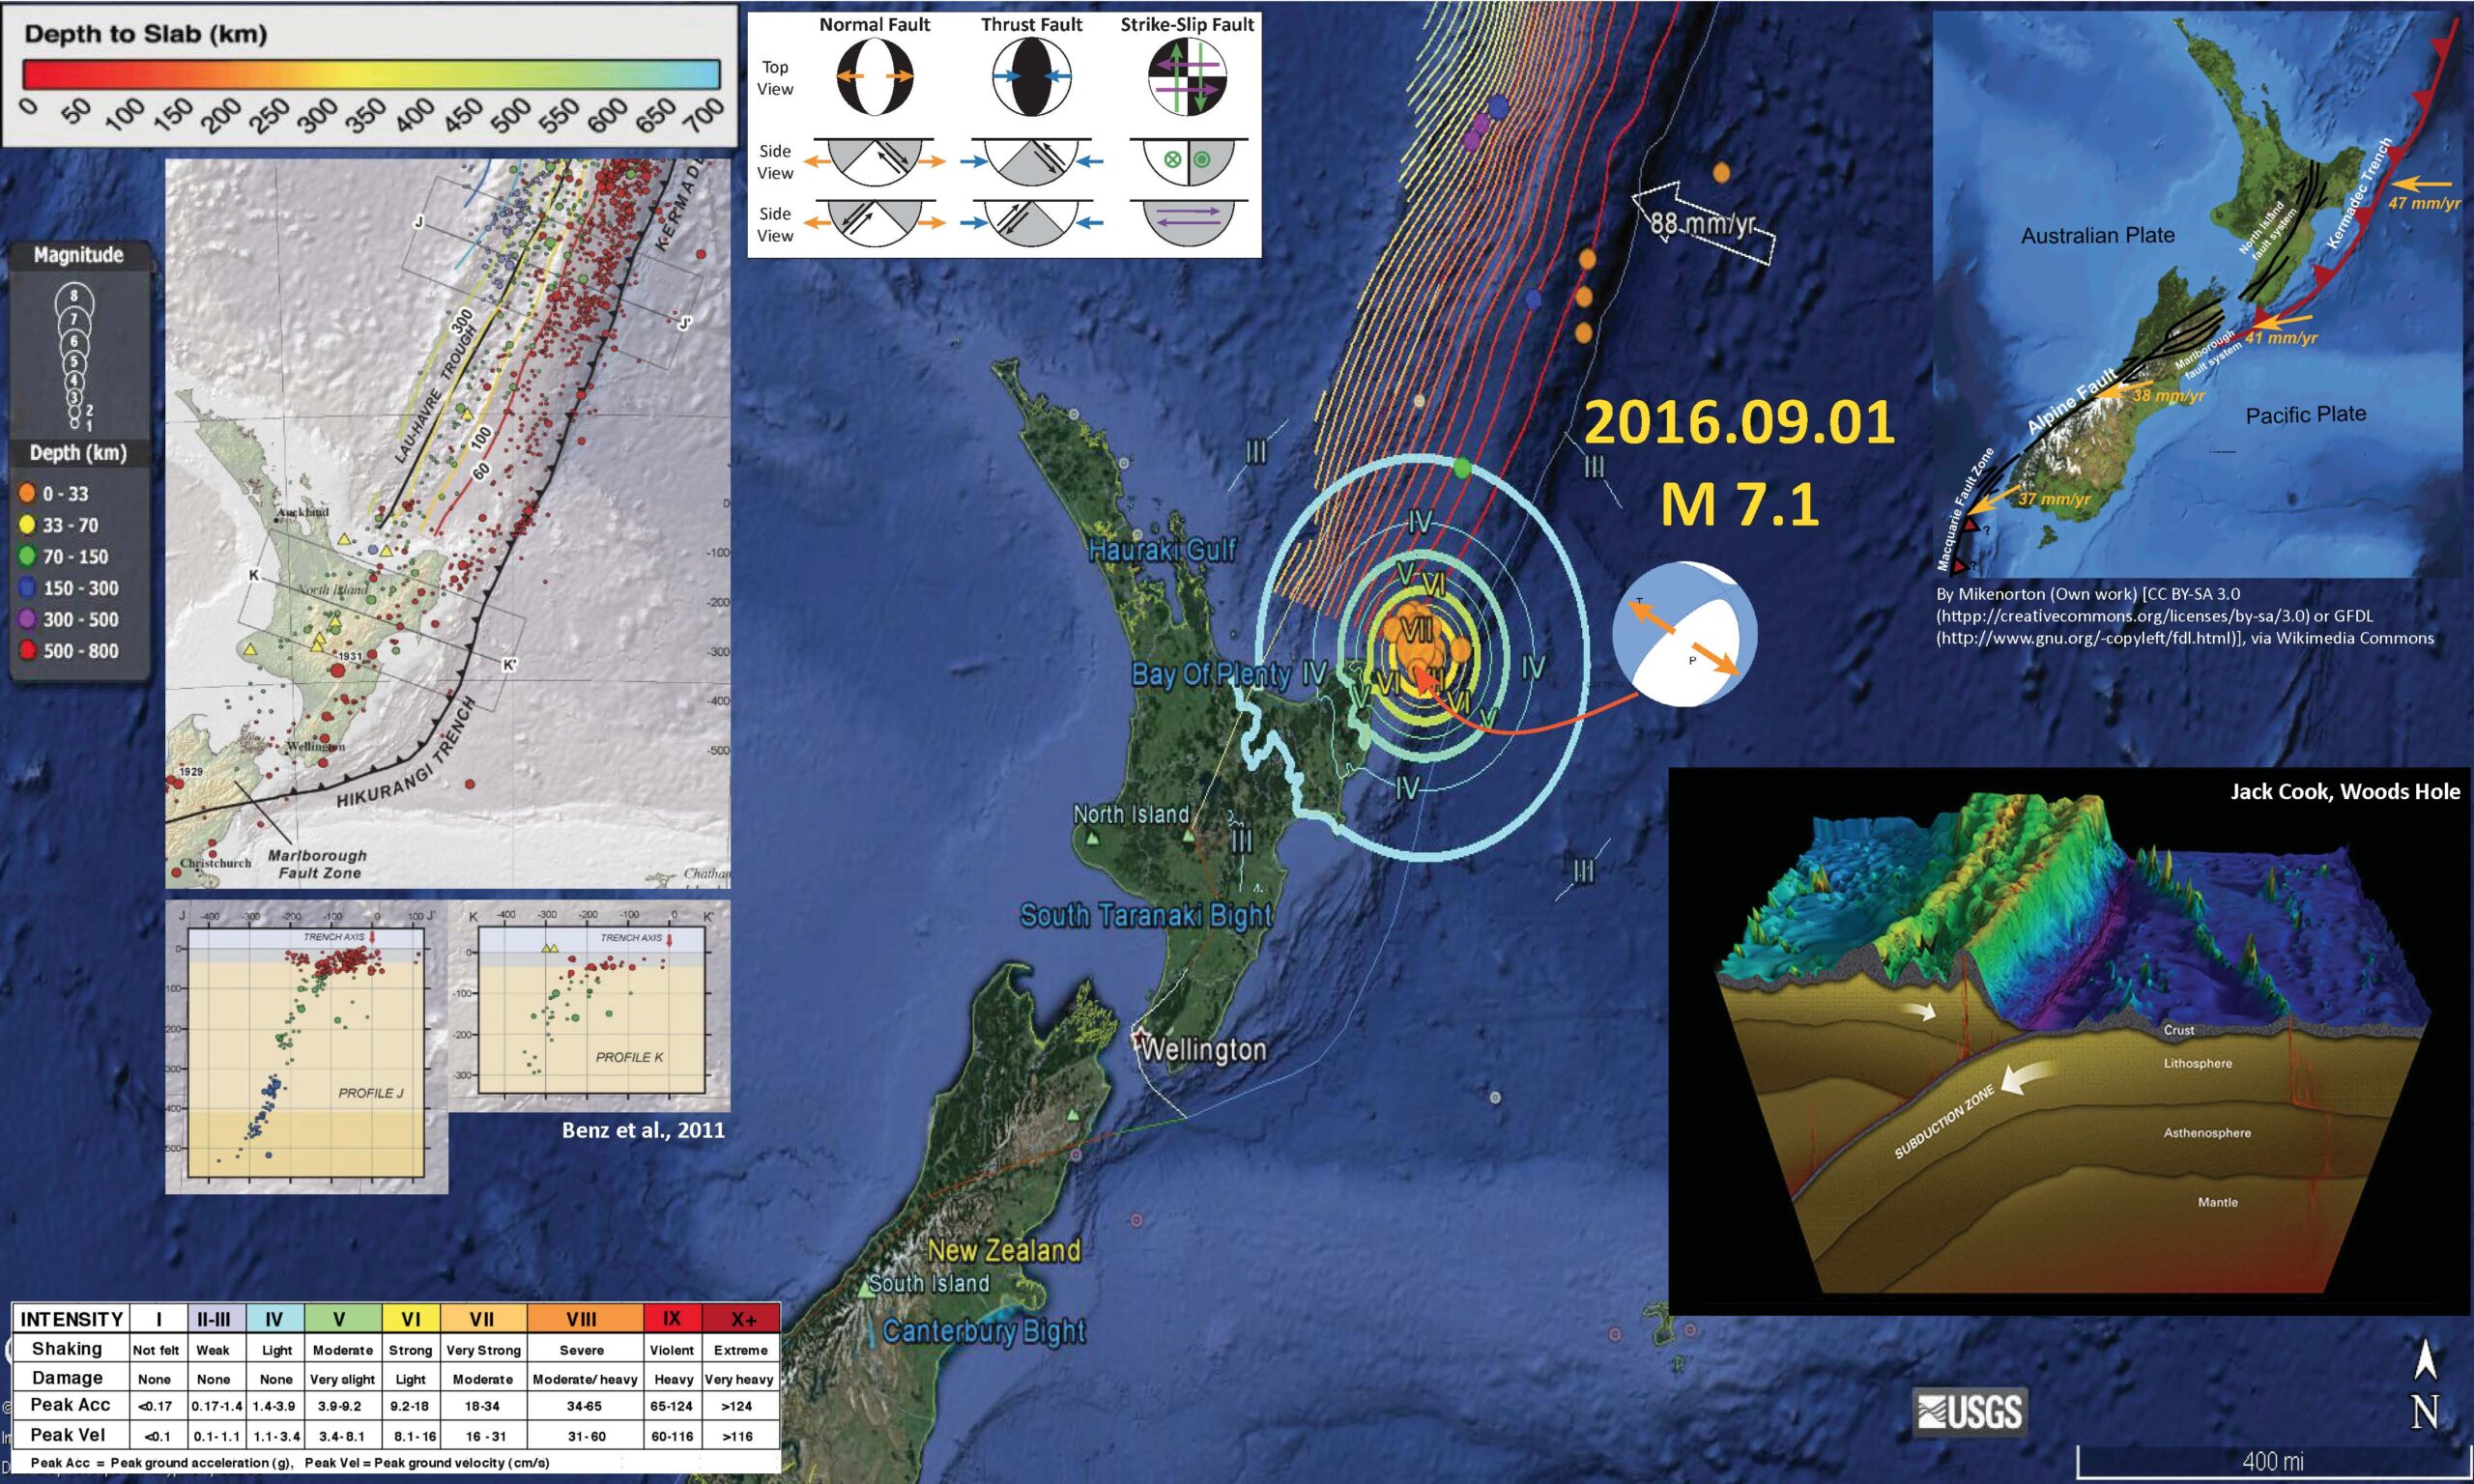
This was a very busy week for me, so I missed reporting on this series of earthquakes offshore the North Island of New Zealand. I did put together an interpretive Earthquake Report poster for these earthquakes for my general education earthquakes class, of which I present below. Initially there was a M 5.8 earthquake (USGS website for M 5.8), with a M 7.1 about 18 hours later (USGS website for M 7.1). Here is a kml that includes these, as well as the aftershocks to date. We have a great deal of information about the plate tectonics of this region. These earthquakes are along the northern Hikurangi margin, which is a convergent plate boundary formed by the subduction of the Pacific plate westward beneath the Australia plate.
The M 5.8 earthquake had an hypocentral depth of ~22 km, which (based upon the slab contours) places this earthquake in the downgoing Pacific plate. As plates subduct, they undergo extension as the deeper part of the plate pulls down on the shallower part of the plate. This “slab tension” can result in extensional (normal) earthquakes. Also, due to various reasons, the downgoing plate can be bent or flexed downwards. This can happen oceanward of the subduction zone or beneath the tip of the subduction zone fault, after the downgoing plate has subducted. If this downgoing plate flexes downward, the upper part of the lithosphere undergoes extension and extensional/normal earthquakes occur.
Initially, the M 7.1 earthquake was given an hypocentral depth of ~300 km. This was confusing as it did not seem to be anywhere near oceanic lithosphere as estimated by people who study this region. Within minutes, the USGS hypocentral depth was re-determined to be ~19 km. Comparing this depth with the slab contours (Hayes et al., 2012), this earthquake also occurred in the Pacific plate. The M 5.8 is probably a foreshock for the M 7.1, but we also might consider that the M 5.8 triggered the M 7.1 earthquake. Others will need to analyze these earthquake more before this detail can be worked out.
Below is my interpretive poster for this earthquake. This map shows the slab contours (an estimate of the subduction zone plate interface). These contours are estimated by Hayes et al., (2012). The hypocentral depth is 19.0 km, which is deeper than the slab depth according to Hayes et al. (2012), which is probably about 15 km. This earthquake is clearly in one of the downgoing slabs of the Pacific plate.
I placed a moment tensor / focal mechanism legend on the poster. There is more material from the USGS web sites about moment tensors and focal mechanisms (the beach ball symbols). Both moment tensors and focal mechanisms are solutions to seismologic data that reveal two possible interpretations for fault orientation and sense of motion. One must use other information, like the regional tectonics, to interpret which of the two possibilities is more likely. The moment tensor shows northwest-southeast tension. If this is due to slab tension, then the slab would be dipping to the northwest, or the southeast. This tension may also be due to some form of bending in the slab, but it is difficult to tell given these limited data. Most of the recent seismicity in this region is associated with convergence along the New Britain trench or the South Solomon trench.
-
I include some inset figures.
- In the upper right corner is a generalized tectonic map from Mike Norton (see poster for attribution).
- In the lower right corner is a cross section of the southern Kermadec Trench. This was produced by Jack Cook at the Woods Hole Oceanographic Institution. The Lousiville Seamount Chain is clearly visible in this graphic.
- In the upper left corner I include a map from the USGS Open File Report for this region of the world (Benz et al., 2011). The map shows seismicity colored vs. depth, some slab contours, and the location of the two cross sections that are also included in this poster (J-J’ and K-K’).
-
Here are two figures from Jascha Polet, a seismologist at Cal Poly Pomona.
- Here is a map showing seismicity and moment tensors for historic earthquakes, as well as the m 7.1 earthquake.
- Here is a cross section showing the same seismicity and moment tensor data.
- Here are some cross sections from Scherwath et al. (2010), located close to where the M 7.1 earthquake occurred. Note how the M 7.1 occurred at a location where the downgoing Pacific plate is indeed bending downward near the M 7.1 hypocenter.
- This is an excellent visualization of seismic waves from the M 7.1 earthquake as recorded by seismometers. Above is a static graphic of the animation and below is the animation. Here is the IRIS page for this data set.
- Here is a link to the mp4 video file embedded below.
For more on the graphical representation of moment tensors and focal mechanisms, check this IRIS video out:
-
References:
- Benz, H.M., Herman, Matthew, Tarr, A.C., Furlong, K.P., Hayes, G.P., Villaseñor, Antonio, Dart, R.L., and Rhea, Susan, 2011. Seismicity of the Earth 1900–2010 eastern margin of the Australia plate: U.S. Geological Survey Open-File Report 2010–1083-I, scale 1:8,000,000.
- Hayes, G. P., D. J. Wald, and R. L. Johnson (2012), Slab1.0: A three-dimensional model of global subduction zone geometries, J. Geophys. Res., 117, B01302, doi:10.1029/2011JB008524.
- Scherwath, M., Kopp, H., Flueh, E.R., Henrys, S.A>m, Sutherland, R., Stagpoole, V.M., Barker, D.H.N., Reyners, M.E., Bassett, D.G., Planert, L., and Dannowski, A., 2010. Fore‐arc deformation and underplating at the northern Hikurangi margin, New Zealand in Journal of Geophysical Research, v. 115, B06408, doi:10.1029/2009JB006645, pp. 23.


