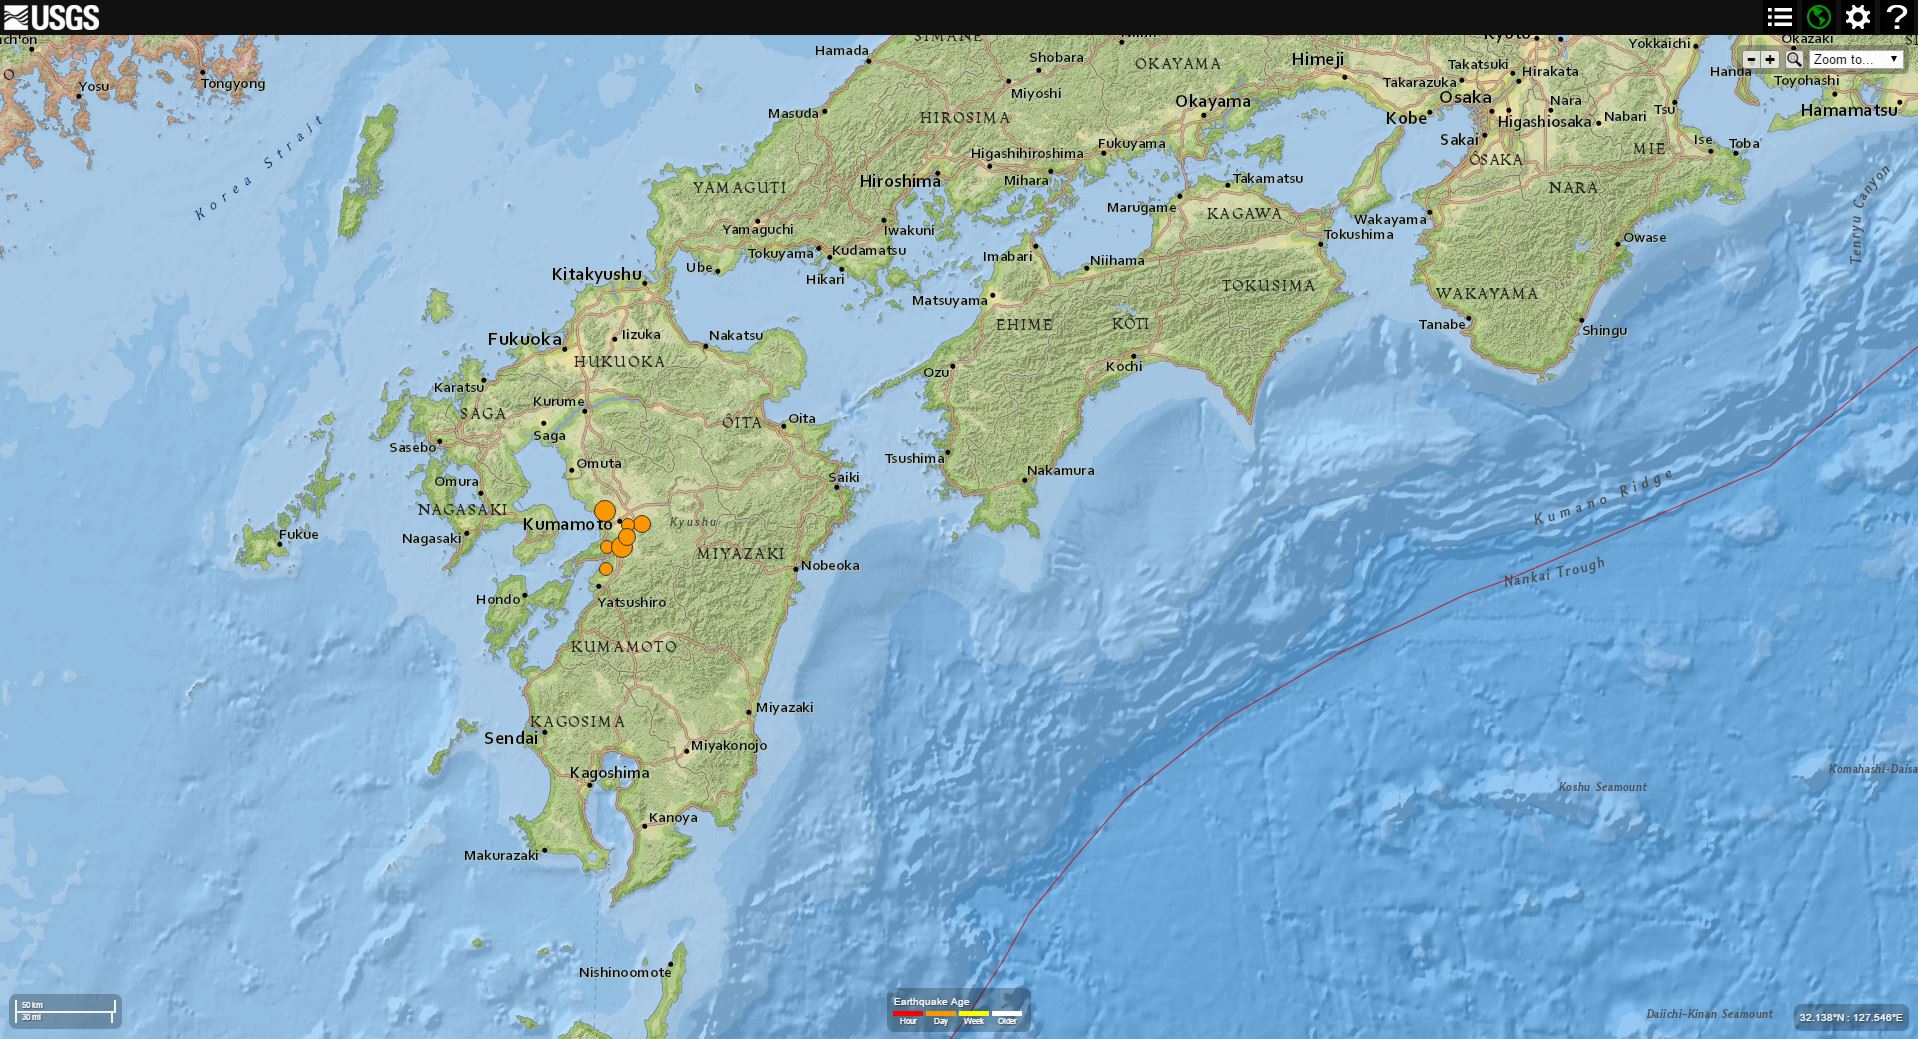
We just had a shallow depth earthquake in Japan along a strike-slip fault.
-
Here are the USGS websites for the larger earthquakes in this region for today.
- 2016.04.14 M 6.2
- 2016.04.14 M 6.0
- 2016.04.14 M 5.3
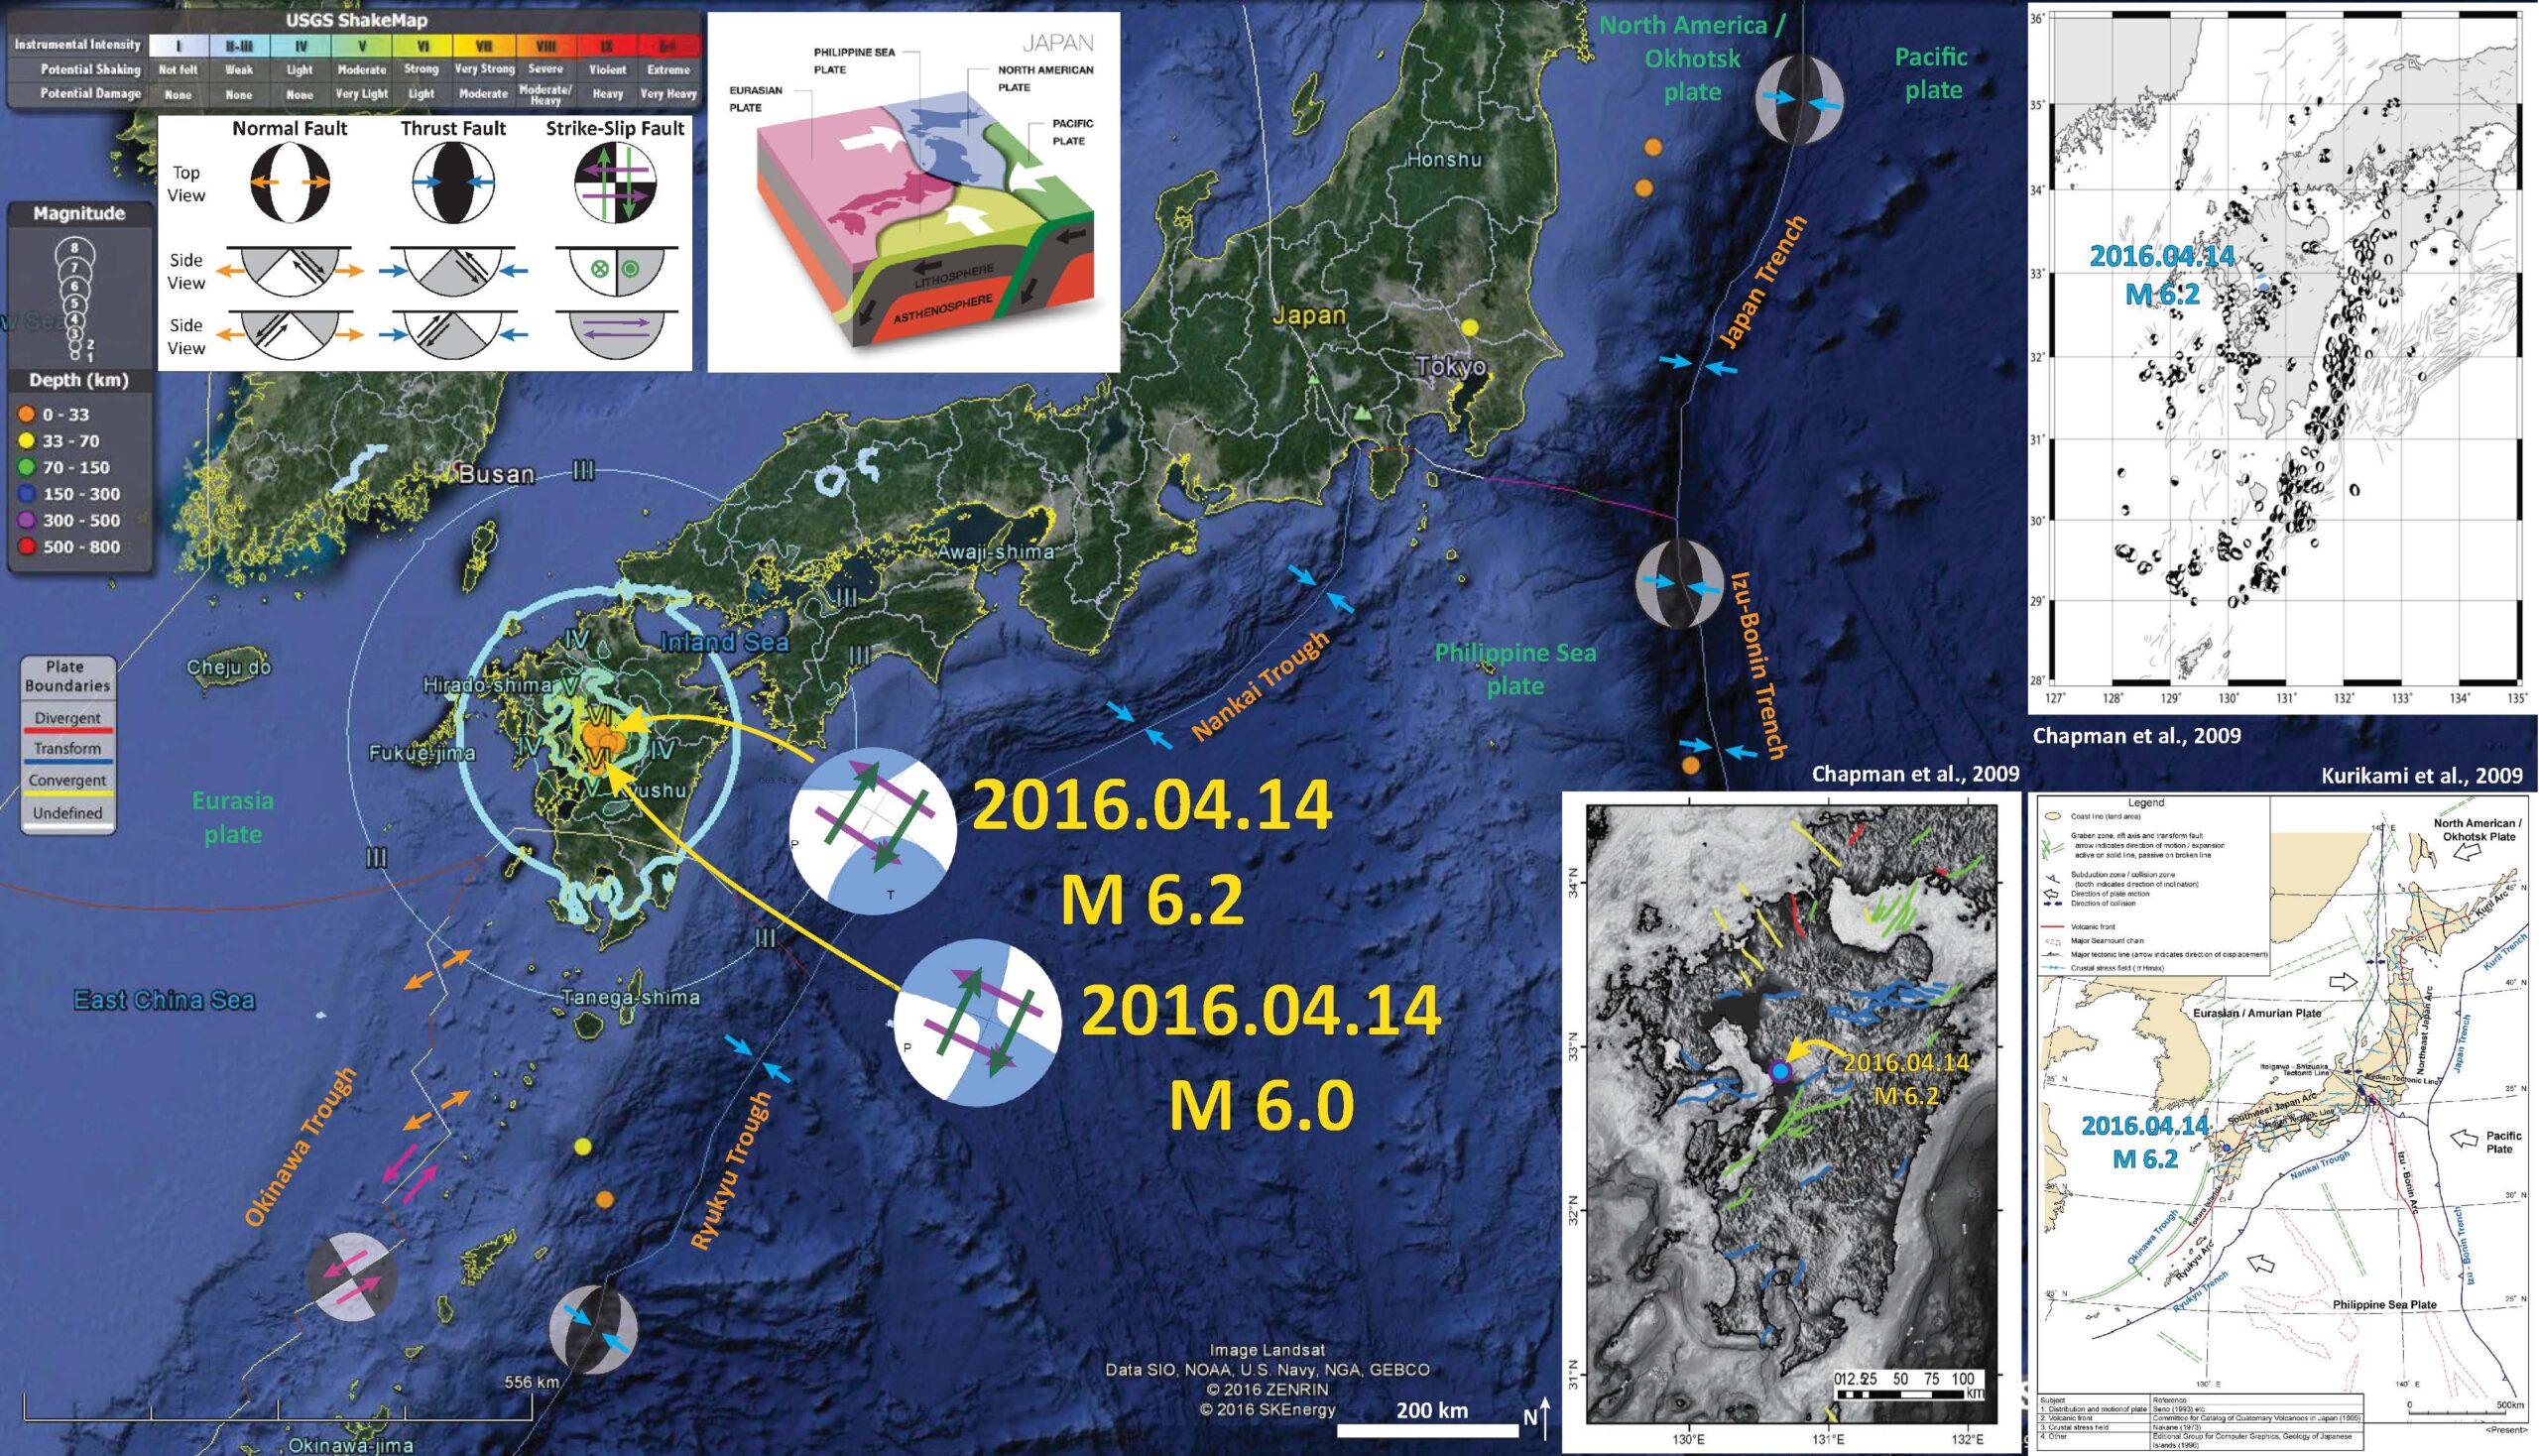
Below is the Earthquake Report Poster for this series of earthquakes. I plot the moment tensors for the M 6.2 and M 6.0 earthquakes. I also include the Modified Mercalli Intensity (MMI) contours. The MMI is a qualitative measure of shaking intensity. More on the MMI scale can be found here and here.
There is a legend that shows how moment tensors can be interpreted. Moment tensors are graphical solutions of seismic data that show two possible fault plane solutions. One must use local tectonics, along with other data, to be able to interpret which of the two possible solutions is correct. The legend shows how these two solutions are oriented for each example (Normal/Extensional, Thrust/Compressional, and Strike-Slip/Shear). There is more about moment tensors and focal mechanisms at the USGS.
-
I include some inset maps.
- In the upper right corner is a figure from a report from Nuclear Waste Management Organization of Japan (NUMO). This report is entitled “Development of Methodologies for the Identification of Volcanic and Tectonic Hazards to Potential HLW Repository Sites in Japan –The Kyushu Case Study-” (Chapman et al., 2009). This figure shows historic focal mechanisms for earthquakes in this region. I plot the moment tensor from the M 6.2 earthquake in the approximate location.
- In the lower right corner is a map showing the plate tectonics of the region. Note the Median Tectonic Line (MTL), a right-lateral (dextral) strike slip fault system. Todays earthquakes appear aligned with this fault system (Kurikami et al., 2009). I plot the epicenter in the approximate location as a blue dot.
- To the left of that tectonic map is a map that shows the mapped faults in the region (Chapman et al., 2009). The faults are color coded by sense of movement (green = dextral; blue = normal, red = reverse, yellow = sinistral). I plot the epicenter in the approximate location as a blue dot.
I interpret these earthquakes to be right-lateral strike-slip earthquakes because of the proximity to the MTL. There is also a left lateral strike-slip fault system along the south east part of Kyushu, so this is also possible.

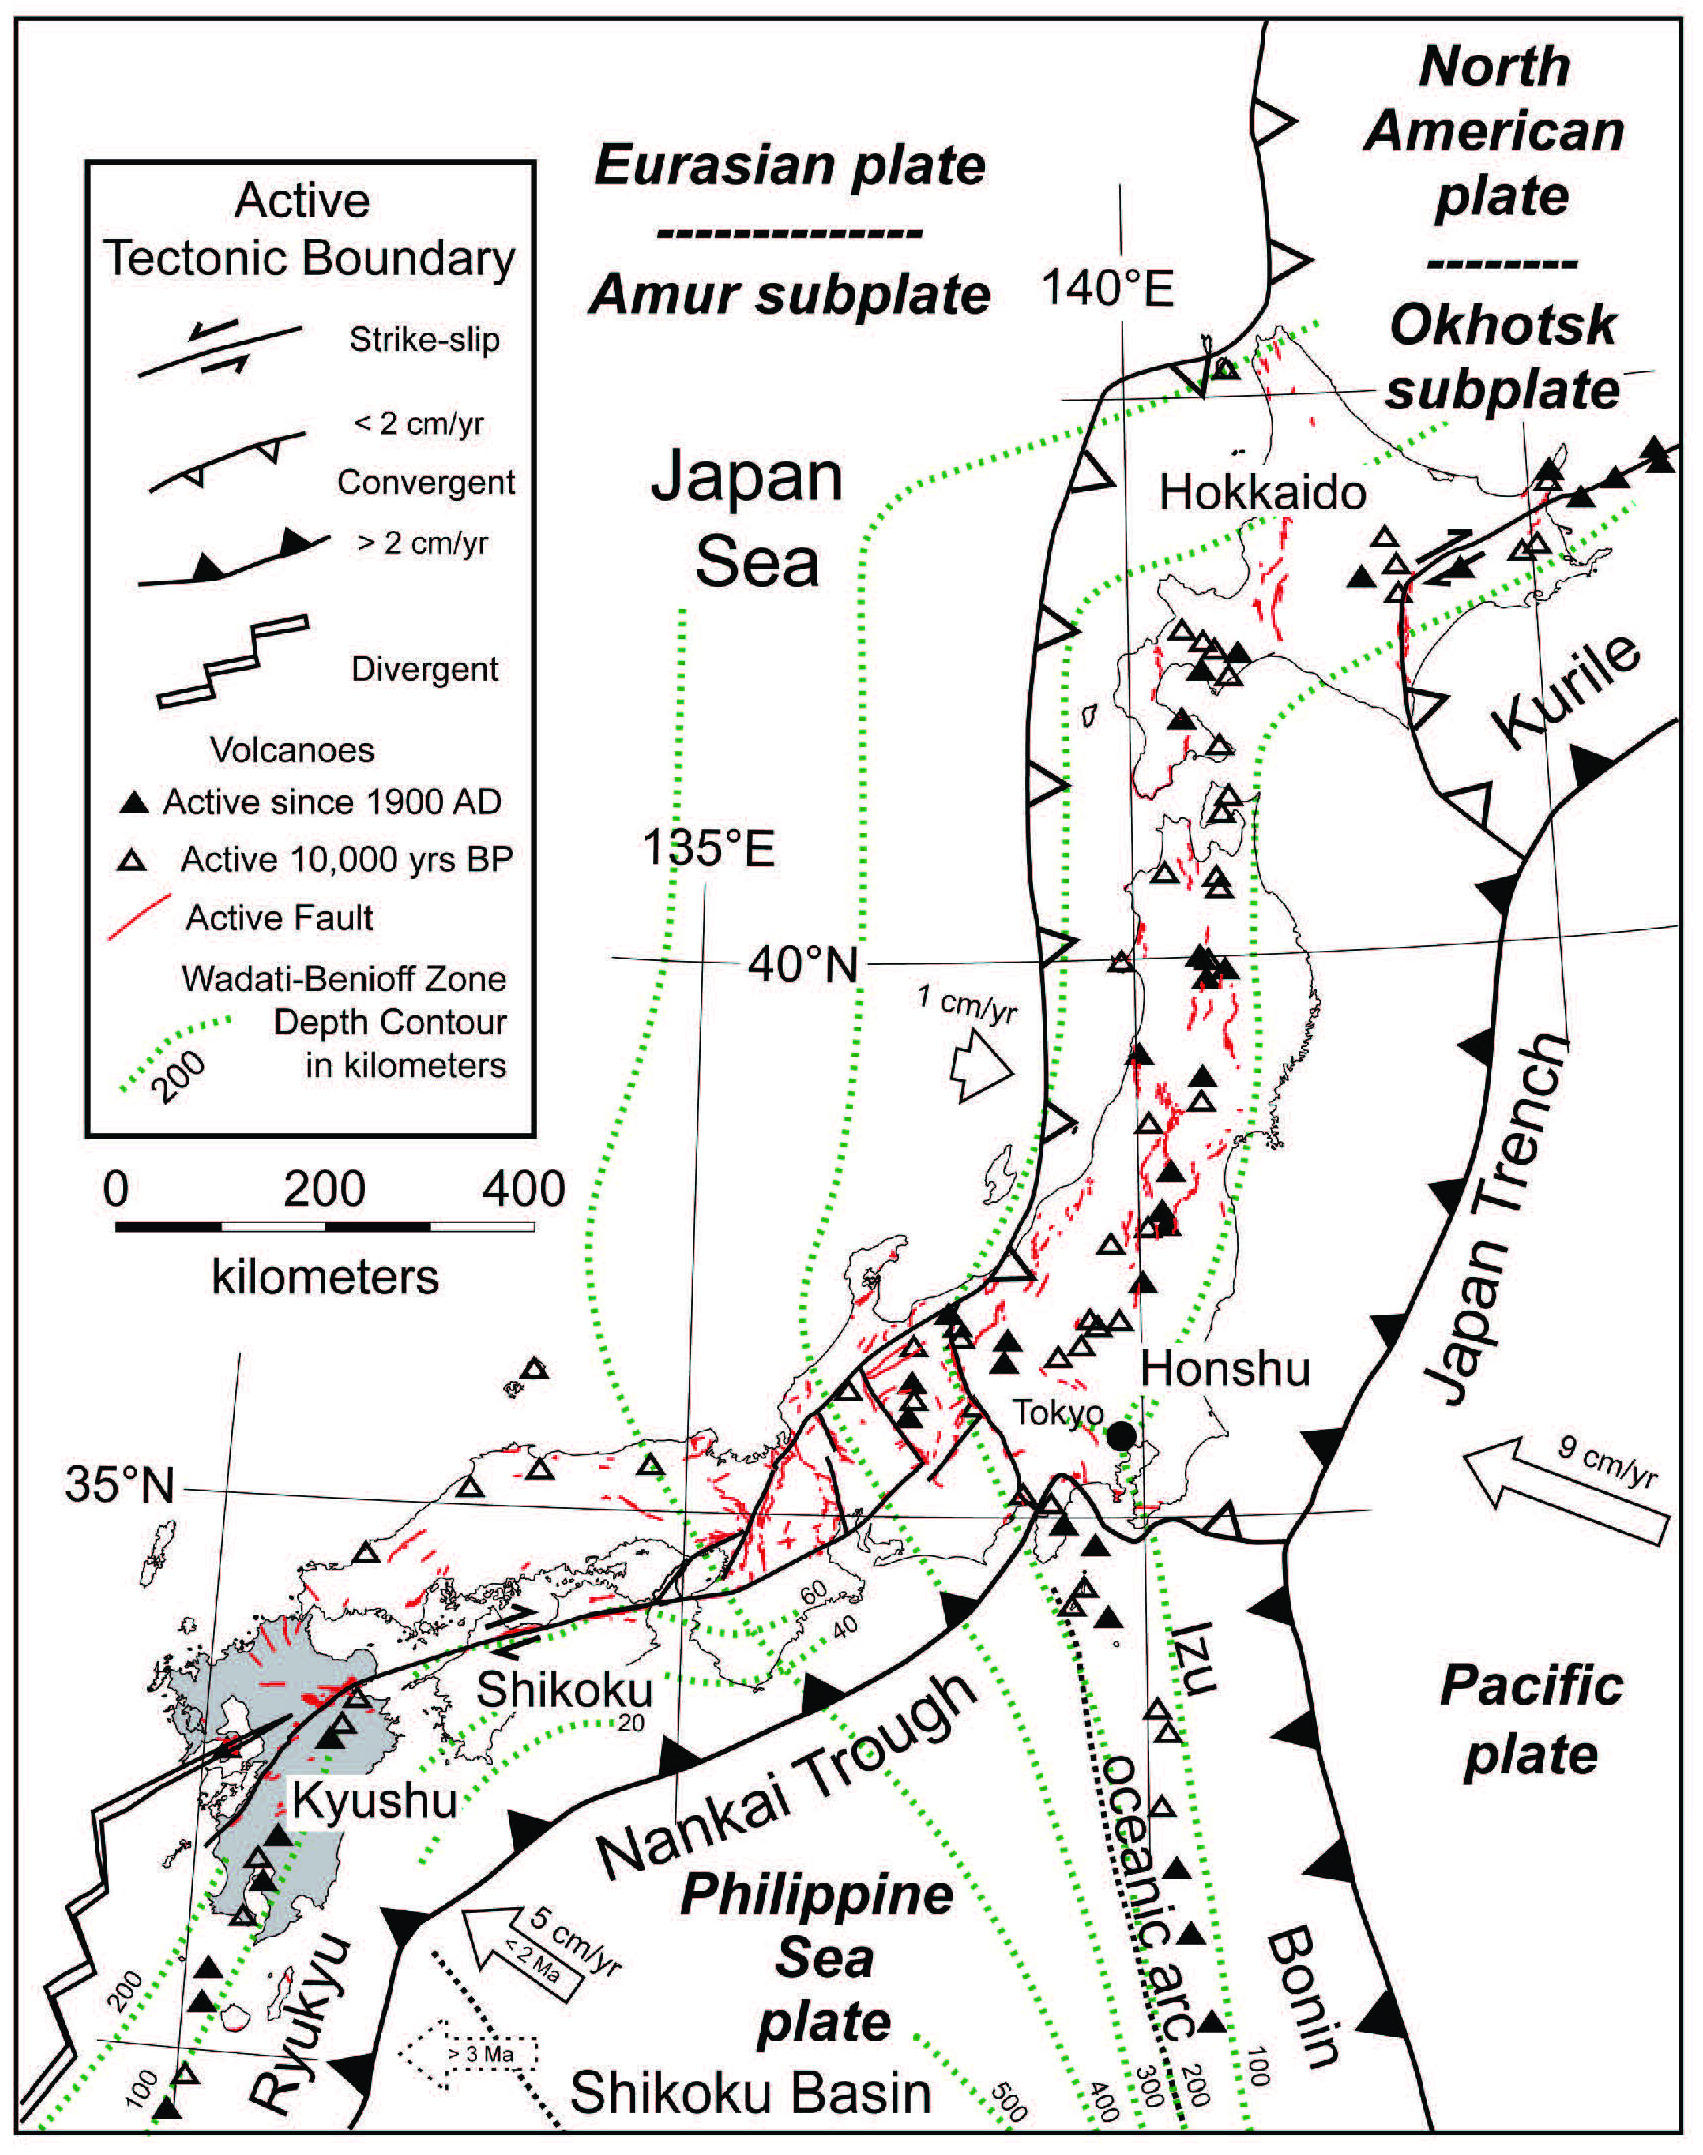
- Here is the figure showing the tectonic setting (Kurikami et al., 2009). I include their figure caption as a blockquote.

Current tectonic situation of Japan and key tectonic features.
- Here is the figure showing the historical moment tensors for this region (Chapman et al., 2009). I include their figure caption as a blockquote.
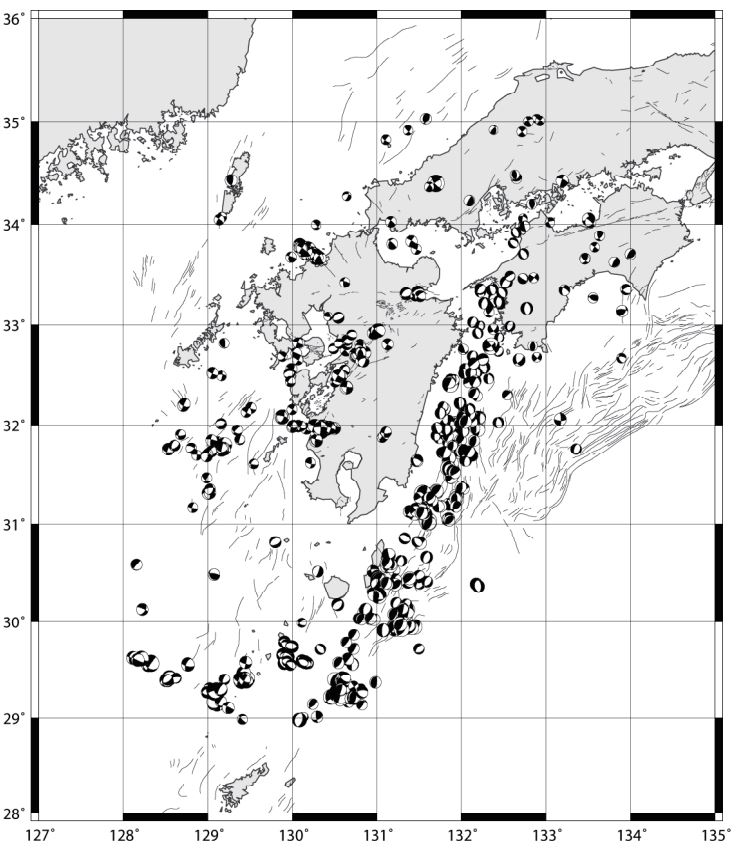
Focal mechanism plots for earthquakes in southwest Japan from 1997-2006. Based on CMT solutions from the JMA catalogue (data from http://www.fnet.bosai.go.jp).
- Here is the figure showing the mapped faults for this region (Chapman et al., 2009). I include their figure caption as a blockquote.
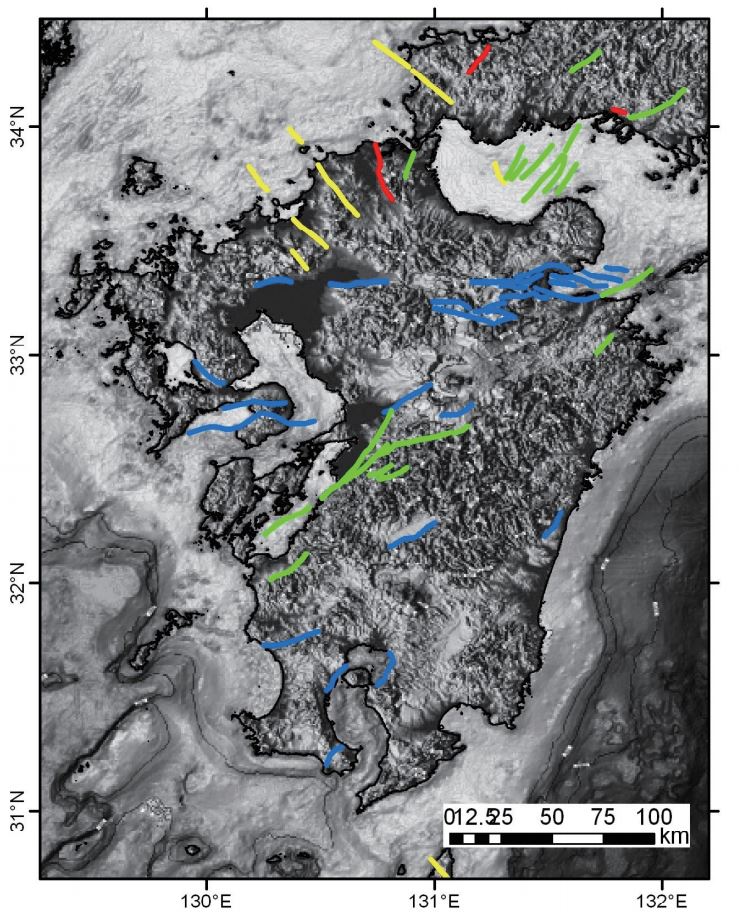
Active faults in southwest Japan from the Active Fault Research Centre’s active fault database (http://www.aist.go.jp/RIODB/activefault/cgi-bin/index.cgi). The faults are color coded by sense of movement (green = dextral; blue = normal, red = reverse, yellow = sinistral).
- Here is the figure showing the tectonic setting (Chapman et al., 2009). I include their figure caption as a blockquote.
Active faults in southwest Japan from the Active Fault Research Centre’s active fault database (http://www.aist.go.jp/RIODB/activefault/cgi-bin/index.cgi). The faults are color coded by sense of movement (green = dextral; blue = normal, red = reverse, yellow = sinistral).
I put together an animation that shows the earthquake epicenters in Japan from 1900-2016/04/01. I include earthquakes with magnitude ≥ 6.0. Below is a screenshot of all these earthquakes, followed by the video. Here is the kml that I made using a USGS earthquake query. Here is the query that I used. The animation has an additional cross section showing the Japan trench, where the 2011/03/11 Tohoku-Oki M 9.0 subduction zone earthquake occurred. Here is a summary of the observations made following that 2011 earthquake.
- Here is a link to the embedded video below (for download). (20 MB mp4)
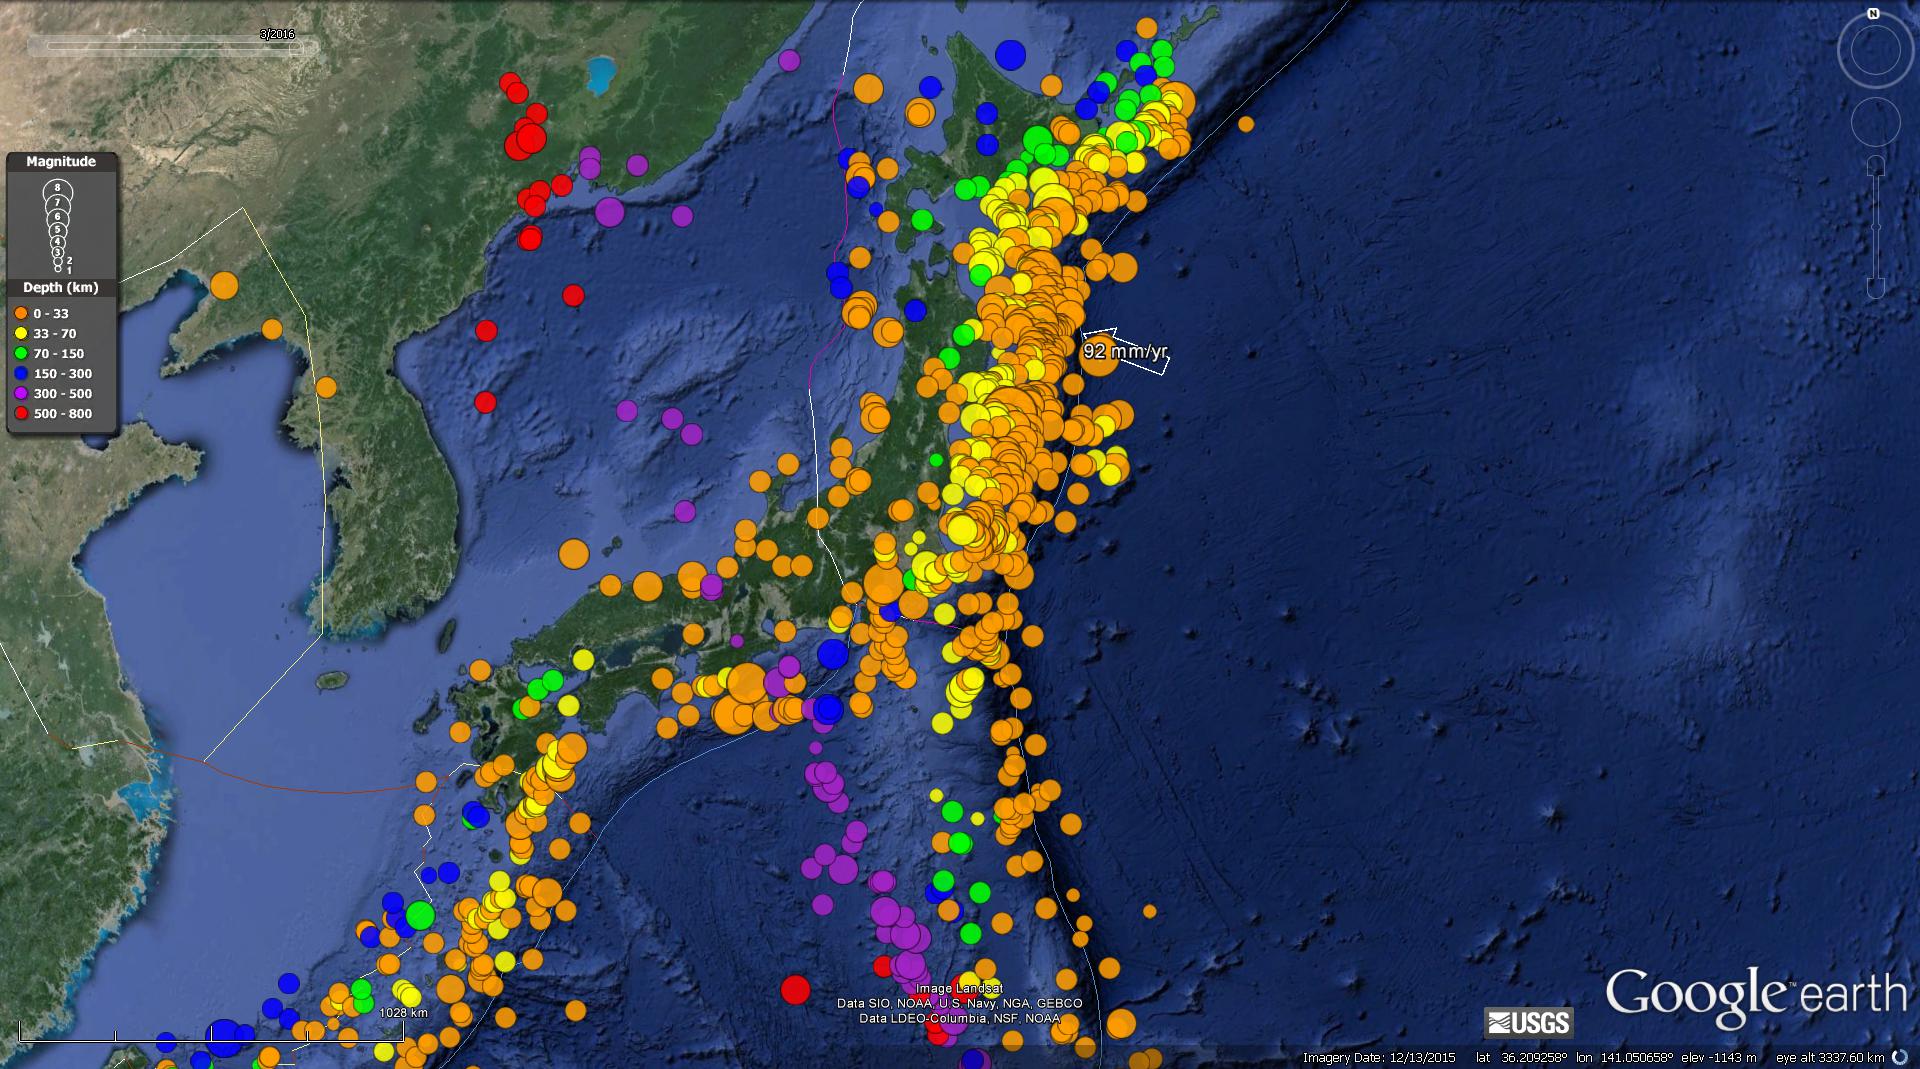
Here is the USGS Seismicity Summary Poster for this region (Rhea et al., 2010).

UDATE
The epicenters appear to be aligned with the MTL, suggesting that the NE striking fault plan is the correct solution.
-
References:
- Chapman et al., 2009. Development of Methodologies for the Identification of Volcanic and Tectonic Hazards to Potential HLW Repository Sites in Japan –The Kyushu Case Study-, NUMO-TR-09-02, NOv. 2009, 192 pp.
- Kurikami et al., 2009. Study on strategy and methodology for repository concept development for the Japanese geological disposal project, NUMO-TR-09-04, Sept. 20-09, 101 pp.
- Rhea, S., Tarr, A.C., Hayes, G., Villaseñor, A., and Benz, H.M., 2010. Seismicity of the earth 1900–2007, Japan and vicinity: U.S. Geological Survey Open-File Report 2010–1083-D, scale 1:6,000,000.
3 thoughts on “Earthquake Report: Kyushu, Japan!”