
We just had an earthquake along the New Hebrides Trench in the western Pacific. Here is the USGS webpage for this M 6.9 earthquake.
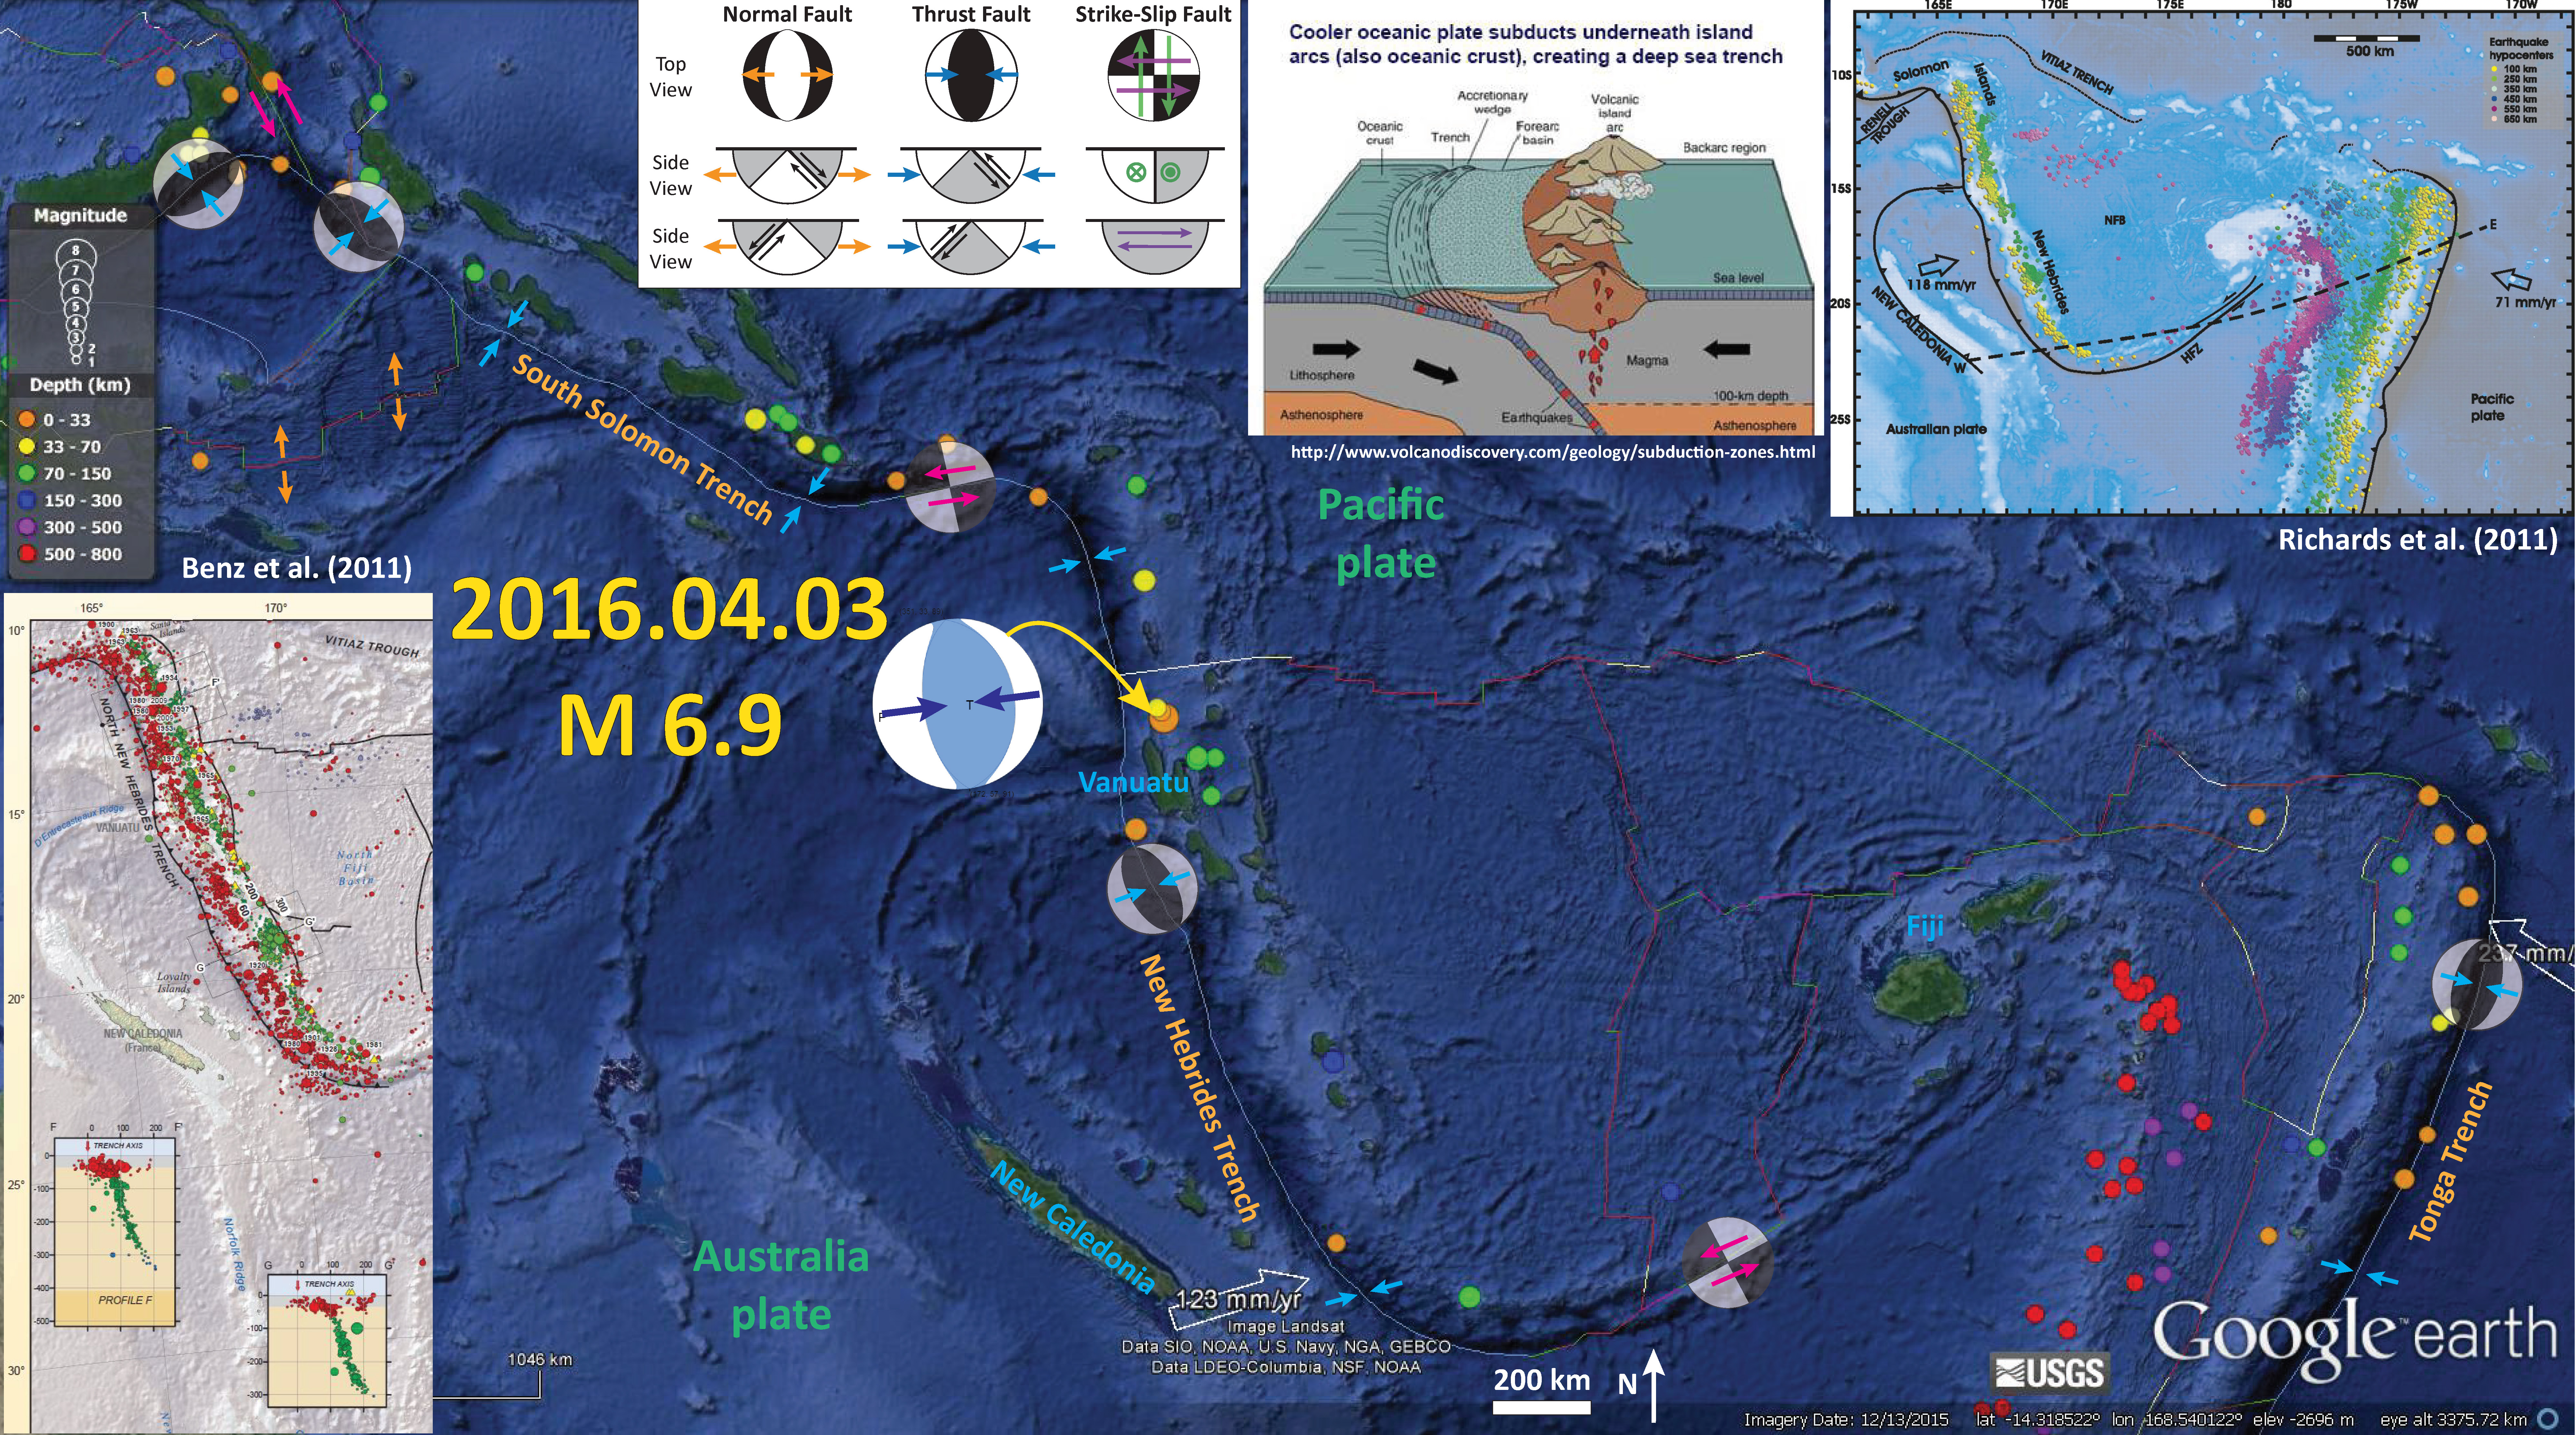
Below is my interpretive earthquake report poster. I plot the epicenters for earthquakes from the past 20 days. The epicenter for the M 6.9 earthquake is labeled and I have placed the USGS moment tensor for reference.
I placed a moment tensor / focal mechanism legend on the poster. There is more material from the USGS web sites about moment tensors and focal mechanisms (the beach ball symbols). Both moment tensors and focal mechanisms are solutions to seismologic data that reveal two possible interpretations for fault orientation and sense of motion. One must use other information, like the regional tectonics, to interpret which of the two possibilities is more likely.
-
I include some inset figures in the poster.
- In the upper right corner is a tectonic map showing the plate boundaries (Richards et al., 2011).
- To the left of the Richards et al. (2011) figure is a cross section of a generic ocean-ocean subduction zone, where oceanic lithosphere is subducting beneath oceanic lithosphere. Note the location of the magmatic island arc. Vanuatu and the other islands in this region are formed as part of an island arc.
- In the lower left corner I place a subset of the USGS tectonic map poster for this region of the Pacific Ocean. This is from the USGS Open File Report 2010-1083-I (Benz et al., 2011). Hypocenters are plotted as cross sections to show the geometry of the subducting slabs.
Here is a map that shows (1) Modified Mercalli Intensity contours and (2) slab contours for the subduction zone. The MMI scale is a qualitative scale of the ground motions. There is more about the MMI here.
Note how the MMI contours are not perfect circles. This is the result of topography affecting the distance to the earthquake. Note the along the western part of Vanuatu, the MMI contours trend to the south at the coast and then to the north. At the coast, the ground surface is closer to the earthquake, so the MMI contours extend to a greater horizontal distance from the epicenter. In contrast, along the ridge the region is at a further distance from the earthquake, so the MMI contours extend to a lesser distance from the epicenter.
The red-orange-yellow lines are slab contour lines from Hayes et al. (2012). These lines are a best estimate for the depth to the subduction zone fault. These are based largely upon seismicity and there is currently an effort to update these contours to integrate other data types. The hypocentral depth is 35 km, and the slab contour nearest the epicenter is 40 km (so this makes sense that it is associated with the subduction zone megathrust).

The New Hebrides subduction zone dips to the east and turns into a transform fault (Richards et al., 2011).
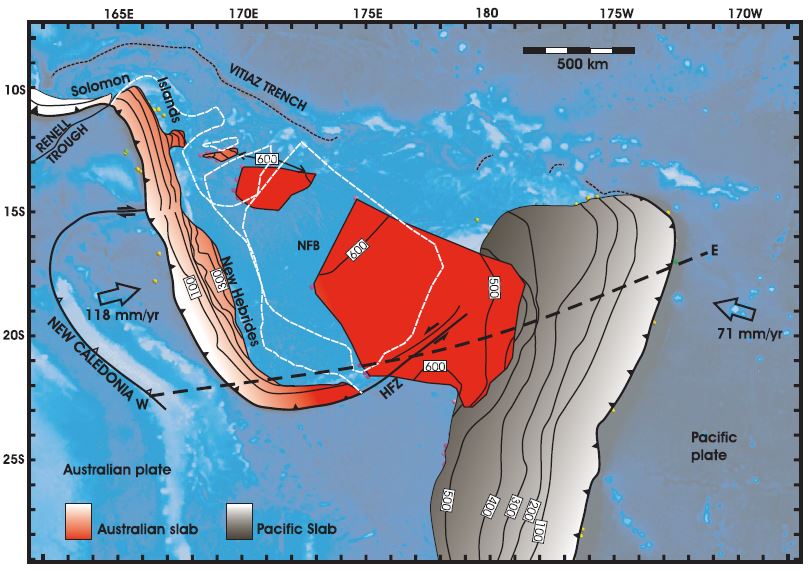
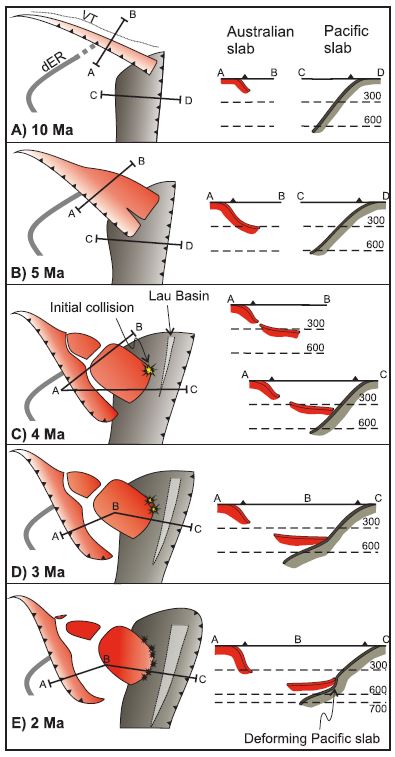
This figure shows Richards et al. (2011) Figure 4, that displays their interpretation of how the plates came to be configured here. They propose that the Australia plate detached and collided with the Pacific slab about 4 million years ago.
Here is a map from the USGS report linked above. Read more about this map on the USGS website. Earthquakes are plotted with color related to depth and circle diameter related to magnitude. Today’s M 7.1 earthquake occurred midway between these two cross sections F-F’ and G-G’.

This is the legend.
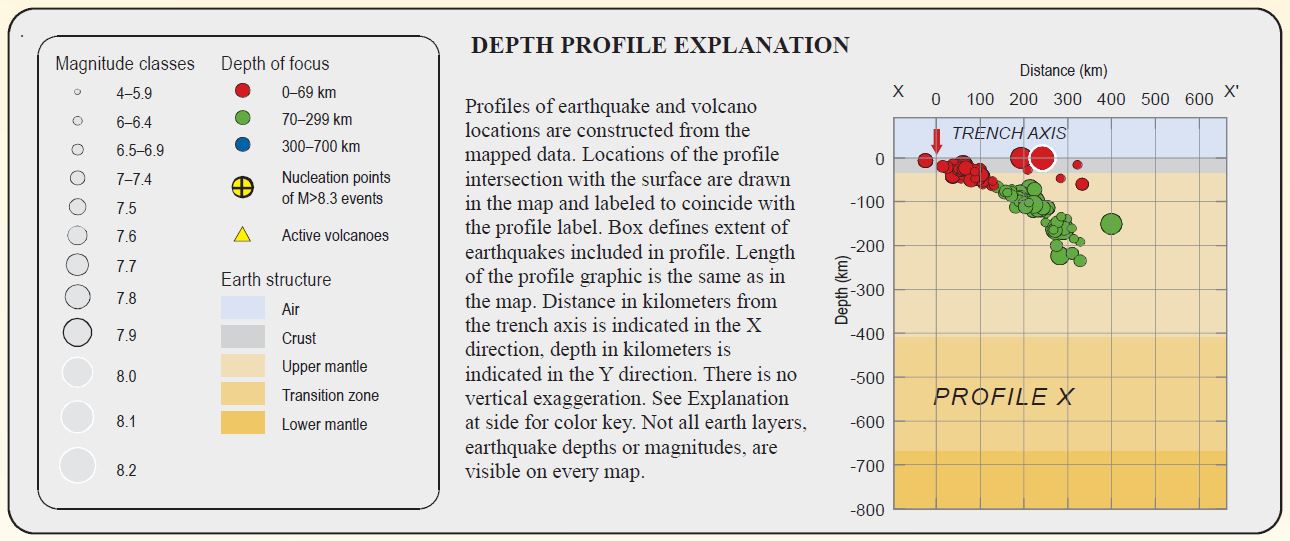
Here are two cross sections showing the seismicity along swatch profiles F-F’ and G-G’.
F-F’

G-G’

-
Here is a cool video from IRIS that discusses the tectonics of this region.
- Here is a direct link to the embedded video below (10 MB mp4)
-
References:
- Hayes, G. P., D. J. Wald, and R. L. Johnson, 2012. Slab1.0: A three-dimensional model of global subduction zone geometries, J. Geophys. Res., 117, B01302, doi:10.1029/2011JB008524.
- Benz, H.M., Herman, Matthew, Tarr, A.C., Furlong, K.P., Hayes, G.P., Villaseñor, Antonio, Dart, R.L., and Rhea, Susan, 2011. Seismicity of the Earth 1900–2010 eastern margin of the Australia plate: U.S. Geological Survey Open-File Report 2010–1083-I, scale 1:8,000,000.
- Richards, S., Holm., R., Barber, G., 2011. When slabs collide: A tectonic assessment of deep earthquakes in the Tonga-Vanuatu region, Geology, v. 39, pp. 787-790.
3 thoughts on “Earthquake Report: Vanuatu!”