Here I present a poster for the M 7.0 Hubbard Glacier Earthquake in Yukon Territory/Alaska.
https://earthquake.usgs.gov/earthquakes/eventpage/us6000rsy1/executive
This earthquake slipped along a fault that connects the Queen Charlotte/Fairweather fault system with the Totschunda fault (that slipped in 2002). This fault is termed the Connector fault.
This earthquake is also at the northern part of a north-south convergent margin (the north part of the Yakutat microplate).
The earthquake mechanism shows a strike-slip oblique solution (combining the north-south compression with the right-lateral strike-slip tectonic setting).
I don’t always have the time to write a proper Earthquake Report. However, I prepare interpretive posters for these events.
Because of this, I present Earthquake Report Lite. (but it is more than just water, like the adult beverage that claims otherwise). I will try to describe the figures included in the poster, but sometimes I will simply post the poster here.
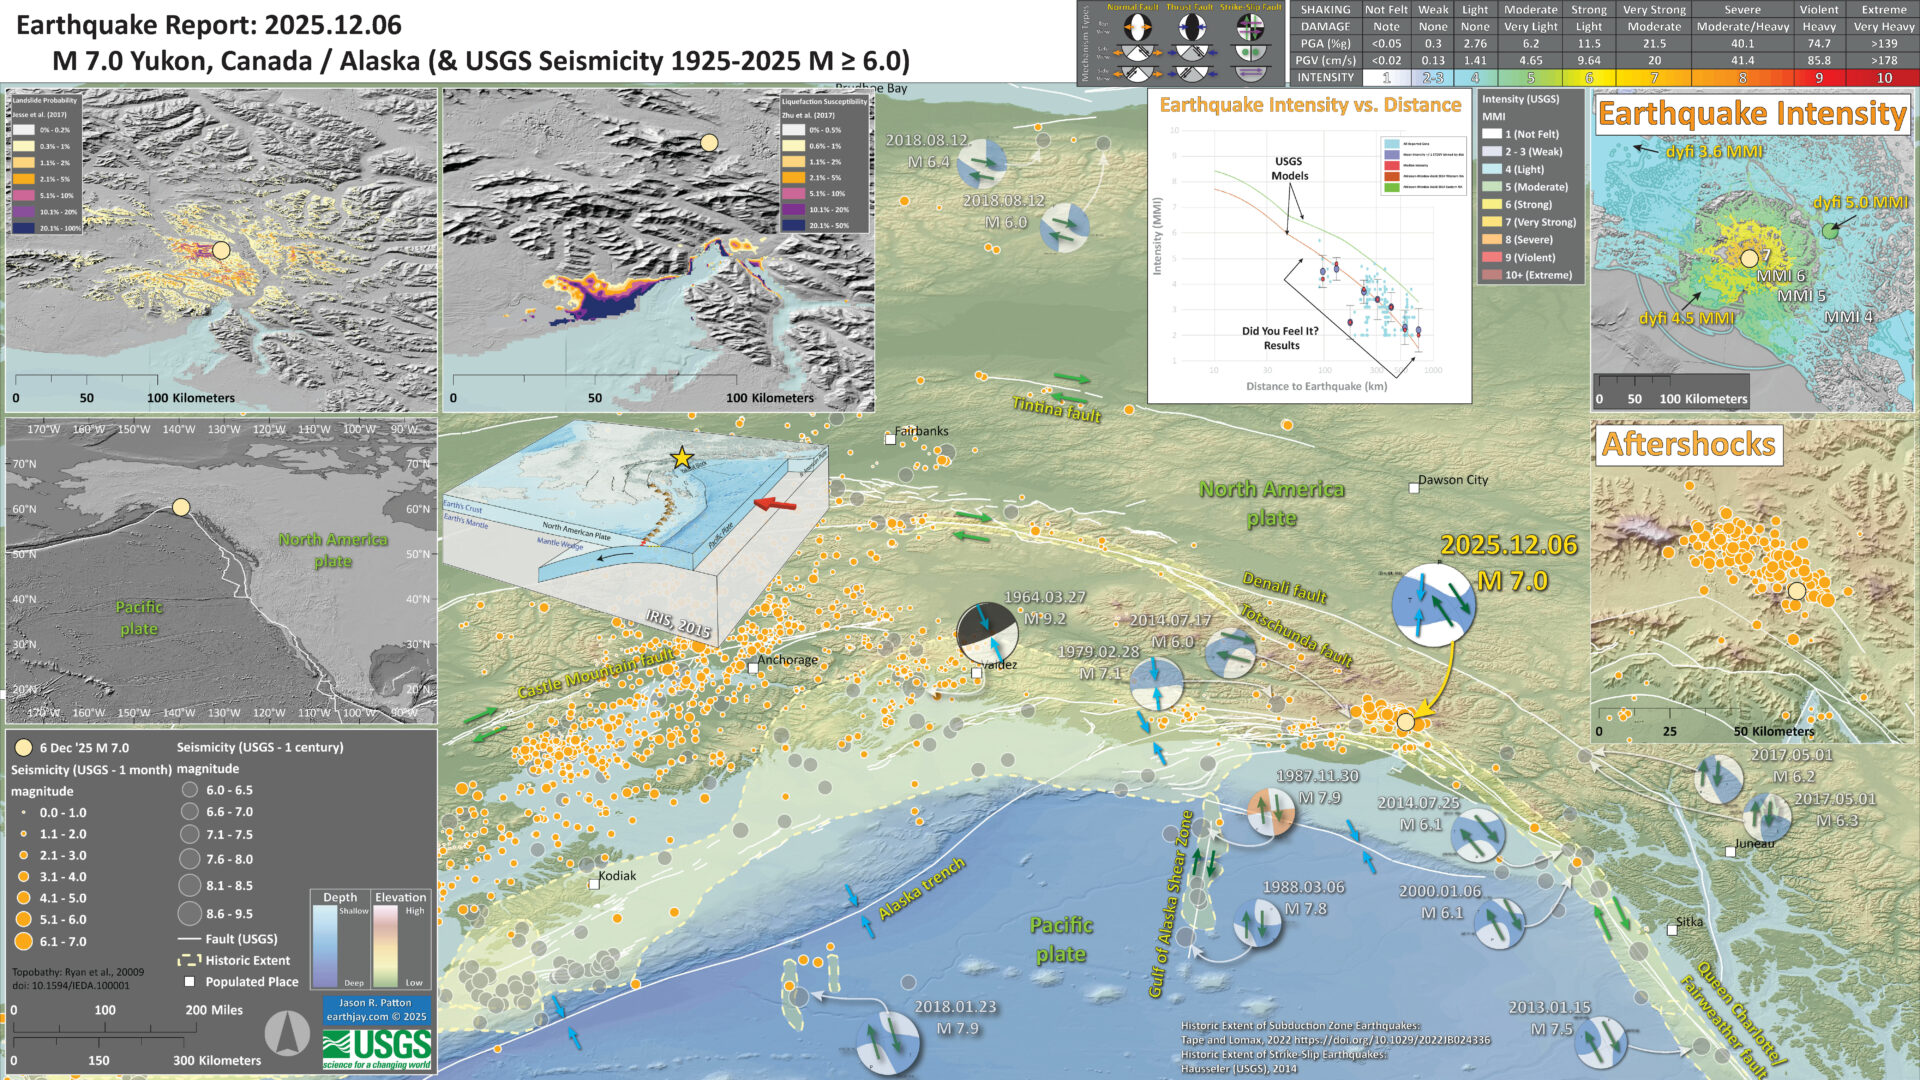
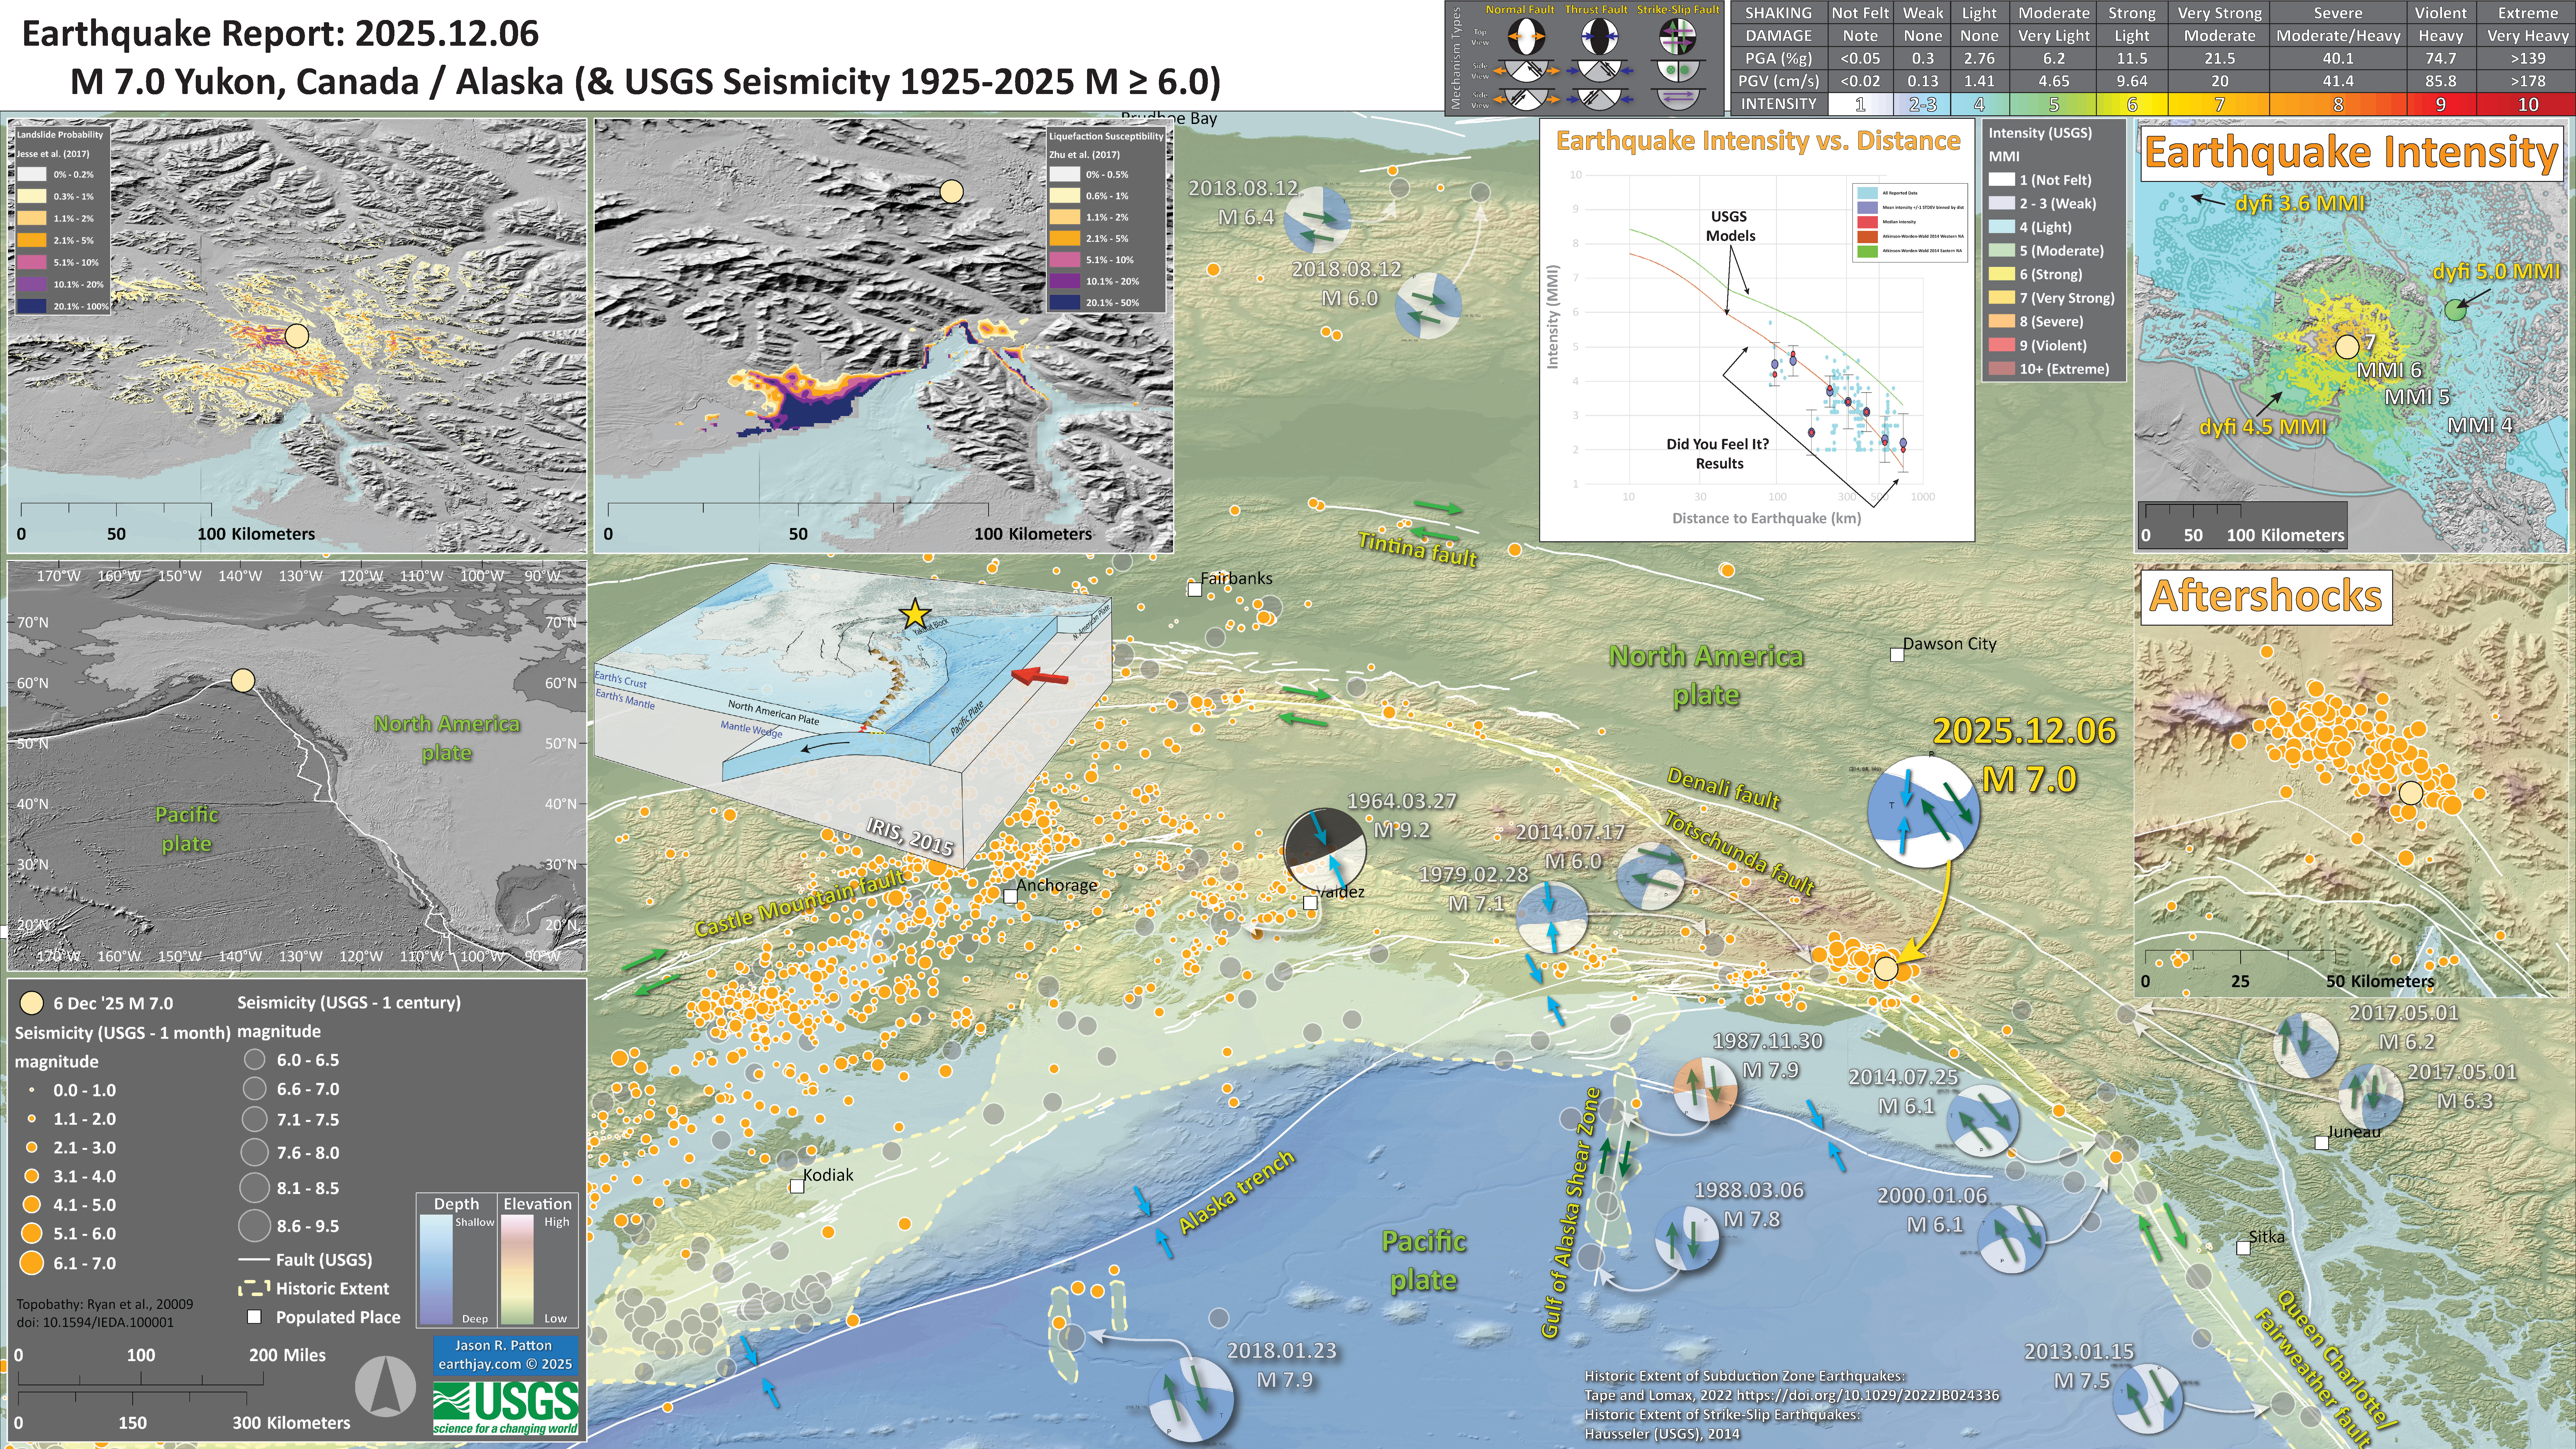
Below is my interpretive poster for this earthquake
- I plot the seismicity from the past month, with diameter representing magnitude (see legend). I include earthquake epicenters from 1923-2023 with magnitudes M ≥ 3.0 in one version.
- I plot the USGS fault plane solutions (moment tensors in blue and focal mechanisms in orange), possibly in addition to some relevant historic earthquakes.
- A review of the basic base map variations and data that I use for the interpretive posters can be found on the Earthquake Reports page. I have improved these posters over time and some of this background information applies to the older posters.
- Some basic fundamentals of earthquake geology and plate tectonics can be found on the Earthquake Plate Tectonic Fundamentals page.
- In the left center is a map showing the plate tectonic boundaries (from the USGS).
- In the upper right corner is a map that shows the M 7.0 earthquake intensity using the modified Mercalli intensity scale. Earthquake intensity is a measure of how strongly the Earth shakes during an earthquake, so gets smaller the further away one is from the earthquake epicenter. The map colors represent a model of what the intensity may be. The USGS has a system called “Did You Feel It?” (DYFI) where people enter their observations from the earthquake and the USGS calculates what the intensity was for that person. The dots with yellow labels show what people actually felt in those different locations.
- To the left of the intensity map is a plot that shows the same intensity (both modeled and reported) data as displayed on the map. Note how the intensity gets smaller with distance from the earthquake.
- In the upper left corner are two maps showing the possibility of earthquake triggered landslides and earthquake induced liquefaction for these two earthquakes.
- In the center left of the map is a low-angle oblique view of the plate boundary as illustrated by IRIS in 2015 (now called Earthscope). I place a yellow star to designate the location of the earthquake as projected to the Earth’s surface (the epicenter).
- In the center right is a map that shows the aftershock pattern at the time that i prepared this report.
I include some inset figures.
- Here is the map with a month’s seismicity plotted.
- Summary of the 1964 Earthquake
- 2025.12.05 M 7.0 Yukon Territory/Alaska POSTER
- 2025.07.29 M 8.8 Kamchatka
- 2025.07.16 M 7.3 Alaska
- 2024.08.17 M 7.0 Kamchatka
- 2023.07.16 M 7.2 Alaska POSTER
- 2021.07.29 M 8.2 Alaska
- 2020.10.19 M 7.5 Alaska POSTER
- 2020.07.22 M 7.8 Alaska POSTER
- 2019.04.02 M 6.5 Aleutians
- 2019.03.26 M 5.2 Alaska
- 2018.12.20 M 7.4 Bering Kresla
- 2018.12.20 M 7.3 Bering Kresla UPDATE #1
- 2018.11.30 M 7.0 Alaska
- 2018.08.15 M 6.6 Aleutians
- 2018.08.12 M 6.4 North Alaska
- 2018.08.12 M 6.4 North Alaska UPDATE #1
- 2018.01.23 M 7.9 Gulf of Alaska
- 2018.01.23 M 7.9 Gulf of Alaska UPDATE #1
- 2018.01.23 M 7.9 Gulf of Alaska UPDATE #2
- 2017.07.17 M 7.7 Aleutians
- 2017.07.17 M 7.7 Aleutians UPDATE #1
- 2017.06.02 M 6.8 Aleutians
- 2017.05.08 M 6.2 Aleutians
- 2017.05.01 M 6.3 British Columbia
- 2017.03.29 M 6.6 Kamchatka
- 2017.03.02 M 5.5 Alaska
- 2016.09.05 M 6.3 Bering Kresla (west of Aleutians)
- 2016.04.13 M 5.7 & 6.4 Kamchatka
- 2016.04.02 M 6.2 Alaska Peninsula
- 2016.03.27 M 5.7 Aleutians
- 2016.03.12 M 6.3 Aleutians
- 2016.01.29 M 7.2 Kamchatka
- 2016.01.24 M 7.1 Alaska
- 2015.11.09 M 6.2 Aleutians
- 2015.11.02 M 5.9 Aleutians
- 2015.11.02 M 5.9 Aleutians (update)
- 2015.07.27 M 6.9 Aleutians
- 2015.05.29 M 6.7 Alaska Peninsula
- 2015.05.29 M 6.7 Alaska Peninsula (animations)
- 1964.03.27 M 9.2 Good Friday
Alaska | Kamchatka | Kurile
General Overview
Earthquake Reports
- Frisch, W., Meschede, M., Blakey, R., 2011. Plate Tectonics, Springer-Verlag, London, 213 pp.
- Hayes, G., 2018, Slab2 – A Comprehensive Subduction Zone Geometry Model: U.S. Geological Survey data release, https://doi.org/10.5066/F7PV6JNV.
- Holt, W. E., C. Kreemer, A. J. Haines, L. Estey, C. Meertens, G. Blewitt, and D. Lavallee (2005), Project helps constrain continental dynamics and seismic hazards, Eos Trans. AGU, 86(41), 383–387, , https://doi.org/10.1029/2005EO410002. /li>
- Jessee, M.A.N., Hamburger, M. W., Allstadt, K., Wald, D. J., Robeson, S. M., Tanyas, H., et al. (2018). A global empirical model for near-real-time assessment of seismically induced landslides. Journal of Geophysical Research: Earth Surface, 123, 1835–1859. https://doi.org/10.1029/2017JF004494
- Kreemer, C., J. Haines, W. Holt, G. Blewitt, and D. Lavallee (2000), On the determination of a global strain rate model, Geophys. J. Int., 52(10), 765–770.
- Kreemer, C., W. E. Holt, and A. J. Haines (2003), An integrated global model of present-day plate motions and plate boundary deformation, Geophys. J. Int., 154(1), 8–34, , https://doi.org/10.1046/j.1365-246X.2003.01917.x.
- Kreemer, C., G. Blewitt, E.C. Klein, 2014. A geodetic plate motion and Global Strain Rate Model in Geochemistry, Geophysics, Geosystems, v. 15, p. 3849-3889, https://doi.org/10.1002/2014GC005407.
- Meyer, B., Saltus, R., Chulliat, a., 2017. EMAG2: Earth Magnetic Anomaly Grid (2-arc-minute resolution) Version 3. National Centers for Environmental Information, NOAA. Model. https://doi.org/10.7289/V5H70CVX
- Müller, R.D., Sdrolias, M., Gaina, C. and Roest, W.R., 2008, Age spreading rates and spreading asymmetry of the world’s ocean crust in Geochemistry, Geophysics, Geosystems, 9, Q04006, https://doi.org/10.1029/2007GC001743
- Pagani,M. , J. Garcia-Pelaez, R. Gee, K. Johnson, V. Poggi, R. Styron, G. Weatherill, M. Simionato, D. Viganò, L. Danciu, D. Monelli (2018). Global Earthquake Model (GEM) Seismic Hazard Map (version 2018.1 – December 2018), DOI: 10.13117/GEM-GLOBAL-SEISMIC-HAZARD-MAP-2018.1
- Silva, V ., D Amo-Oduro, A Calderon, J Dabbeek, V Despotaki, L Martins, A Rao, M Simionato, D Viganò, C Yepes, A Acevedo, N Horspool, H Crowley, K Jaiswal, M Journeay, M Pittore, 2018. Global Earthquake Model (GEM) Seismic Risk Map (version 2018.1). https://doi.org/10.13117/GEM-GLOBAL-SEISMIC-RISK-MAP-2018.1
- Zhu, J., Baise, L. G., Thompson, E. M., 2017, An Updated Geospatial Liquefaction Model for Global Application, Bulletin of the Seismological Society of America, 107, p 1365-1385, https://doi.org/0.1785/0120160198
References:
Basic & General References
Specific References
Return to the Earthquake Reports page.
- Sorted by Magnitude
- Sorted by Year
- Sorted by Day of the Year
- Sorted By Region