I was asleep in bed, trying to catch up to prevent myself from getting ill, when there was a large earthquake in the Gulf of Alaska (GA), offshore of Kodiak, Alaska. When I wakened, I noticed a fb message from my friend Scott Willits notifying me of an M 8.2 earthquake in Alaska, posted at 2:20 AM local time. I immediately got up to check on this and was surprised that there was not a tsunami evacuation going on. I live in the small town of Manila (population ~700), on the North Spit (a sand spit west of Arcata and Eureka, CA). I live above 10 m in elevation and do not consider myself exposed to tsunami risks, local or distant (especially given that (1) the CSZ locked zone is mostly under land here and (2) that the part of the locked zone that is not under land is in shallow water; so our local tsunami will probably be much smaller than further north, like Crescent City or Brookings). I have been involved in tsunami education and outreach for over 15 years and prepared the first tsunami hazard map for northern CA (working with Dr. Lori Dengler and the Redwood Coast Tsunami Work Group). Needless to say, I am cogent and aware about the tsunami risk here in norcal.
https://earthquake.usgs.gov/earthquakes/eventpage/us2000cmy3/executive
SO. I soon discovered that the GA earthquake happened in the Pacific plate, far from the subduction zone and that the earthquake was a strike-slip earthquake. Both of these facts explained why the sheriff had not been at my door earlier this morning. In addition, the magnitude had been adjusted to M 7.9 (no longer a Great earthquake, just a Large earthquake; earthquake classes are defined here). However, there were some small tsunami waves observed (see below) as reported by the National Tsunami Warning Center (see social media below).
This earthquake appears to be located along a reactivated fracture zone in the GA. There have only been a couple earthquakes in this region in the past century, one an M 6.0 to the east (though this M 6.0 was a thrust earthquake). The Gulf of Alaska shear zone is even further to the east and has a more active historic fault history (a pair of earthquakes in 1987-1988). The magnetic anomalies (formed when the Earth’s magnetic polarity flips) reflect a ~north-south oriented spreading ridge (the anomalies are oriented north-south in the region of today’s earthquake). There is a right-lateral offset of these magnetic anomalies located near the M 7.9 epicenter. Interesting that this right-lateral strike-slip fault (?) is also located at the intersection of the Gulf of Alaska shear zone and the 1988 M 7.8 earthquake (probably just a coincidence?). However, the 1988 M 7.8 earthquake fault plane solution can be interpreted for both fault planes (it is probably on the GA shear zone, but I don’t think that we can really tell).
This is strange because the USGS fault plane is oriented east-west, leading us to interpret the fault plane solution (moment tensor or focal mechanism) as a left-lateral strike-slip earthquake. So, maybe this earthquake is a little more complicated than first presumed. The USGS fault model is constrained by seismic waves, so this is probably the correct fault (east-west).
I prepared an Earthquake Report for the 1964 Good Friday Earthquake here.
UPDATES Below is a list of all the reports associated with this earthquake sequence.
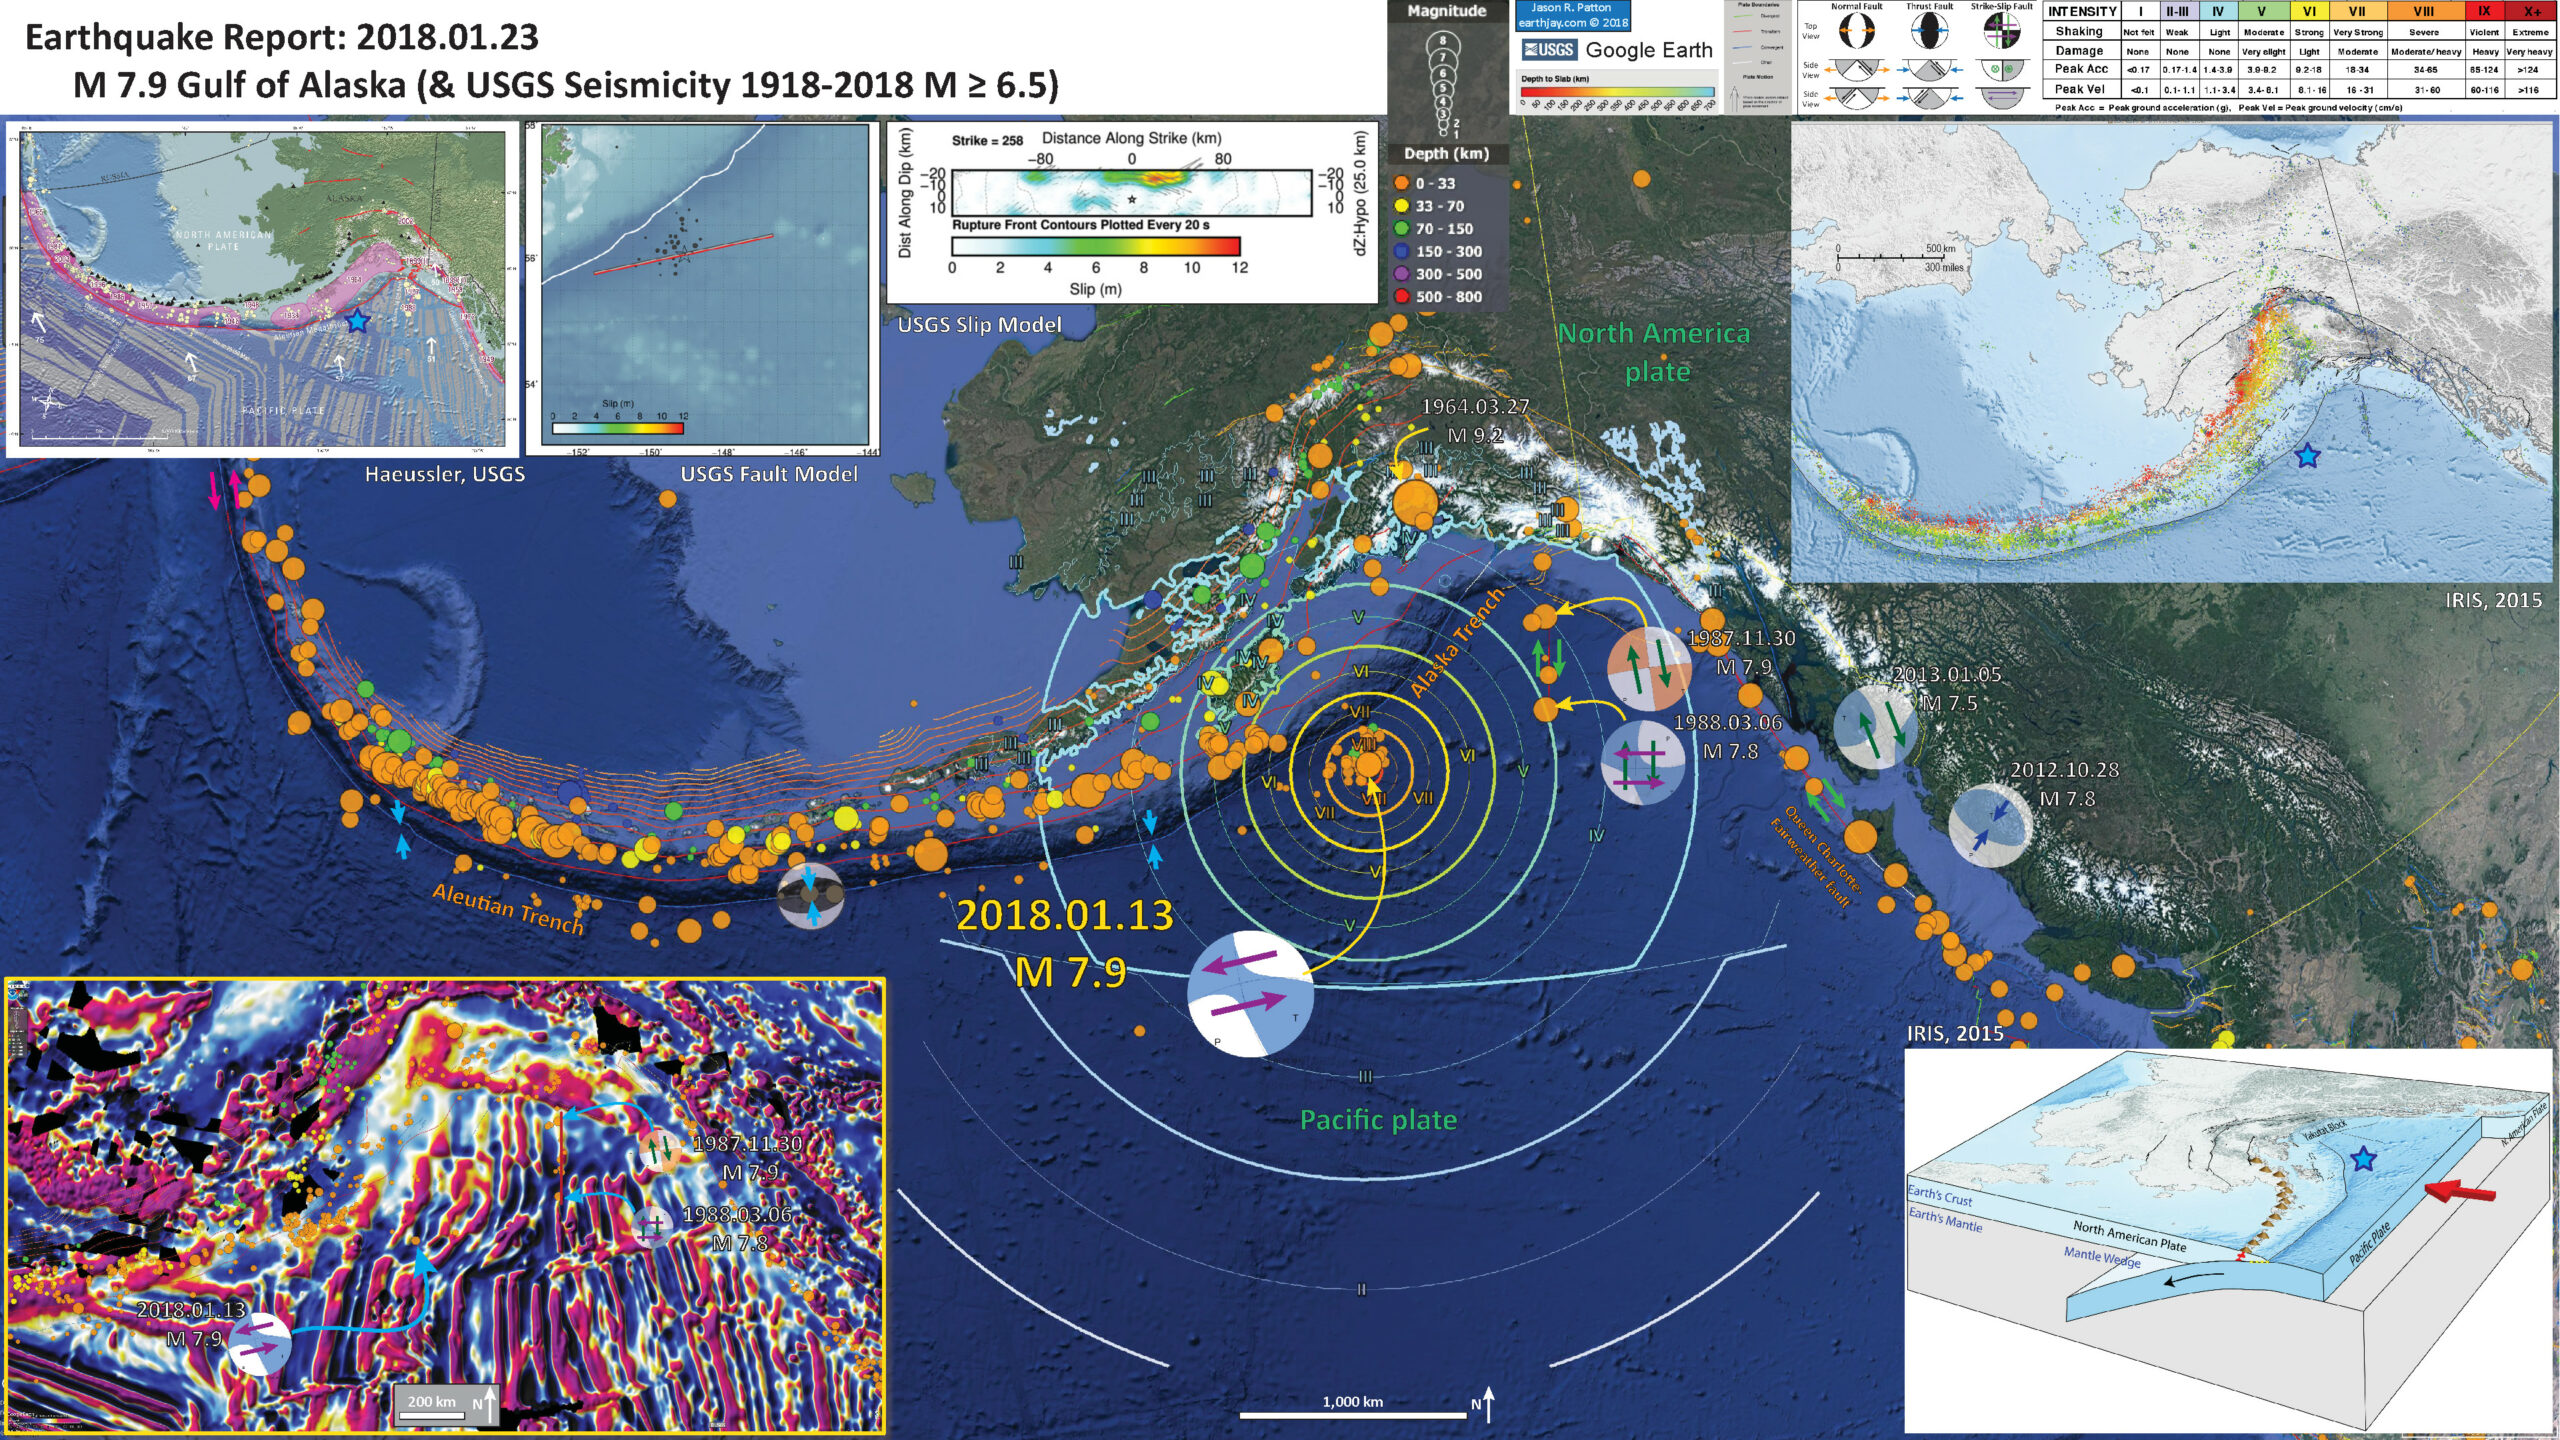
Below is my interpretive poster for this earthquake
I plot the seismicity from the past month, with color representing depth and diameter representing magnitude (see legend). I include earthquake epicenters from 1918-2018 with magnitudes M ≥ 6.5. More about the plate boundary can be found in that report.
I plot the USGS fault plane solutions (moment tensors in blue and focal mechanisms in orange) for the M 7.9 earthquake, in addition to some relevant historic earthquakes.
- I placed a moment tensor / focal mechanism legend on the poster. There is more material from the USGS web sites about moment tensors and focal mechanisms (the beach ball symbols). Both moment tensors and focal mechanisms are solutions to seismologic data that reveal two possible interpretations for fault orientation and sense of motion. One must use other information, like the regional tectonics, to interpret which of the two possibilities is more likely.
- I also include the shaking intensity contours on the map. These use the Modified Mercalli Intensity Scale (MMI; see the legend on the map). This is based upon a computer model estimate of ground motions, different from the “Did You Feel It?” estimate of ground motions that is actually based on real observations. The MMI is a qualitative measure of shaking intensity. More on the MMI scale can be found here and here. This is based upon a computer model estimate of ground motions, different from the “Did You Feel It?” estimate of ground motions that is actually based on real observations.
- I include the slab contours plotted (Hayes et al., 2012), which are contours that represent the depth to the subduction zone fault. These are mostly based upon seismicity. The depths of the earthquakes have considerable error and do not all occur along the subduction zone faults, so these slab contours are simply the best estimate for the location of the fault. Slab 2.0 is due out later this year!
-
I include some inset figures.
- In the upper left corner, I place a map created by Dr. Peter Haeussler, USGS, which shows the historic earthquakes along the Alaska and Aleutian subduction zones. I place the epicenter from today’s earthquake as a cyan star.
- To the right of this map, I include first the USGS map that shows their interpretation of where the fault is (the red line) and then I include the USGS fault slip model (color = slip in meters).
- In the upper right corner is a map from IRIS that shows seismicity with color representing depth.
- In the lower right corner, I include a low angle oblique view of the subduction zone, showing how the Pacific plate is subducting beneath the North America plate.
- In the lower left corner, I include a map that shows the magnetic anomalies in the GA region. I include USGS seismicity from 1918-2018 for earthquakes M ≥ 5.5.
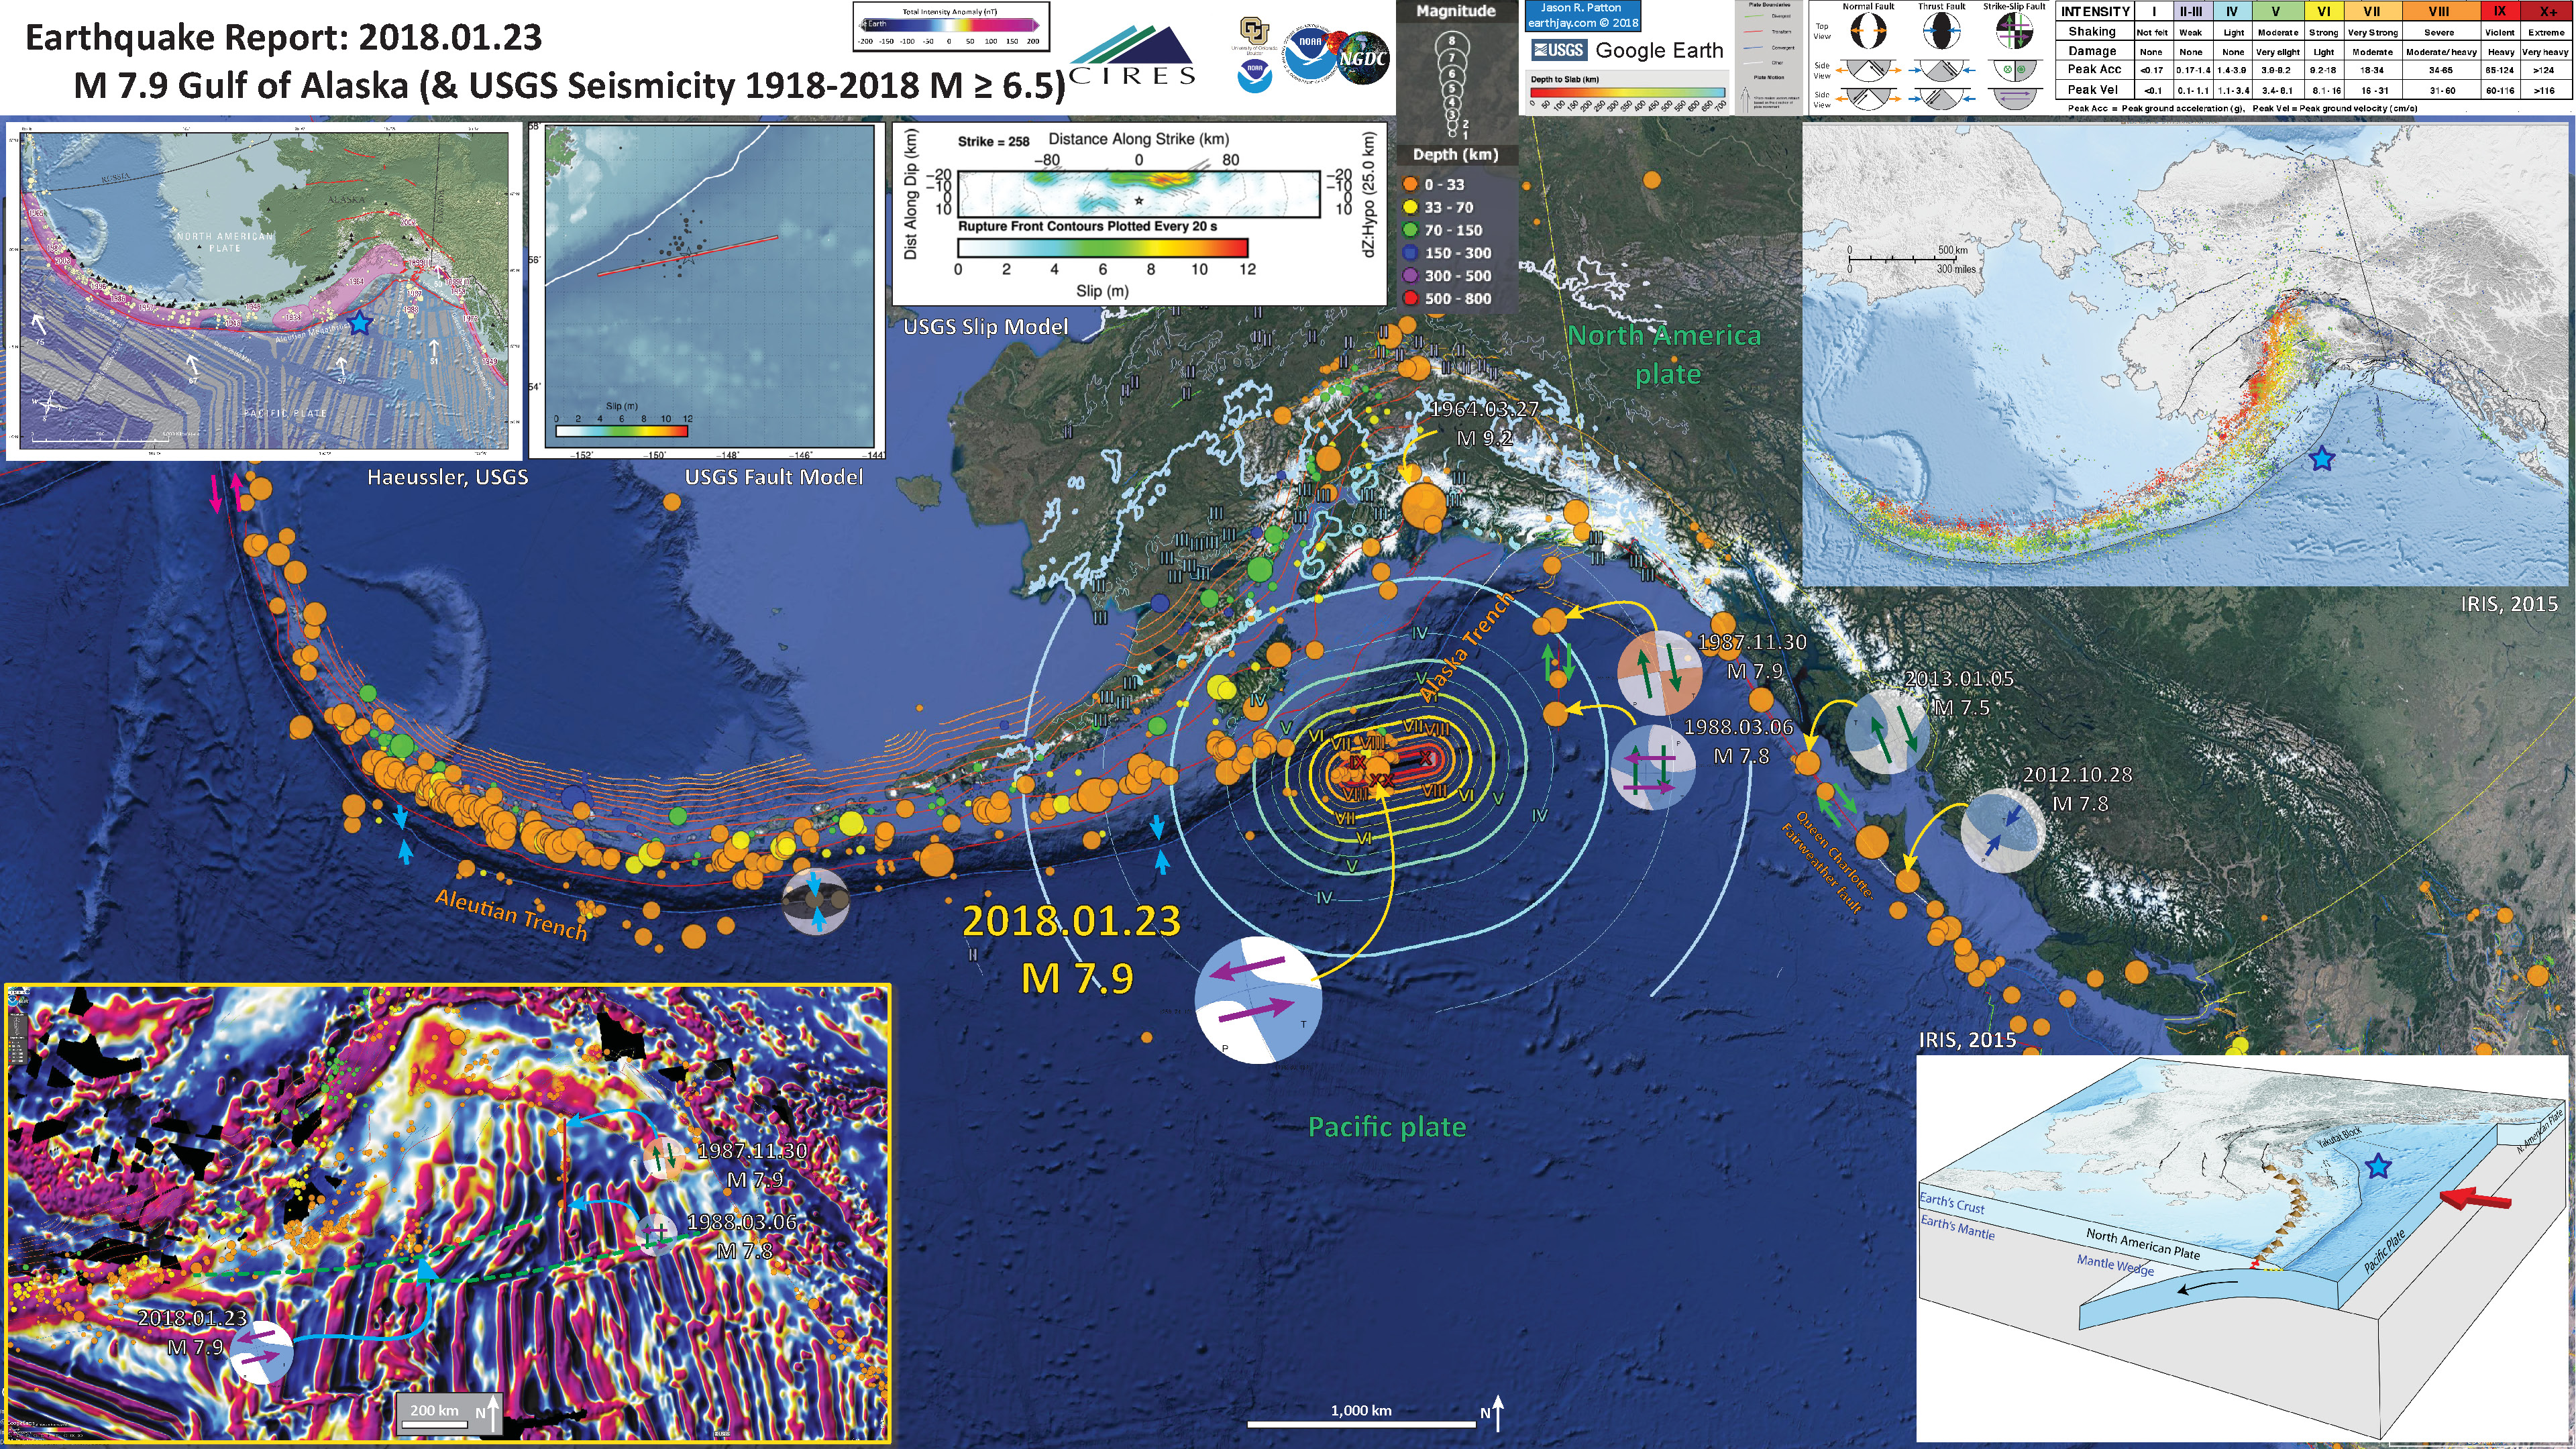
- UPDATE 12:45 my local time
- The USGS updated their MMI contours to reflect their fault model. Below is my updated poster. I also added green dashed lines for the fracture zones related to today’s M 7.9 earthquake (on the magnetic anomaly inset map).
- Here is the map showing magnetic anomalies in the region of the M 7.9 earthquake. These magnetic anomalies have been compiled in a global dataset here, more about their methods can be found on their page.
- Here is an educational video from IRIS about the tectonics in Alaska.
Some Relevant Discussion and Figures
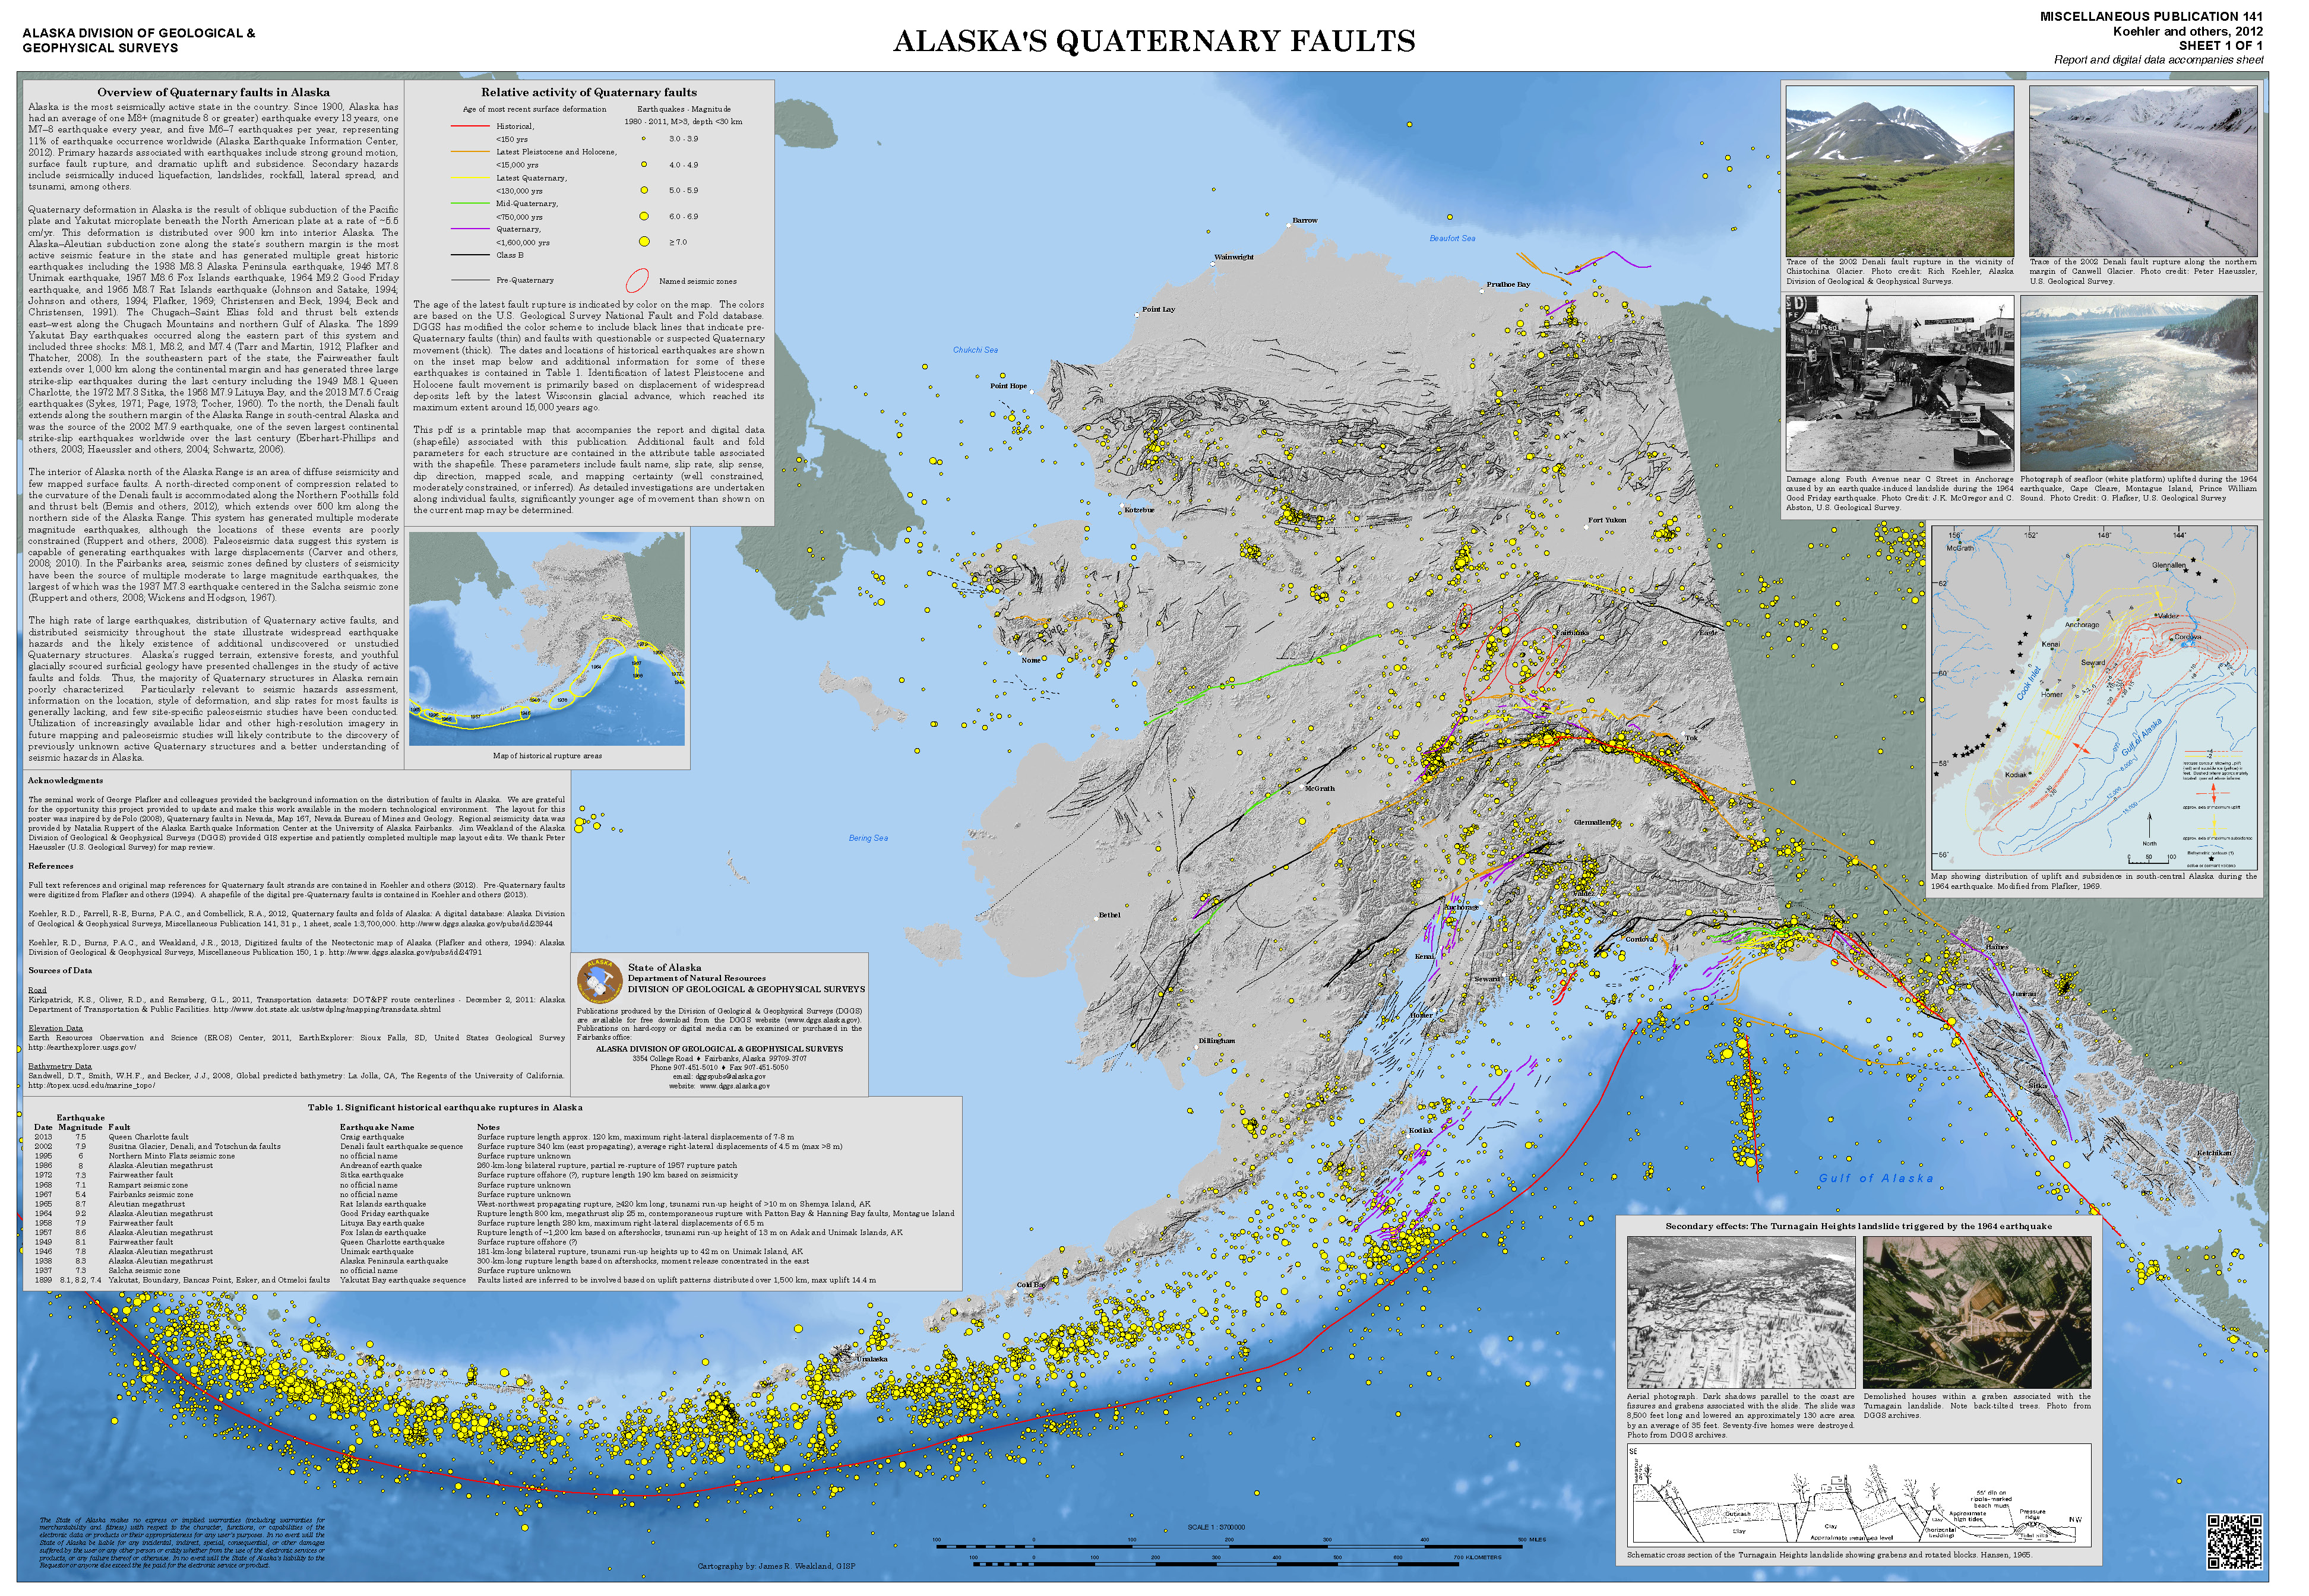
- Here is a map from Michael West at the Alaska Earthquake Center. This shows today’s earthquake in reference to the Quaternary faults and folds in Alaska: A digital database (Koehler et al., 2012). Dr. Rick Koehler is currently at the University of Nevada Reno and The Nevada Bureau of Mines and Geology. This is the map poster from Koehler et al. (2012). The link is to a 63 MB pdf file.
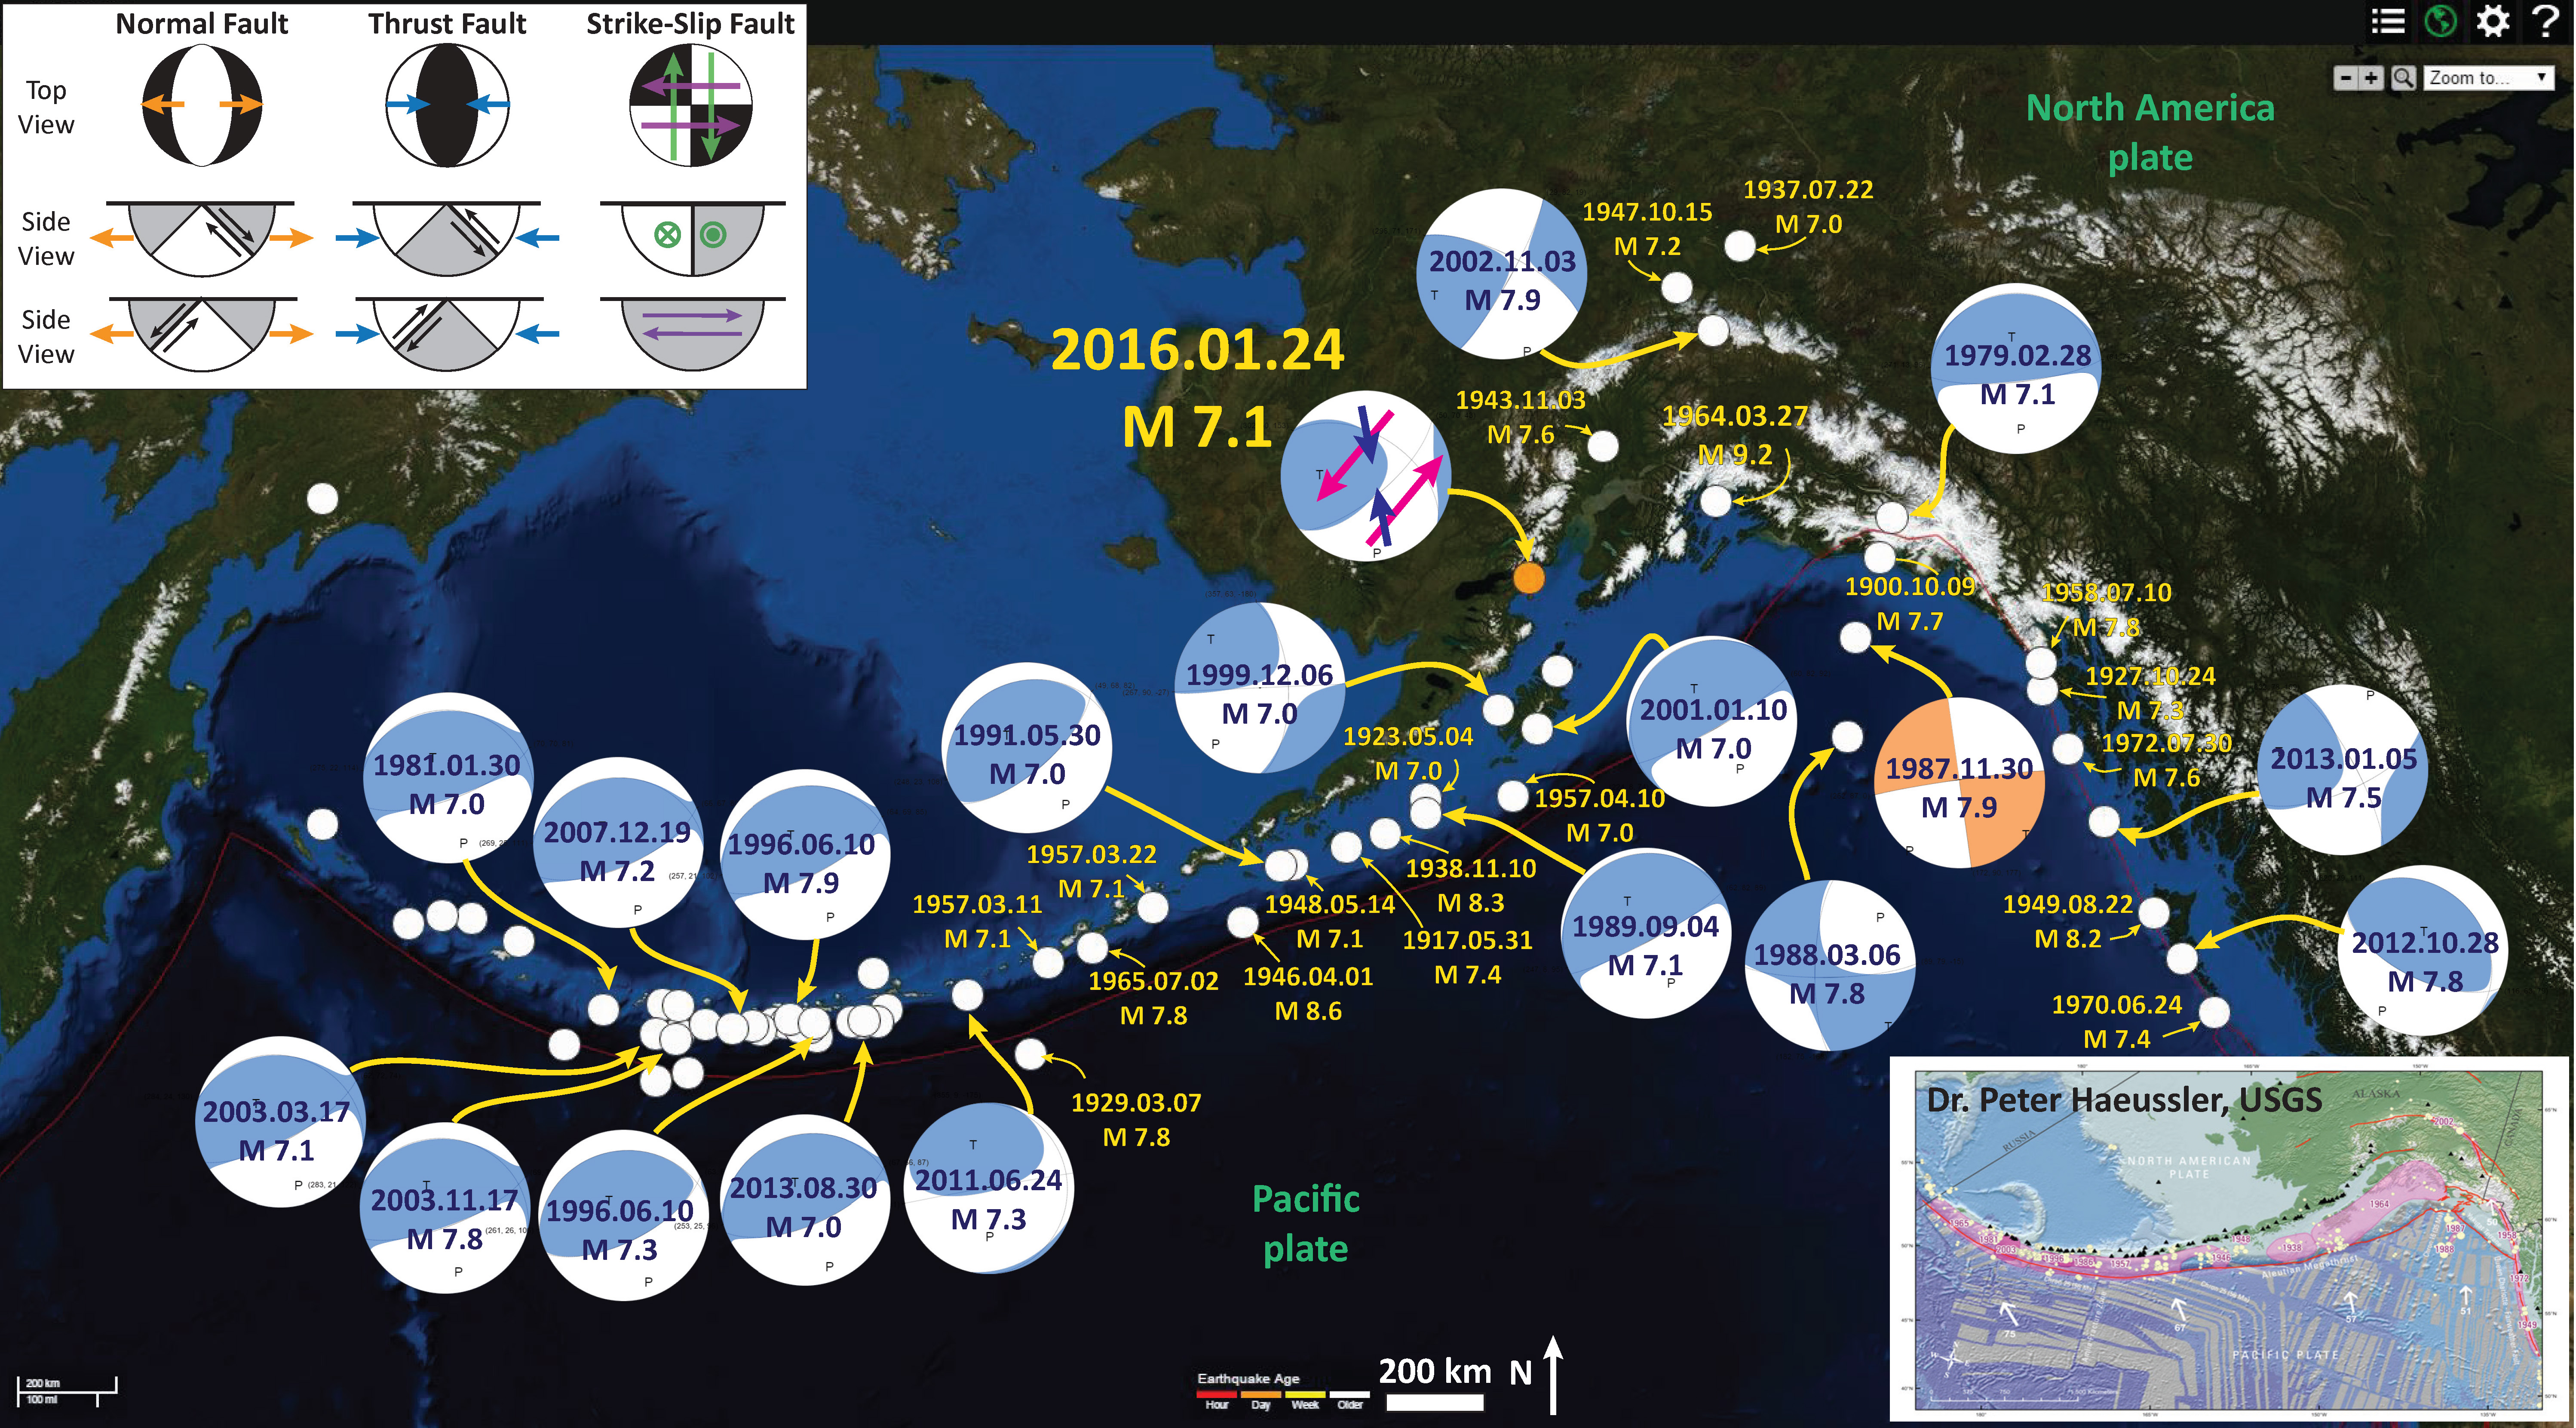
- Here is a map for the earthquakes of magnitude greater than or equal to M 7.0 between 1900 and 2016. This is the USGS query that I used to make this map. One may locate the USGS web pages for all the earthquakes on this map by following that link.
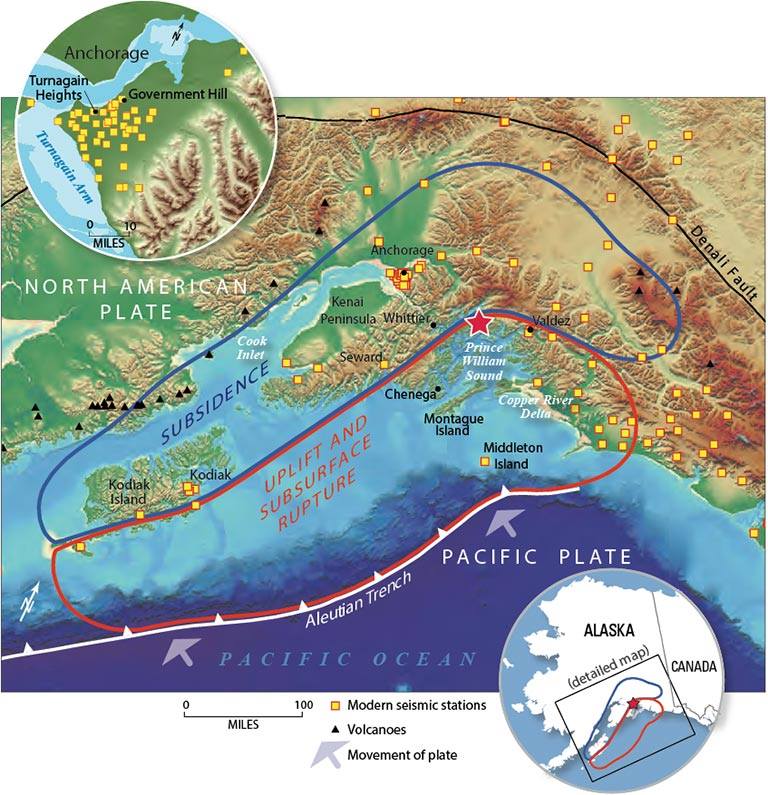
- This is a map from Haeussler et al. (2014). The region in red shows the area that subsided and the area in blue shows the region that uplifted during the earthquake. These regions were originally measured in the field by George Plafker and published in several documents, including this USGS Professional Paper (Plafker, 1969). I present more information about the 1964 Good Friday Earthquake here.
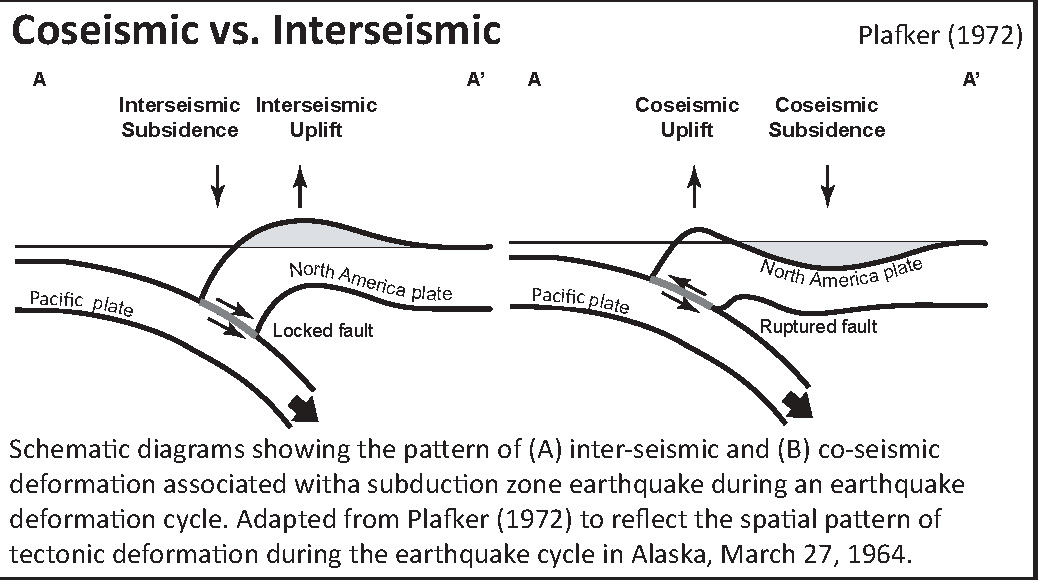
- Here is a cross section showing the differences of vertical deformation between the coseismic (during the earthquake) and interseismic (between earthquakes).
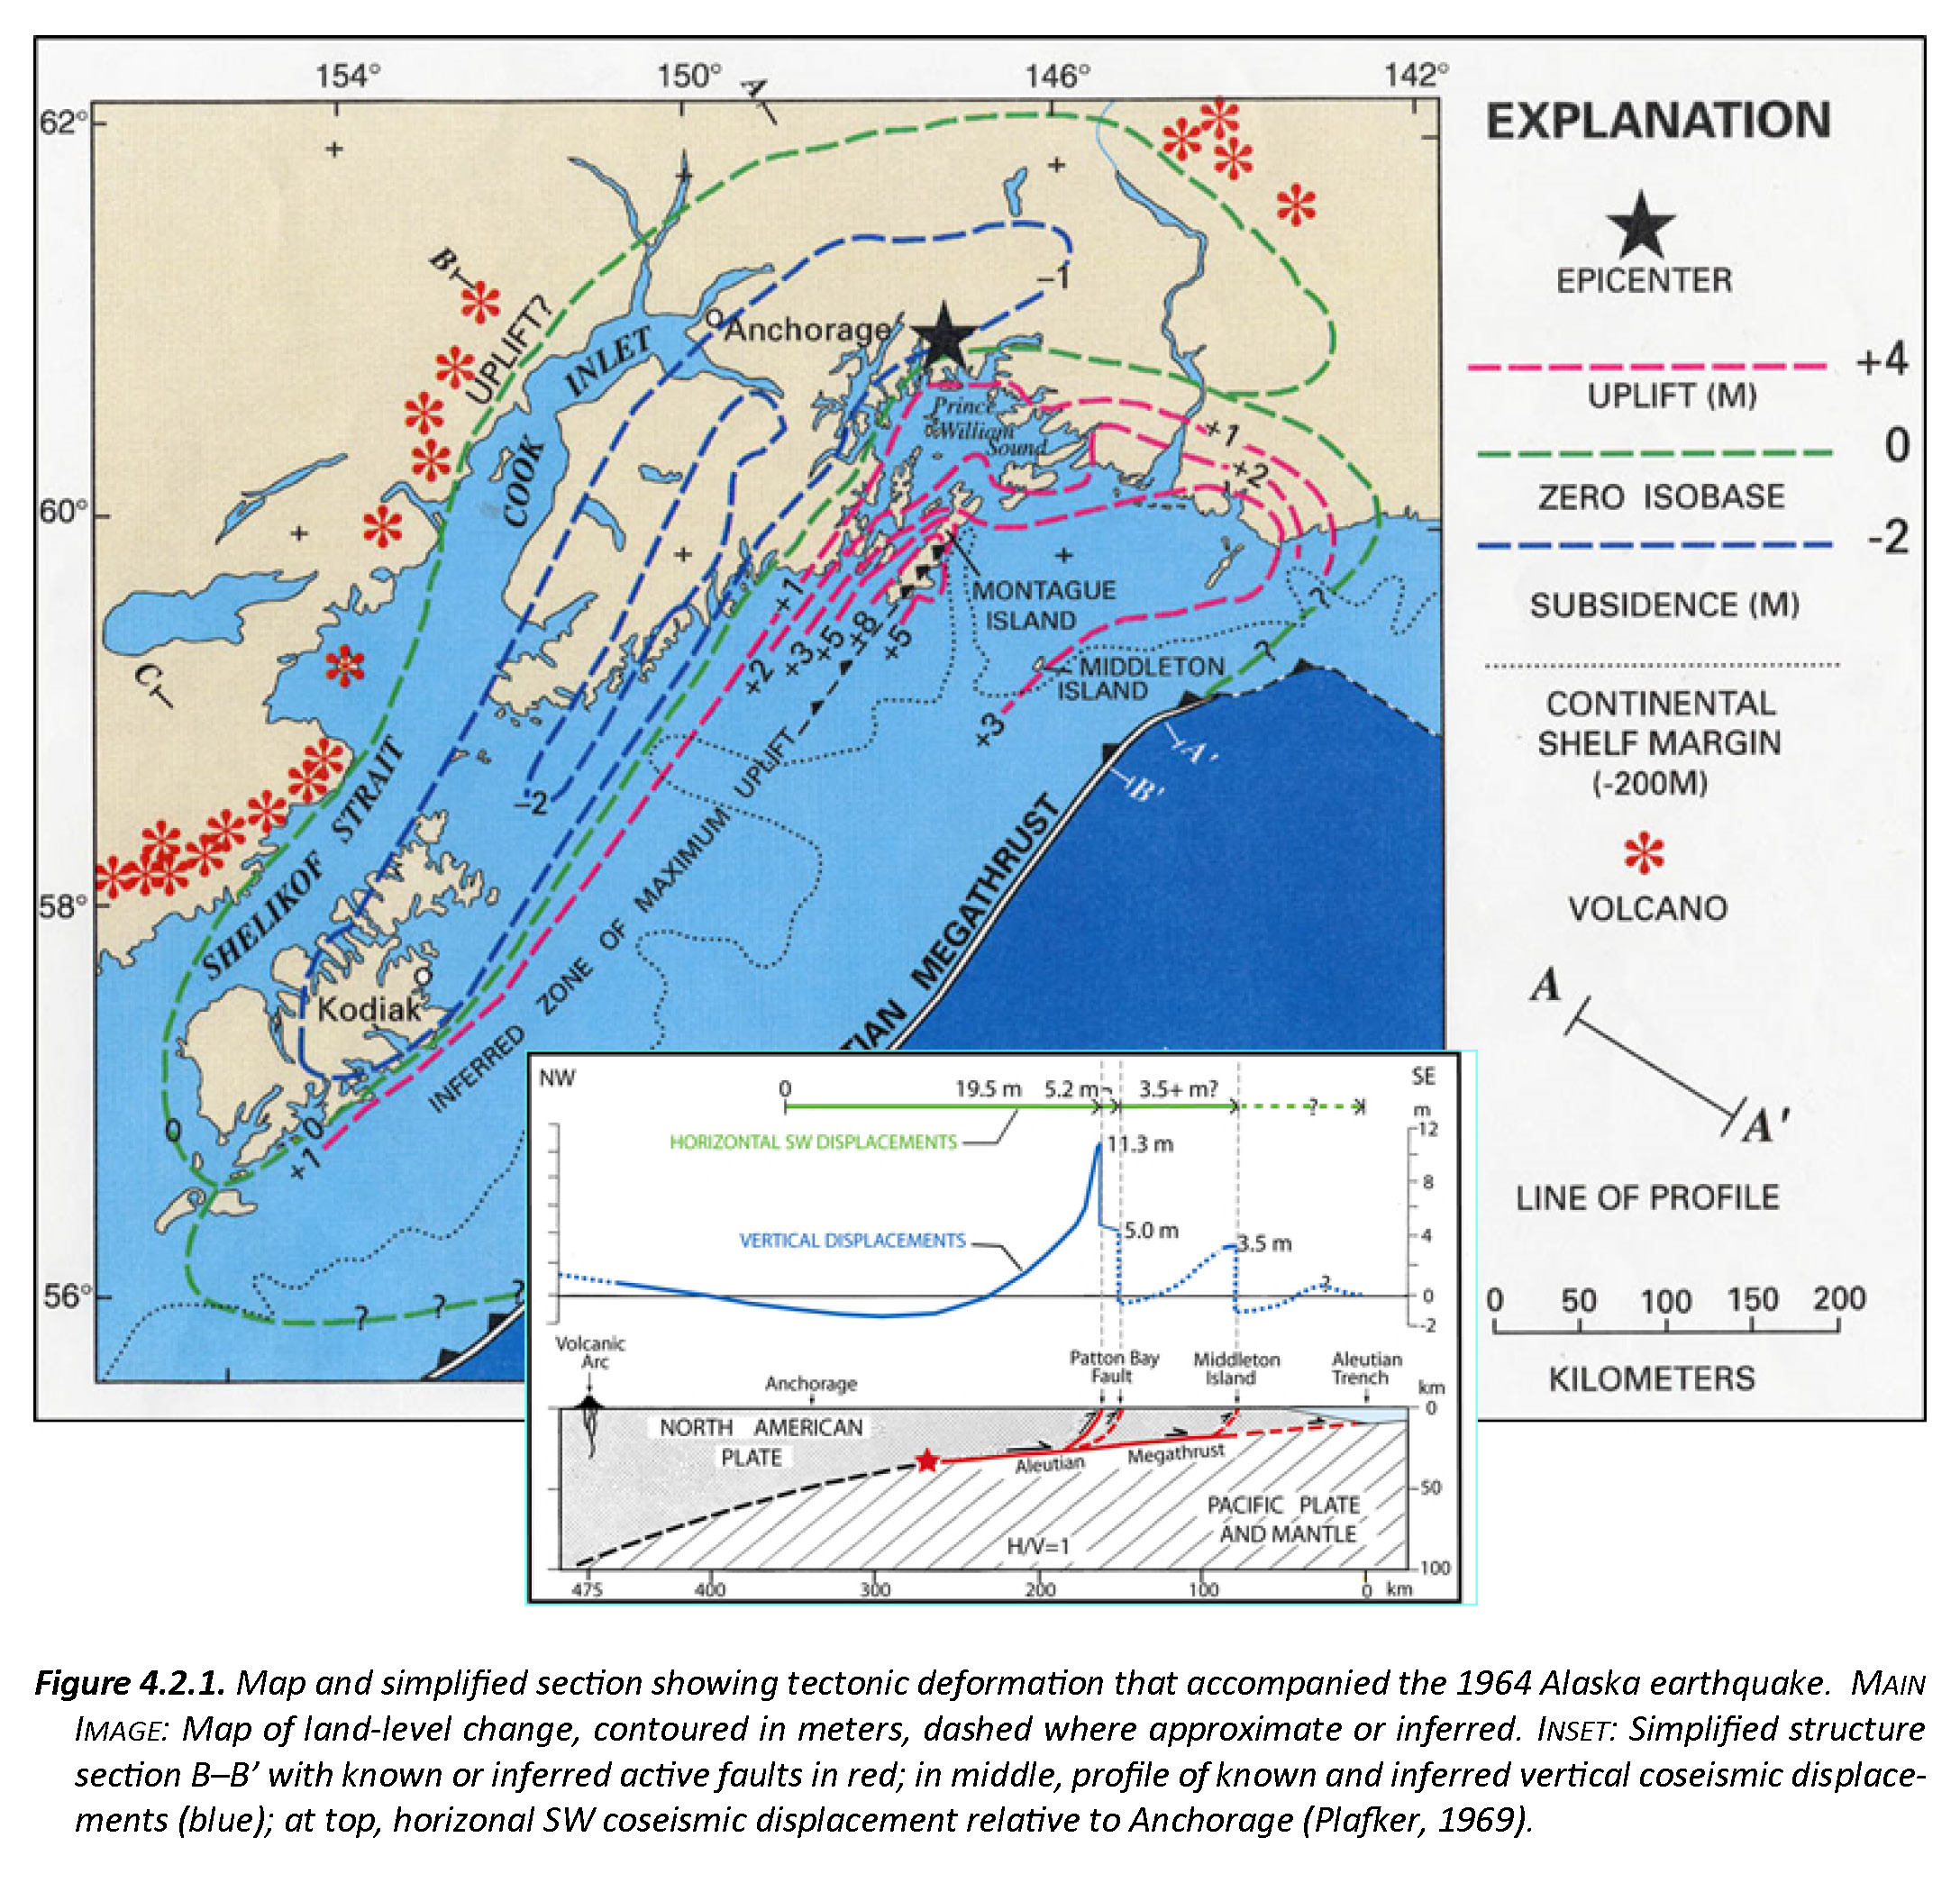
- Here is a figure recently published in the 5th International Conference of IGCP 588 by the Division of Geological and Geophysical Surveys, Dept. of Natural Resources, State of Alaska (State of Alaska, 2015). This is derived from a figure published originally by Plafker (1969). There is a cross section included that shows how the slip was distributed along upper plate faults (e.g. the Patton Bay and Middleton Island faults).
- Here is an animation that shows earthquakes of magnitude > 6.5 for the period from 1900-2016. Above is a map showing the region and below is the animation. This is the URL for the USGS query that I used to make this animation in Google Earth.
- Here is a link to the file for the embedded video below (5 MB mp4)
- There are three types of earthquakes, strike-slip, compressional (reverse or thrust, depending upon the dip of the fault), and extensional (normal). Here is are some animations of these three types of earthquake faults. Many of the earthquakes people are familiar with in the Mendocino triple junction region are either compressional or strike slip. The following three animations are from IRIS.
- Strike Slip:
- Compressional:
- Extensional:
- This figure shows what a transform plate boundary fault is. Looking down from outer space, the crust on either side of the fault moves side-by-side. When one is standing on the ground, on one side of the fault, looking across the fault as it moves… If the crust on the other side of the fault moves to the right, the fault is a “right lateral” strike slip fault. The Mendocino and San Andreas faults are right-lateral (dextral) strike-slip faults. I believe this is from Pearson Higher Ed.
- For more on the graphical representation of moment tensors and focal mechnisms, check this IRIS video out:
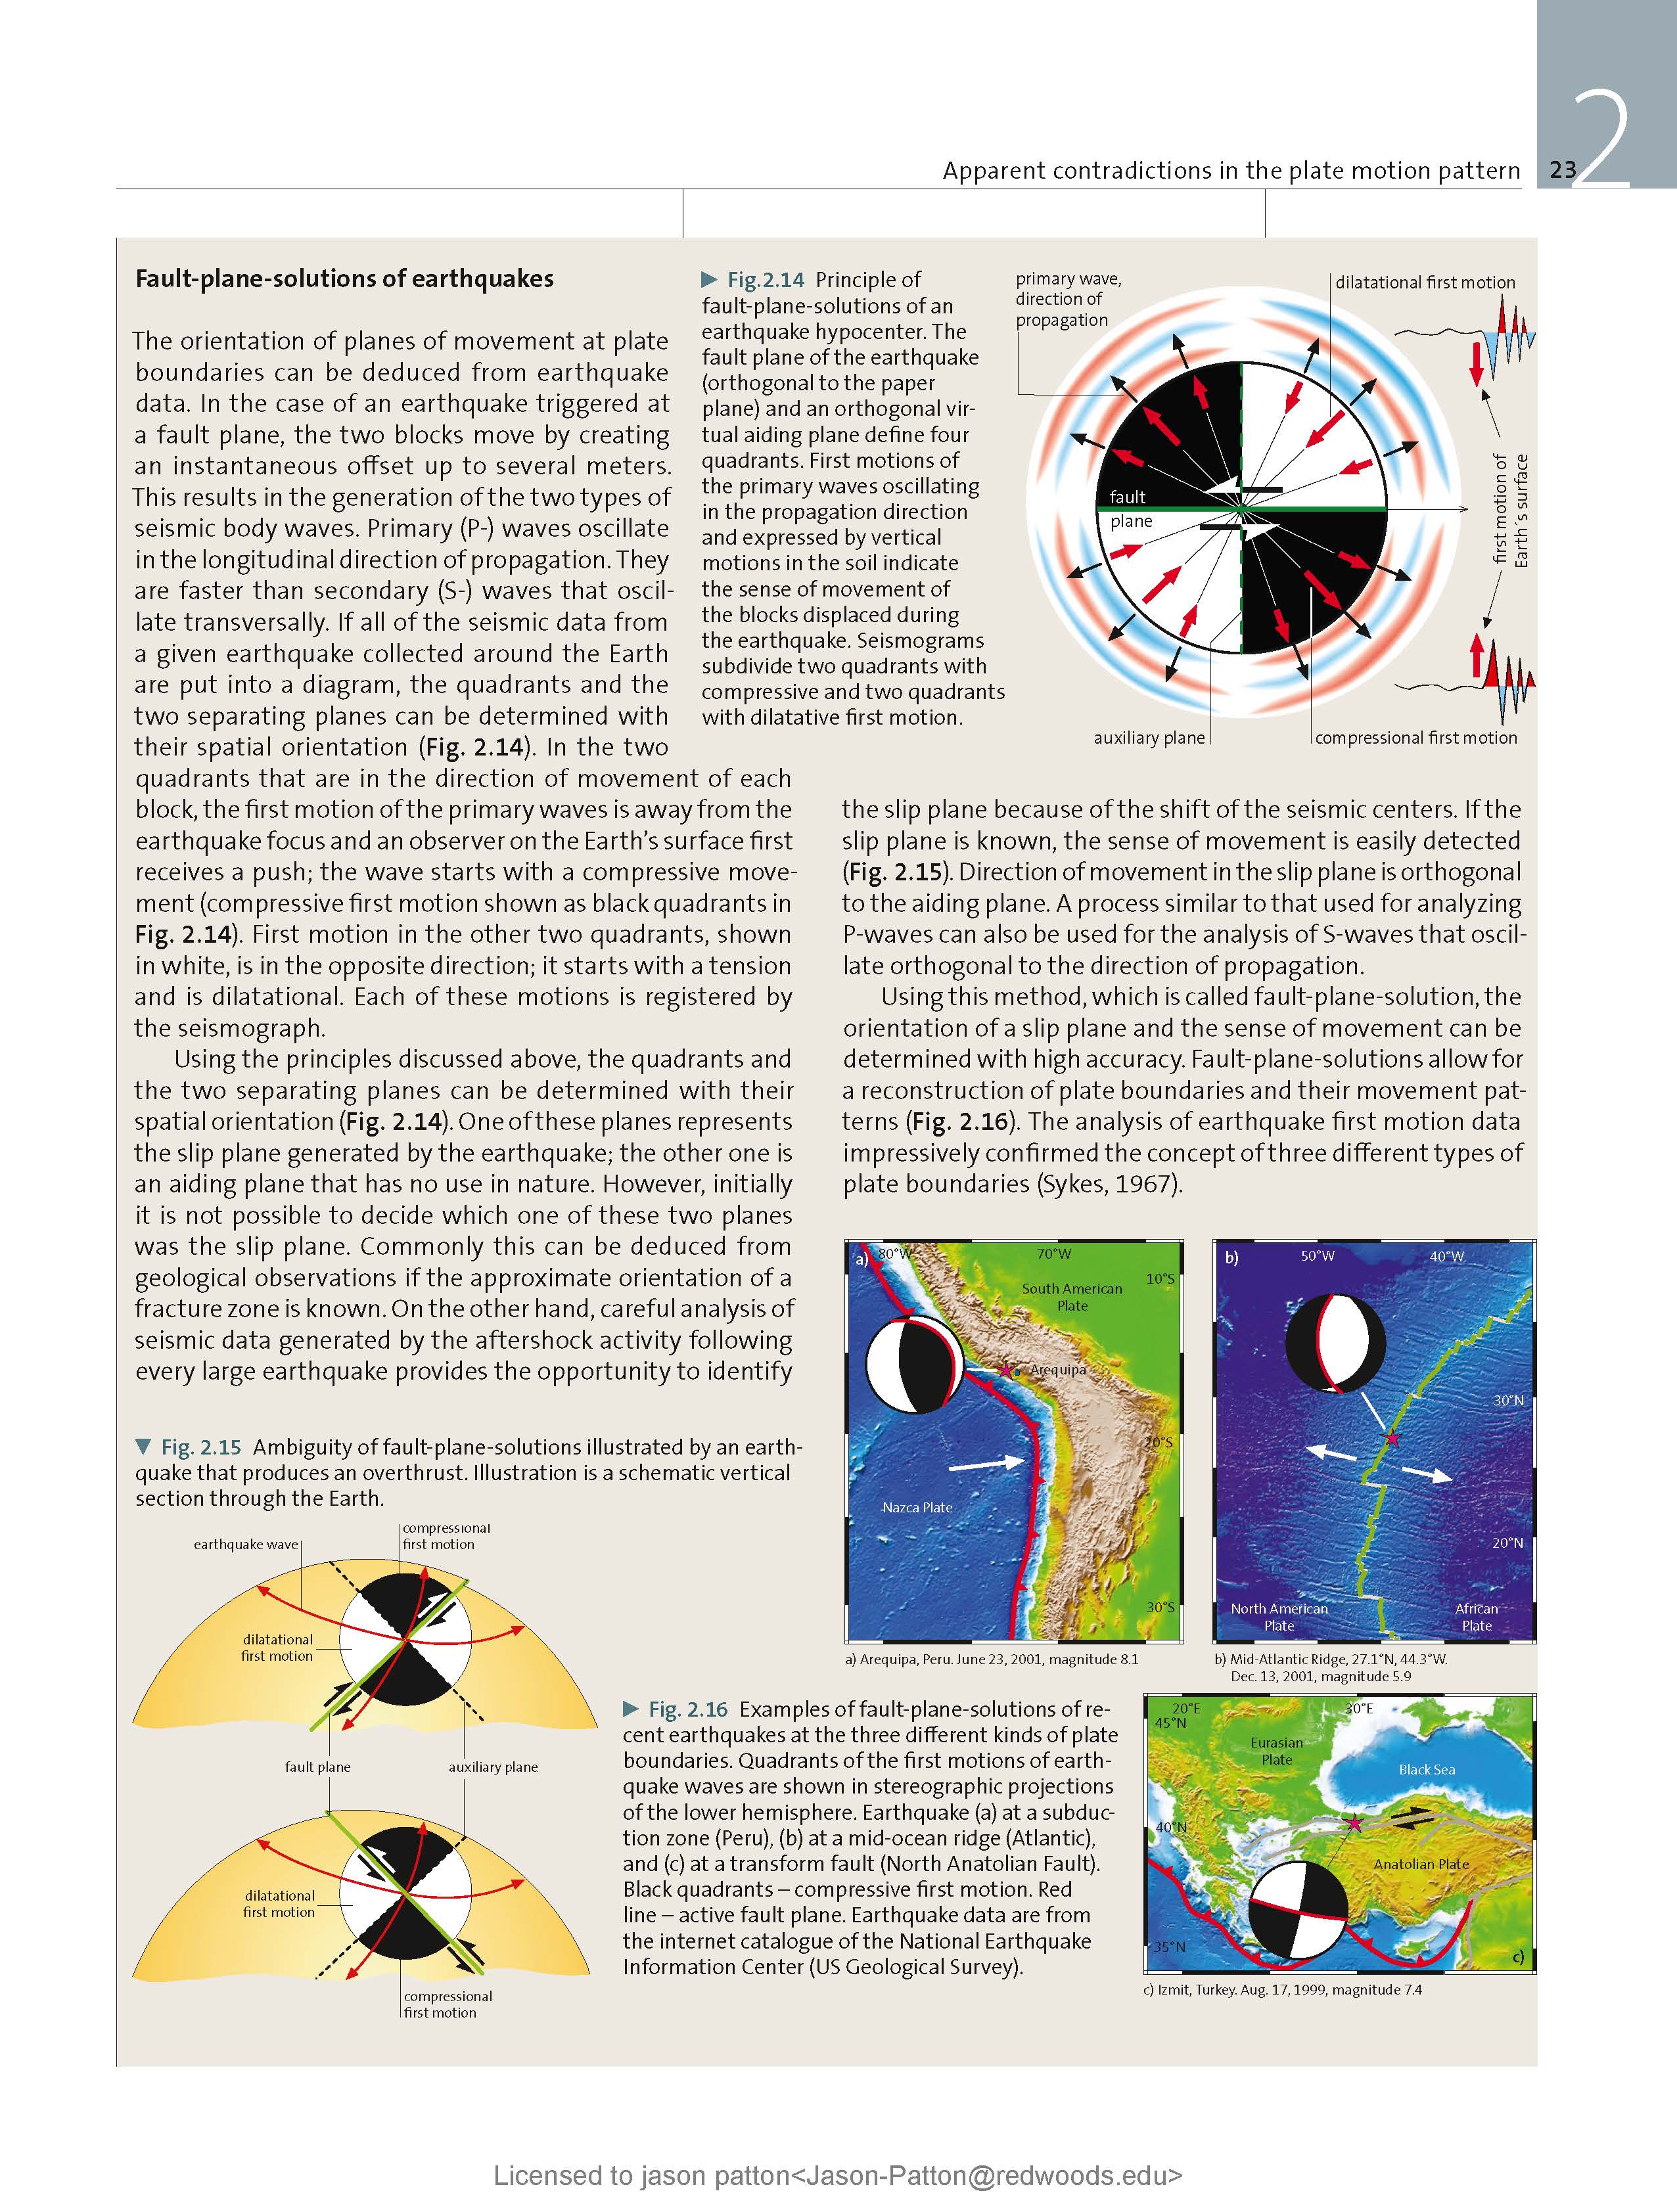
- Here is a fantastic infographic from Frisch et al. (2011). This figure shows some examples of earthquakes in different plate tectonic settings, and what their fault plane solutions are. There is a cross section showing these focal mechanisms for a thrust or reverse earthquake. The upper right corner includes my favorite figure of all time. This shows the first motion (up or down) for each of the four quadrants. This figure also shows how the amplitude of the seismic waves are greatest (generally) in the middle of the quadrant and decrease to zero at the nodal planes (the boundary of each quadrant).
Social Media
[Top Story] Magnitude 7.9 Earthquake Gulf of Alaska. https://t.co/SbsoXcGHU9 pic.twitter.com/VkTNhiwx7l
— USGS (@USGS) January 23, 2018
M=7.9 Alaska earthquake strikes off the coast of Kodiak Island, triggering a tsunami and questions | https://t.co/6d516uWWTP https://t.co/n3JIhSFClU
— Ross S Stein (@rstein357) January 23, 2018
Glad this earthquake was on a strike-slip fault, about 90 km from the subduction trench where the tsunamigenic megathrust earthquakes occur. Oceanic strike-slip faults are shallow (~50km) so this must have ruptured along a very long fault of ~200 km or multiple faults segments. pic.twitter.com/q8iOKGxGW9
— Kasey Aderhold (@kaseyaderhold) January 23, 2018
.Map of sea-floor geophysical features in Gulf of Alaska from a paper in 1973 shows a number of east-west trending fracture zones in Pacific plate. Possible that today's M7.9 earthquake occurred along one of these – reasonably consistent with faulting mechanism from seismic data pic.twitter.com/jV8t0bhUkw
— Stephen Hicks (@seismo_steve) January 23, 2018
Excellent story from @nytimes of last night’s earthquake offshore Alaska and small, resultant tsunami. https://t.co/DoQcPGr1XZ
— The TsunamiZone (@thetsunamizone) January 23, 2018
This mornings Alaska M7.9 earthquake felt in Costa Rica with my @raspishake. pic.twitter.com/z0qUOMgIJV
— Benjamin Martin (@ben7230) January 23, 2018
It took nearly 7 hours for our Middle School M7.9 #Alaska seismogram to scroll enough to show full amplitude of these large #Earthquake traces! Another #STEM #TeachableMoment thanks to funding from @IRIS_EPO & @IRIS_quakes It's why #WhyEarthScienceIsTheBestSubject pic.twitter.com/67AnOT6mmr
— Dave Curry (@CarlSaganRox) January 23, 2018
Mw=8.0, GULF OF ALASKA (Depth: 17 km), 2018/01/23 09:31:40 UTC – Full details here: https://t.co/lJnOdzjhs5 pic.twitter.com/S9p9wHXrZo
— Earthquakes (@geoscope_ipgp) January 23, 2018
Tue Jan 23 11:18:49 UTC 2018 event picture pic.twitter.com/ZpFFEWbkvf
— NWS Tsunami Alerts (@NWS_NTWC) January 23, 2018
Possible strike-slip FirstMoMech: Mw7.6 #earthquake Gulf of Alaska https://t.co/kCIw9Vypa6 @ALomaxNet pic.twitter.com/dllZXOwBj8
— Anthony Lomax 🌍 (@ALomaxNet) January 23, 2018
GFZ Mww gives M7.8 and seems to confirm strike-slip faulting https://t.co/hN2Fju5BCW pic.twitter.com/RsOpLVa5Lj
— Anthony Lomax 🌍 (@ALomaxNet) January 23, 2018
M=7.9 Alaska earthquake strikes off the coast of Kodiak Island, triggering a tsunami and questions | @temblor | https://t.co/LumawcrkQL #AlaskaEarthquake pic.twitter.com/BTZ3bpw7Cl
— IRIS Earthquake Sci (@IRIS_EPO) January 23, 2018
Tsunami waves from M7.9 outer-rise earthquake detected at Kodiak tide station pic.twitter.com/CmjuLqGQ6A
— Rob Witter (@WitterBanter) January 23, 2018
Current location estimate of magnitude~8 offshore Alaska earthquake 10 mins ago seems to indicate that it occurred within the oceanic Pacific plate before it subducts at the trench. Possibly a normal faulting event? Significant tsunami risk. pic.twitter.com/G5BL1HwLi3
— Stephen Hicks (@seismo_steve) January 23, 2018
Powerful earthquake jolts Alaska awake with middle-of-the-night tsunami warning, which was canceled after a few intense hours. https://t.co/1EOVhSUa40
— AP West Region (@APWestRegion) January 23, 2018
Want to explore the seismicity of #Alaska? View past and current #earthquakes using our free Interactive Earthquake Browser. You can even look at earthquake locations in 3D! https://t.co/s1XIzHPEQY #AlaskaQuake pic.twitter.com/rjHiywdcKi
— IRIS Earthquake Sci (@IRIS_EPO) January 23, 2018
.Yup, a preliminary movie of the #Alaska #earthquake rupture ("back projection") indicates that the rupture propagates to the east and west of its starting point (epicentre). Agrees with faulting mechanism and plate fabric (fracture zones). Via @IRIS_EPO @alexanderhutko pic.twitter.com/TmDdzwHb36
— Stephen Hicks (@seismo_steve) January 23, 2018
Alaska #tsunami just passed @Ocean_Networks bottom pressure station at Clayoquot Slope: 3-cm sea level drop; not big but there.https://t.co/b27CdUo3as pic.twitter.com/T6A8FT2SdT
— Martin Scherwath (@mscherwath) January 23, 2018
#PointArena tide gauge @ Arena Cove showing a small #tsunami this morning. This small tsunami is working its way down the coast.#cawx #earthquake #alaska pic.twitter.com/bizkraSBxs
— NWS Bay Area (@NWSBayArea) January 23, 2018
Updating some earlier tide-gauge screenshots by @theearthquakes and @TTremblingEarth: can see tsunami arriving on Kodiak Island as up to 20cm fluctuations superimposed on rising tide. https://t.co/k8110ewlcV pic.twitter.com/mJHaszKGE9
— Chris Rowan (@Allochthonous) January 23, 2018
Check out the surface waves from the 8.2 (!!) in Alaska going through Lincoln Nebraska right now live (9:50UTC) https://t.co/LSGCcIbF1j
— Austin Elliott (@TTremblingEarth) January 23, 2018
Regarding aftershocks: The largest is ~M5 as of 2 hours into the sequence. It looks like the aftershocks extend North-South, suggesting the fault ruptured along along a North-South oriented fault.
— AK Earthquake Center (@AKearthquake) January 23, 2018
What Are 4 Levels of Tsunami Messaging? Warning > Advisory > Watch > Info Statement. Find Out What they Mean. Learn What a Tsunami Is and Be Prepared Before any Potential #tsunami Strikes. @NWS_NTWC Click here https://t.co/F6Z7MhIvRv… pic.twitter.com/TaUycap87b
— Cal OES (@Cal_OES) January 23, 2018
Watch the earthquake waves from the M7.9 Alaska earthquake cross the USArray (https://t.co/lfcuOauaVB)! #AlaskaEarthquake #earthquake https://t.co/SoZMmJHvCU pic.twitter.com/jrcGL5xvg9
— IRIS Earthquake Sci (@IRIS_EPO) January 23, 2018
Watch the earthquake waves from the M7.9 Alaska earthquake cross the USArray (https://t.co/lfcuOauaVB)! #AlaskaEarthquake #earthquake https://t.co/SoZMmJHvCU pic.twitter.com/jrcGL5xvg9
— IRIS Earthquake Sci (@IRIS_EPO) January 23, 2018
IRIS Special Event page for the M7.9 #AlaskaEarthquake https://t.co/7XDDdb0IBb (Figure from the @USGS) pic.twitter.com/NJKaN3EM7H
— IRIS Earthquake Sci (@IRIS_EPO) January 23, 2018
Many seismic stations in Alaska operate multiple types of instruments to fully record the seismic wavefield. Here are records from the @IRIS_EPO Global Seismographic Network station on Kodiak Island, 280 km from the source. pic.twitter.com/JJAlhUKYSe
— Andy Frassetto (@drrocks1982) January 23, 2018
This morning's 7.9 earthquake occurred along a strike-slip fault. The horizontal movement of the two plates in a strike-slip fault, typically limits the threat of tsunami's pic.twitter.com/o7kgwNHqxS
— Greg Diamond (@gdimeweather) January 23, 2018
If you missed my posts from earlier: #Kusatsu in Japan erupts, killing one – https://t.co/guwE7VM9DL and a M7.9 earthquakes strikes off Alaska, but luckily doesn’t generate a tsunami: https://t.co/ff8dpsGHsh
— Erik Klemetti (@eruptionsblog) January 23, 2018
- Summary of the 1964 Earthquake
- 2018.01.23 M 7.9 Gulf of Alaska
- 2018.01.23 M 7.9 Gulf of Alaska UPDATE #1
- 2018.01.23 M 7.9 Gulf of Alaska UPDATE #2
- 2017.07.17 M 7.7 Aleutians
- 2017.07.17 M 7.7 Aleutians UPDATE #1
- 2017.06.02 M 6.8 Aleutians
- 2017.05.08 M 6.2 Aleutians
- 2017.05.01 M 6.3 British Columbia
- 2017.03.29 M 6.6 Kamchatka
- 2017.03.02 M 5.5 Alaska
- 2016.09.05 M 6.3 Bering Kresla (west of Aleutians)
- 2016.04.13 M 5.7 & 6.4 Kamchatka
- 2016.04.02 M 6.2 Alaska Peninsula
- 2016.03.27 M 5.7 Aleutians
- 2016.03.12 M 6.3 Aleutians
- 2016.01.29 M 7.2 Kamchatka
- 2016.01.24 M 7.1 Alaska
- 2015.11.09 M 6.2 Aleutians
- 2015.11.02 M 5.9 Aleutians
- 2015.11.02 M 5.9 Aleutians (update)
- 2015.07.27 M 6.9 Aleutians
- 2015.05.29 M 6.7 Alaska Peninsula
- 2015.05.29 M 6.7 Alaska Peninsula (animations)
- 1964.03.27 M 9.2 Good Friday
Alaska | Kamchatka | Kurile
General Overview
Earthquake Reports
- Atwater, B.F., Yamaguchi, D.K., Bondevik, S., Barnhardt, W.A., Amidon, L.J., Benson, B.E., Skjerdal, G., Shulene, J.A., and Nanalyama ,F., 2001. Rapid resetting of an estuarine recorder of the 1964 Alaska earthquake in Geology, v. 113, no. 9, p. 1193-1204.
- Benz, H.M., Tarr, A.C., Hayes, G.P., Villaseñor, Antonio, Hayes, G.P., Furlong, K.P., Dart, R.L., and Rhea, Susan, 2011. Seismicity of the Earth 1900–2010 Aleutian arc and vicinity: U.S. Geological Survey Open-File Report 2010–1083-B, scale 1:5,000,000.
- Frisch, W., Meschede, M., Blakey, R., 2011. Plate Tectonics, Springer-Verlag, London, 213 pp.
- Hayes, G.P., Wald, D.J., and Johnson, R.L., 2012. Slab1.0: A three-dimensional model of global subduction zone geometries in, J. Geophys. Res., 117, B01302, doi:10.1029/2011JB008524
- Haeussler, P., Leith, W., Wald, D., Filson, J., Wolfe, C., and Applegate, D., 2014. Geophysical Advances Triggered by the 1964 Great Alaska Earthquake in EOS, Transactions, American Geophysical Union, v. 95, no. 17, p. 141-142.
- Koehler, R.D., Farrell, Rebecca-Ellen, Burns, P.A.C., and Combellick, R.A., 2012. Quaternary faults and folds in Alaska: A digital database, in Koehler, R.D., Quaternary Faults and Folds (QFF): Alaska Division of Geological & Geophysical Surveys Miscellaneous Publication 141, 31 p., 1 sheet, scale 1:3,700,000. doi:10.14509/23944
- Plafker, G., 1969. Tectonics of the March 27, 1964 Alaska earthquake: U.S. Geological Survey Professional Paper 543–I, 74 p., 2 sheets, scales 1:2,000,000 and 1:500,000, http://pubs.usgs.gov/pp/0543i/.
- Plafker, G., 1972. Alaskan earthquake of 1964 and Chilean earthquake of 1960: Implications for arc tectonics in Journal of Geophysical Research, v. 77, p. 901-925.
- Saltus, R.W., and Barnett, A., 2000. Eastern Aleutian Volcanic Arc Digital Model – Version 1.0: U.S. Geological Survey Open-File Report 00
