Well, well, well. What have we here. We have some earthquakes that are related to each other and some earthquakes that are not.
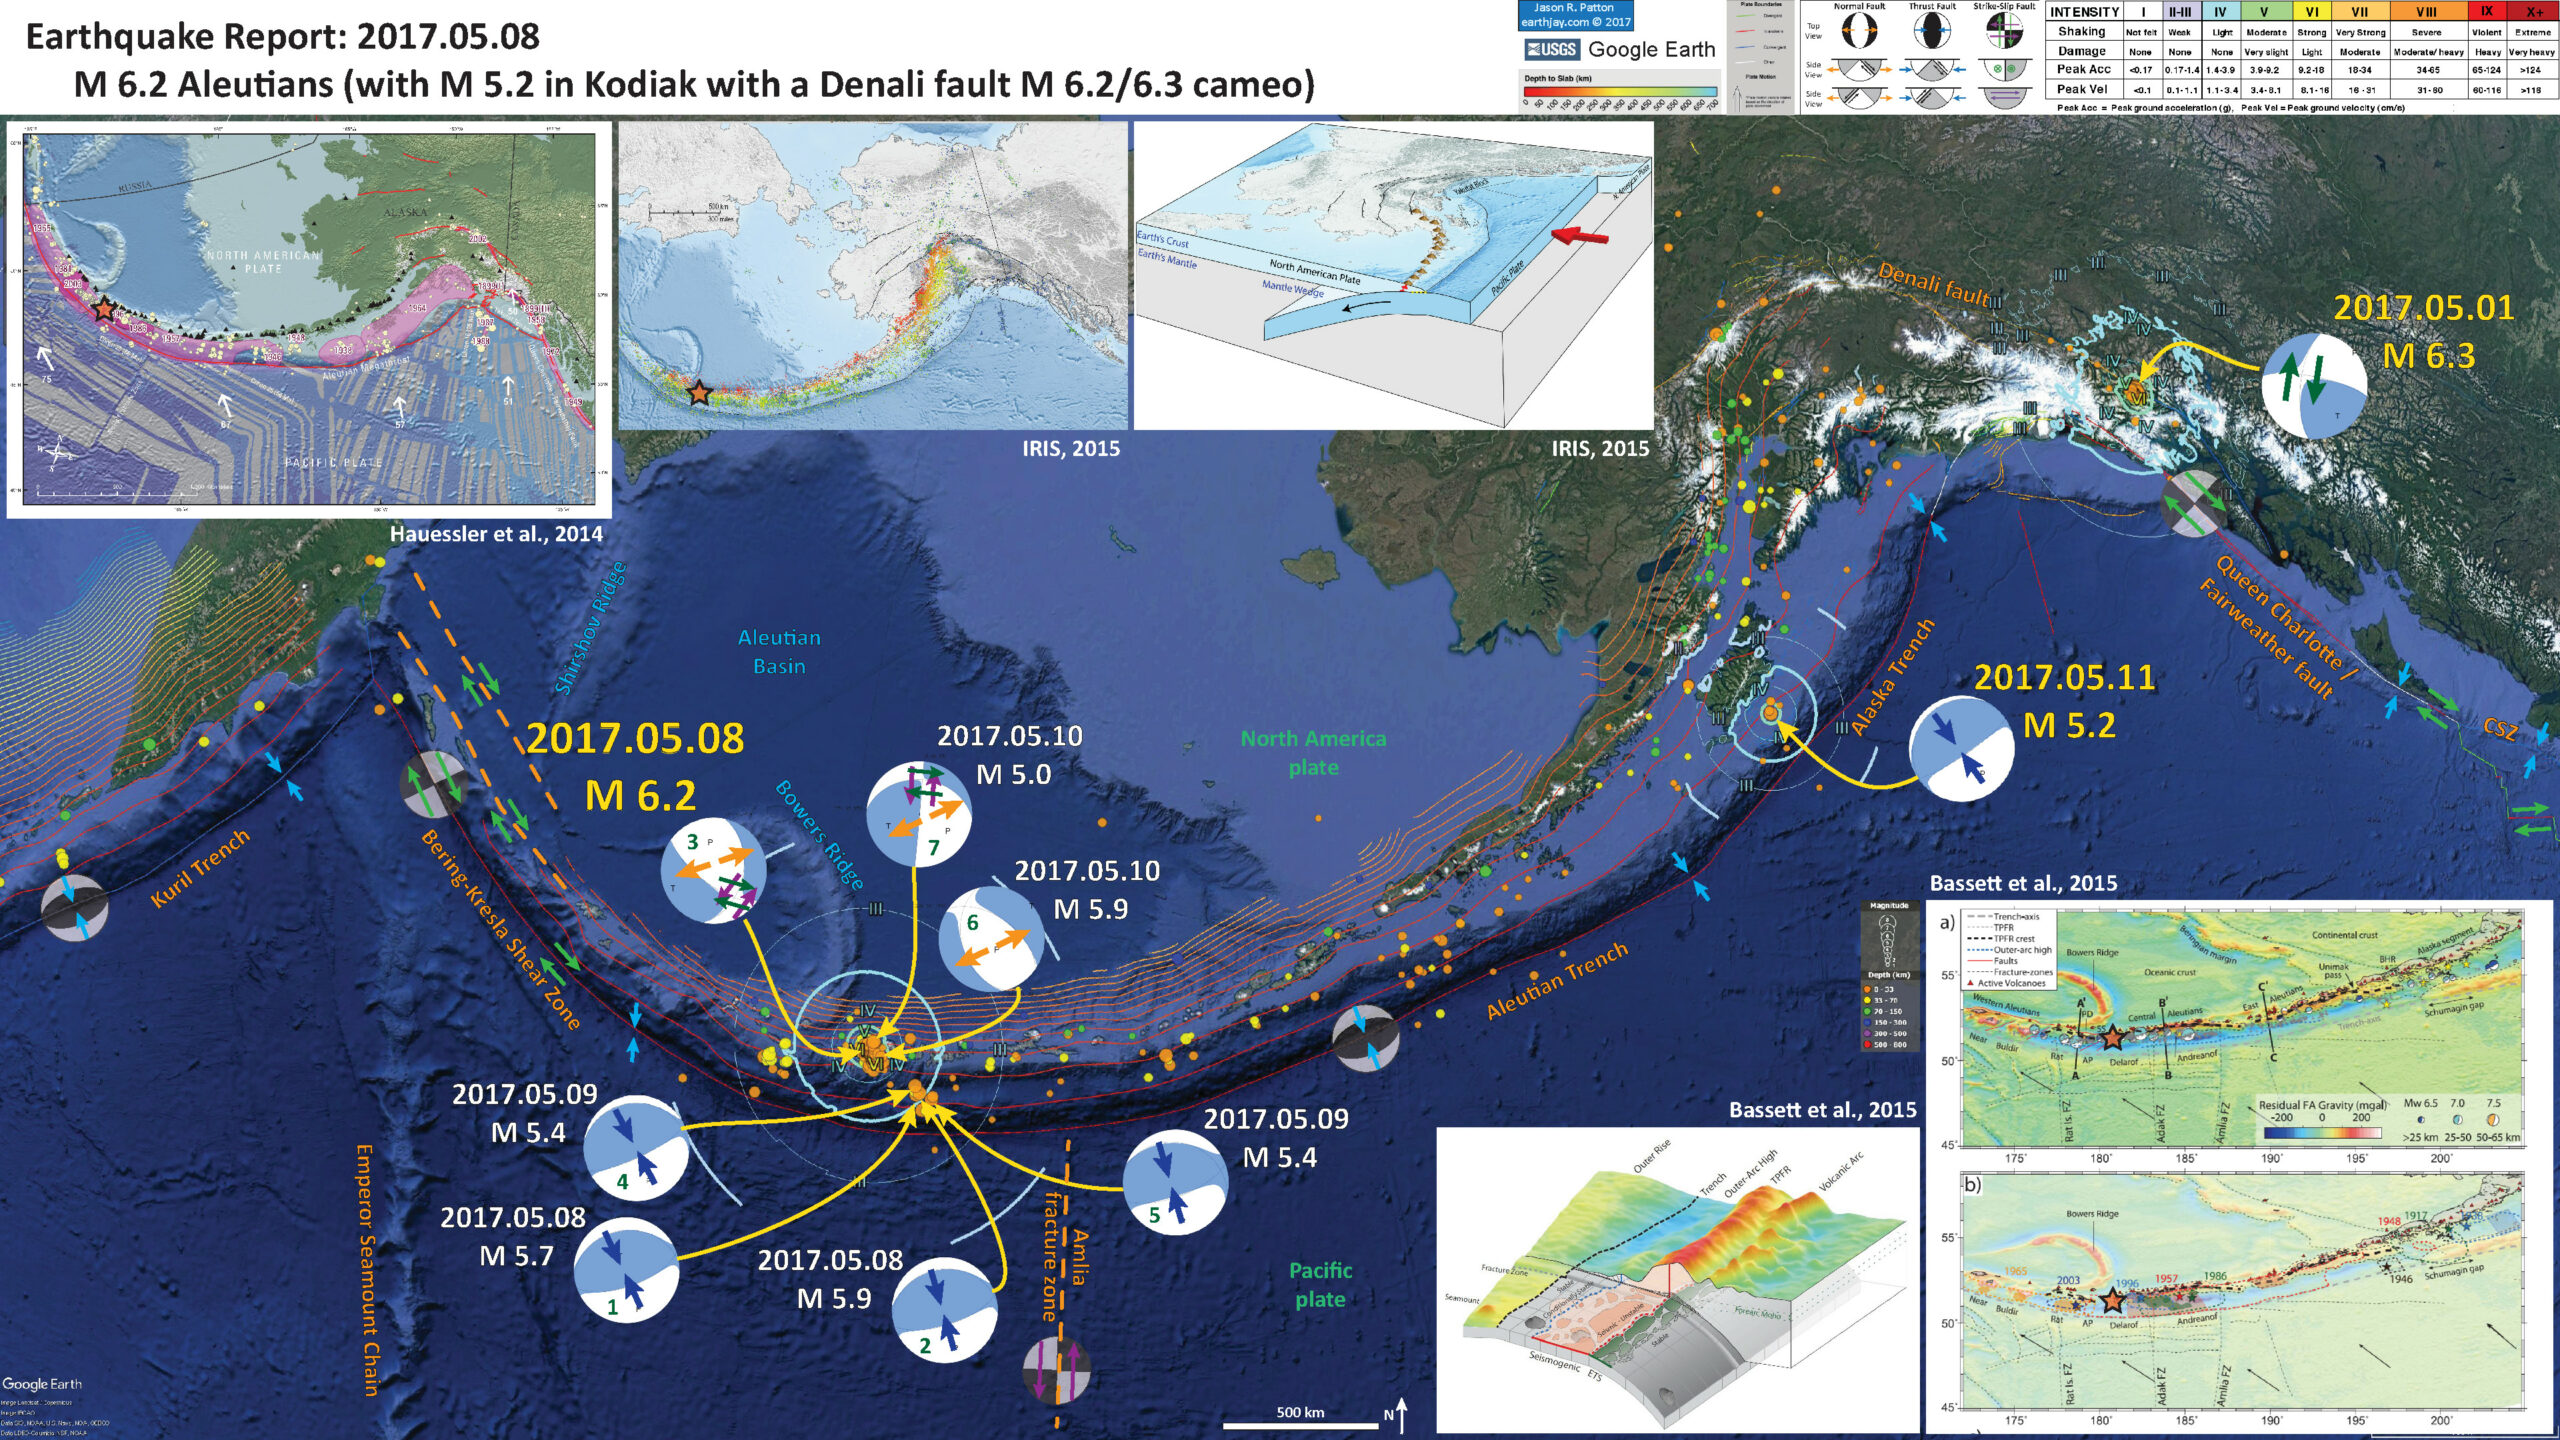
Less than 2 weeks ago there initiated a sequence of earthquakes along a fault splaying off of the Denali fault in British Columbia (with M 6.2 and M 6.3 mainshocks). Here is my report for that sequence. Over the past few days there have been a number of earthquakes along the western Aleutian Island Arc, a subduction zone formed by the convergence between the Pacific and North America plates. Initially there were some M ~5 earthquakes near the trench, in an up-dip region of the megathrust. The moment tensors (the beach balls on the map) reflect ~north-south compression, consistent with the subduction zone here. Then there popped some earthquakes to the northwest, including the mainshock (so far) of the sequence, an M 6.2. More earthquakes occurred in both small regions. The earthquakes in the more northerly patch have interesting moment tensors showing oblique slip.
The earthquakes in the southern patch mostly have hypocentral depths the are similar in depth to the megathrust fault as modeled by Hayes et al. (2012). The earthquakes in the northern patch are either shallow or have default (10 km) depths. Earthquakes are commonly given a default 10 km hypocentral depth prior to listing a calculated depth. All the larger earthquakes have a 10 km depth and the M 5.0 on 5/10 has a 9.6 km depth. There are about a dozen earthquakes (out of about 100 with M > 2.5) that have a deeper location (possibly on the megathrust). BUT the majority of earthquakes with determined depths have depths < 10 km. This suggests that these earthquakes may be in the upper North America plate. This makes sense because the upper plate has been interpreted to to have formed blocks that rotate in response to oblique subduction (see Krutikov figure below). The only problem is that if these earthquakes happened on the more northerly striking faults, then they should be right-lateral strike-slip (but the moment tensors show this nodal plan to be left-lateral). Perhaps these are along the more easterly nodal plane, which actually matches the sense of motion in the Krutikov figure below. The epicenter locations do not align along a clearly oriented north-south nor east-west trend, so this northerly patch is really difficult to interpret (at least until my colleagues send me an email telling me how they interpret these; I will update this report after that and give credit to those who have figured this out!).
Today there was an earthquake offshore of Kodiak Island. This earthquake is more simple because (1) it shows compression oriented with the subduction zone and (2) the depths align with the megathrust slab contours from Hayes et al. (2012).
SO. The Denali fault, Kodiak Island, and western Aleutian sequence earthquakes are unrelated to each other. However, the earthquakes in the western Aleutians do appear related (in time and space), and this is interesting if the northern patch is in the upper plate and the southern patch is along the megathrust. Pretty cool if that were the case.
- Earthquakes with a moment tensor have an ‘mt’ after the link.
- Aleutian
- 2017-05-08 15:31 M 5.7 mt
- 2017-05-08 15:47 M 5.9 mt
- 2017-05-08 17:00 M 6.2 mt
- 2017-05-08 17:08 M 5.2
- 2017-05-08 19:53 M 5.0
- 2017-05-09 08:59 M 5.4 mt
- 2017-05-10 07:59 M 5.9 mt
- 2017-05-10 19:25 M 5.0 mt
- Kodiak
- 2017-05-11 14:36 M 5.2 mt
Here are the USGS web pages for the earthquakes.
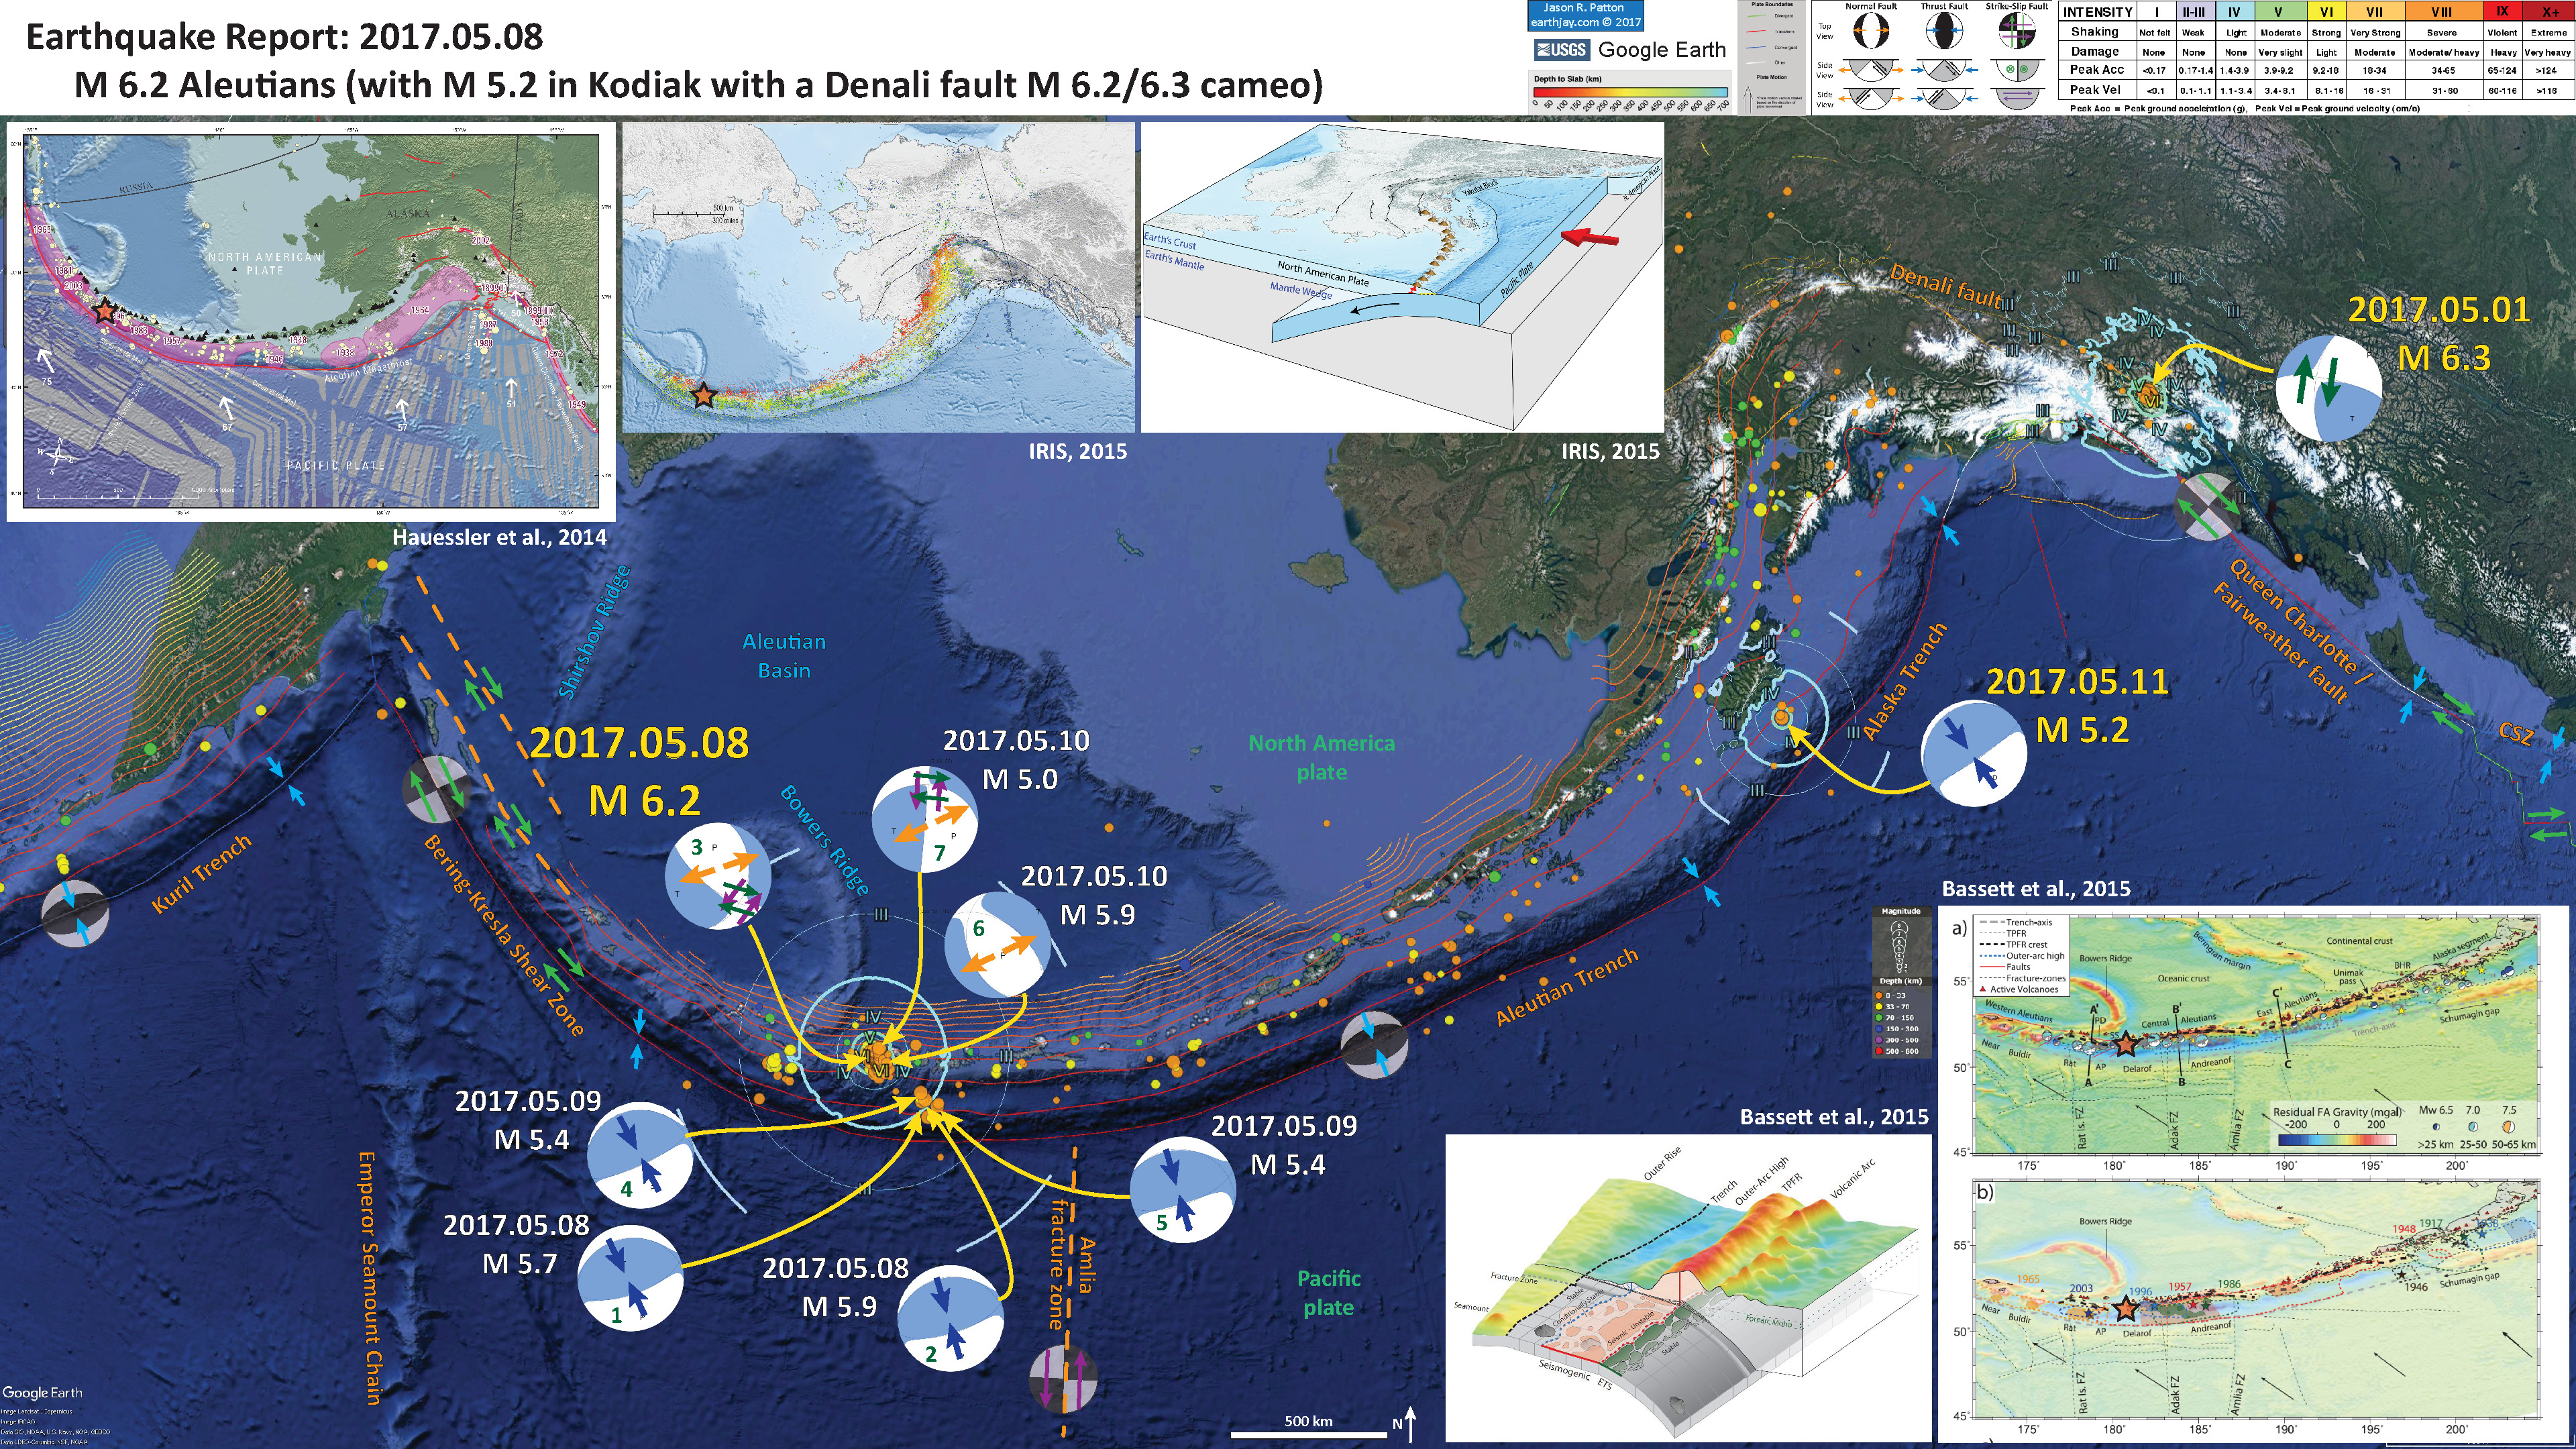
Below is my interpretive poster for this earthquake.
I plot the seismicity from the past month, with color representing depth and diameter representing magnitude (see legend). I include MMI contours for the M 6.2 along the western Aleutians, the M 5.2 offshore of Kodiak Island, and the M 6.3 along the Denali fault.
- I placed a moment tensor / focal mechanism legend on the poster. There is more material from the USGS web sites about moment tensors and focal mechanisms (the beach ball symbols). Both moment tensors and focal mechanisms are solutions to seismologic data that reveal two possible interpretations for fault orientation and sense of motion. One must use other information, like the regional tectonics, to interpret which of the two possibilities is more likely.
- I also include the shaking intensity contours on the map. These use the Modified Mercalli Intensity Scale (MMI; see the legend on the map). This is based upon a computer model estimate of ground motions, different from the “Did You Feel It?” estimate of ground motions that is actually based on real observations. The MMI is a qualitative measure of shaking intensity. More on the MMI scale can be found here and here. This is based upon a computer model estimate of ground motions, different from the “Did You Feel It?” estimate of ground motions that is actually based on real observations.
- I include the slab contours plotted (Hayes et al., 2012), which are contours that represent the depth to the subduction zone fault. These are mostly based upon seismicity. The depths of the earthquakes have considerable error and do not all occur along the subduction zone faults, so these slab contours are simply the best estimate for the location of the fault. The hypocentral depth of the M 5.5 plots this close to the location of the fault as mapped by Hayes et al. (2012).
- In the upper left corner is a figure that shows the historic earthquake ruptures along the Aleutian Megathrust (Peter Haeussler, USGS). I place a red star in the general location of this earthquake sequence (same for other figures here).
- To the right of that figure are two figures from IRIS. On the left is a map showing seismicity plotted vs. depth (with color). On the right is a low-angle oblique view of a cross section and map of the plate boundary faults here.
- In the lower right corner is a figure from Bassett and Watts (2015 B) that shows the results of their analyses using gravity data.
- To the left of that is a schematic illustration from Bassett and Watts (2015 B) that shows how their gravity anomaly data may relate to different parts of the megathrust fault. They interpret a trench-parallel fore-arc ridge (TPFR) that may “provide insights into the dimensions, seismogenic behavior, and segmentation of subduction thrust faults.”
I include some inset figures in the poster.
- Here is a figure from Krutikov et al. (2008) that shows how blocks in the Aleutian Arc may accommodate the oblique subduction, along forearc sliver faults. Note that these blocks may also rotate to accommodate the oblique convergence. There are also margin parallel strike slip faults that bound these blocks. These faults are in the upper plate, but may impart localized strain to the lower plate, resulting in strike slip motion on the lower plate (my arm waving part of this). Note how the upper plate strike-slip faults have the same sense of motion as these deeper earthquakes.
- Here is a figure from a GSA paper (here) that shows how the stresses from oblique convergence is partitioned along subduction zone faults and strike-slip faults (forearc slivers).
- Here is the figure from Bassett and Watts (2015) for the Aleutians.
Aleutian subduction zone. Symbols as in Figure 3. (a) Residual free-air gravity anomaly and seismicity. The outer-arc high, trench-parallel fore-arc ridge and block-bounding faults are dashed in blue, black, and red, respectively. Annotations are AP = Amchitka Pass; BHR = Black-Hills Ridge; SS = Sunday Sumit Basin; PD = Pratt Depression. (b) Published asperities and slip-distributions/aftershock areas for large magnitude earthquakes. (c) Cross sections showing residual bathymetry (green), residual free-air gravity anomaly (black), and the geometry of the seismogenic zone [Hayes et al., 2012].
- Here is the schematic figure from Bassett and Watts (2015).
Schematic diagram summarizing the key spatial associations interpreted between the morphology of the fore-arc and variations in the seismogenic behavior of subduction megathrusts.
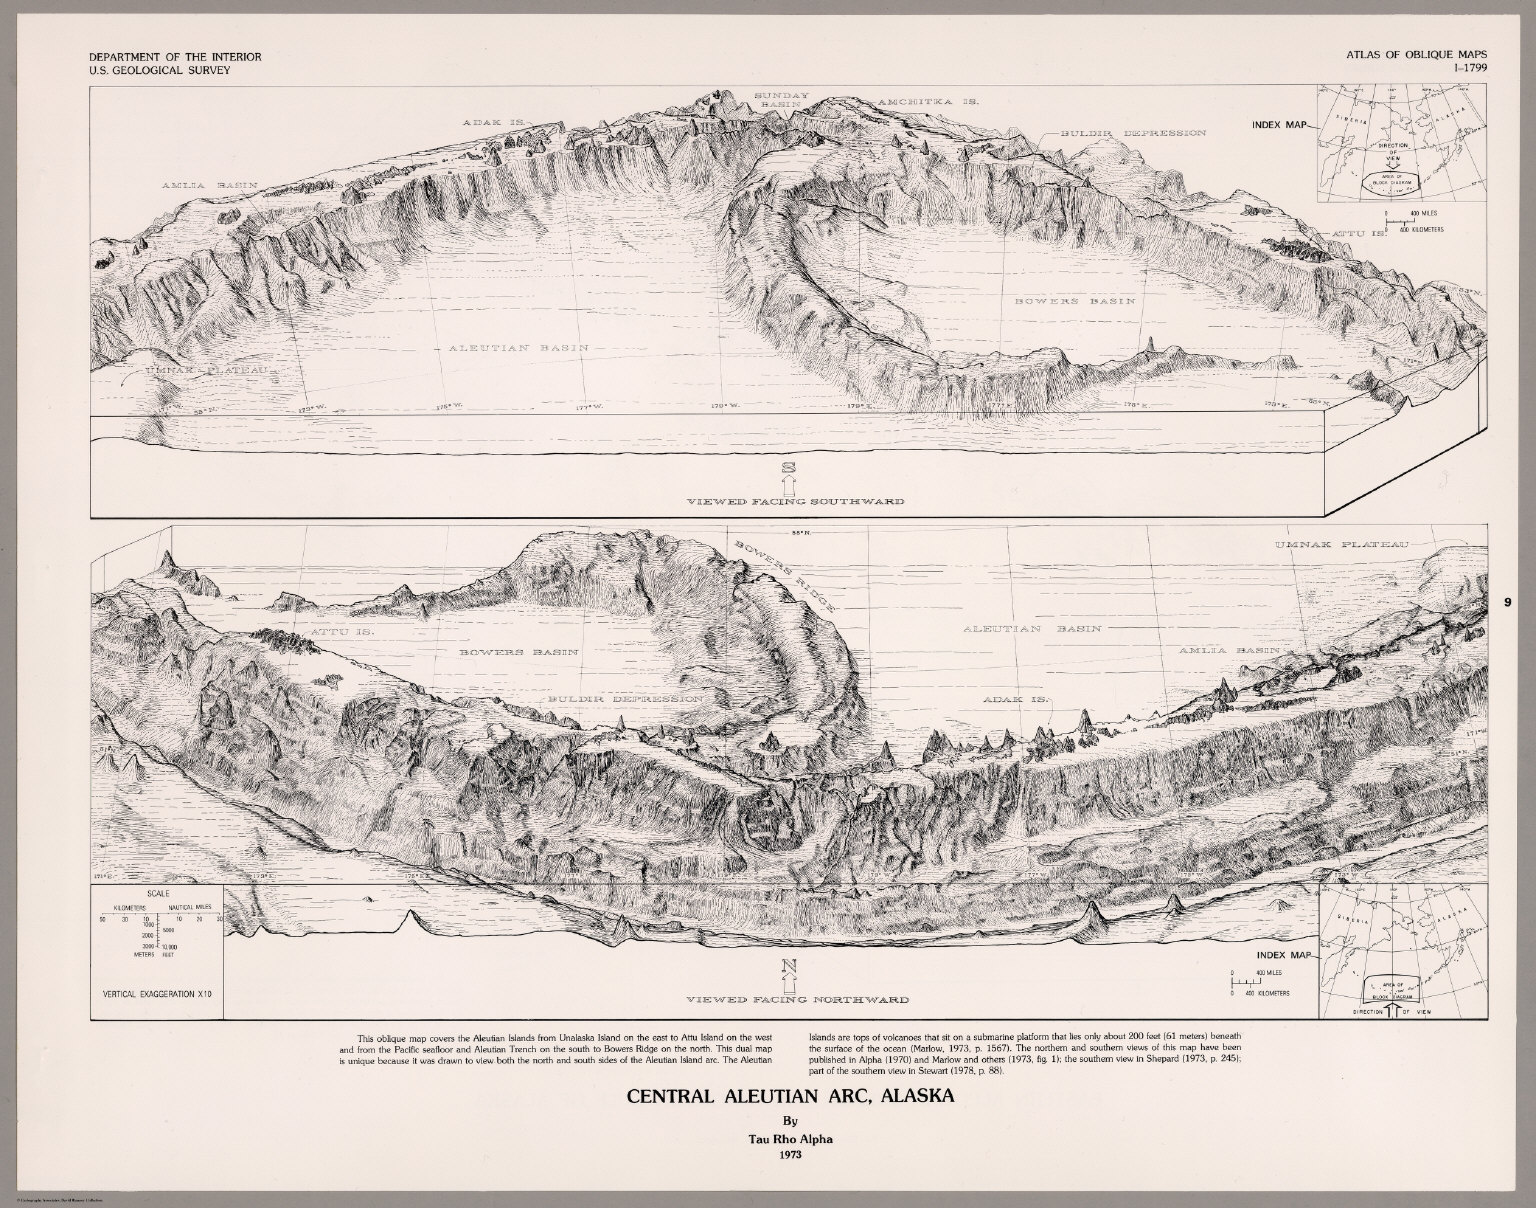
- Here is a beautiful illustration for the Aleutian Trench from Alpha (1973) as posted on the David Rumsey Collection online.
- Summary of the 1964 Earthquake
- 2017.05.08 M 6.2 Aleutians
- 2017.05.01 M 6.3 British Columbia
- 2017.03.29 M 6.6 Kamchatka
- 2017.03.02 M 5.5 Alaska
- 2016.09.05 M 6.3 Bering Kresla (west of Aleutians)
- 2016.04.02 M 6.2 Alaska Peninsula
- 2016.03.27 M 5.7 Aleutians
- 2016.03.12 M 6.3 Aleutians
- 2016.01.24 M 7.1 Alaska
- 2015.11.09 M 6.2 Aleutians
- 2015.11.02 M 5.9 Aleutians
- 2015.11.02 M 5.9 Aleutians (update)
- 2015.07.27 M 6.9 Aleutians
- 2015.05.29 M 6.7 Alaska Peninsula
- 2015.05.29 M 6.7 Alaska Peninsula (animations)
- 1964.03.27 M 9.2 Good Friday
#EarthquakeReports in Alaska | Kamchatka | Kurile
General Overview
Earthquake Reports
References
- Bassett and Watts, 2015 A. Gravity anomalies, crustal structure, and seismicity at subduction zones: 1. Seafloor roughness and subducting relief in Geochemistry, Geophysics, Geosystems, v. 16, doi:10.1002/2014GC005684.
- Bassett, D. and Watts, A.B., 2015 B. Gravity anomalies, crustal structure, and seismicity at subduction zones: 2. Interrelationships between fore-arc structure and seismogenic behavior in Geochemistry, Geophysics, Geosystems, v. 16, doi:10.1002/2014GC005685.
- Hayes, G. P., D. J. Wald, and R. L. Johnson, 2012. Slab1.0: A three-dimensional model of global subduction zone geometries, J. Geophys. Res., 117, B01302, doi:10.1029/2011JB008524.
- Ikuta, R., Mitsui, Y., Kurokawa, Y., and Ando, M., 2015. Evaluation of strain accumulation in global subduction zones from seismicity data in Earth, Planets and Space, v. 67, DOI 10.1186/s40623-015-0361-5
- Koulakov, I.Y., Dobretsov, N.L., Bushenkova, N.A., and Yakovlev, A.V., 2011. Slab shape in subduction zones beneath the Kurile–Kamchatka and Aleutian arcs based on regional tomography results in Russian Geology and Geophysics, v. 52, p. 650-667.
- Krutikov, L., Stone, D.B., and Minyuk, P., 2008. New Paleomagnetic Data From the Central Aleutian Arc: Evidence and Implications for Block Rotations in Active Tectonics and Seismic Potential of Alaska, Geophysical Monograph Series 179 American Geophysical Union. 10.1029/179GM07
- Lay, T., H. Kanamori, C. J. Ammon, A. R. Hutko, K. Furlong, and L. Rivera, 2009. The 2006 – 2007 Kuril Islands great earthquake sequence in J. Geophys. Res., 114, B11308, doi:10.1029/2008JB006280.
- Portnyagin, M. and Manea, V.C., 2008. Mantle temperature control on composition of arc magmas along the Central Kamchatka Depression in Geology, v. 36, no. 7, p. 519-522.
- Rhea, S., Tarr, A.C., Hayes, G., Villaseñor, A., Furlong, K.P., and Benz, H.M., 2010. Seismicity of the Earth 1900-2007, Kuril-Kamchatka arc and vicinity: U.S. Geological Survey Open-File Report 2010-1083-C, 1 map sheet, scale 1:5,000,000.


