We had an earthquake a few days ago along the Cook Strait west of Anchorage, Alaska. This earthquake happened nearby a couple earthquakes from the past 2 years that have similar senses of motion along faults that seem to be oriented the same. Here is my report for the 2016 M 7.1 earthquake.
-
The USGS websites for the three large earthquakes with moment tensors plotted on the poster are here
- 2015.07.29 M 6.3
- 2016.01.24 M 7.1
- 2017.03.02 M 5.5
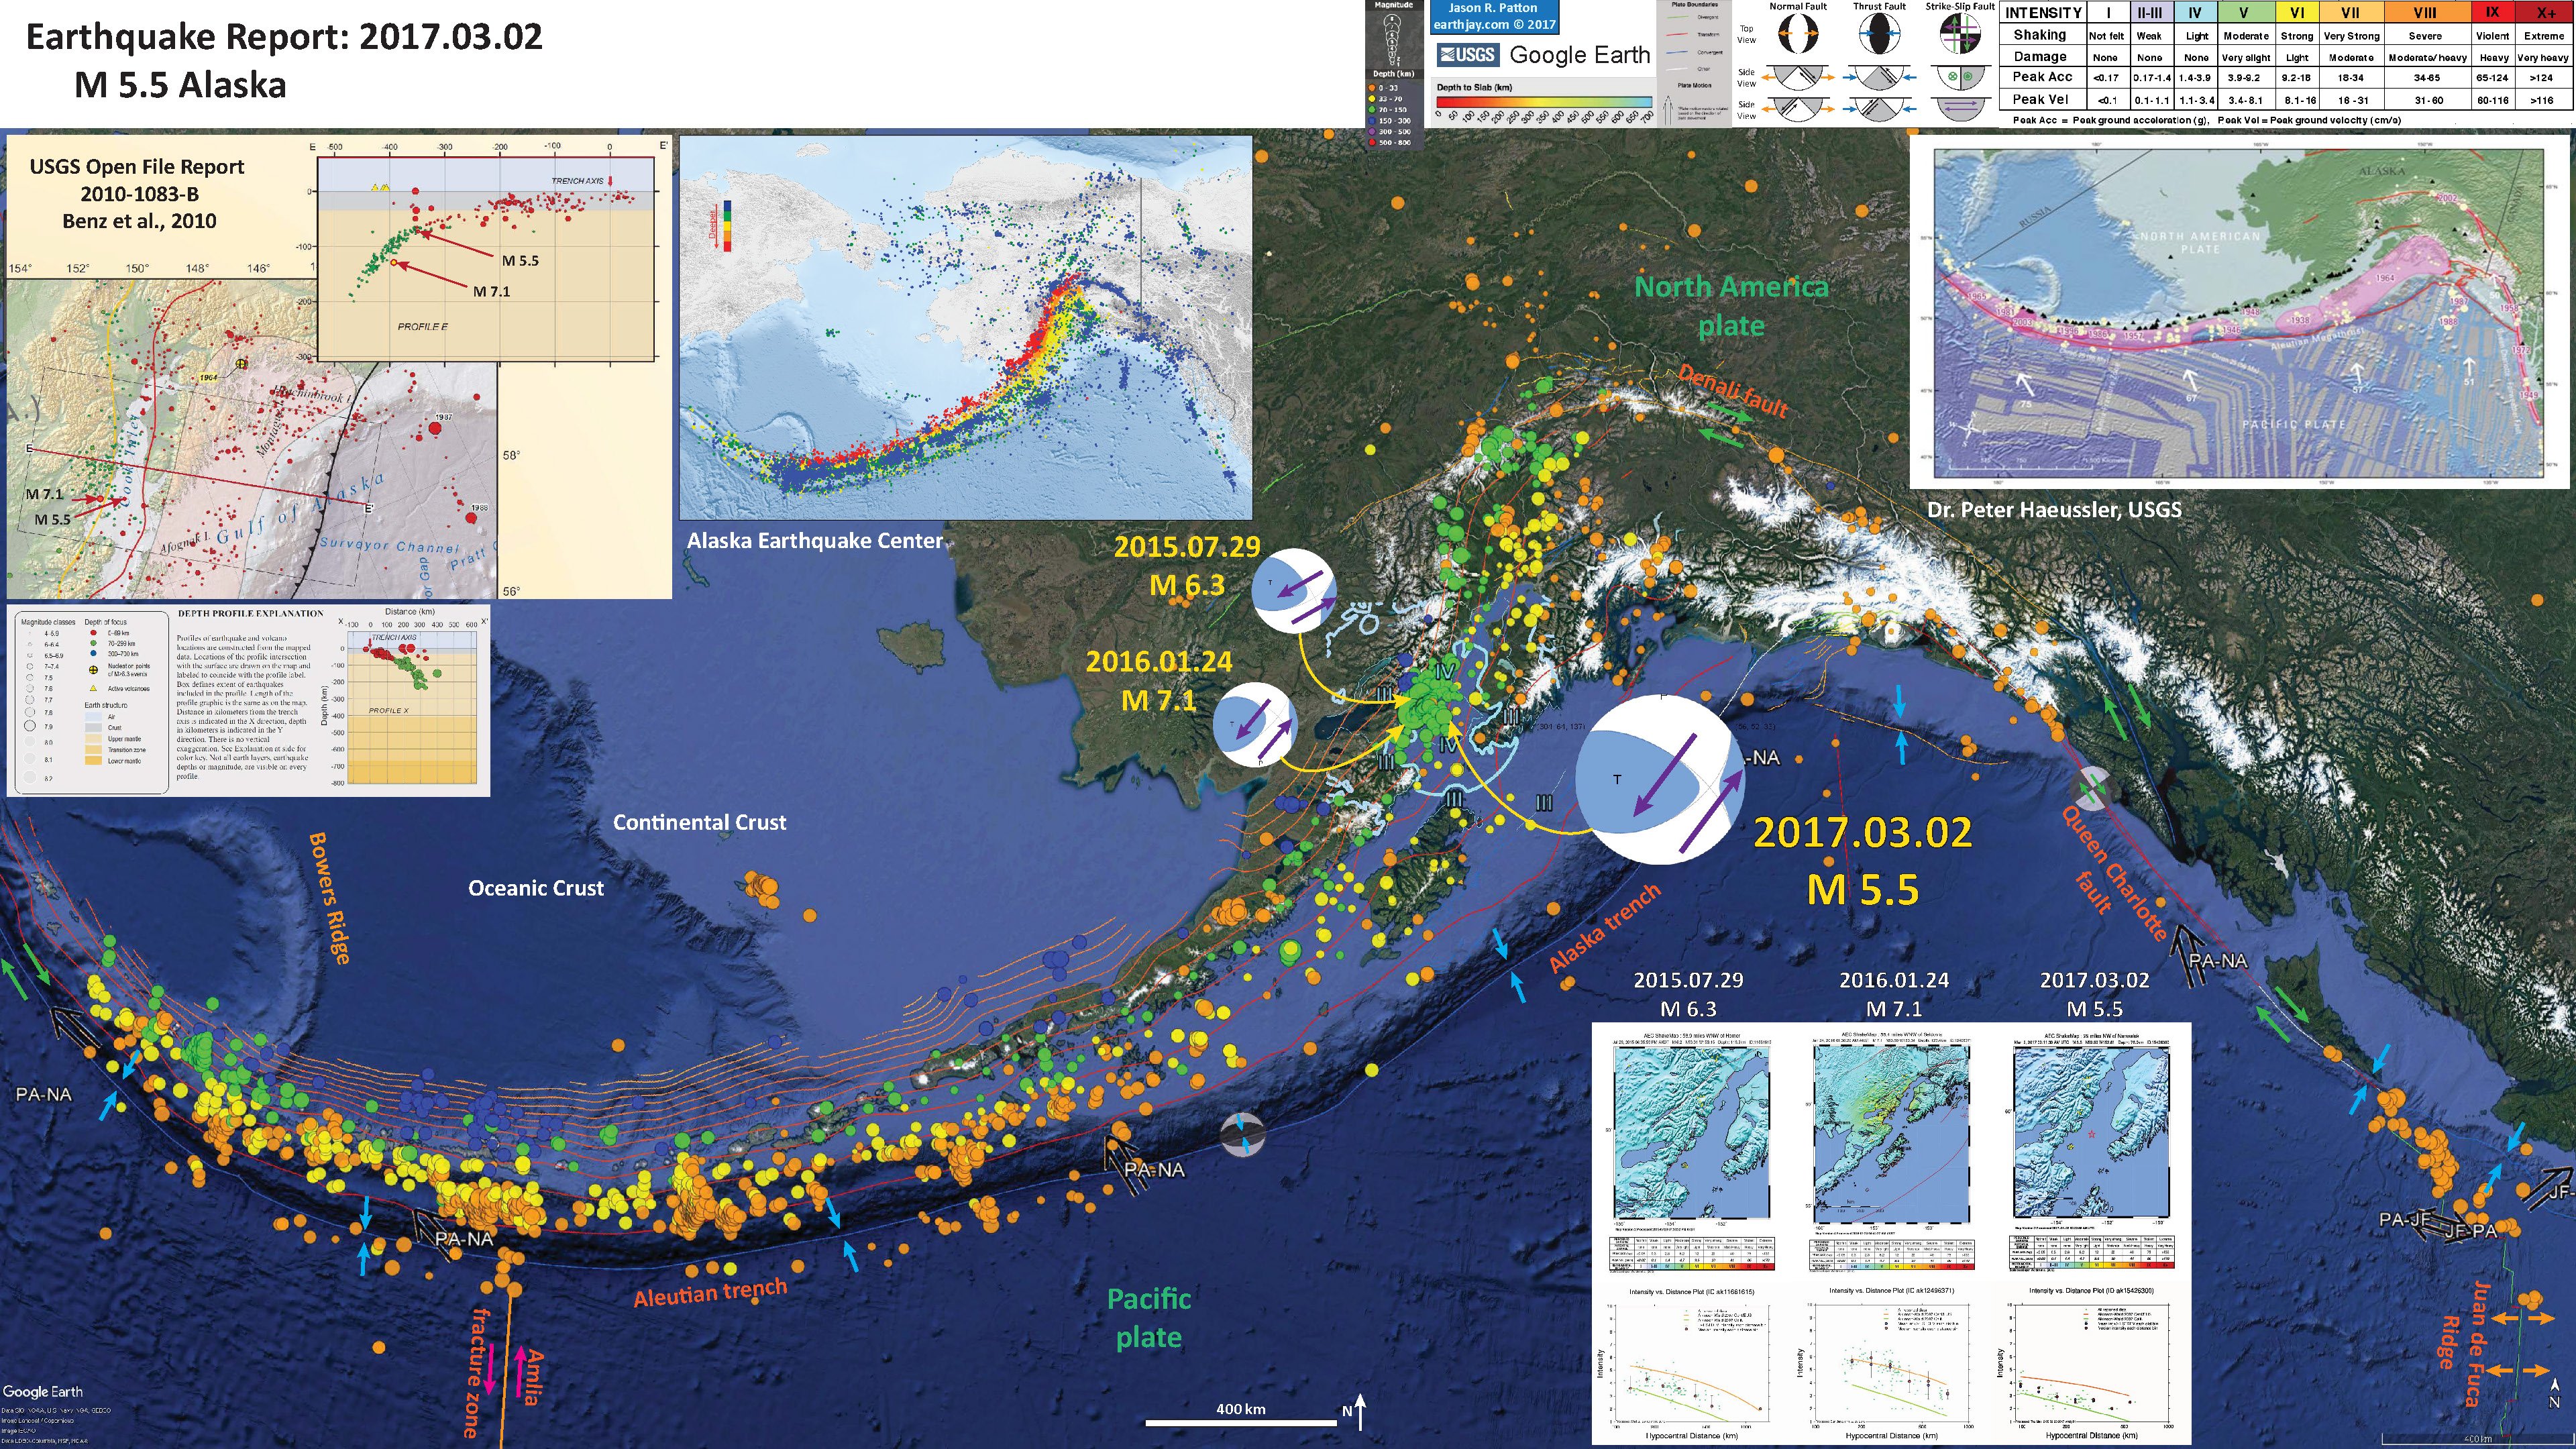
Below is my interpretive poster for this earthquake.
I plot the seismicity from the past month, with color representing depth and diameter representing magnitude (see legend). I also include seismicity from 2015-2017 for earthquakes with magnitudes M ≥ 4.0.
- I placed a moment tensor / focal mechanism legend on the poster. There is more material from the USGS web sites about moment tensors and focal mechanisms (the beach ball symbols). Both moment tensors and focal mechanisms are solutions to seismologic data that reveal two possible interpretations for fault orientation and sense of motion. One must use other information, like the regional tectonics, to interpret which of the two possibilities is more likely. The moment tensors for all three of these earthquakes are very similar.
- I also include the shaking intensity contours on the map. These use the Modified Mercalli Intensity Scale (MMI; see the legend on the map). This is based upon a computer model estimate of ground motions, different from the “Did You Feel It?” estimate of ground motions that is actually based on real observations. The MMI is a qualitative measure of shaking intensity. More on the MMI scale can be found here and here. This is based upon a computer model estimate of ground motions, different from the “Did You Feel It?” estimate of ground motions that is actually based on real observations.
- I include the slab contours plotted (Hayes et al., 2012), which are contours that represent the depth to the subduction zone fault. These are mostly based upon seismicity. The depths of the earthquakes have considerable error and do not all occur along the subduction zone faults, so these slab contours are simply the best estimate for the location of the fault. The hypocentral depth plots this close to the location of the fault as mapped by Hayes et al. (2012). All three earthquakes listed above plot clearly within the downgoing Pacific plate slab.
- In the upper right corner is a map produced by Dr. Peter Haeussler from the USGS Alaska Science Center (pheuslr at usgs.gov) that shows the historic earthquakes along the Aleutian-Alaska subduction zone.
- In the upper left corner I include an inset map from the USGS Seismicity History poster for this region (Benz et al., 2010). There is one seismicity cross section with its locations plotted on the map. The USGS plot these hypocenters along this cross section and I include that below (with the legend). I placed orange circles on the map and cross section showing the general location of the M 7.1 and M 5.5 earthquakes. The M 6.3 earthquake would plot almost in the same location as the M 7.1.
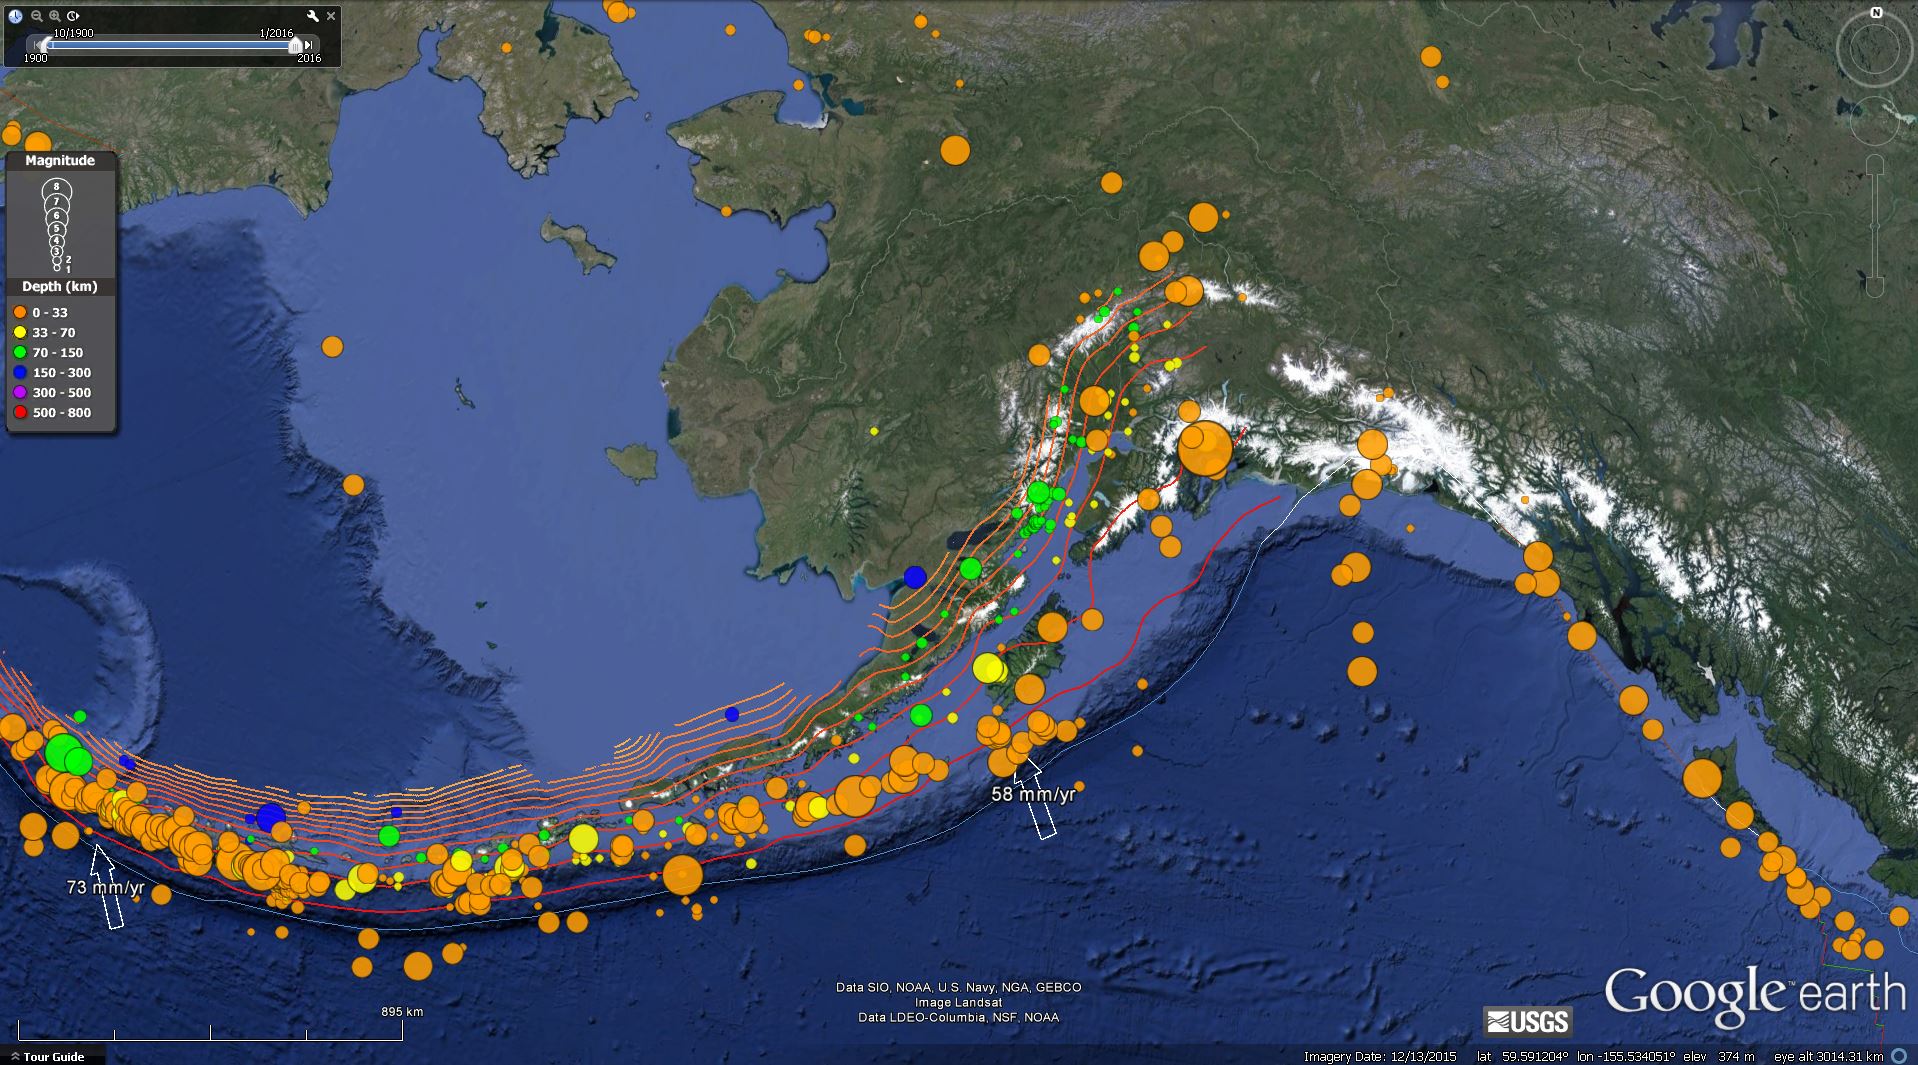
- To the right of the Benz et al. (2010) figures is a map showing seismicity plotted as dots colored vs. depth. This map is from the Alaska Earthquake Center as presented by IRIS.
- In the lower right corner are the MMI intensity maps for the two earthquakes listed above: 2015 M 6.3, 2016 M 7.1, and 2017 M 5.5. These figures were created by the USGS, but were made at different sizes, so they don’t match perfectly (don’t ask me why they keep changing the sizes of their figures and maps, I don’t know the answer). Below each map are plotted the reports from the Did You Feel It? USGS website for each earthquake. These reports are plotted as green dots with intensity on the vertical axes and distance on the horizontal axes. There are comparisons with Ground Motion Prediction Equation (attenuation relations) results (the orange model uses empirical data from central and eastern US earthquakes; the green model uses empirical data from earthquakes in California). Neither model seems appropriate given the DYFI results, though the California model works slightly better for the M 5.5 earthquake.
I include some inset figures in the poster.
Here is the same poster with only seismicity from the past 30 days plotted.

- Dr. Peter Haeussler produced a cross section for this region, as prepared for the 2016 M 7.1 earthquake. Below is his description of this figure.
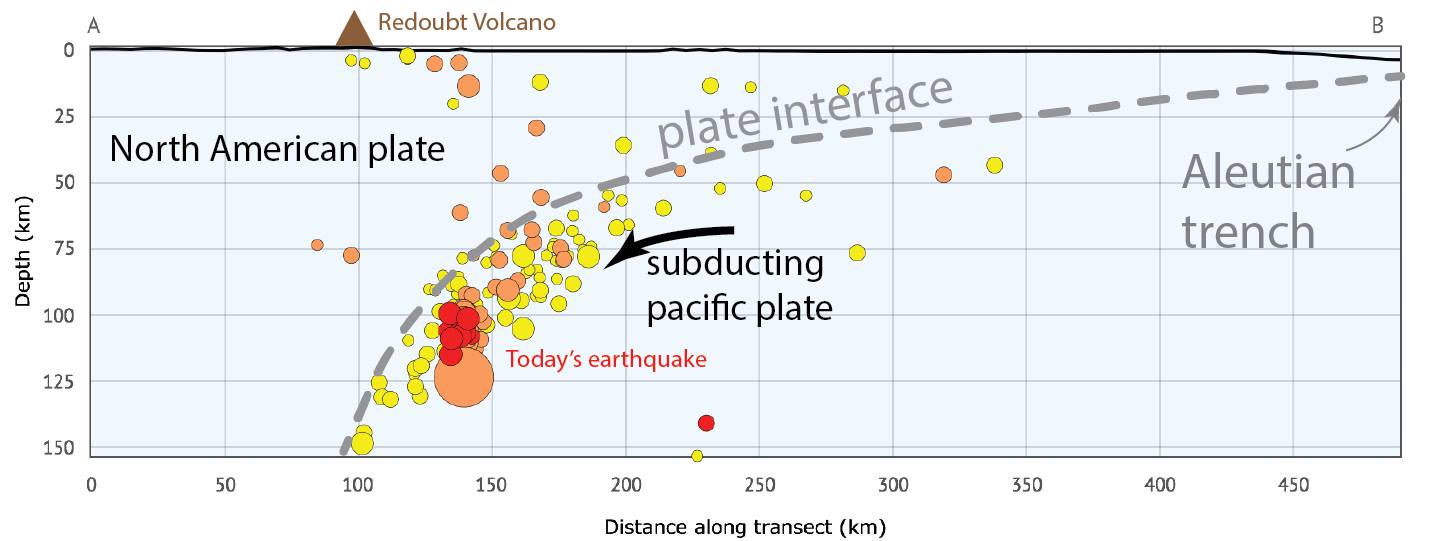
I made up a quick diagram (thanks Alaska Earthquake Center tools) showing the tectonic setting of the earthquake. This was a “Benioff zone” event, which means that the earthquake is related to bending of the subducting Pacific Plate as it slides into the mantle.
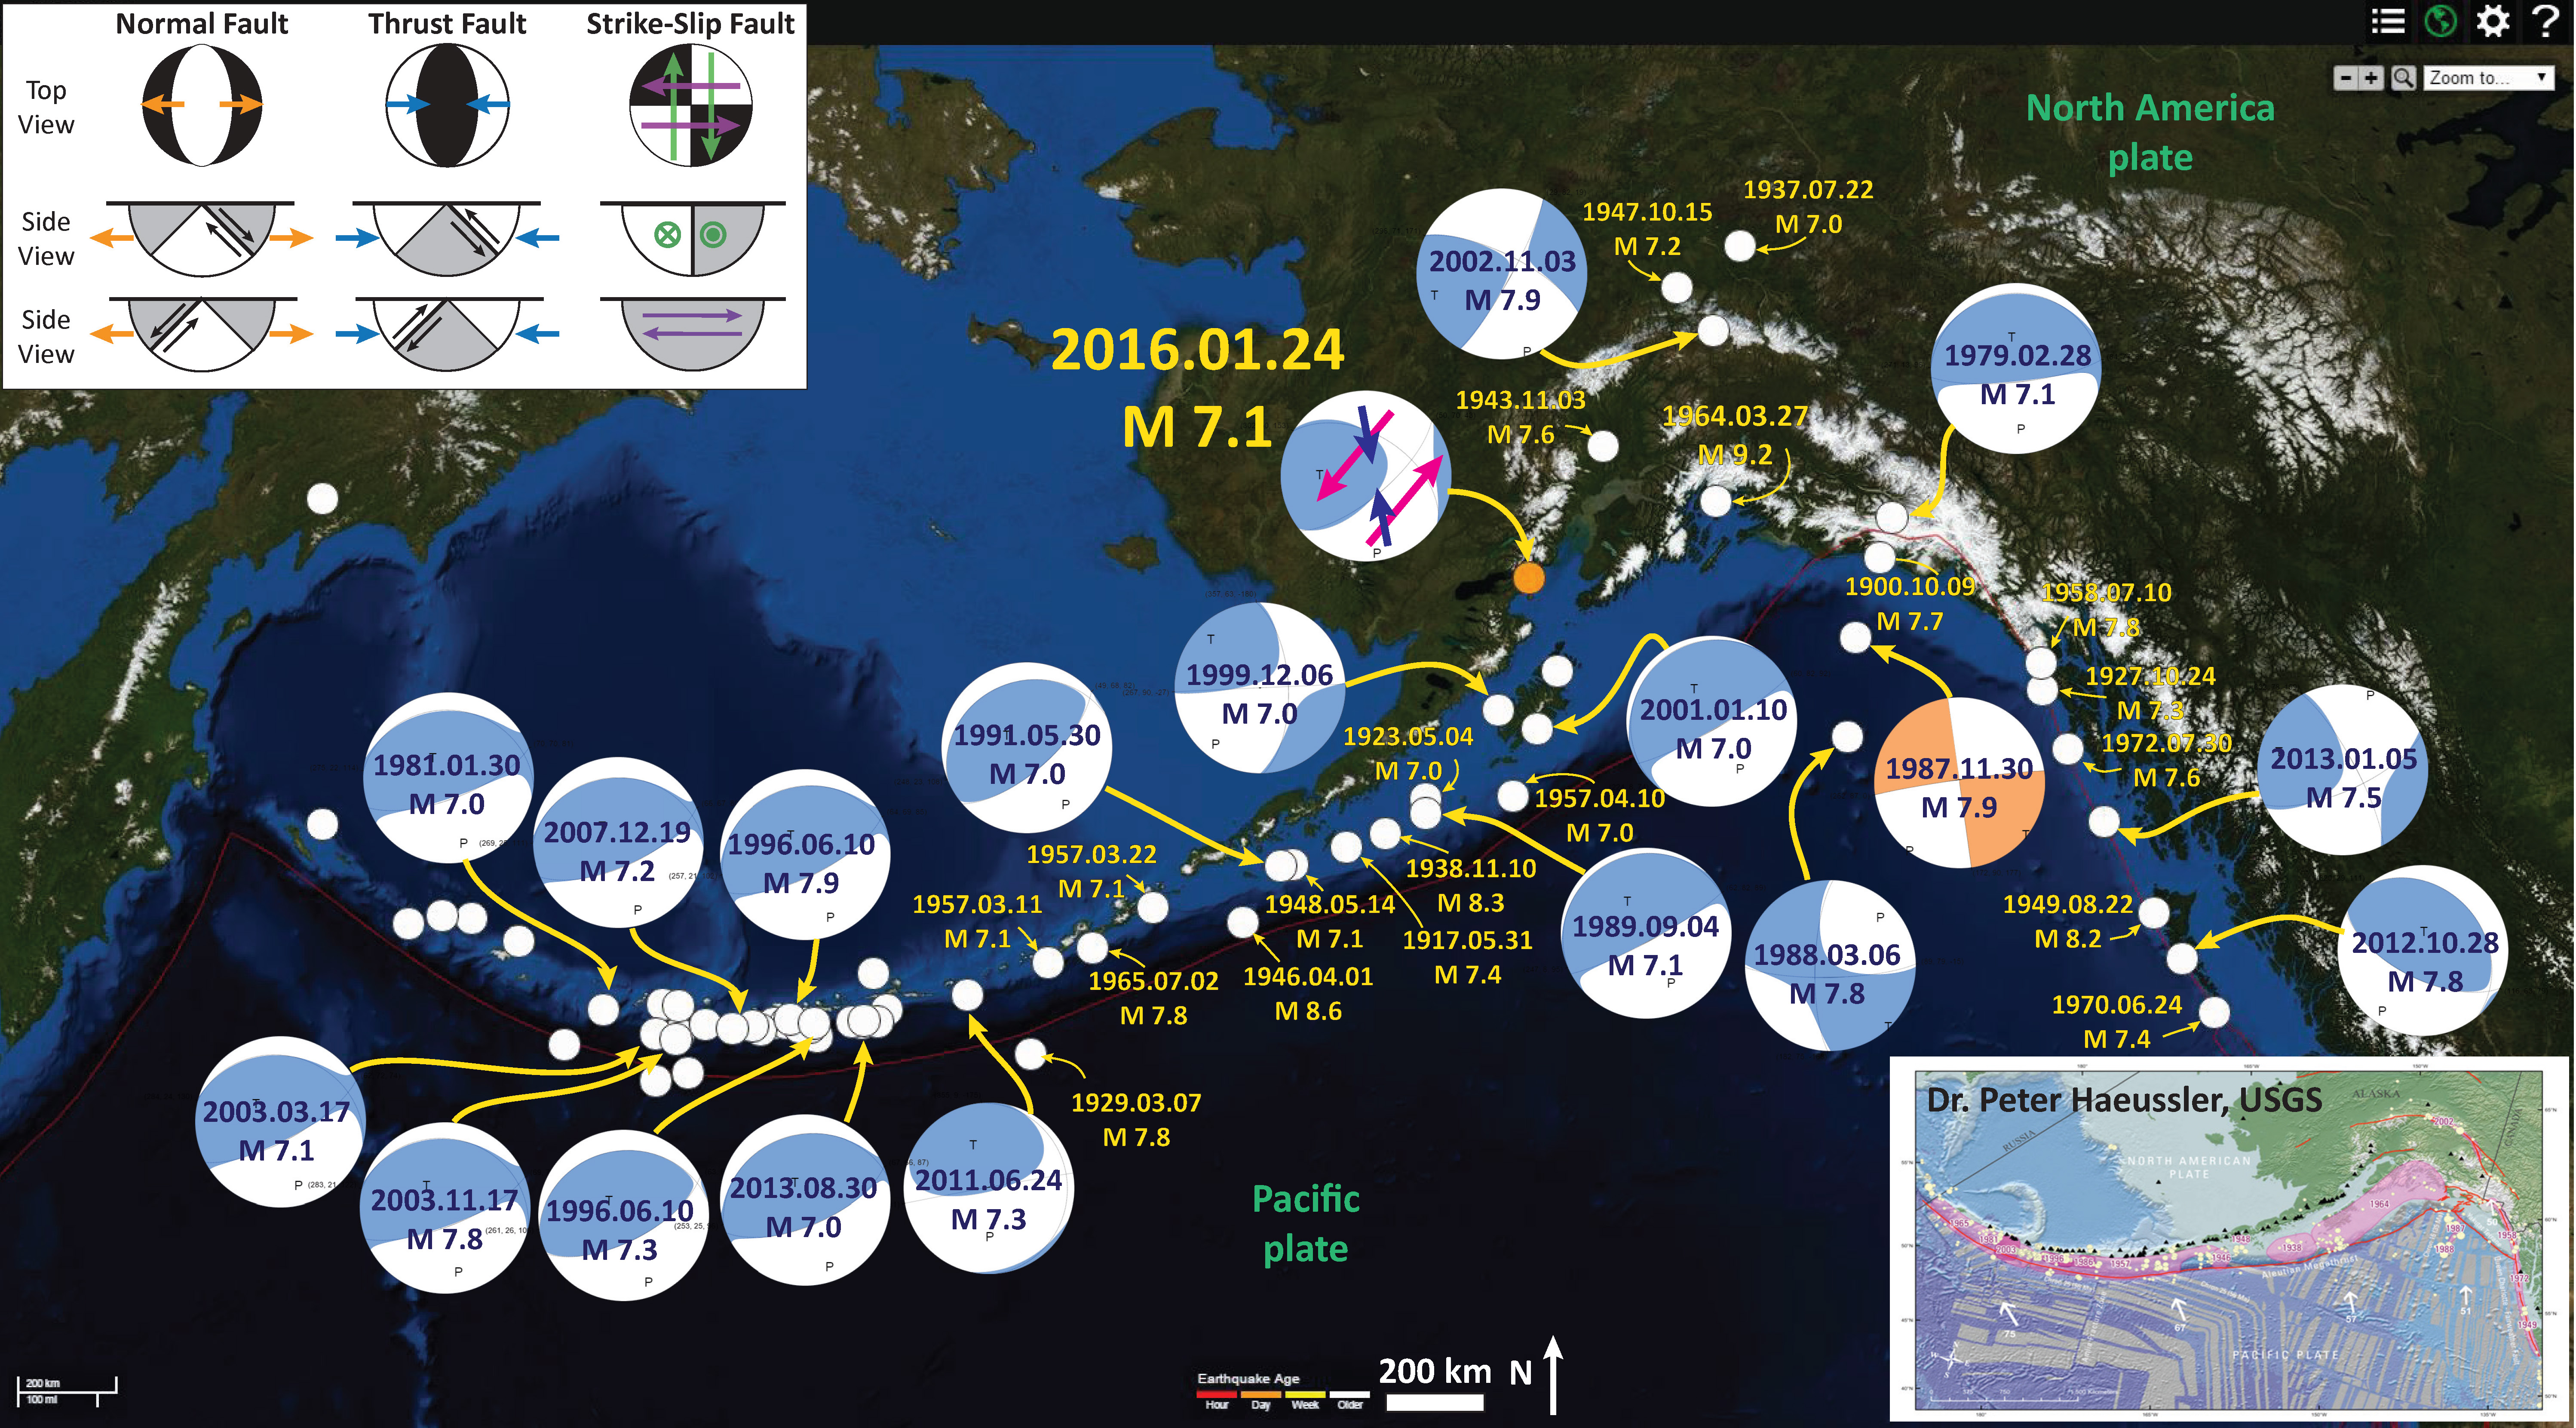
- Here is a map for the earthquakes of magnitude greater than or equal to M 7.0 between 1900 and 2016. This is the USGS query that I used to make this map. One may locate the USGS web pages for all the earthquakes on this map by following that link.
-
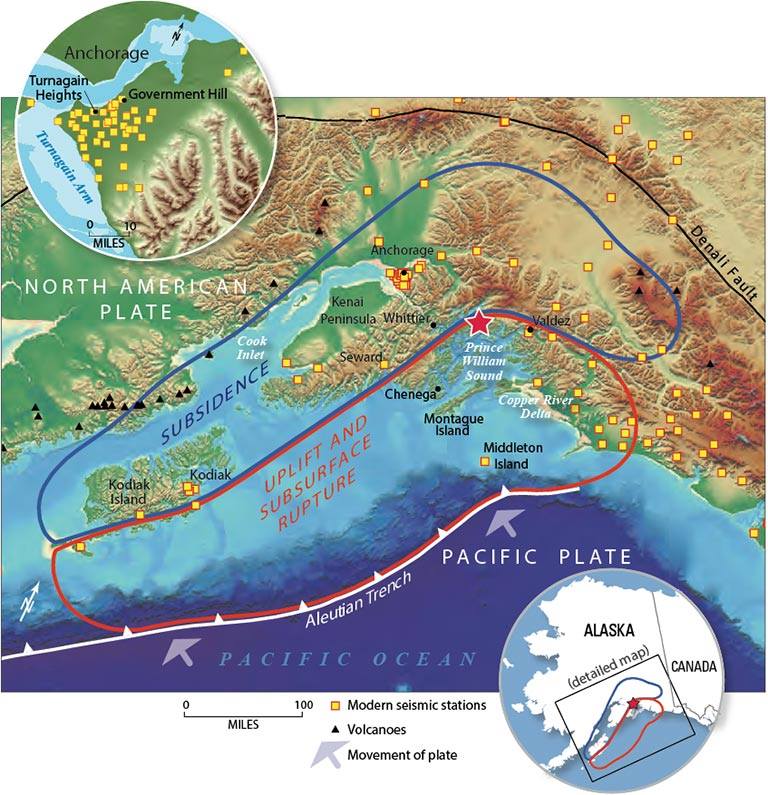
This is a map from Haeussler et al. (2014). The region in red shows the area that subsided and the area in blue shows the region that uplifted during the earthquake. These regions were originally measured in the field by George Plafker and published in several documents, including this USGS Professional Paper (Plafker, 1969). I present more information about the 1964 Good Friday Earthquake here.
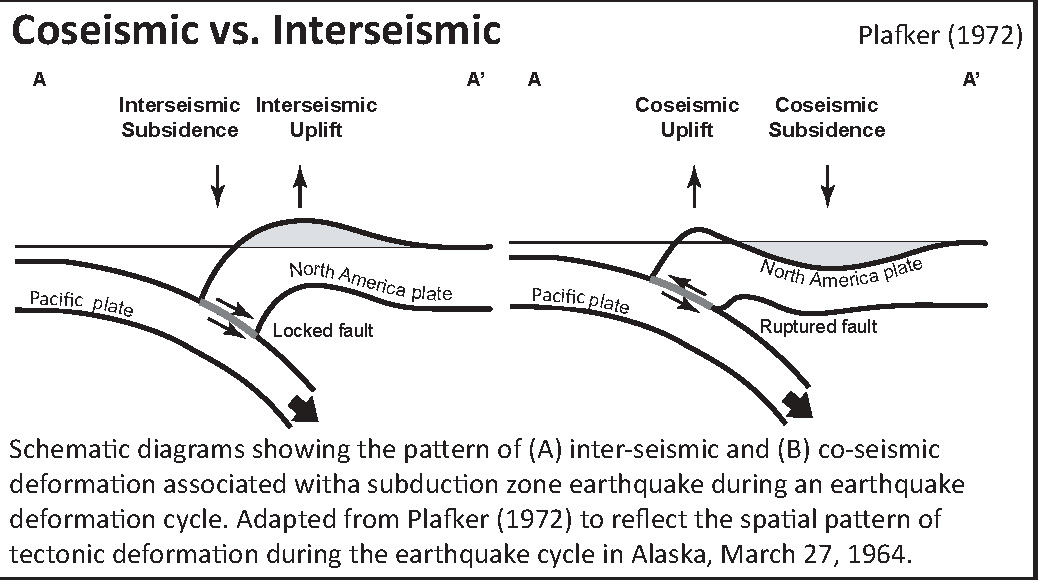
- Here is a cross section showing the differences of vertical deformation between the coseismic (during the earthquake) and interseismic (between earthquakes).
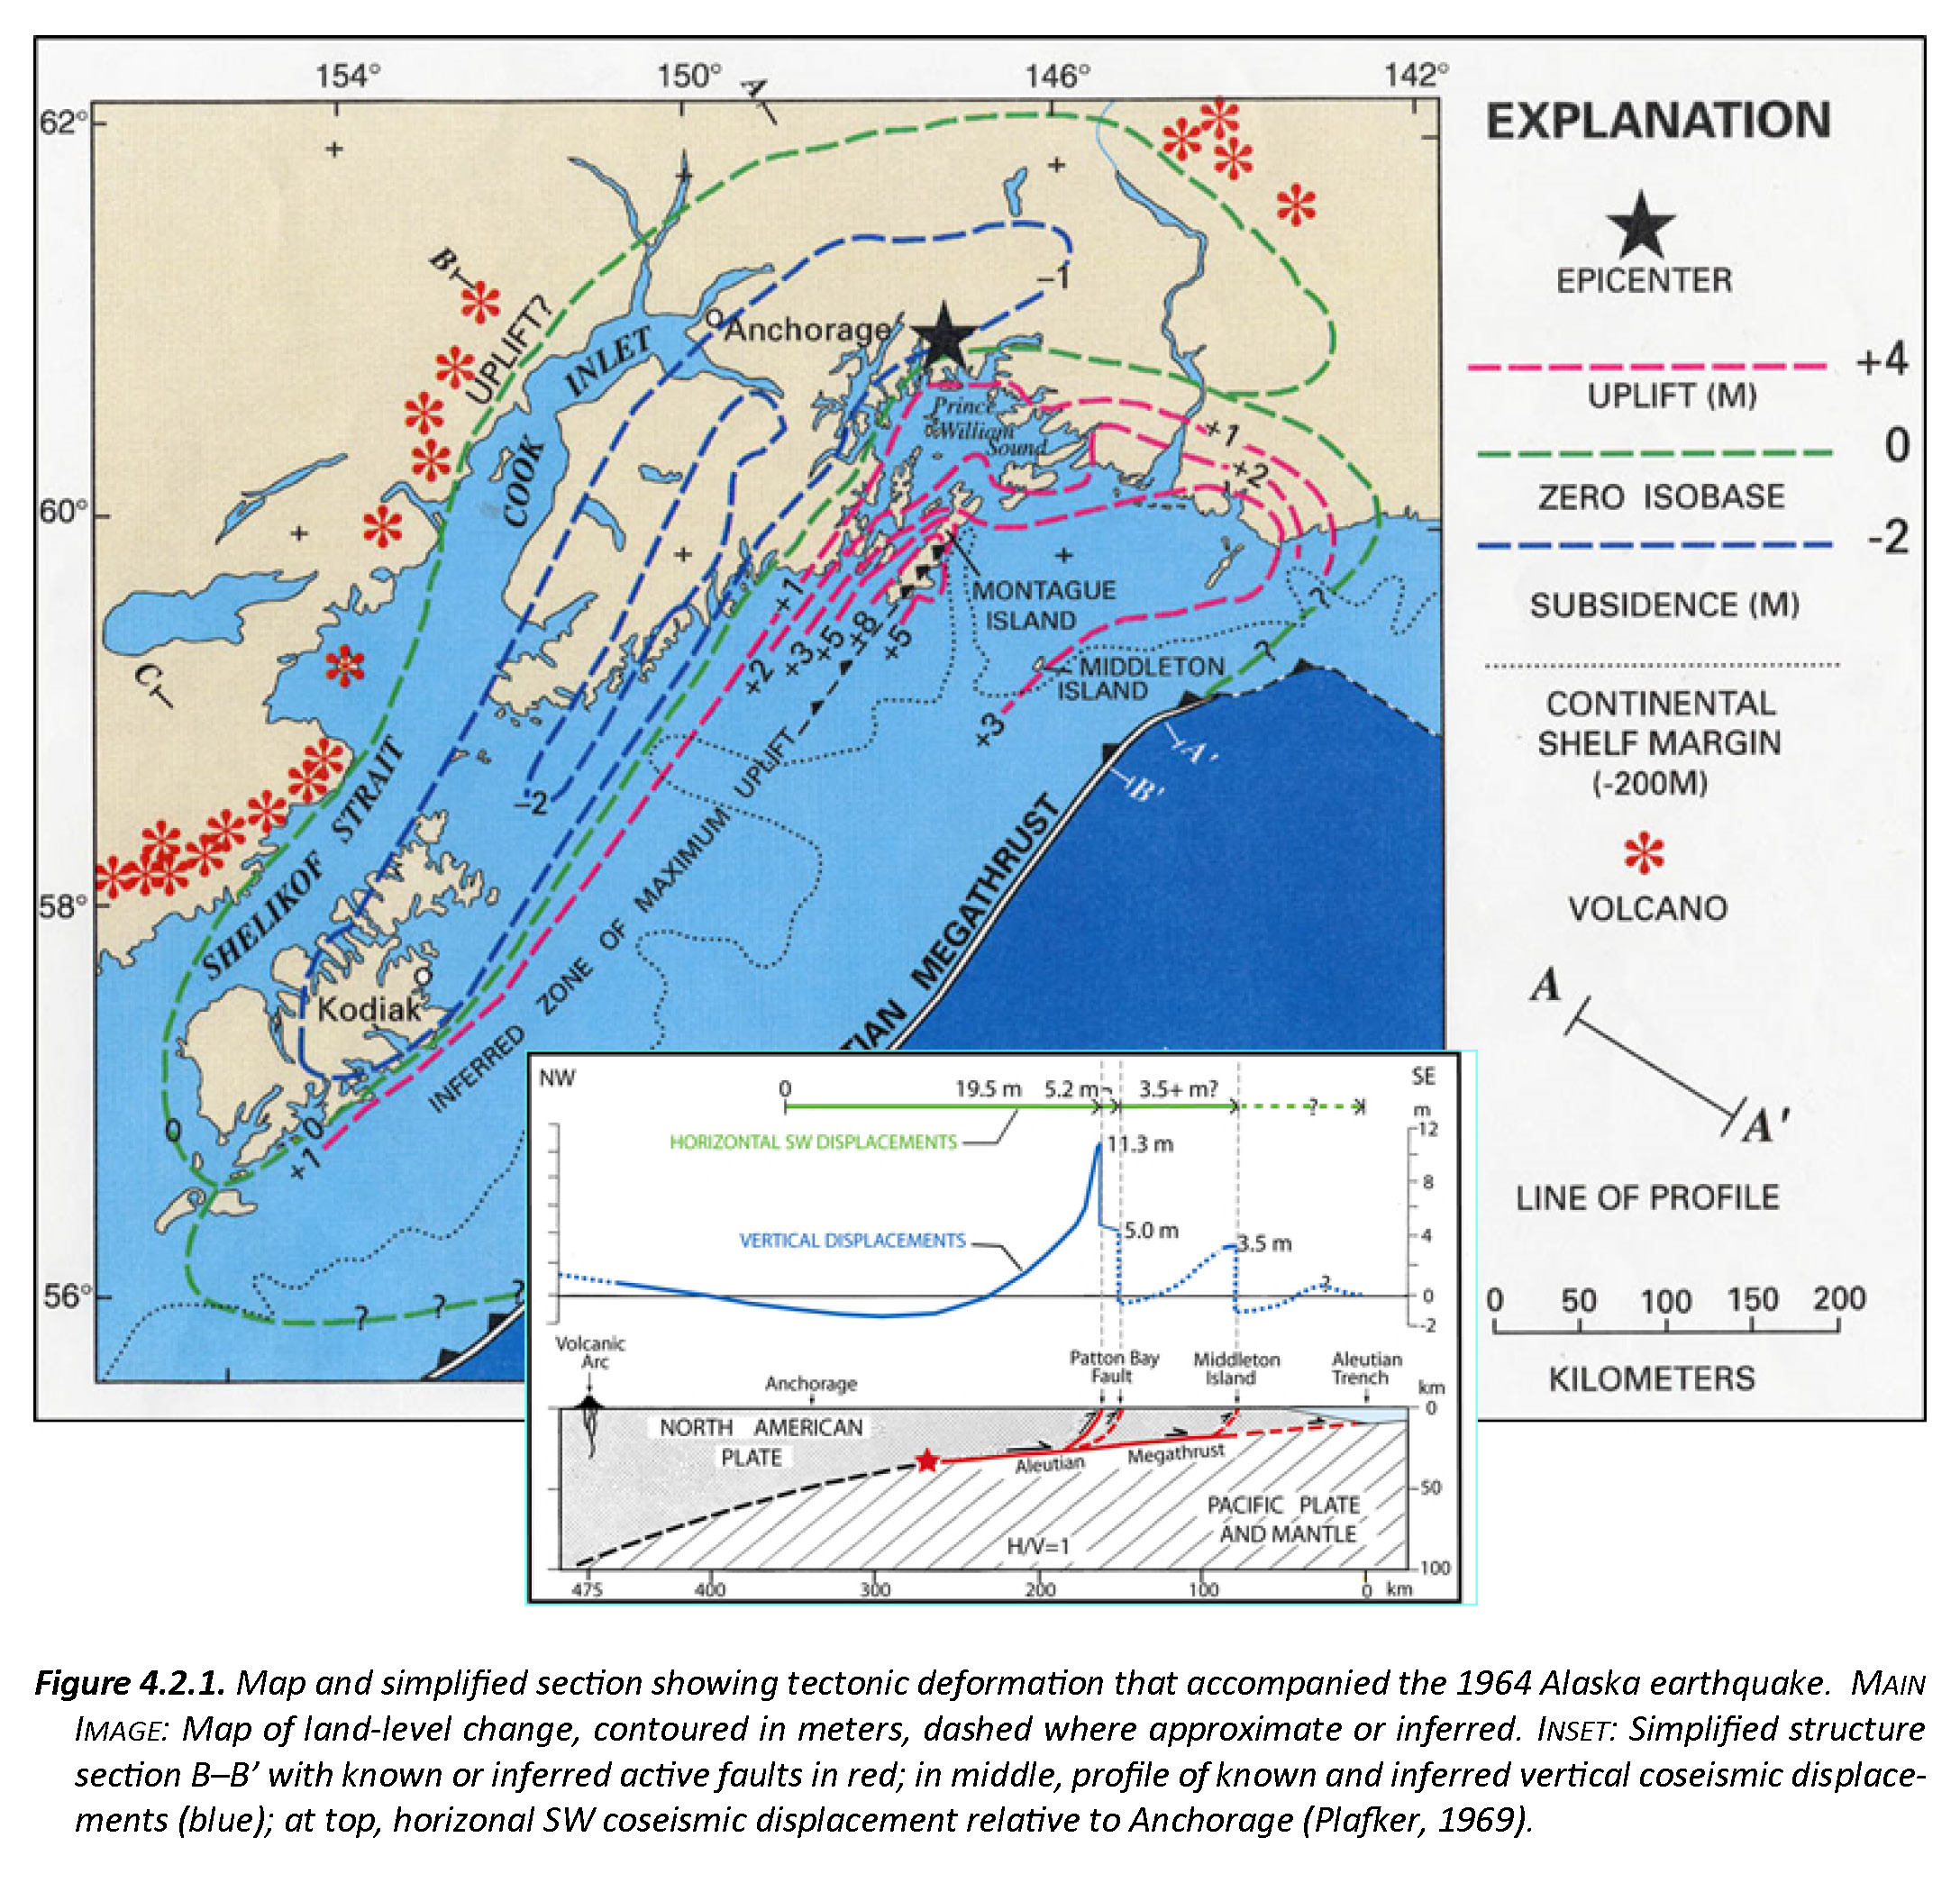
- Here is a figure recently published in the 5th International Conference of IGCP 588 by the Division of Geological and Geophysical Surveys, Dept. of Natural Resources, State of Alaska (State of Alaska, 2015). This is derived from a figure published originally by Plafker (1969). There is a cross section included that shows how the slip was distributed along upper plate faults (e.g. the Patton Bay and Middleton Island faults).
- Here is an animation that shows earthquakes of magnitude > 6.5 for the period from 1900-2016. Above is a map showing the region and below is the animation. This is the URL for the USGS query that I used to make this animation in Google Earth.
- Here is a link to the file for the embedded video below (5 MB mp4)
- Summary of the 1964 Earthquake
- 2017.03.02 M 5.5 Alaska
- 2016.09.05 M 6.3 Bering Kresla (west of Aleutians)
- 2016.04.02 M 6.2 Alaska Peninsula
- 2016.03.27 M 5.7 Aleutians
- 2016.03.12 M 6.3 Aleutians
- 2016.01.24 M 7.1 Alaska
- 2015.11.09 M 6.2 Aleutians
- 2015.11.02 M 5.9 Aleutians
- 2015.11.02 M 5.9 Aleutians (update)
- 2015.07.27 M 6.9 Aleutians
- 2015.05.29 M 6.7 Alaska Peninsula
- 2015.05.29 M 6.7 Alaska Peninsula (animations)
- 1964.03.27 M 9.2 Good Friday
Earthquakes in Alaska
General Overview
Earthquake Reports
References:
- Benz, H.M., Tarr, A.C., Hayes, G.P., Villaseñor, Antonio, Hayes, G.P., Furlong, K.P., Dart, R.L., and Rhea, Susan, 2010. Seismicity of the Earth 1900–2010 Aleutian arc and vicinity: U.S. Geological Survey Open-File Report 2010–1083-B, scale 1:5,000,000.
- Haeussler, P., Leith, W., Wald, D., Filson, J., Wolfe, C., and Applegate, D., 2014. Geophysical Advances Triggered by the 1964 Great Alaska Earthquake in EOS, Transactions, American Geophysical Union, v. 95, no. 17, p. 141-142.
- Plafker, G., 1969. Tectonics of the March 27, 1964 Alaska earthquake: U.S. Geological Survey Professional Paper 543–I, 74 p., 2 sheets, scales 1:2,000,000 and 1:500,000, http://pubs.usgs.gov/pp/0543i/.
- West, M.E., Haeussler, P.L., Ruppert, N.A., Freymueller, J.T., and the Alaska Seismic Hazards Safety Commission, 2014. Why the 1964 Great Alaska Earthquake Matters 50 Years Later in Seismological Research Letters, v. 85, no. 2, p. 1-7.