
Early this morning, we had a M 7.1 earthquake in the Cook Inlet of Alaska. Here is the USGS web page for this earthquake. Due to the magnitude and depth for this earthquake, there is no tsunami risk for CA/OR/WA.
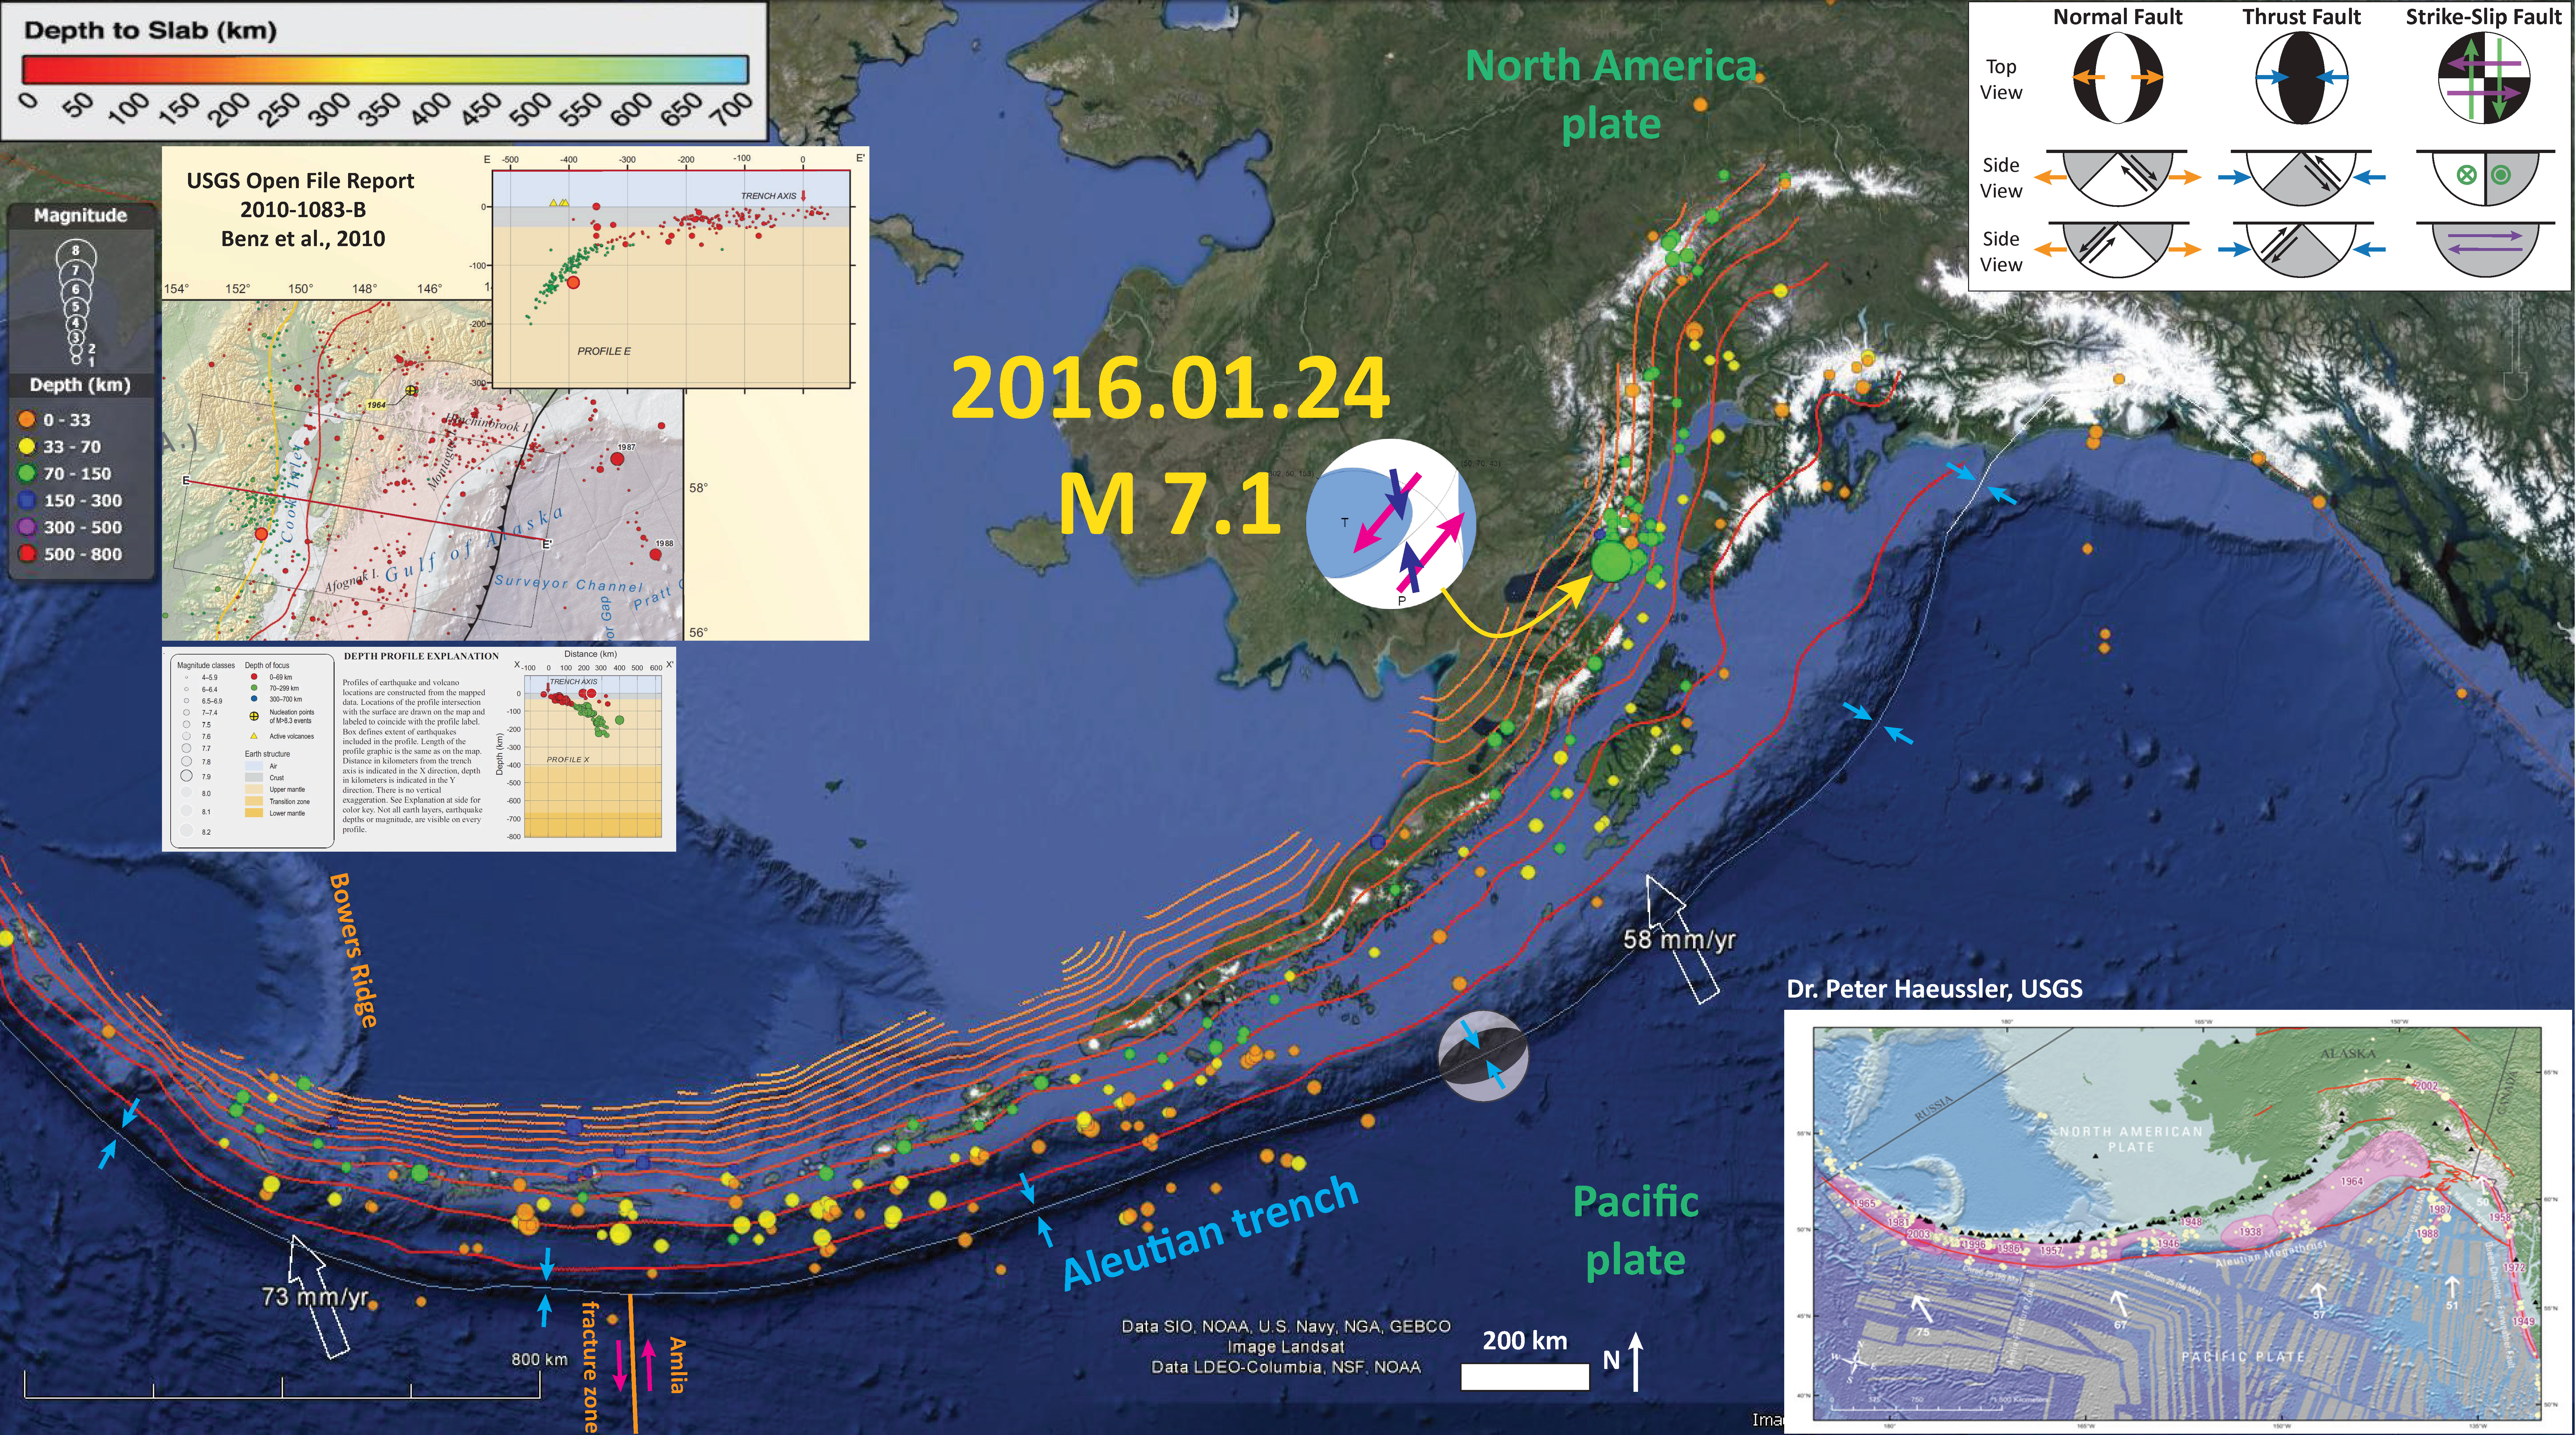
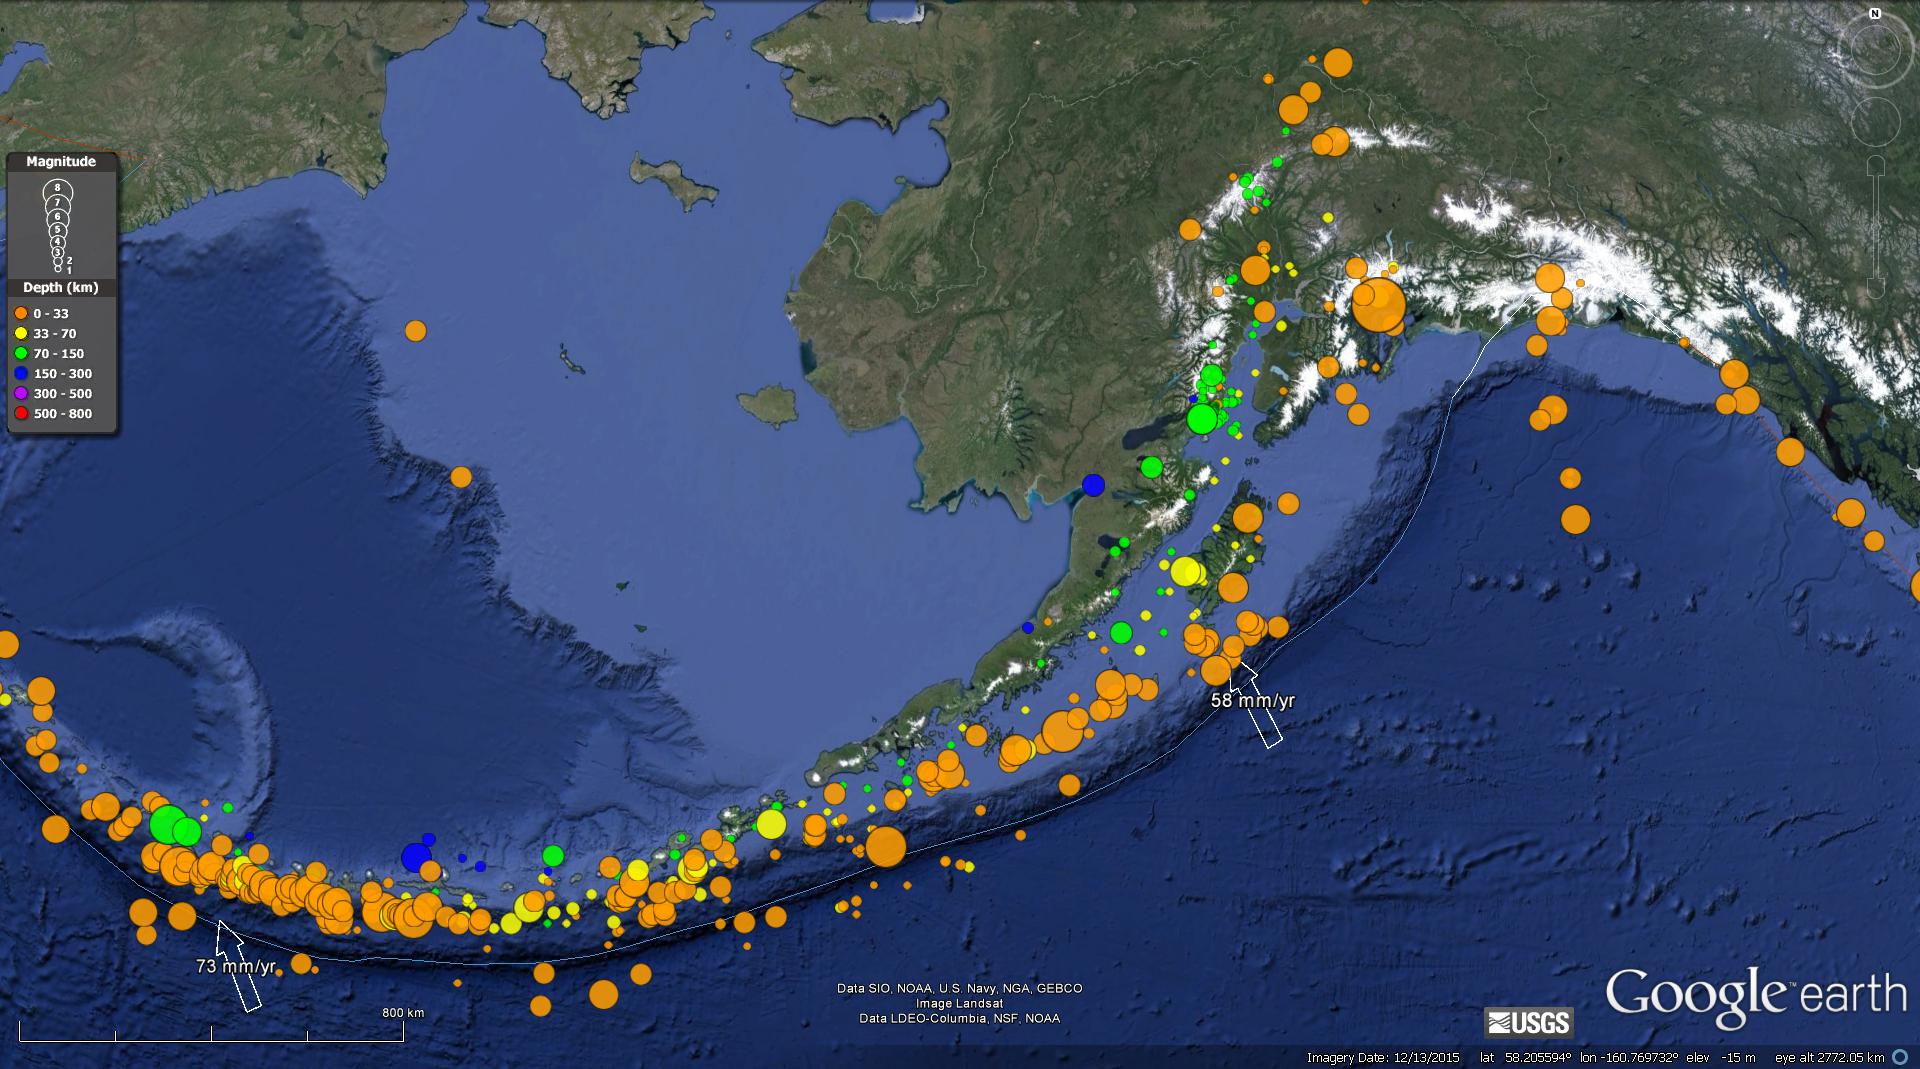
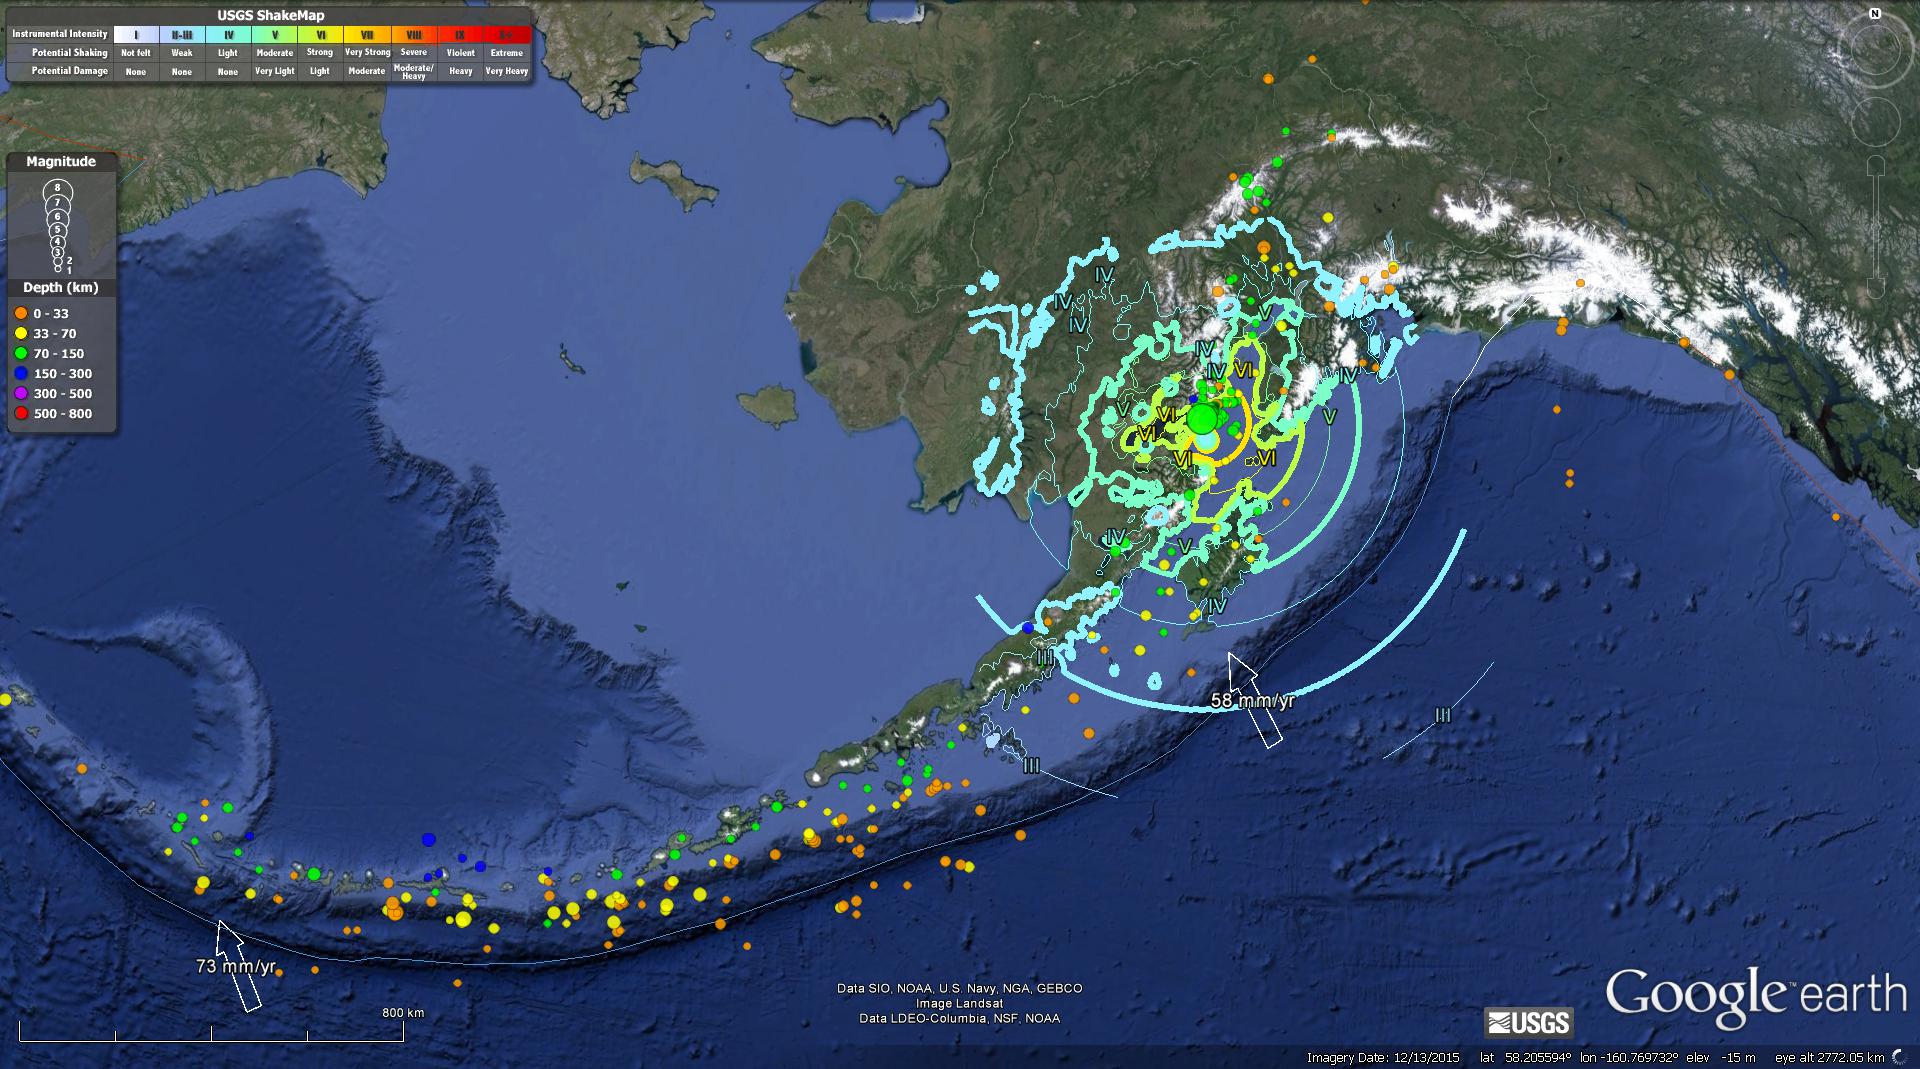
Below is a map that shows the seismicity from the past 30 days, with circles colored for depth (see legend). In the lower right corner is a map produced by Dr. Peter Haeussler from the USGS Alaska Science Center (pheuslr at usgs.gov) that shows the historic earthquakes along the Aleutian-Alaska subduction zone. I also plot the slab contours, which are lines that represent the depth of the subduction zone fault. These were constructed using seismicity and other sources of information from Hayes et al. (2012). There is considerable uncertainty for these contours, but they are the best information that we have about the location of the subduction zone fault. I also include an inset of part of the USGS Open File Report 2010-1083-B (Benz at al., 2010).
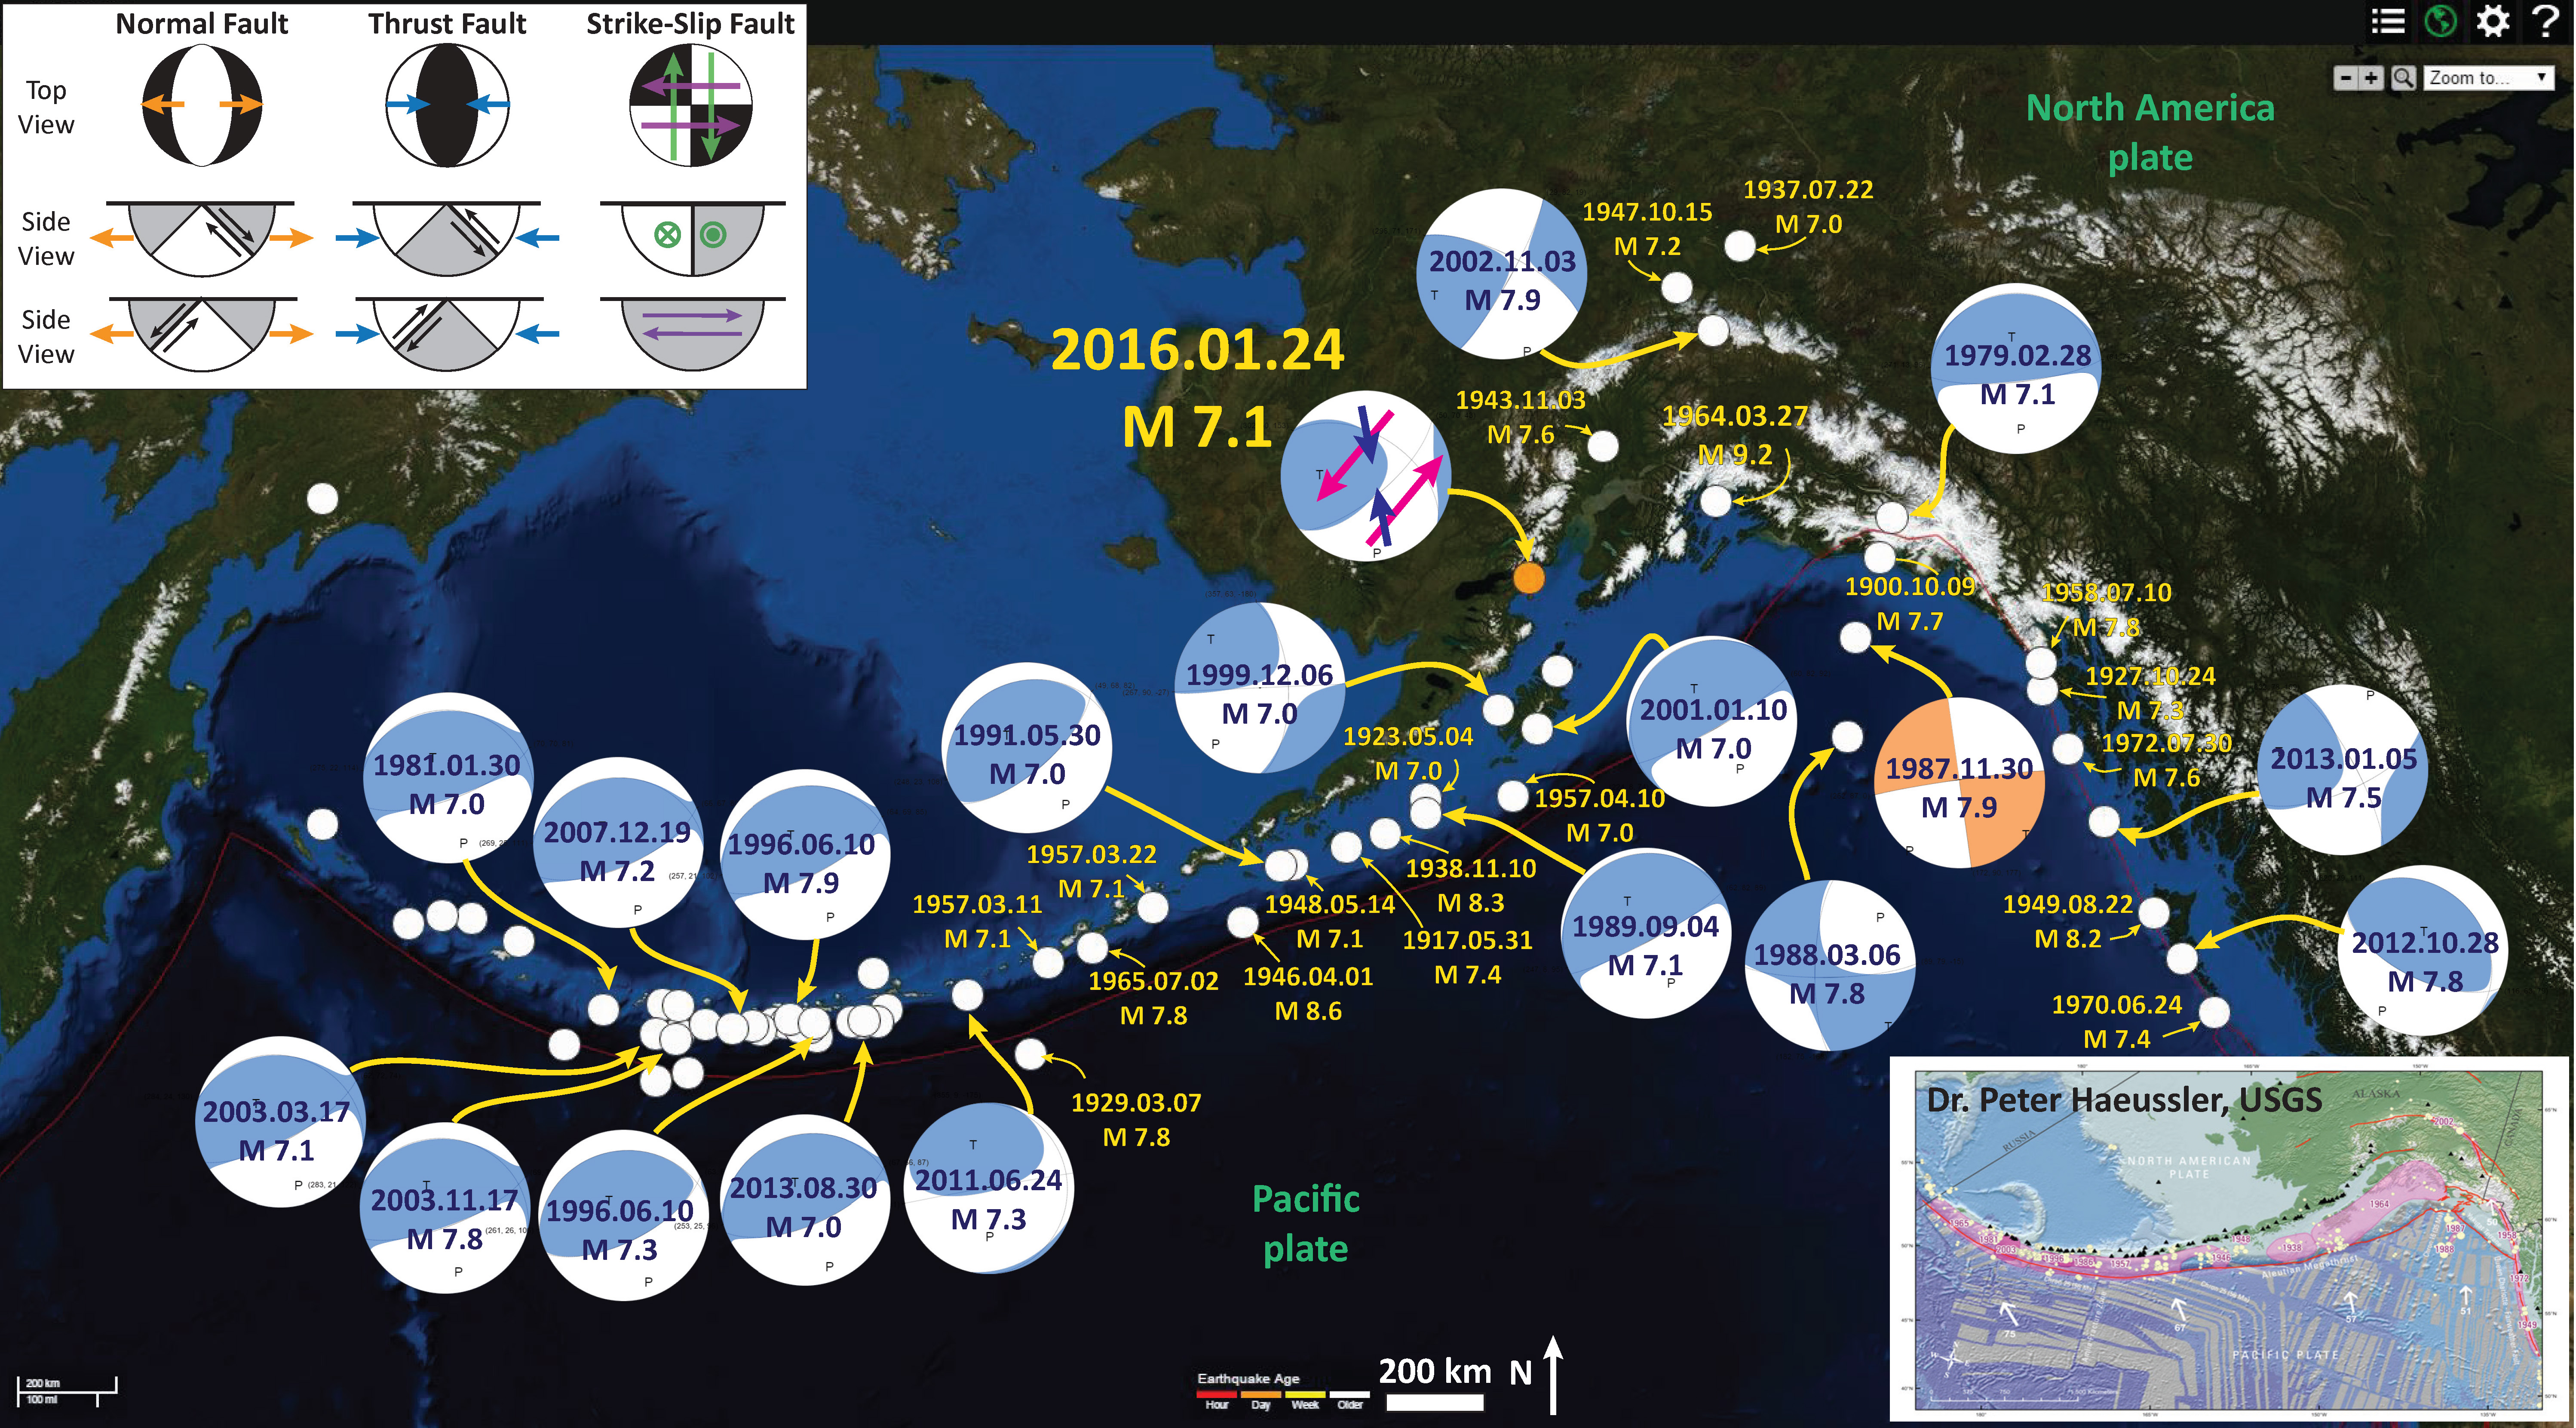
There is a legend that shows how moment tensors can be interpreted. Moment tensors are graphical solutions of seismic data that show two possible fault plane solutions. One must use local tectonics, along with other data, to be able to interpret which of the two possible solutions is correct. The legend shows how these two solutions are oriented for each example (Normal/Extensional, Thrust/Compressional, and Strike-Slip/Shear). There is more about moment tensors and focal mechanisms at the USGS.
This is an interesting earthquake. The depth (~128 km) aligns with the slab contours. This means that we could interpret this to be a subduction zone earthquake. Note how this earthquake is northwest of the 1964 Good Friday earthquake. This earthquake is down-dip from slip during that 27 March 1964 M 9.2 earthquake. I plot the epicenter on the Benz et al. (2010) map and the hypocenter along the cross section from Benz et al. (2010) as red circles. This earthquake occurred in the downgoing Pacific plate.
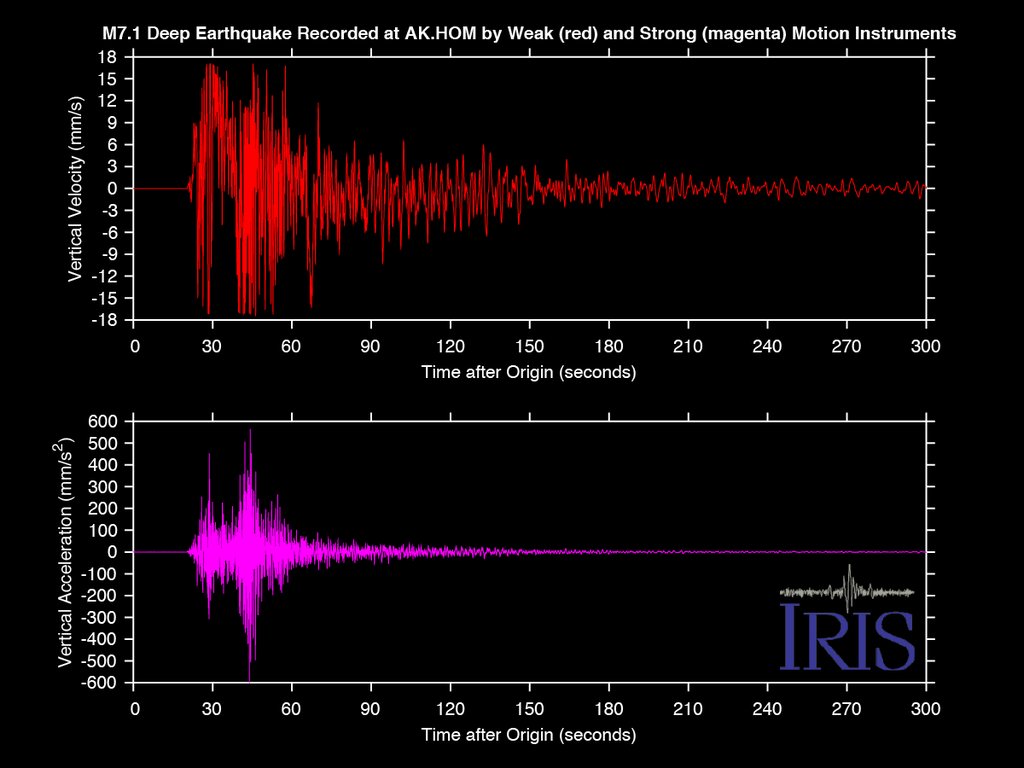
This is the visualized ground motion recorded in Homer, AK from the M7.1 Alaska earthquake on January 24, 2016. High pass filtered at 0.1Hz. Made with SeismoVisualize.
Here is a link to download the embedded video below (8 MB mp4).
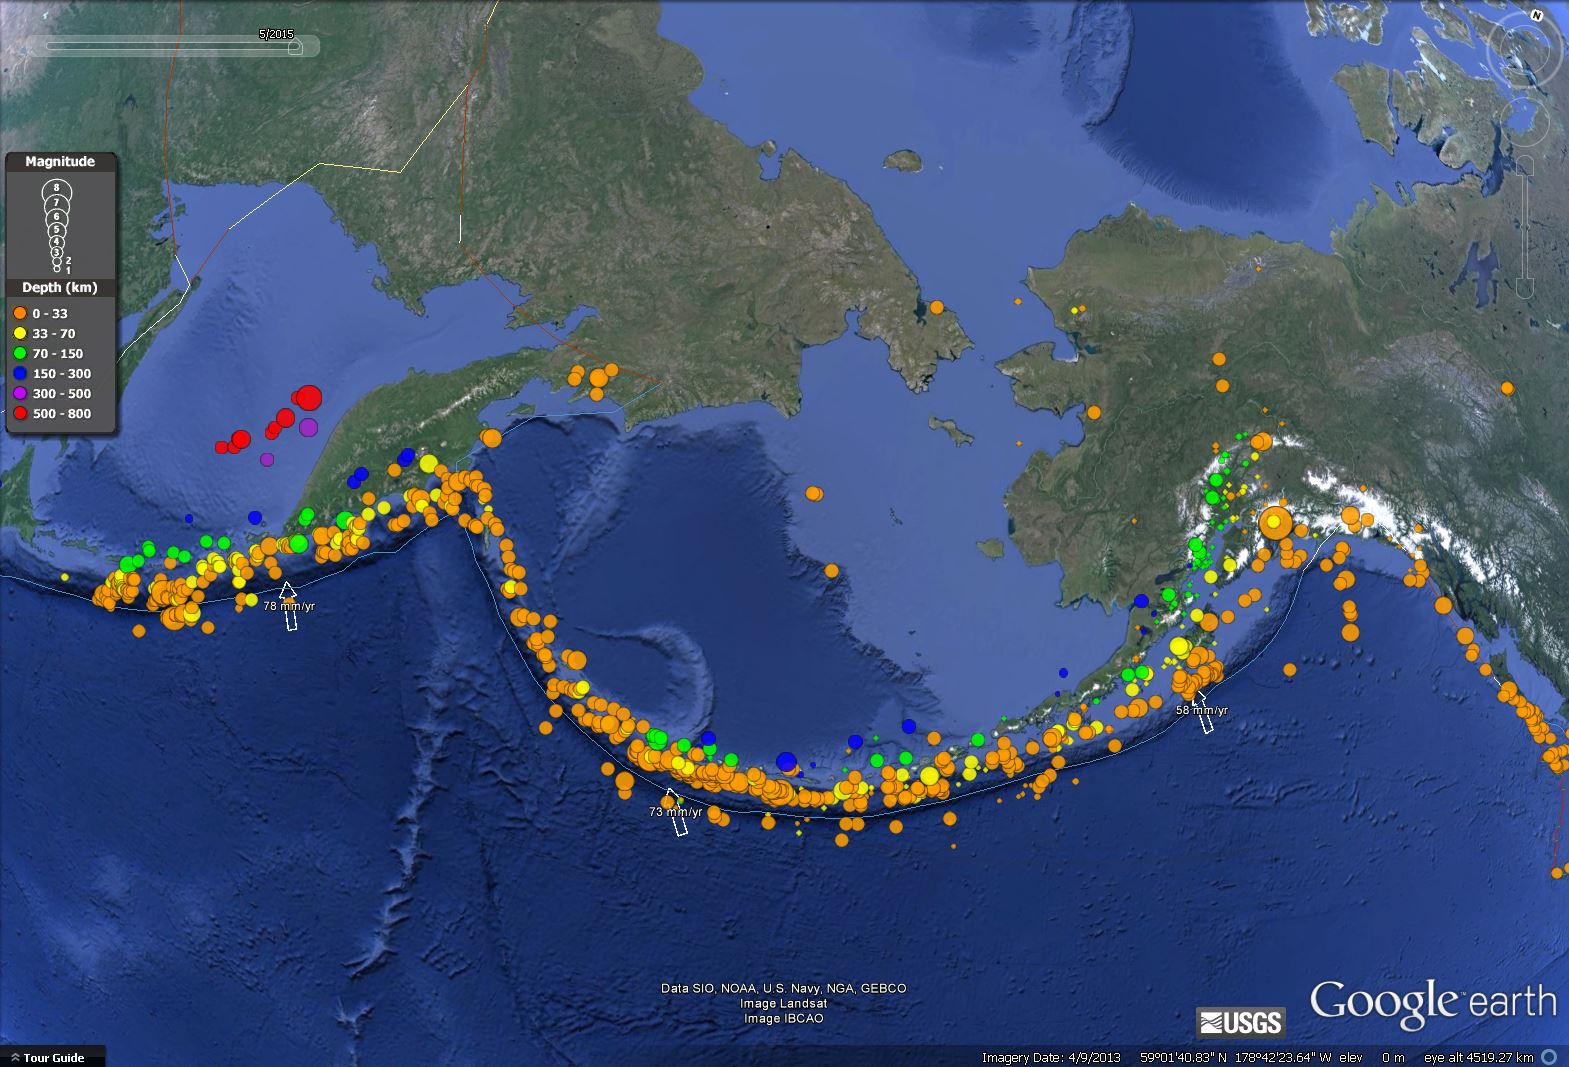
Here is a map for the earthquakes of magnitude greater than or equal to M 7.0 between 1900 and today. This is the USGS query that I used to make this map. One may locate the USGS web pages for all the earthquakes on this map by following that link.
Here is a map that shows the regional extent of the 1964 earthquake. Regions of coseismic uplift/subsidence are delineated by blue/red polygons.

This animation shows the underlying causes of that earthquake, and tells how research done on the ground deformation contributed to confirmation of early theories of plate tectonics. More background material about this animation is found here. Here is a download link for the embedded video below (85 MB mp4).
Here is a large scale map (zoomed in) for the local scale, showing the main shock and the aftershocks. These aftershocks show an east-northeast trend.

Dr. Peter Haeussler produced a cross section for this region. Below is his description of this figure.
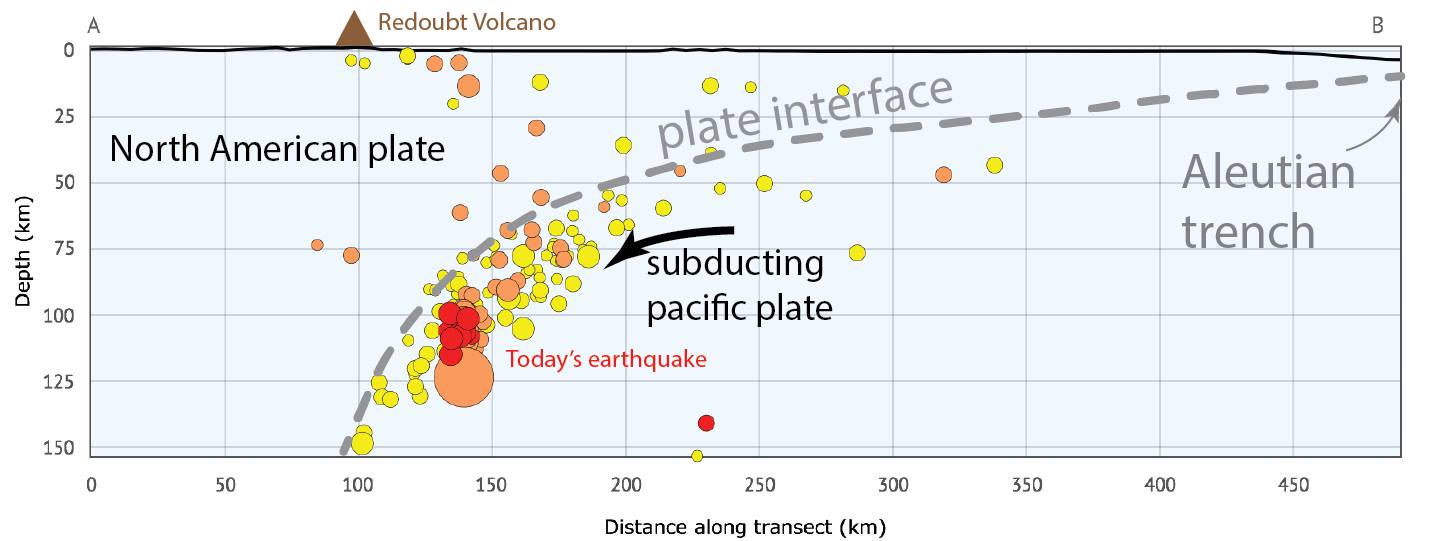
I made up a quick diagram (thanks Alaska Earthquake Center tools) showing the tectonic setting of the earthquake. This was a “Benioff zone” event, which means that the earthquake is related to bending of the subducting Pacific Plate as it slides into the mantle.
More interesting thoughts. Many earthquakes that are due to bending of the downgoing slab are in the upper part of the downgoing plate and these earthquakes are extensional due to the extension in the upper part of the plate due to the bending. Well, the opposite happens on the lower part of the bending plate. This is what happened during this M 7.1 earthquake, it is a compressional earthquake (in addition to the strike-slip part).
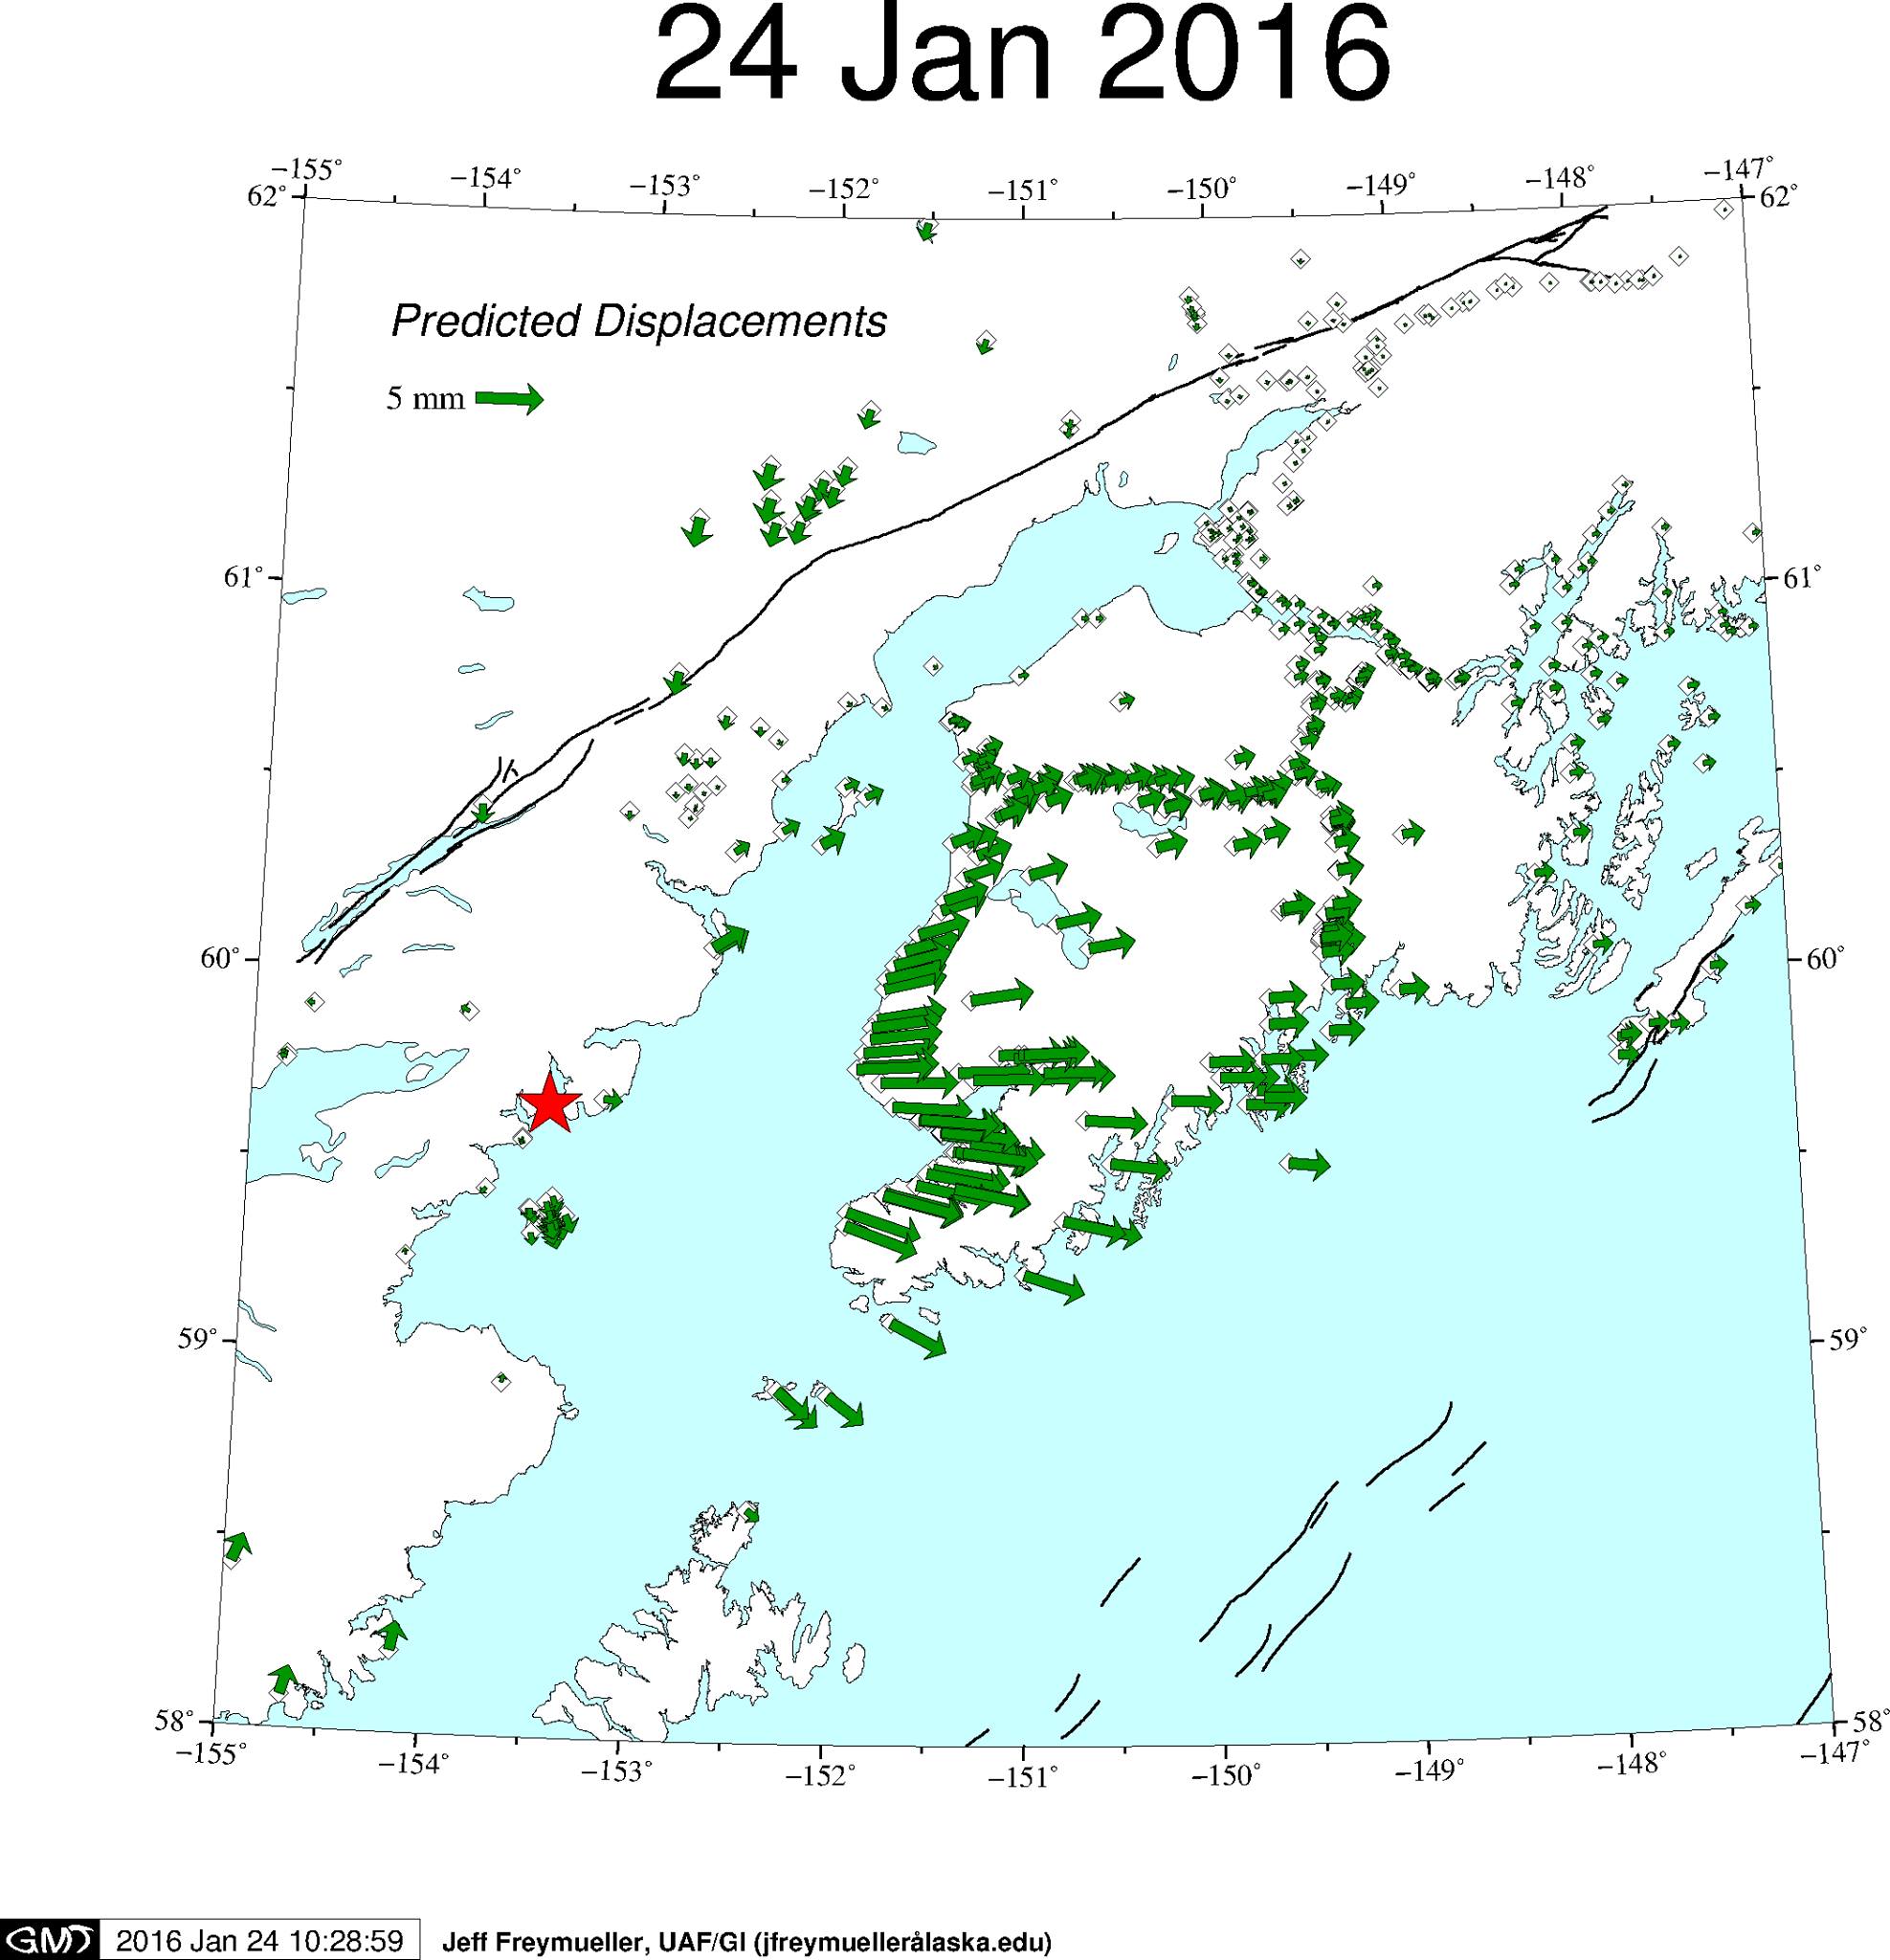
Here is a plot of static displacements for GPS sites as modeled by Jeff Freymueller at University of Alaska, Fairbanks (jeff.freymueller at gi.alaska.edu).
Here is the seismic record from Homer, AK. This was tweeted by Andy Frassetto at IRIS.
Here is an animation from Matt Gardine, showing ug PGA (500 = 0.5 PGA) measured at different locations.
I put together an animation of the seismicity for this region from the period of 1900-2016, for earthquakes of magnitude greater than or equal to M 6.5. Below is a map showing all these earthquakes and below that is the animation.
- Here is a link to the embedded video below (25 MB mp4) .
Here is a video from Andrew Sayers:
Crazy earthquake in Kasilof
Posted by Andrew Sayers on Sunday, January 24, 2016
Here is a map that shows the seismicity (1960-2014) for this plate boundary. This is the spatial extent for the video below.
Here is a link to the file to save to your computer.
Here is a map showing the shaking intensity that uses the Modified Mercalli Intensity (MMI) scale. The MMI scale is a qualitative scale of the ground motions. There is more about the MMI here.
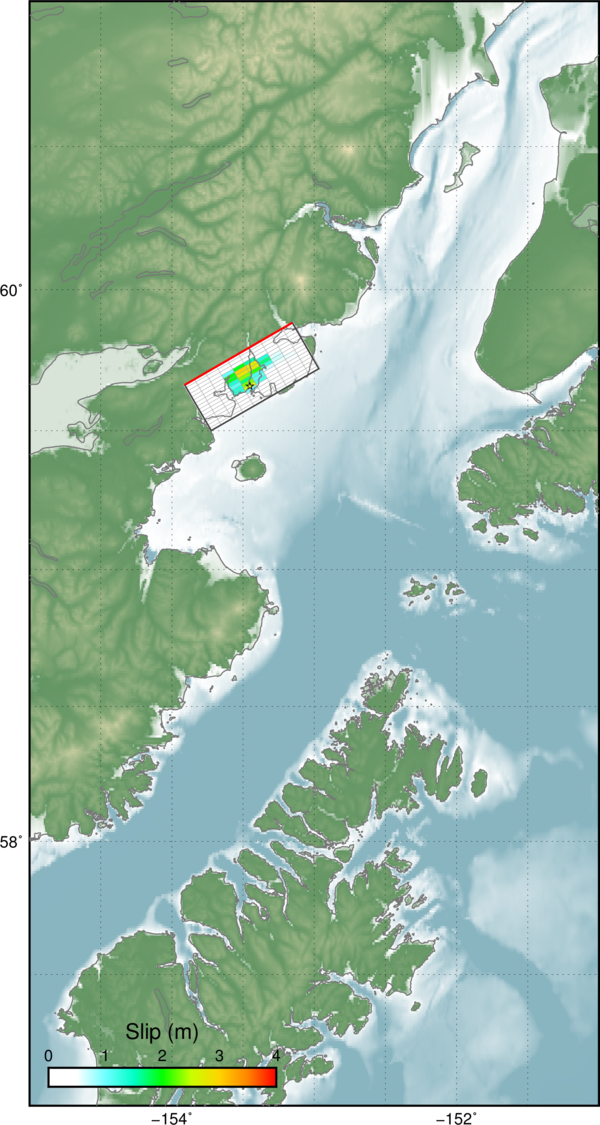
The USGS has prepared a fault slip model.
Today’s earthquake occurred near the inferred segment boundary between the locked Kodiak and creeping Kenai segments of the megathrust. Here is a map from Kelsey et al. (2015). They were looking at beach ridges on the Kenai penninsula, which are unrelated to this M 7.1 earthquake. I include the figure caption for part A, below as a blockquote.

A. Tectonic setting of the eastern Alaska-Aleutian subduction zone megathrust. Bold line delineates the surface trace of the megathrust, barbs on upper (North American) plate. Vertical deformation during the 1964 great Alaska earthquake depicted by two adjoining margin-parallel belts: a region of landward subsidence (blue) and a region of seaward uplift (red) (Plafker, 1969). Areas of highest slip occurred below the Prince William Sound and Kodiak segments, which are currently locked currently; while the intervening Kenai segment is creeping presently (Freymueller et al., 2008).
Based upon their work, they interpret that there may or may not be a segment boundary in this location (Kelsey et al., 2015).

Three alternatives for the tectonic context of the penultimate AD 1530-1840 Kenai earthquake in comparison to the AD 1964 earthquake and the third oldest earthquake. A. Coseismic uplift extent of the AD 1964 earthquake on which is superposed the inferred coseismic uplift extent of the AD 1788 rupture, if this historic earthquake involved rupture of the Kenai segment (alternative A). The colors show geodetic coupling ratio units as a fraction of the contemporary Pacific-North American plate rate, taken from Zweck et al., 2002. B. Alternative B (yellow) is the inferred uplift extent of the AD 1430-1650 subduction zone earthquake if this earthquake involved rupture of the Kenai segment. Alternative C (red) is the inferred uplift extent of the penultimate Kenai earthquake if earthquake rupture involved the Kenai segment alone. C. Inferred uplift extent for the ~900 cal yr BP earthquake, which is recorded in Prince William Sound, on the Kenai Peninsula (this study) as well as on Kodiak and Sitkinak Islands.
-
Here are some photos from Zach Moore and Myles Thomas posted on the KTUU news website. Here is a Q&A from Dr. Michael West, the Alaska state seismologist.
- 1
- 2
- 3
- 4
- 5
- 6
- 7
- 8
- 9
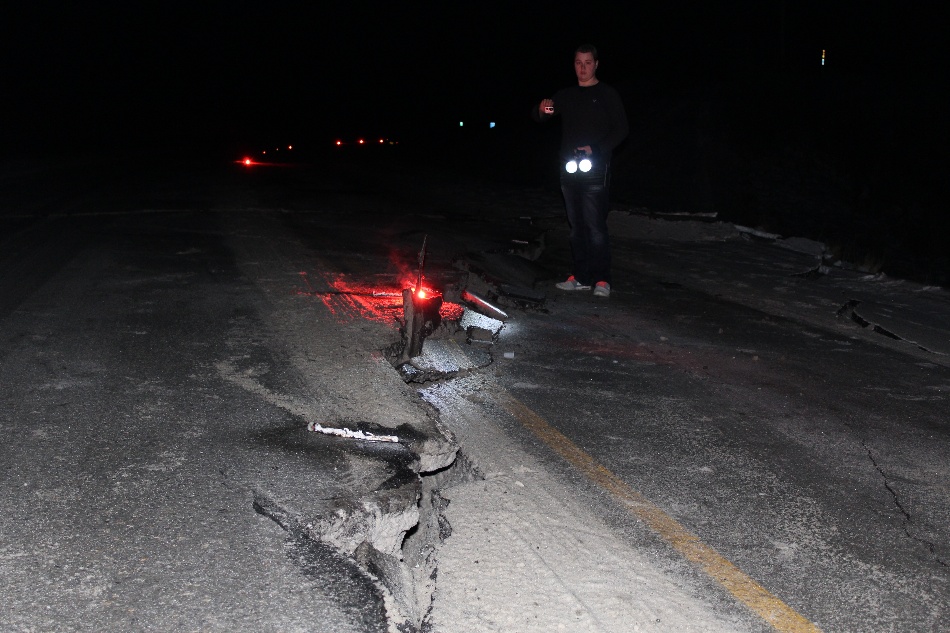
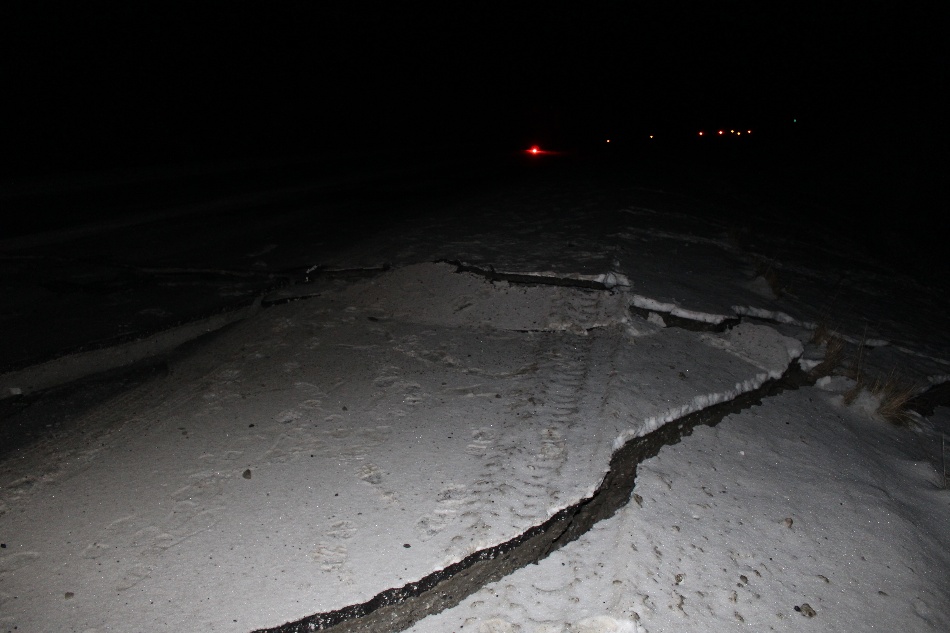
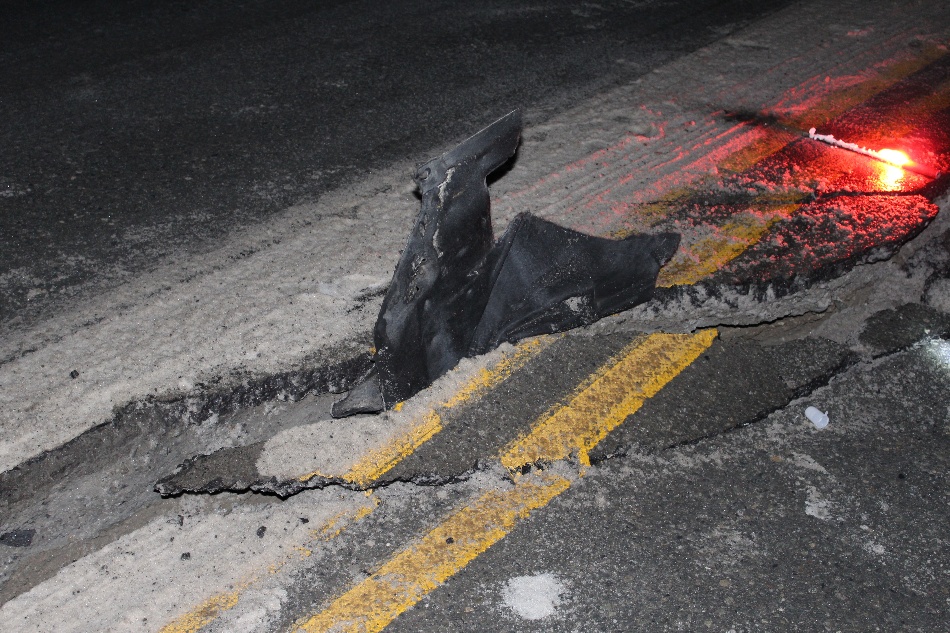
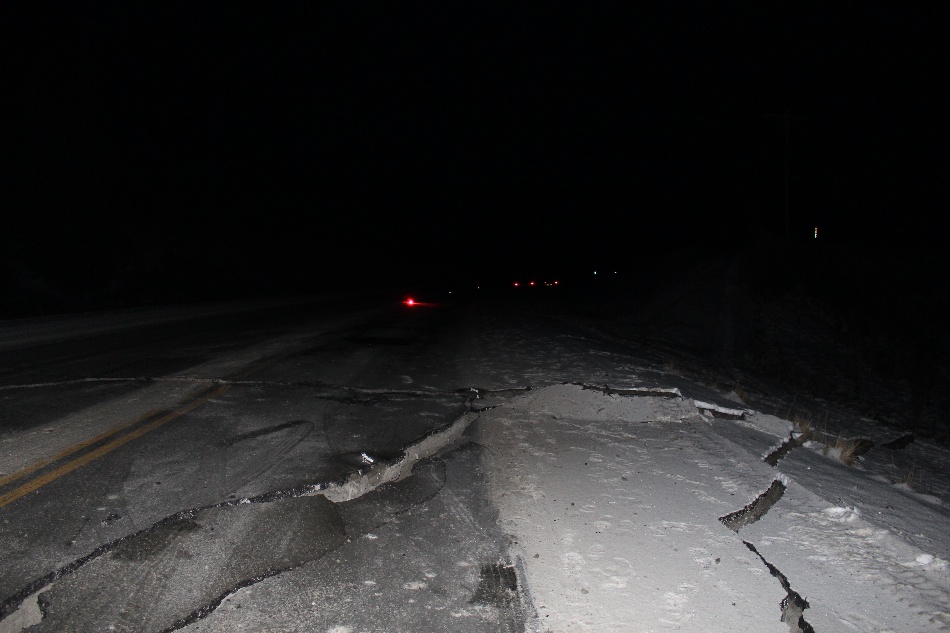
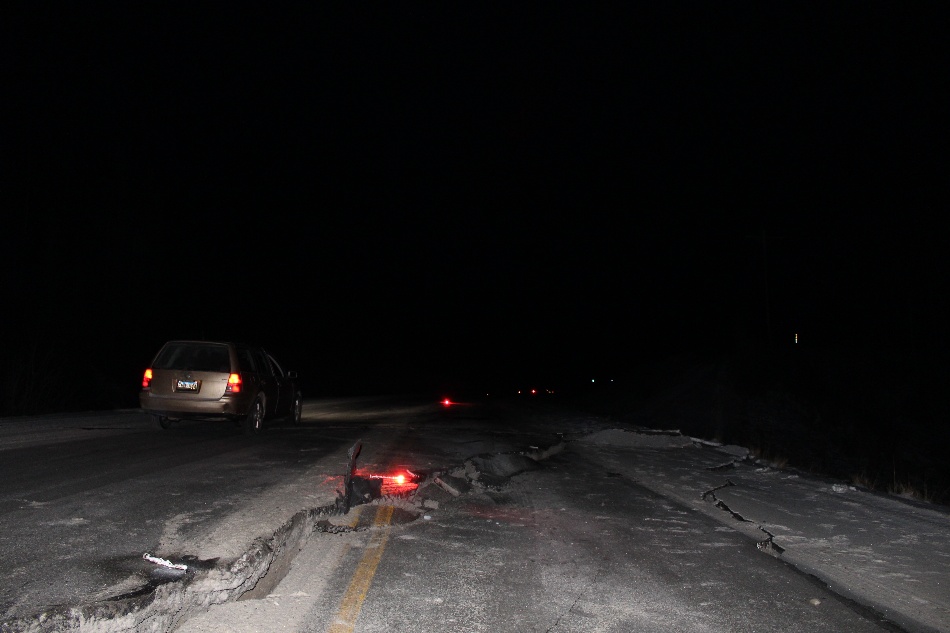
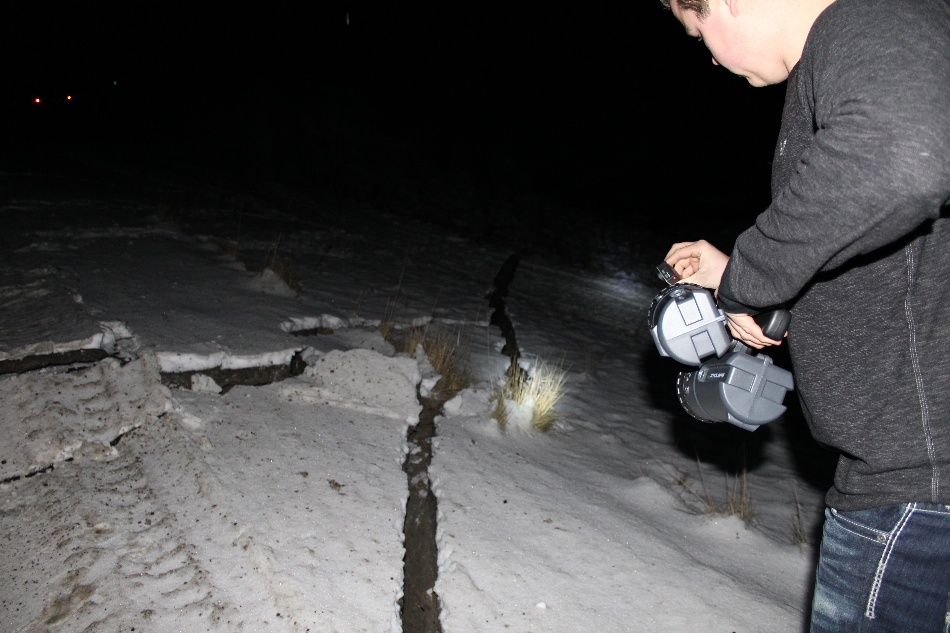
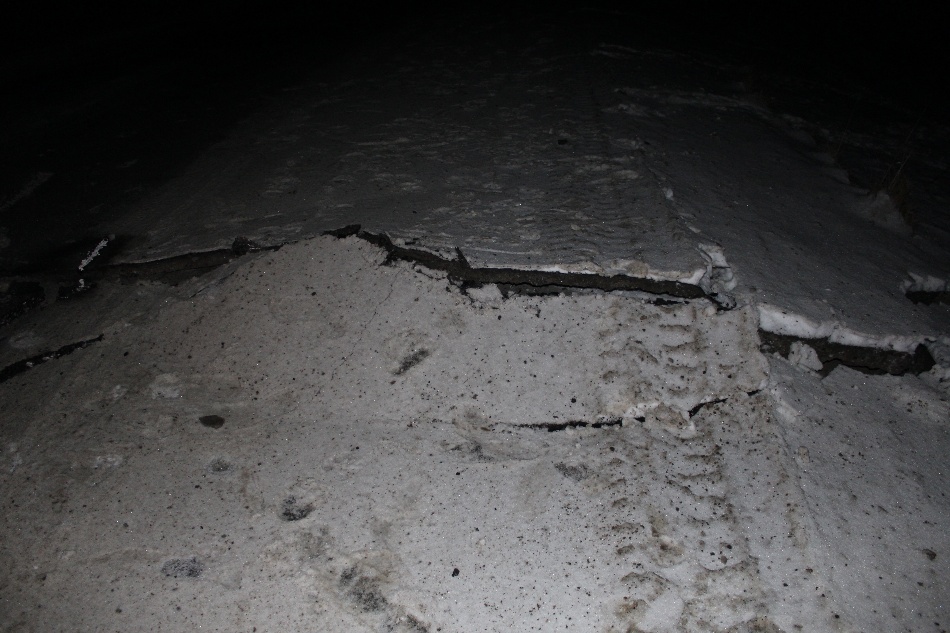
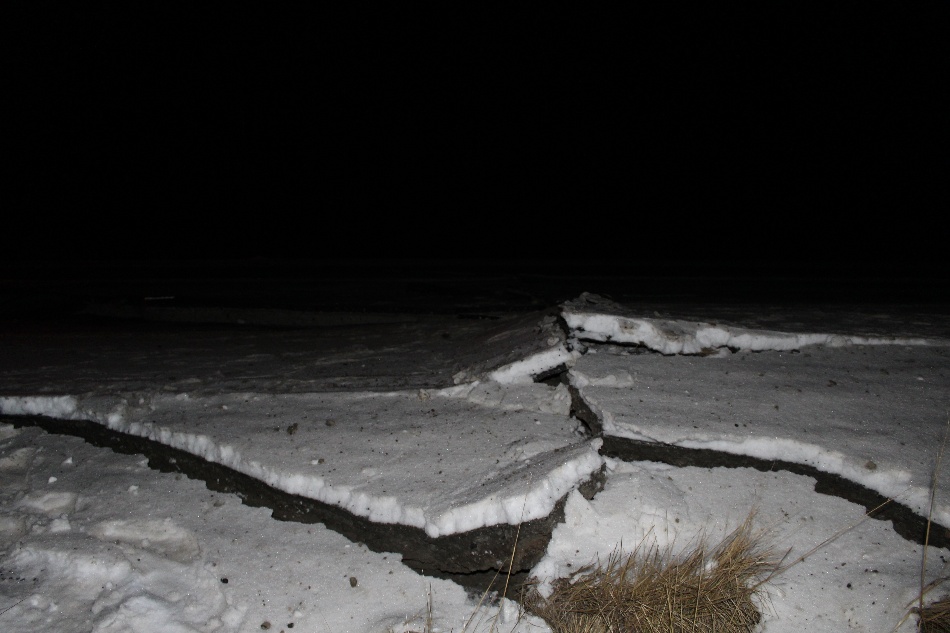
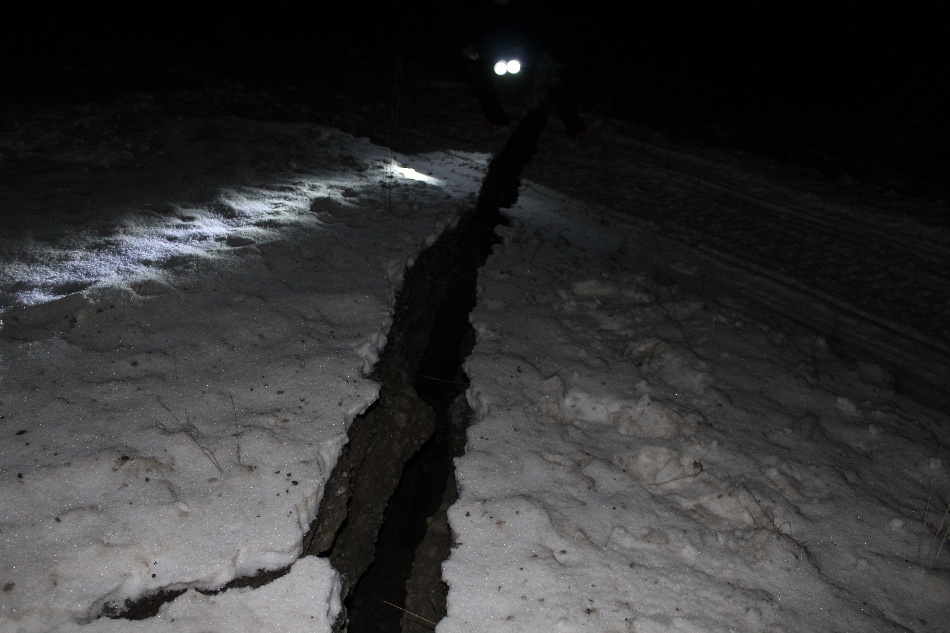
Here is more about the highway:
Video of the damage to approximately Mile 1 of K-Beach Road in Kasilof at about 10 am Sunday. The road has been reduced to one lane.
Posted by KSRM 920 AM on Sunday, January 24, 2016
-
References:
- Benz, H.M., Tarr, A.C., Hayes, G.P., Villaseñor, Antonio, Hayes, G.P., Furlong, K.P., Dart, R.L., and Rhea, Susan, 2010. Seismicity of the Earth 1900–2010 Aleutian arc and vicinity: U.S. Geological Survey Open-File Report 2010–1083-B, scale 1:5,000,000.
- Hayes, G. P., D. J. Wald, and R. L. Johnson, 2012. Slab1.0: A three-dimensional model of global subduction zone geometries in J. Geophys. Res., 117, B01302, doi:10.1029/2011JB008524.
- Kelsey, H.M., Witter, R.C., Englehart, S.E., Briggs, R., Nelson, A., Haeussler, P., Corbett, D.R., 2015. Beach ridges as paleoseismic indicators of abrupt coastal subsidenceduring subduction zone earthquakes, and implications for Alaska Aleutian subduction zone paleoseismology, southeast coast of the Kenai Peninsula, Alaska in Quaternary Science Reviews, v. 113, p. 147-158.
4 thoughts on “Earthquake Report: Alaska!”