We just had an earthquake along the Alaska Peninsula. The magnitude is currently set at 6.7 on the USGS website. The Peninsula is a volcanic arc that forms as a result of the subduction of the Pacific plate beneath the North America plate. The second largest earthquake ever recorded by seismometers occurred on March 27, 1964, known as the Good Friday Earthquake. I have posted some material about this earthquake.
Here is an early map showing the epicenter of the Mw = 6.7 earthquake. This earthquake has an oblique strike-slip moment tensor fault plane solution. Based upon the block rotation in the forearc to the west, I suspect that this may be a N-S right-lateral earthquake.
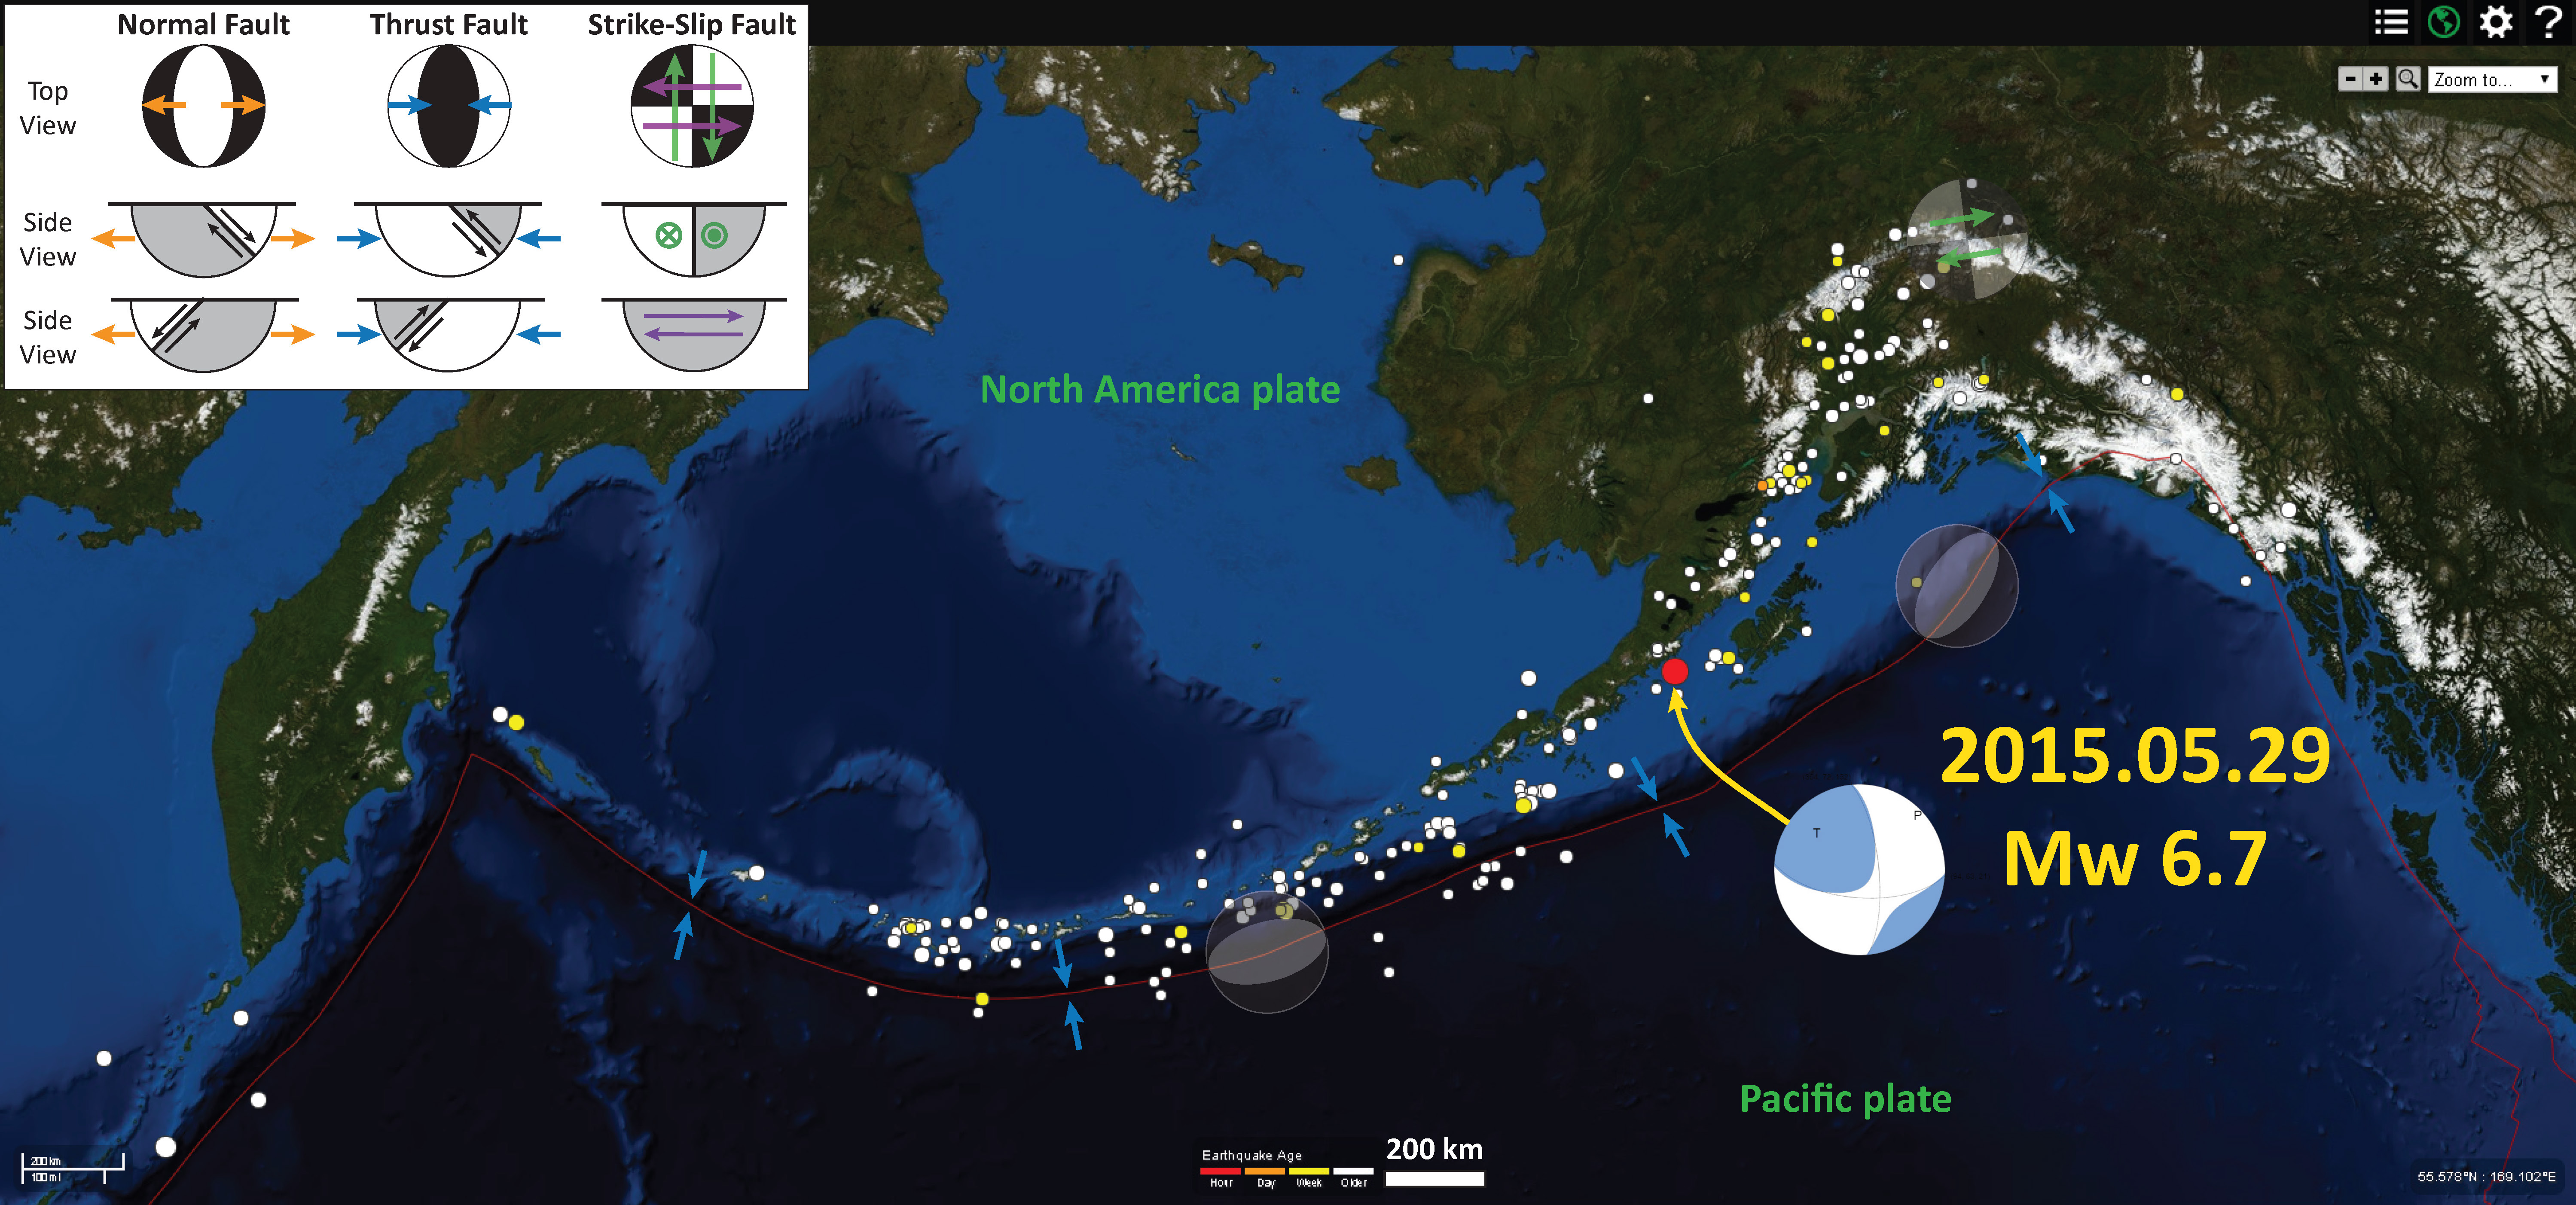
-
Here are a couple pages that discuss the Good Friday Earthquake and the general tectonic setting along this plate boundary.
- 1964 Earthquake Before and After Photo Tour
- 1964 Earthquake Seismic Wave Propagation Animation
- June 2013 M 7.9 Rat Islands Earthquake. This page also has some cool animations from the Rat Island Earthquake and tectonic maps of the Aleutian Islands.
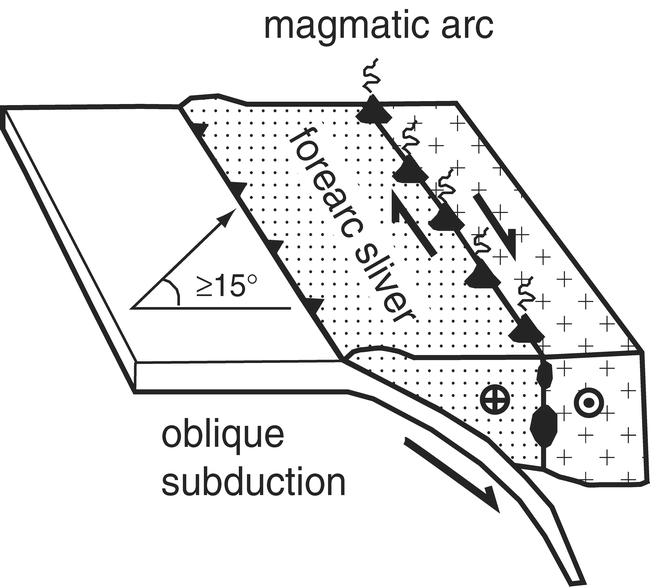
Here is a graphic showing what a forearc sliver might look like (from GSA).
Here is a map from Krutikov et al. 2008 (Active Tectonics and Seismic Potential of Alaska, Geophysical Monograph Series 179 Copyright 2008 by the American Geophysical Union. 10.1029/179GM07)
Note that there are blocks that are rotating to accomodate the oblique convergence. There are also margin parallel strike slip faults that bound these blocks. These faults are in the upper plate, but may impart localized strain to the lower plate, resulting in strike slip motion on the lower plate (my arm waving part of this). Note how the upper plate strike-slip faults have the same sense of motion as these deeper earthquakes.
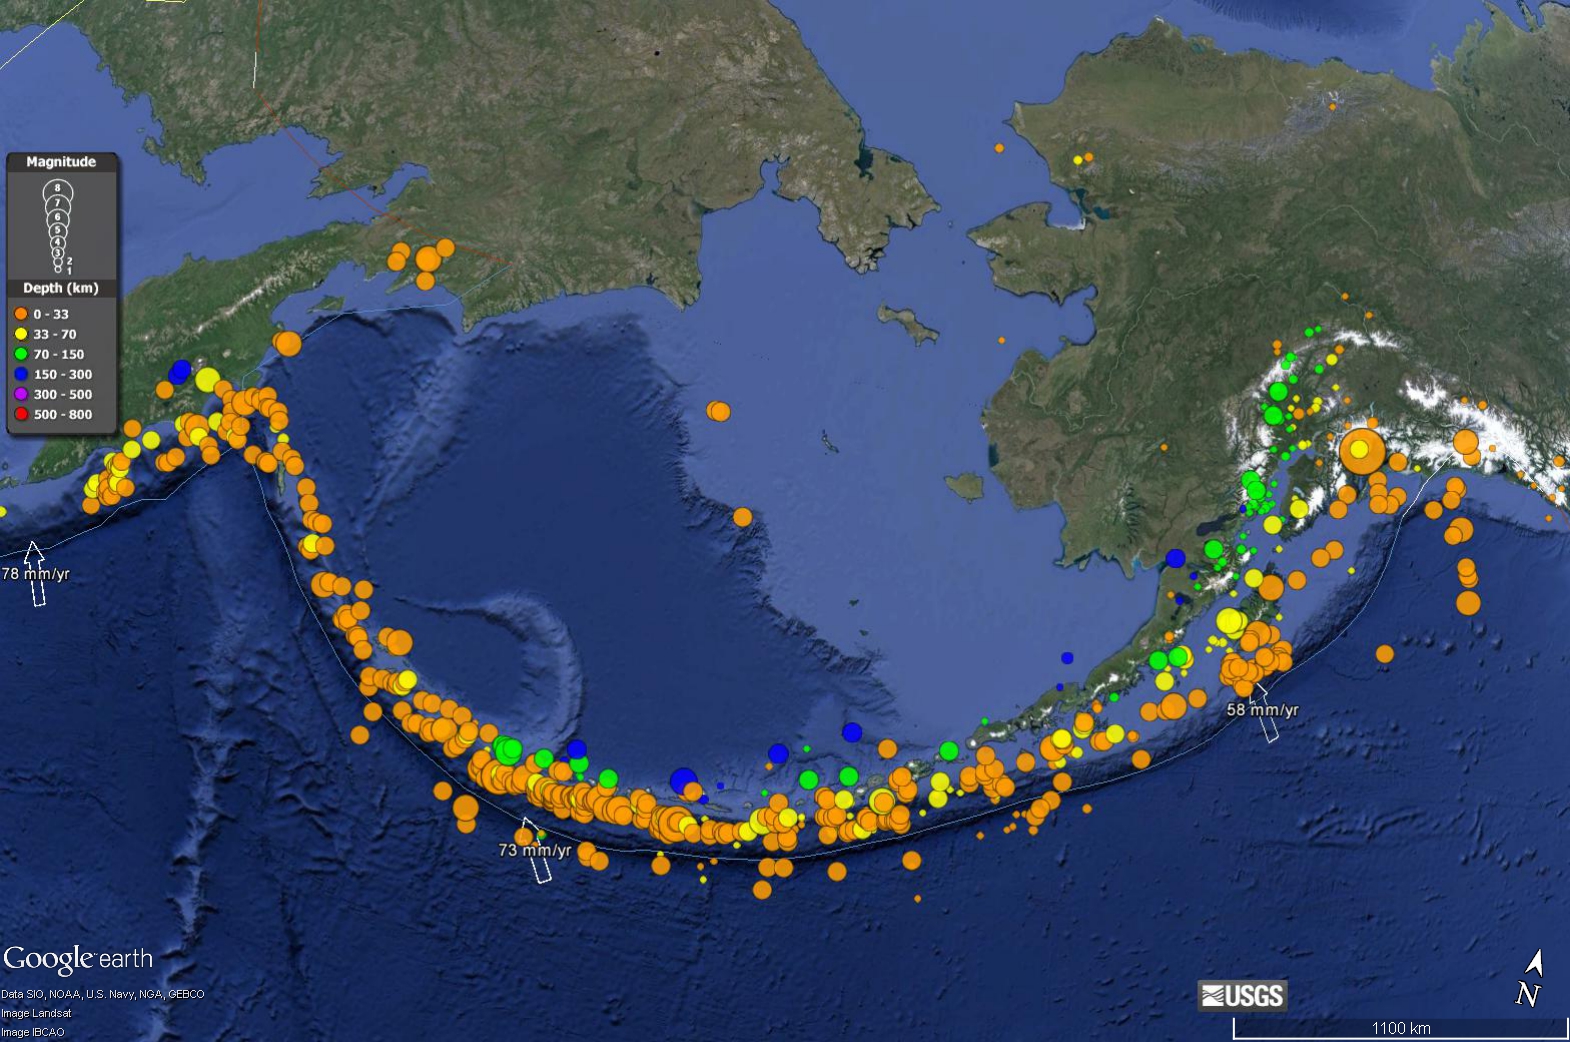
This map shows the region with historic earthquakes extending back to 1960, of magnitude 6,0 and larger. The largest circle in the upper right part of the map is the epicenter for the Good Friday Earthquake.
Here is a map that shows the regional extent of the 1964 earthquake. Regions of coseismic uplift/subsidence are delineated by blue/red polygons.

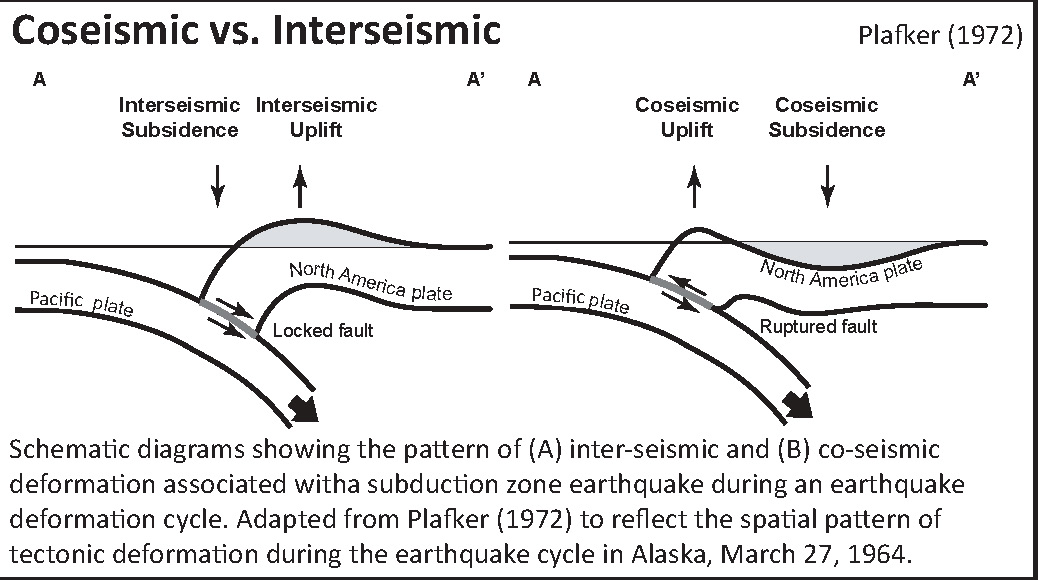
This shows a cross section of a subduction zone through the two main parts of the earthquake cycle. The interseismic part (inbetween earthquakes) and the coseismic part (during earthquakes). This was developed by George Plafker and published in his 1972 paper on the Good Friday Earthquake.
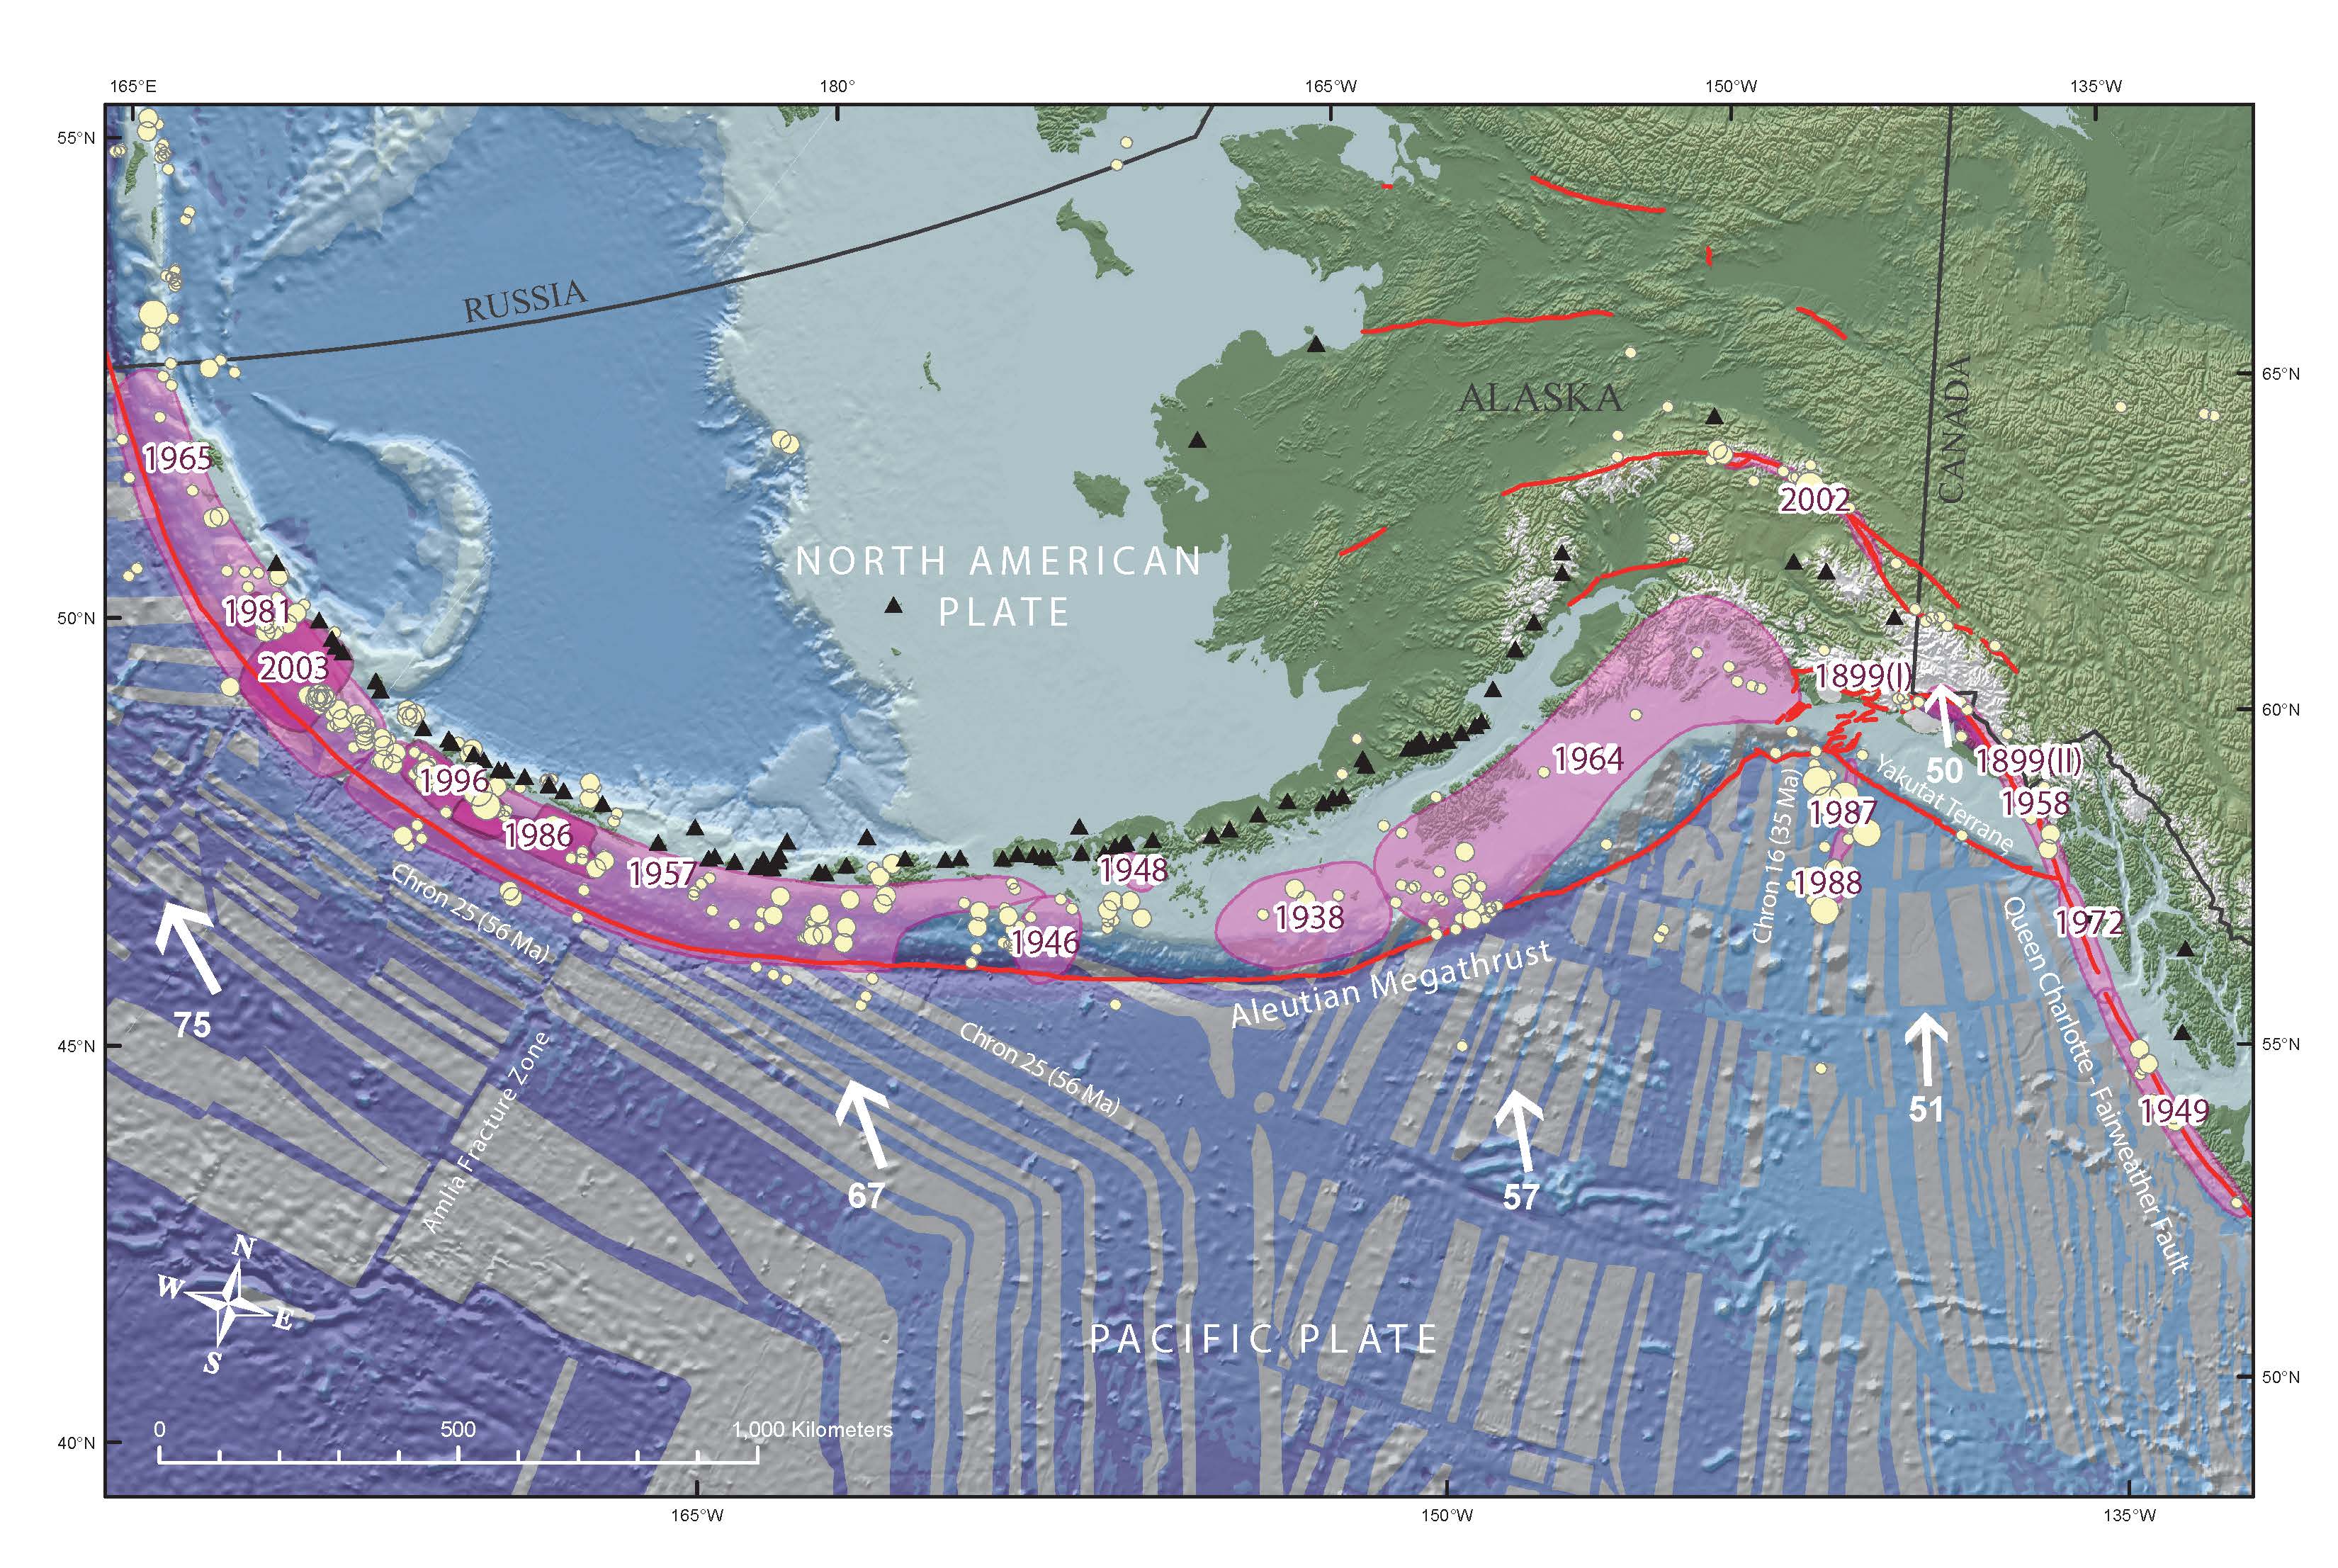
Here is a map showing the historic earthquakes along this subduction zone. This is from Peter J. Haeussler, USGS, Alaska Science Center.
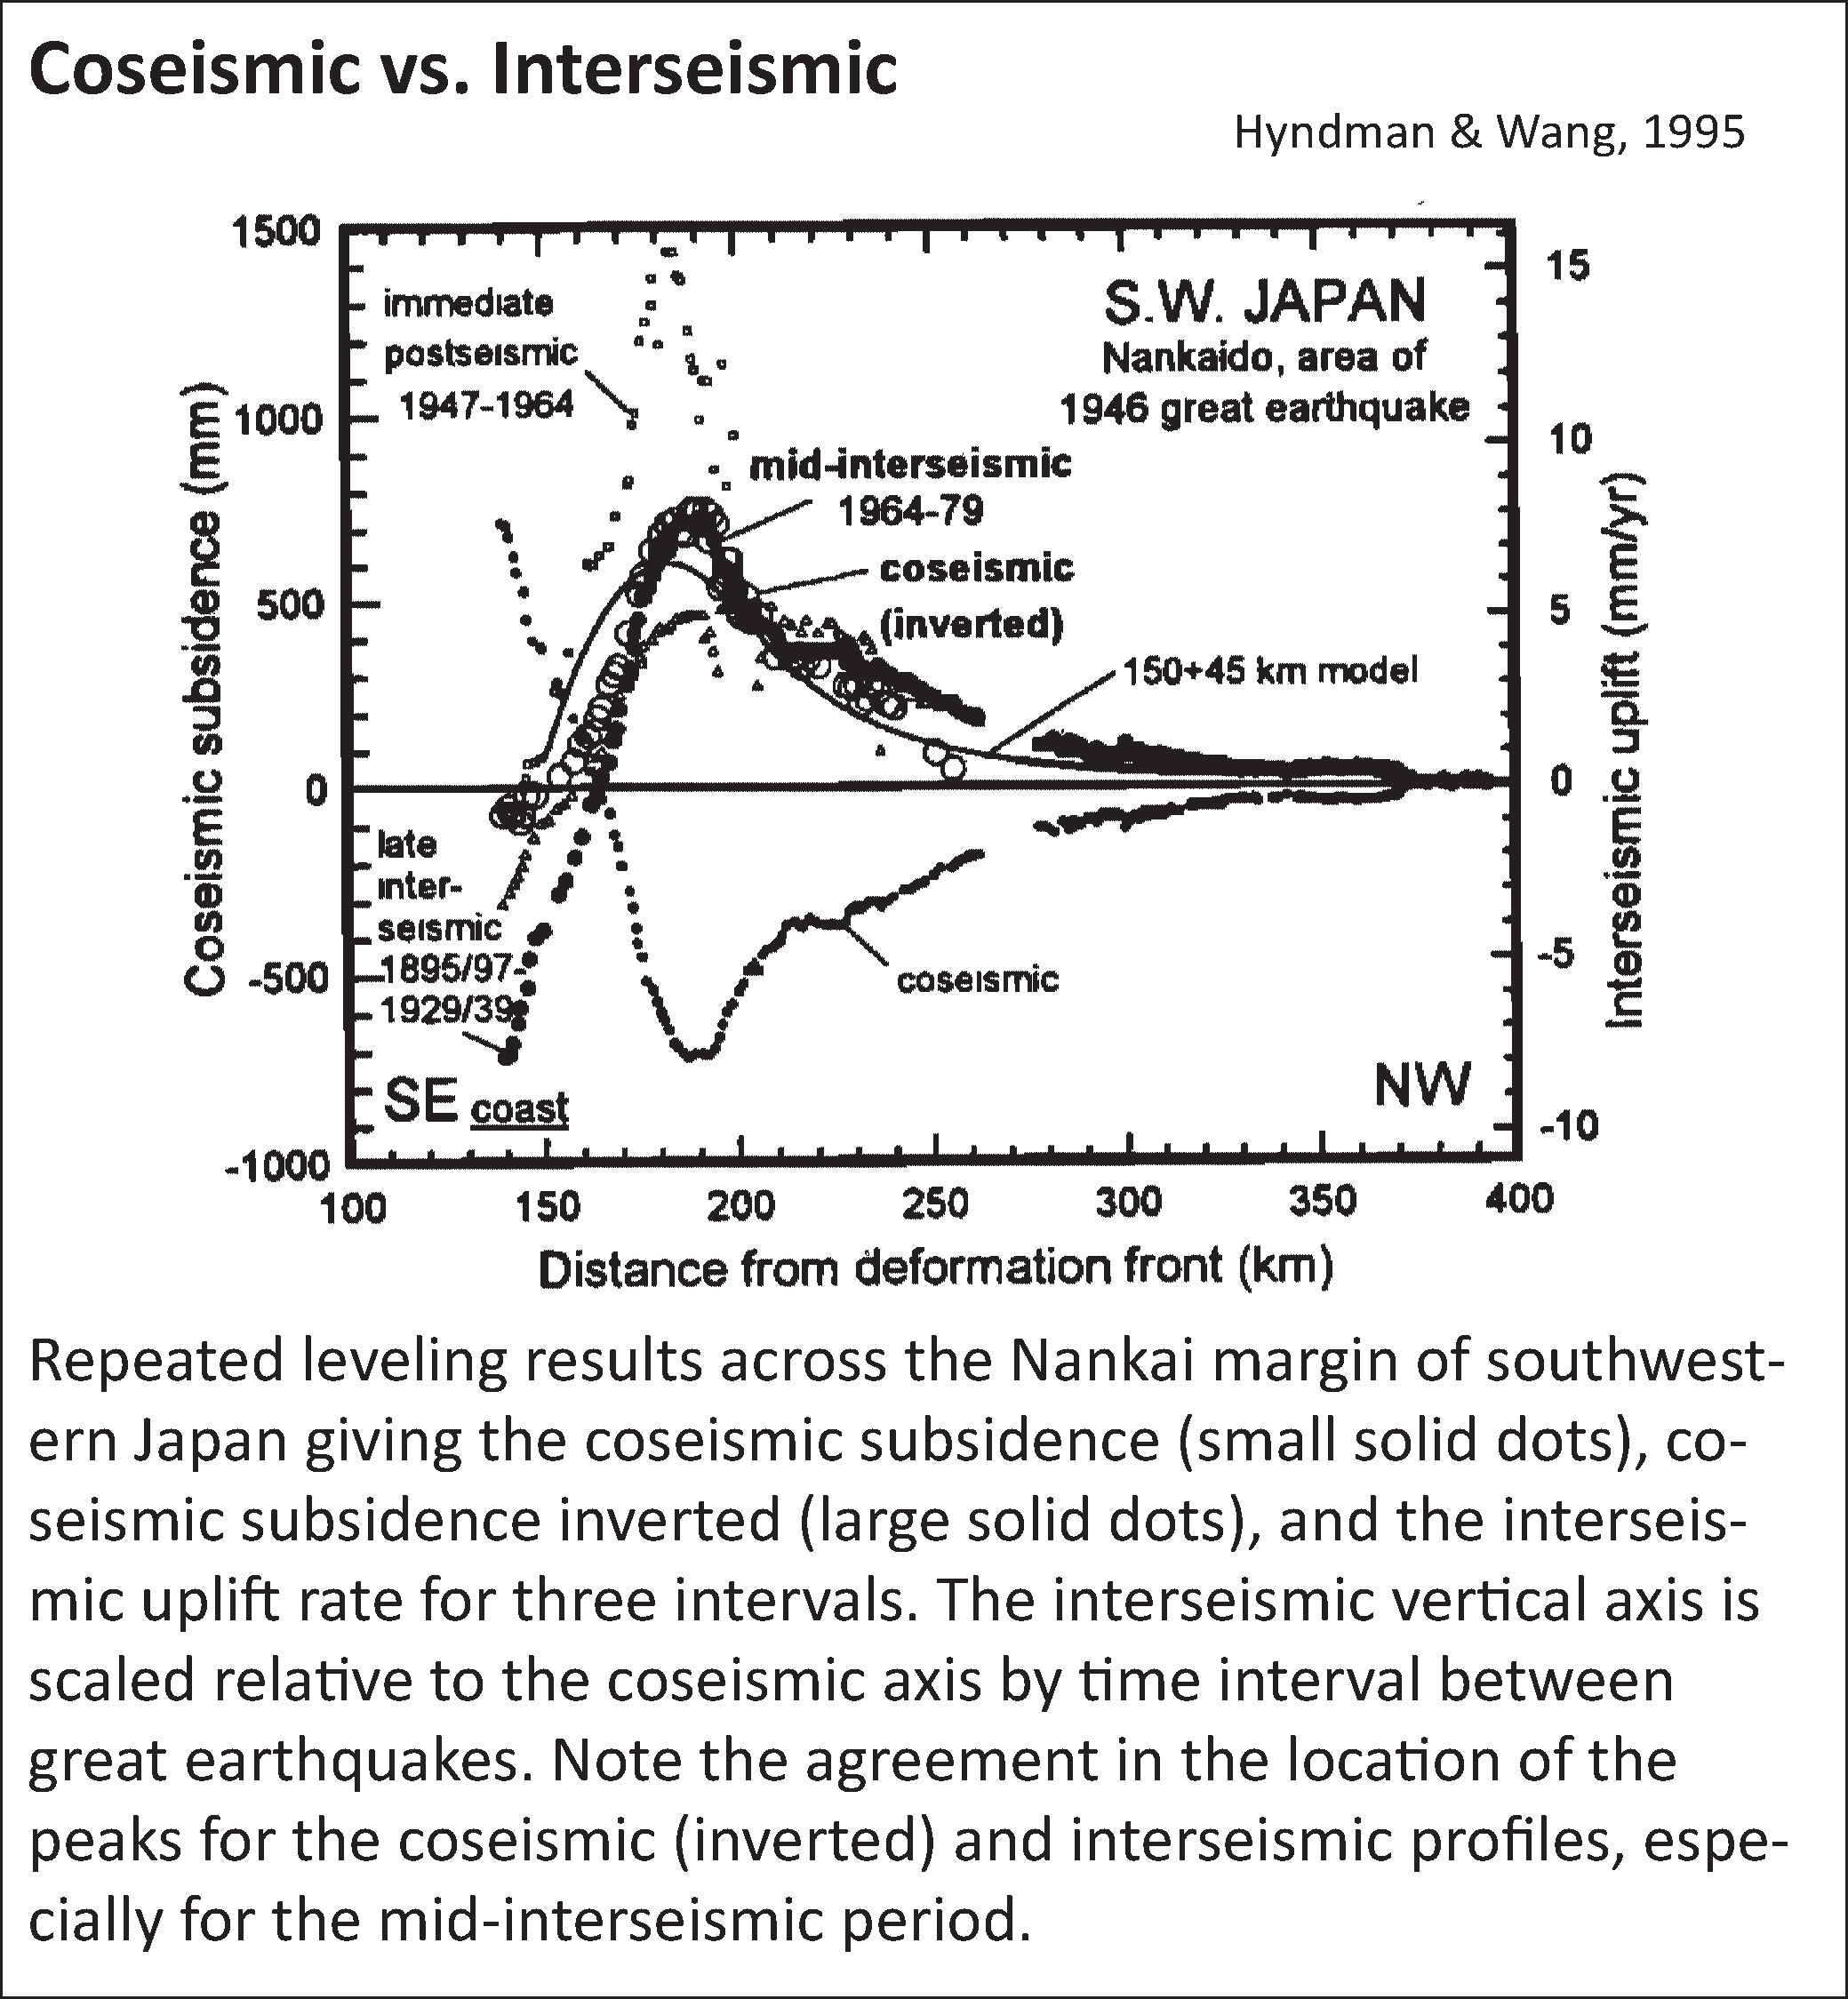
These are leveling data from the earthquake cycle along the subduction zone in southeastern Japan.
Here is a video that discusses the 1964 earthquake.
Youtube Source IRIS
WMV file for downloading.
Animation & graphics by Jenda Johnson, geologist
Directed by Robert F. Butler, University of Portland
U.S. Geological Survey consultants: Robert C. Witter, Alaska Science Center Peter J. Haeussler, Alaska Science Center
Narrated by Roger Groom, Mount Tabor Middle School
Maps from Google Earth. Video from US Army Corps of Engineers. Tsunami animation from National Oceanic & Atmospheric Administration (NOAA). Photographs from US Geological Survey.
-
References:
- Hyndman and Wang, 1995
- Plafker, 1972
5 thoughts on “Earthquake along the Alaska Penninsula!”