Last night I had completed preparing for class the next day. I was about to head to bed. I got an email from the Pacific Tsunami Warning Center notifying me that there was no risk of a tsunami due to an earthquake with a magnitude M 6.6. I noticed it was along the Sovanco fault, a transform fault (right-lateral strike-slip). Strike slip faults can produce tsunami, but they are smaller than tsunami generated along subduction zones. The recent M = 7.5 Donggala Earthquake in Sulawesi, Indonesia is an example of a tsunami generated in response to a strike-slip earthquake (tho coseismic landslides may be part of the story there too).
I thought I could put together a map in short time as I already had a knowledge base for this area (e.g. earthquake reports from 2017.01.07 and 2016.03.18). However, as I was creating base maps in Google Earth, before I completed making a set (the posters below each take 4 different basemaps displayed at different transparencies), there was the M 6.8 earthquake. Then there was the M 6.6 earthquake. I had to start all over. Twice. Heheh.
This region of the Pacific-North America plate boundary is at the northern end of the Cascadia subduction zone (CSZ). To the east, the Explorer and Juan de Fuca plates subduct beneath the North America plate to form the megathrust subduction zone fault capable of producing earthquakes in the magnitude M = 9 range. The last CSZ earthquake was in January of 1700, just almost 319 years ago.
The Juan de Fuca plate is created at an oceanic spreading center called the Juan de Fuca Ridge. This spreading ridge is offset by several transform (strike-slip) faults. At the southern terminus of the JDF Ridge is the Blanco fault, a transtensional transform fault connecting the JDF and Gorda ridges.
At the northern terminus of the JDF Ridge is the Sovanco transform fault that strikes to the northwest of the JDF Ridge. There are additional fracture zones parallel and south of the Sovanco fault, called the Heck, Heckle, and Springfield fracture zones.
The first earthquake (M = 6.6) appears to have slipped along the Sovanco fault as a right-lateral strike-slip earthquake. Then the M 6.8 earthquake happened and, given the uncertainty of the location for this event, occurred on a fault sub-parallel to the Sovanco fault. Then the M 6.5 earthquake hit, back on the Sovanco fault.
So, I would consider the M 6.6 to be a mainshock that triggered the M 6.8. The M 6.5 is an aftershock of the M 6.6.
Based upon our knowledge of how individual earthquakes can change the stress (or strain) in the surrounding earth, it is unlikely that this earthquake sequence changed the stress on the megathrust. Over time, hundreds of these earthquakes do affect the potential for earthquakes on the CSZ megathrust. But, individual earthquakes (or even a combination of these 3 earthquakes) do not change the chance that there will be an earthquake on the CSZ megathrust. The chance of an earthquake tomorrow is about the same as the chance of an earthquake today. Day to day the chances don’t change much. However, year to year, the chances of an earthquake get higher and higher. But of course, we cannot predict when an earthquake will happen.
So, if we live, work, or play in earthquake country, it is best to always be prepared for an earthquake, for tsunami, and for landslides.
-
Here are the three earthquakes. One of the M 6.5 earthquakes preceded the 6.8. If these are on different faults, I would say that the first 6.5 is not a foreshock. Though, someone who works with aftershock forecasts and conducts probabilistic seismic hazard assessments (or work on the USGS National Seismic Hazard Model) might call the first 6.5 a foreshock.
- https://earthquake.usgs.gov/earthquakes/eventpage/us1000hfgn/executive M 6.5
- https://earthquake.usgs.gov/earthquakes/eventpage/us1000hfgv/executive M 6.8
- https://earthquake.usgs.gov/earthquakes/eventpage/us1000hfh3/executive M 6.5
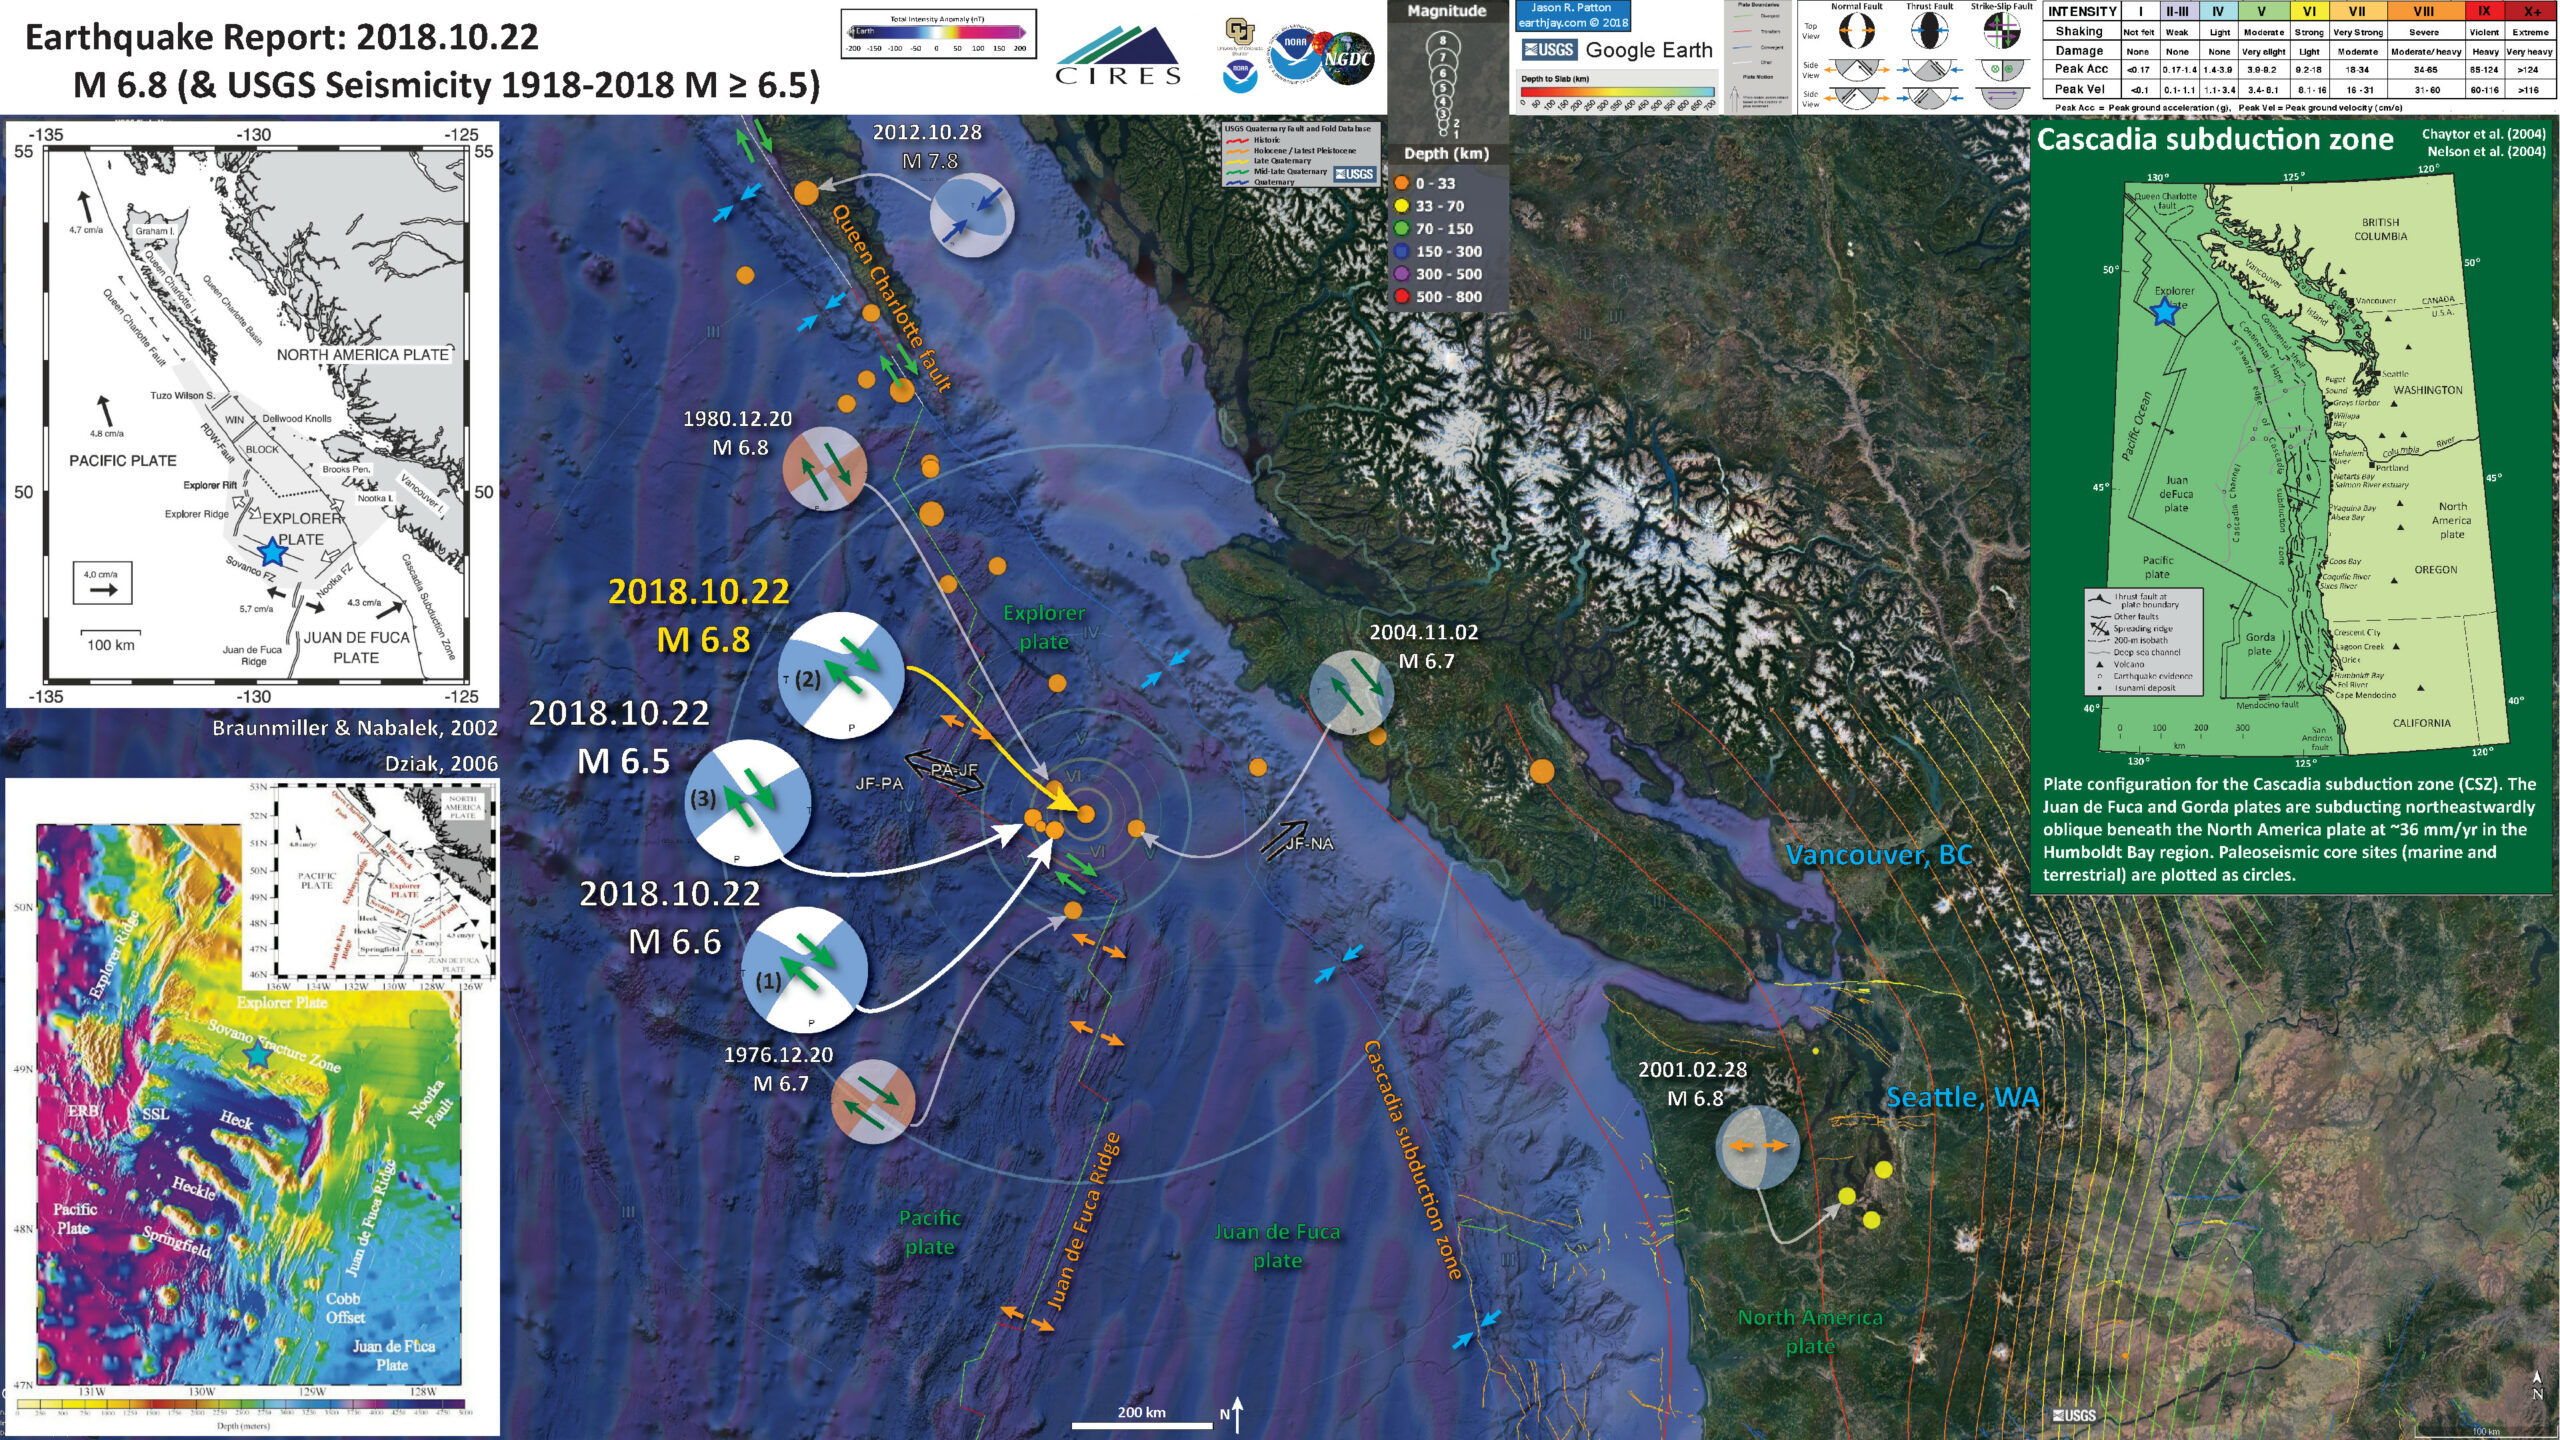
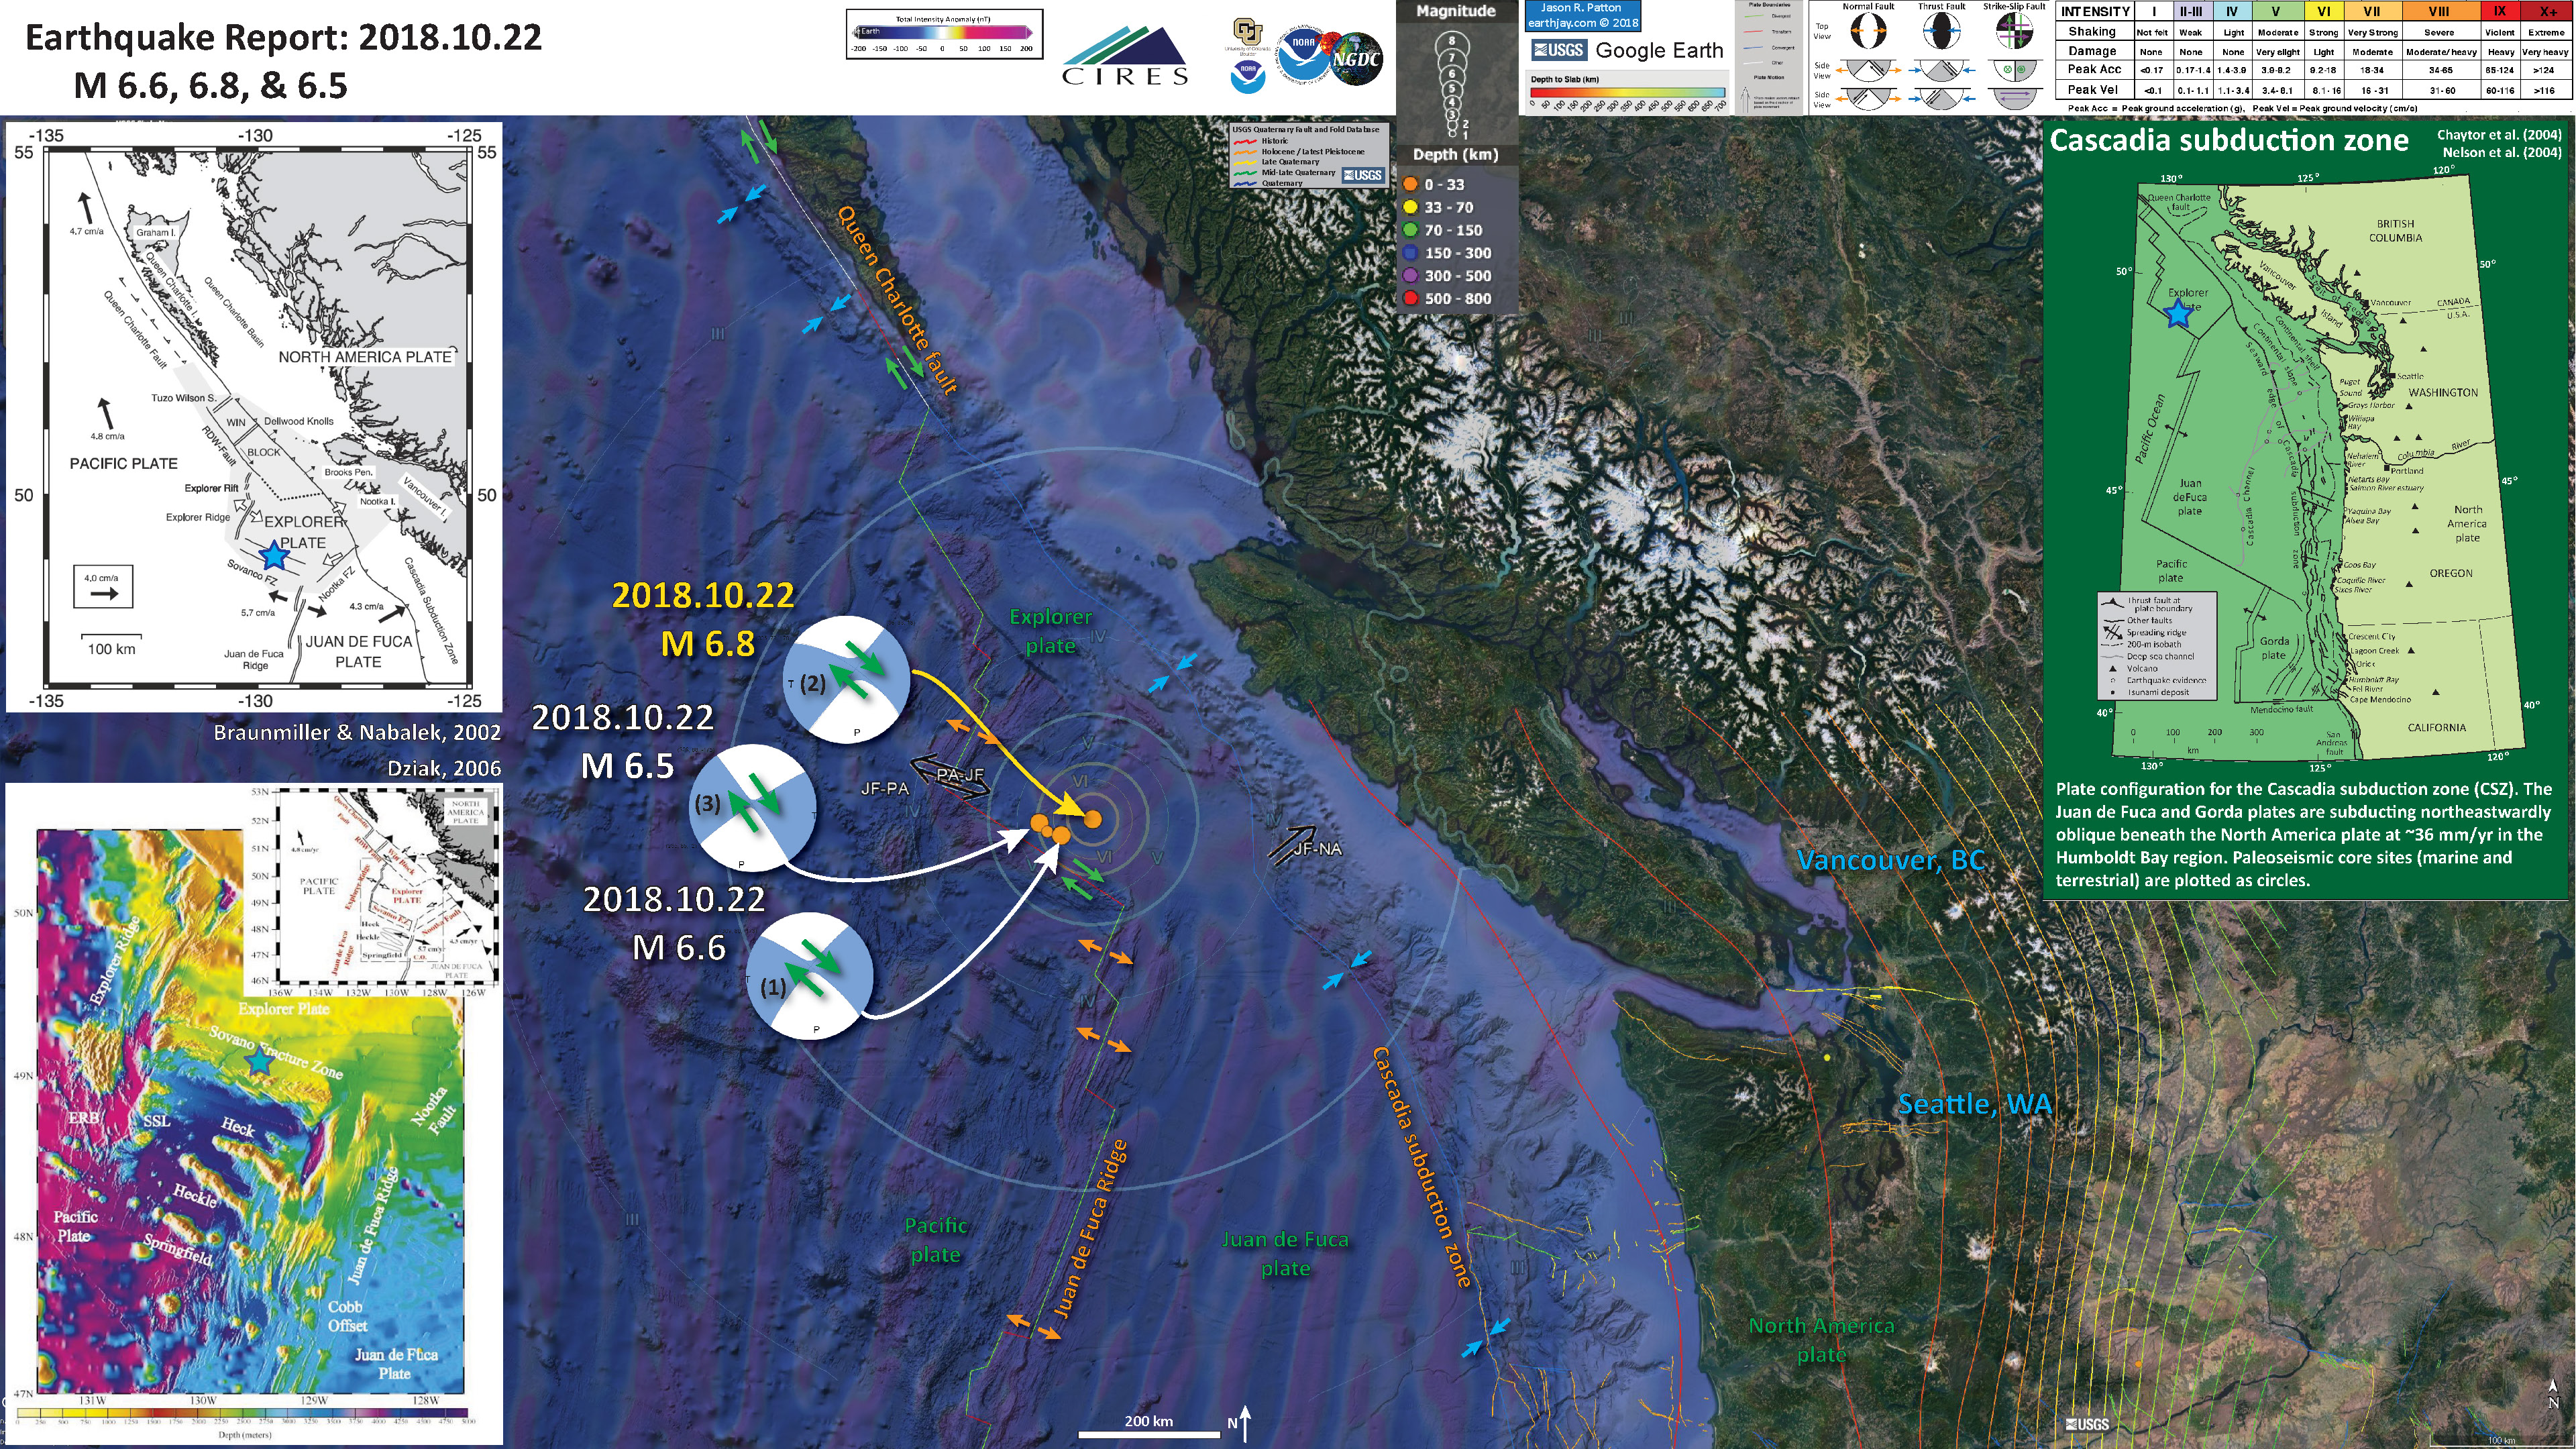
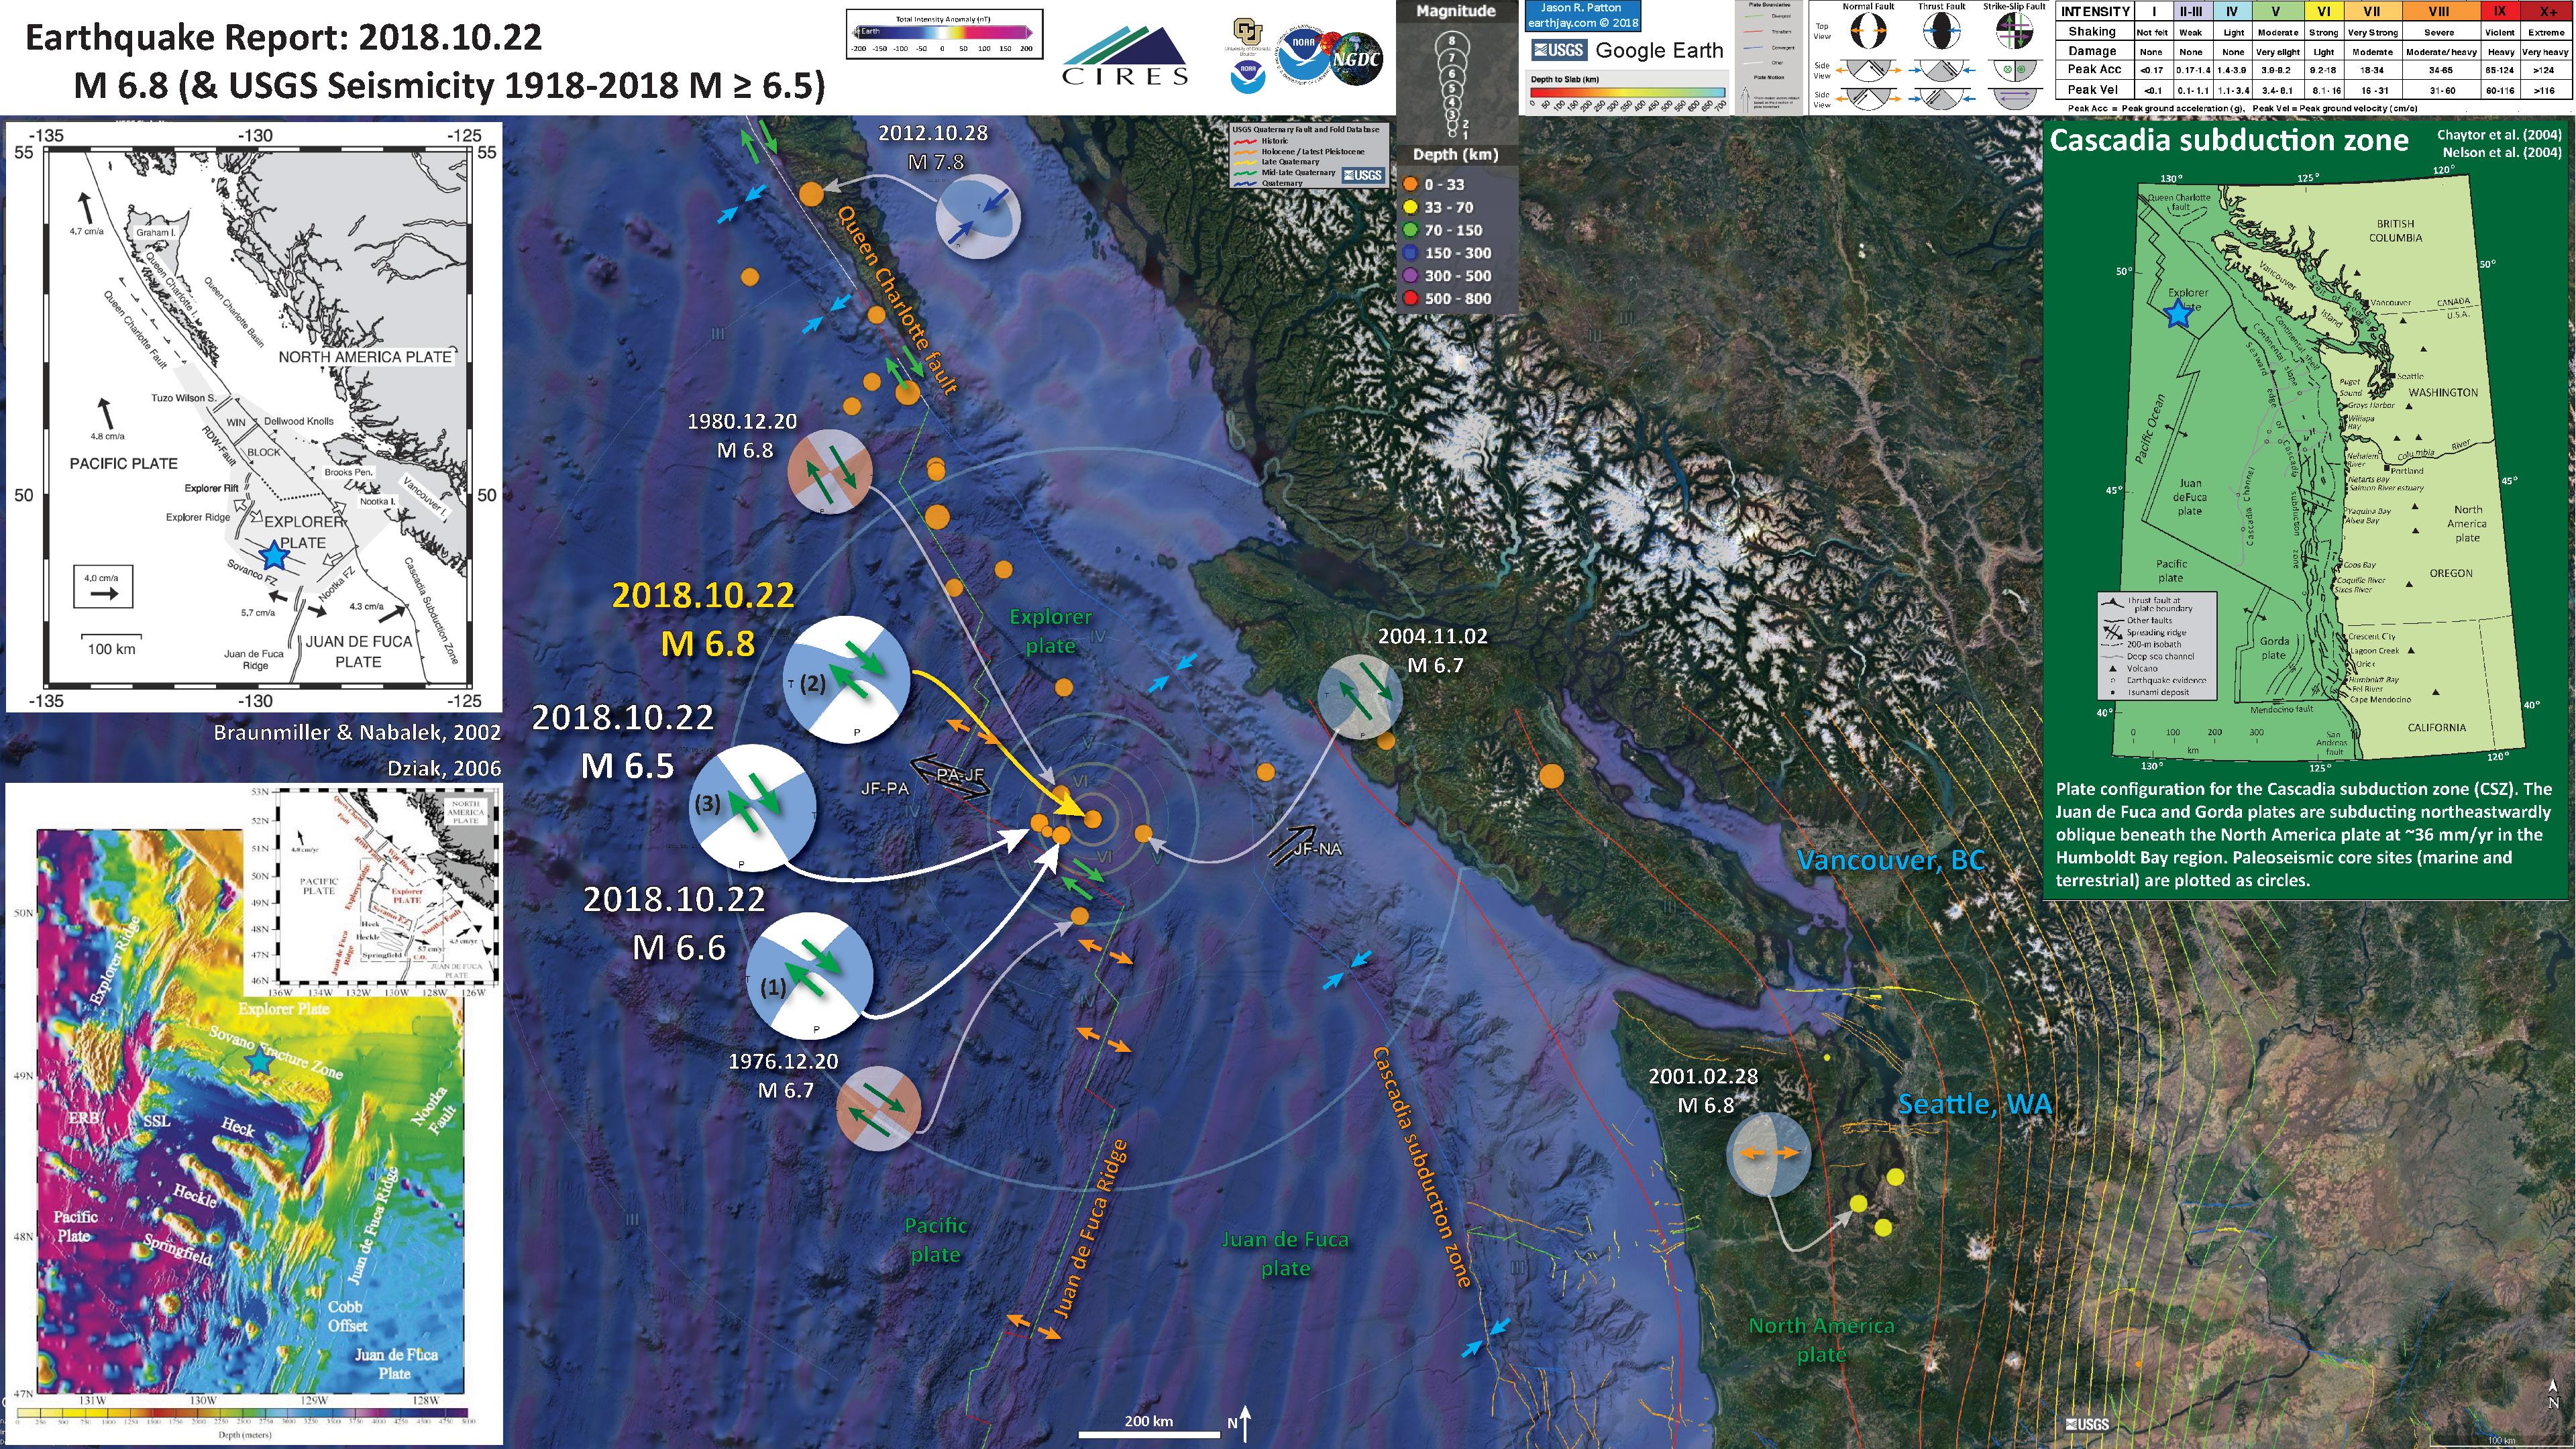
Below is my interpretive poster for this earthquake
I plot the seismicity from the past month, with color representing depth and diameter representing magnitude (see legend). I include earthquake epicenters from 1918-2018 with magnitudes M ≥ 6.5 in one version.
I plot the USGS fault plane solutions (moment tensors in blue and focal mechanisms in orange), possibly in addition to some relevant historic earthquakes.
I include the earthquake mechanisms for 2 special earthquakes that happened in the past two decades along this plate boundary system. In 2001 the M 6.8 Nisqually earthquake struck the Puget Sound region of Washington causing extensive damage. This earthquake was an extensional earthquake in the downgoing JDF plate. The damage was extensive because the earthquake was close to an urban center, where there was lots of infrastructure to be damaged (the closer to an earthquake, the higher the shaking intensity).
In 2012 was a M = 7.8 earthquake along the northern extension of the CSZ. The northern part of the CSZ is a very interesting region, often called the Queen Charlotte triple junction. There are some differences than the Mendocino triple junction to the south, in northern California. There continues to be some debate about how the plate boundary faults are configured here. The Queen Charlotte is a right lateral strike slip fault that extends from south of Haida Gwaii (the large island northwest of Vancouver Island) up northwards, where it is called the Fairweather fault. There are several large strike-slip earthquakes on the Queen Charlotte/Fairweather fault system in the 20th century. However, the 2012 earthquake was a subduction zone fault, evidence that the CSZ megathrust (or some semblance of this subduction zone) extends beneath Haida Gwaii (so the CSZ and QCF appear to over lap).
- I placed a moment tensor / focal mechanism legend on the poster. There is more material from the USGS web sites about moment tensors and focal mechanisms (the beach ball symbols). Both moment tensors and focal mechanisms are solutions to seismologic data that reveal two possible interpretations for fault orientation and sense of motion. One must use other information, like the regional tectonics, to interpret which of the two possibilities is more likely.
- I also include the shaking intensity contours on the map. These use the Modified Mercalli Intensity Scale (MMI; see the legend on the map). This is based upon a computer model estimate of ground motions, different from the “Did You Feel It?” estimate of ground motions that is actually based on real observations. The MMI is a qualitative measure of shaking intensity. More on the MMI scale can be found here and here. This is based upon a computer model estimate of ground motions, different from the “Did You Feel It?” estimate of ground motions that is actually based on real observations.
- I include the slab 2.0 contours plotted (Hayes, 2018), which are contours that represent the depth to the subduction zone fault. These are mostly based upon seismicity. The depths of the earthquakes have considerable error and do not all occur along the subduction zone faults, so these slab contours are simply the best estimate for the location of the fault.li>
- In the map below, I include a transparent overlay of the magnetic anomaly data from EMAG2 (Meyer et al., 2017). As oceanic crust is formed, it inherits the magnetic field at the time. At different points through time, the magnetic polarity (north vs. south) flips, the north pole becomes the south pole. These changes in polarity can be seen when measuring the magnetic field above oceanic plates. This is one of the fundamental evidences for plate spreading at oceanic spreading ridges (like the Gorda rise).
- Regions with magnetic fields aligned like today’s magnetic polarity are colored red in the EMAG2 data, while reversed polarity regions are colored blue. Regions of intermediate magnetic field are colored light purple.
- We can see the roughly northeast-southwest trends of these red and blue stripes in the JDF and Pacific plates. These lines are parallel to the ocean spreading ridges from where they were formed. The stripes disappear at the subduction zone because the oceanic crust with these anomalies is diving deep beneath the Sunda plate (part of Eurasia), so the magnetic anomalies from the overlying North America plate (and accretionary prism) mask the evidence for the JDF plate.
Magnetic Anomalies
- In the upper right corner is a map of the Cascadia subduction zone (CSZ) and regional tectonic plate boundary faults. This is modified from several sources (Chaytor et al., 2004; Nelson et al., 2004). I place a blue star in the general location of today’s seismicity.
- In the upper left corner is a map showing the plate boundary faults associated with the northern CSZ and to the north (including the Queen Charlotte fault; Braunmiller and Nabalek, 2002). I place a red star in the general location of today’s seismicity. These earthquakes occurred in the region east of the Explorer rift. This region of the world still contains some major tectonic mysteries and this is quite exciting. This shows the Winona Block as a microplate between the Pacific and North America plates, north of the Explorer plate. The Winona Block is labeled “WIN BLOCK” on the map. Note that there are two spreading ridges on the western and central part of this block. It is possible that the Explorer ridge-rift system extends into the Winona Block to form a third spreading ridge in the Winona Block.
- In the lower left corner is a map from Dziak (2006). Dziak (2006) used bathymetric and seismologic data to evaluate the faulting in the region and discussed how the Explorer plate is accommodating a reorganization of the plate boundary.
I include some inset figures. Some of the same figures are located in different places on the larger scale map below.
- Here is the map with a month’s seismicity plotted.
- Here is the map with a century’s seismicity plotted.
- Here is a video showing the earthquake epicenters for the period of 1900-2017 for USGS earthquakes with magnitudes M ≥ 5.0. Here is a link to the embedded video below (2.5 MB mp4). Note how the earthquakes that happen between the northern terminus of the JDF Ridge and the southern terminus of the Queen Charlotte fault form a wide band (not a stepwise patter that might reflect steps in ridges and spreading centers). This pattern is key to unravelling the mysteries of the western Explorer plate.
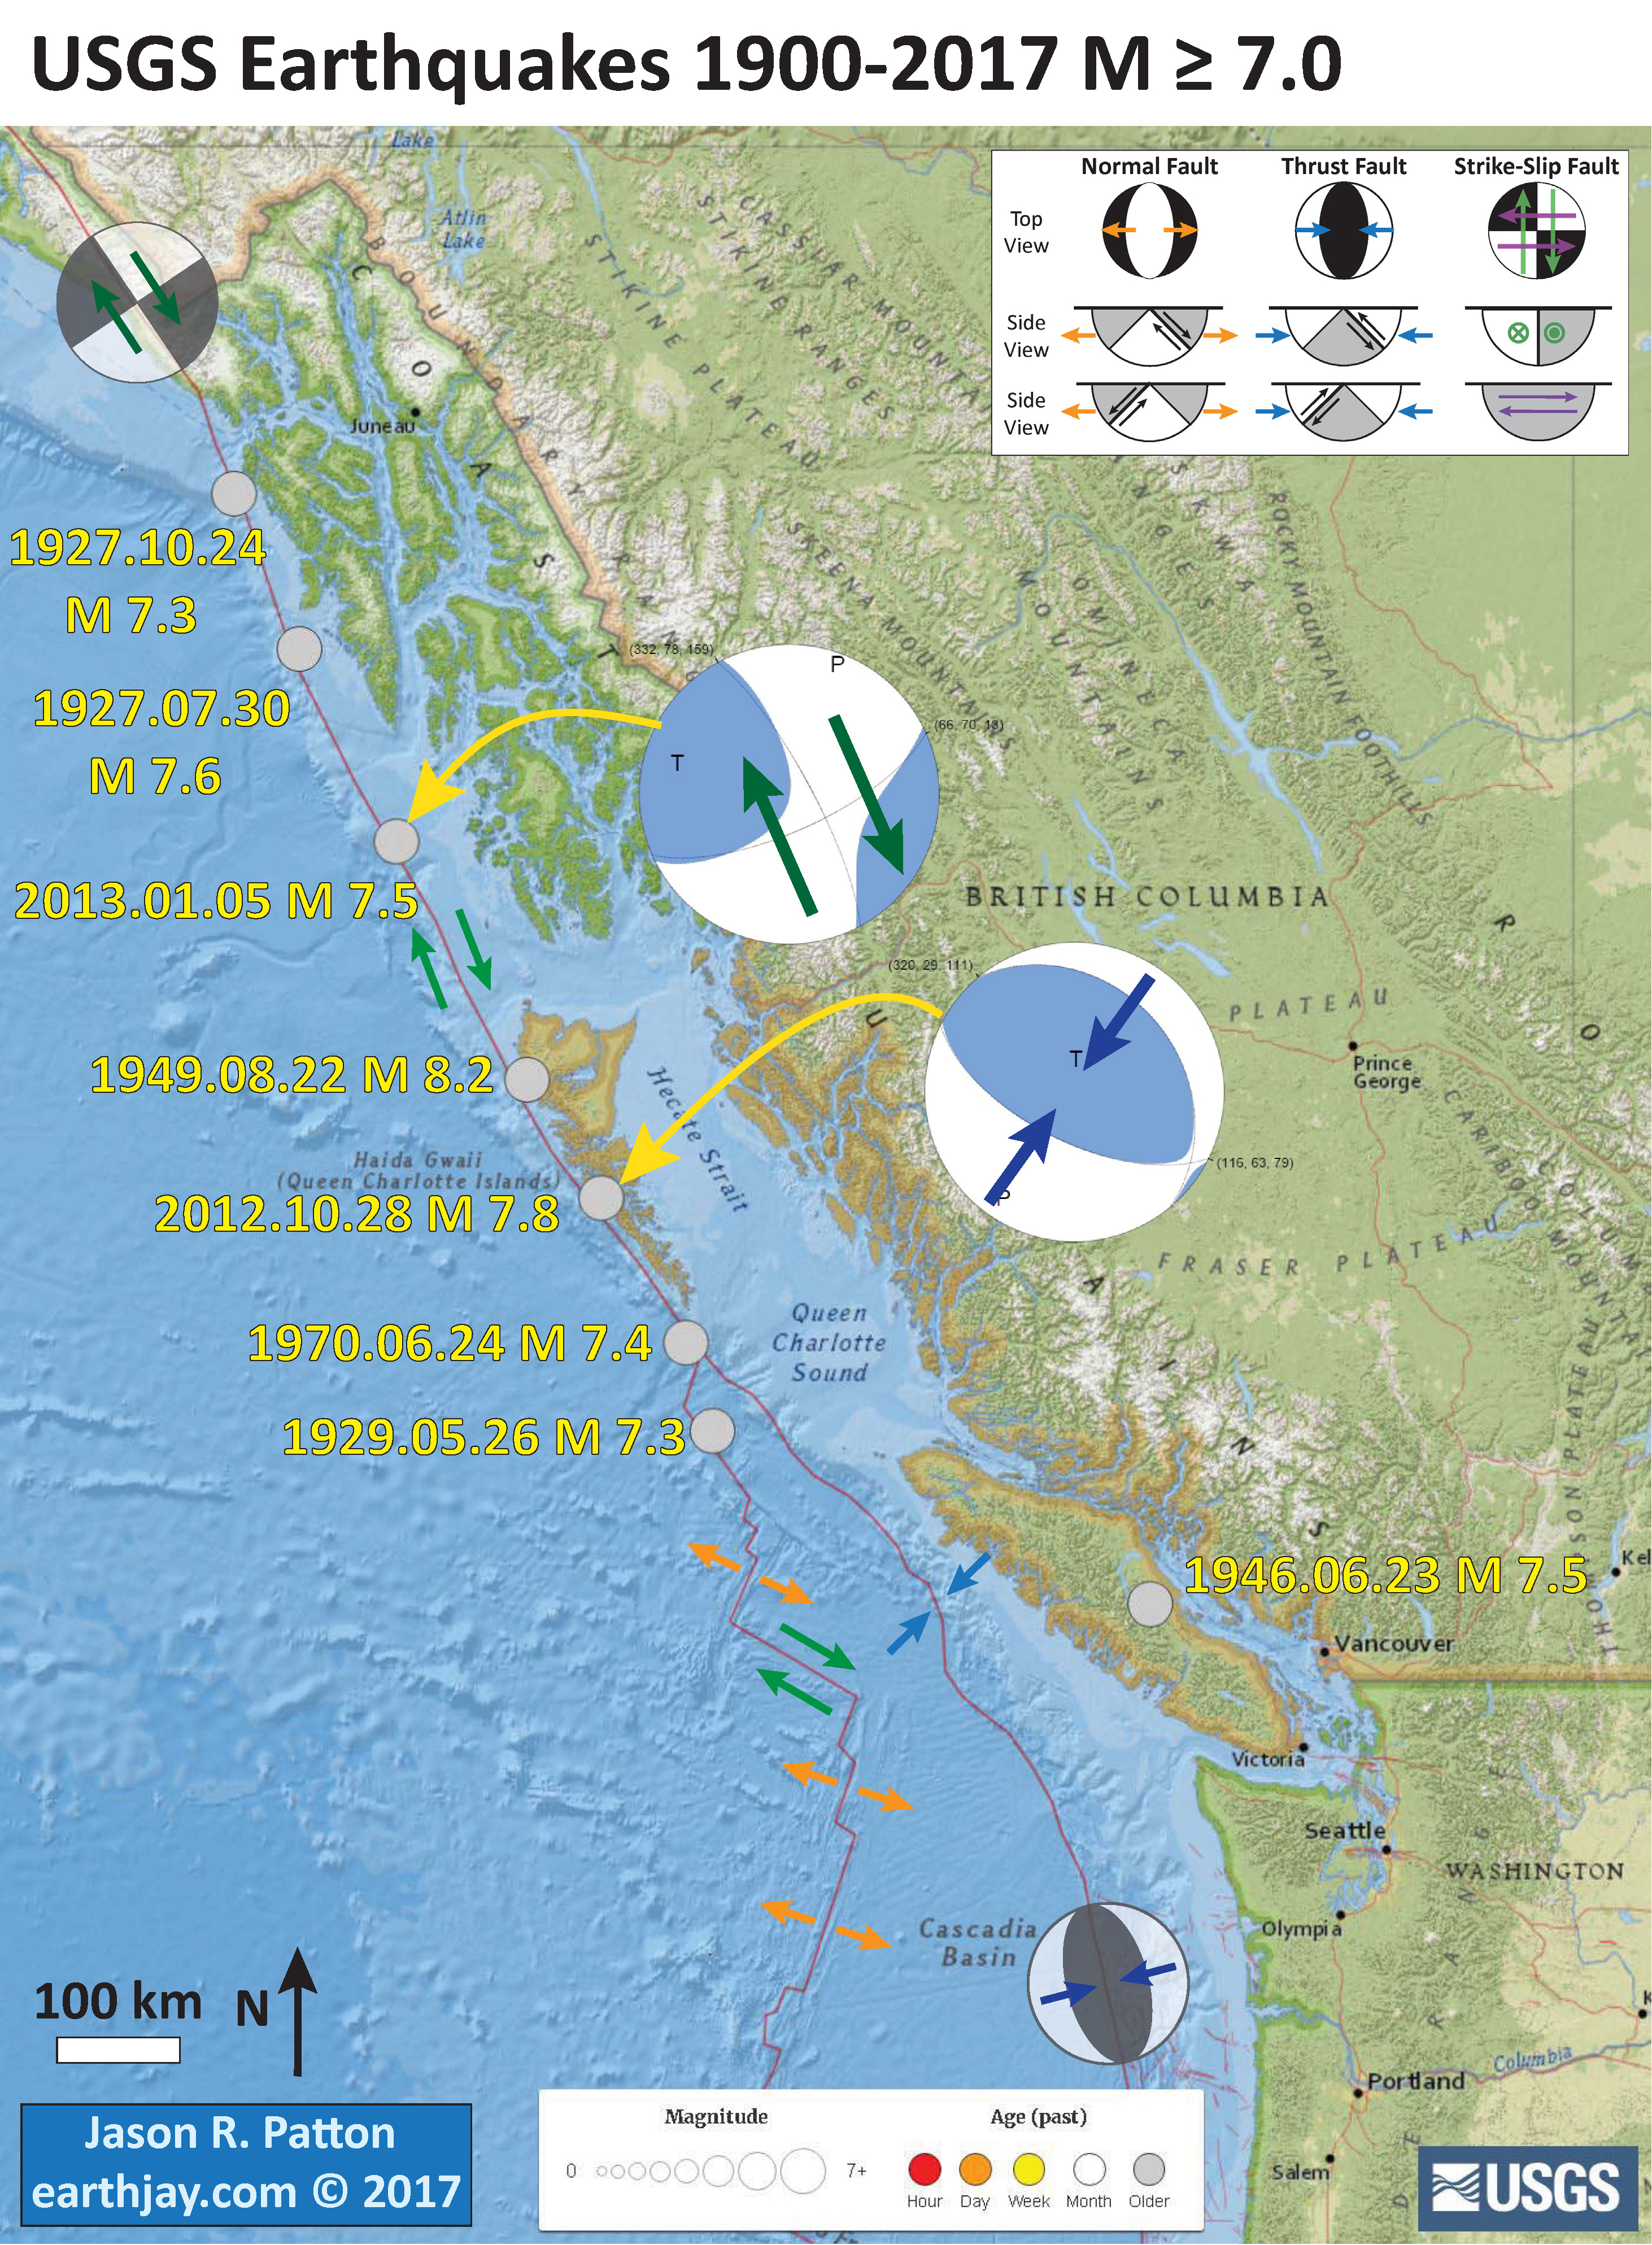
- Here is the map with the seismicity from 1900-2017 plotted. These are USGS earthquakes with magnitudes M ≥ 7.0 for this time period. I include the moment tensors from the 2012 and 2013 earthquakes (the only earthquakes for this time period that have USGS moment tensors). The 2012 earthquake generated a tsunami. I discuss the 2012 “Haida Gwaii” earthquake here.
Other Report Pages
Some Relevant Discussion and Figures
- Here is the general tectonic map of the region (Braunmiller and Nabalek, 2002). Today’s earthquakes happened in a place that suggest the Explorer ridge extends further to the north into the Winona Block. Below I include the text from the original figure caption in blockquote.

Map of Explorer region and surroundings. Plate boundaries are based on Riddihough’s [1984] and Davis and Riddihough’s [1982] tectonic models. Solid lines are active plate boundaries (single lines are transform faults, double lines are spreading centers, barbed lines are subduction zones with barbs in downgoing plate direction). The wide double line outlines the width of the Sovanco fracture zone, and the dots sketch the Explorer-Winona boundary. Plate motion vectors (solid arrows) are from NUVEL-1A [DeMets et al., 1994] for Pacific-North America motion and from Wilson [1993] for Pacific-Juan de Fuca and Juan de Fuca-North America motion. Open arrows are Explorer relative plate motions averaged over last 1 Myr [Riddihough, 1984] (in text, we refer to these most recent magnetically determined plate motions as the ‘‘Riddihough model’’). Winona block motions (thin arrows), described only qualitatively by Davis and Riddihough [1982], are not to scale. Abbreviations are RDW for Revere-Dellwood- Wilson, Win for Winona, FZ for fault zone, I for island, S for seamount, Pen for peninsula.
- Here is the larger scale figure that shows the details of the plate boundary in this region (Braunmiller and Nabalek, 2002). Below I include the text from the original figure caption in blockquote.

Close-up of the Pacific-Explorer boundary. Plotted are fault plane solutions (gray scheme as in Figure 3) and well-relocated earthquake epicenters. The SeaBeam data are from the RIDGE Multibeam Synthesis Project (http://imager.ldeo.columbia.edu) at the Lamont-Doherty Earth observatory. Epicenters labeled by solid triangles are pre-1964, historical earthquakes (see Appendix B). Solid lines mark plate boundaries inferred from bathymetry and side-scan data [Davis and Currie, 1993]; dashed were inactive. QCF is Queen Charlotte fault, TW are Tuzo Wilson seamounts, RDW is Revere-Dellwood-Wilson fault, DK are Dellwood Knolls, PRR is Paul Revere ridge, ER is Explorer Rift, ED is Explorer Deep, SERg is Southern Explorer ridge, ESM is Explorer seamount, SETB is Southwest Explorer Transform Boundary, SAT is Southwestern Assimilated Territory, ESDZ is Eastern Sovanco Deformation Zone, HSC is Heck seamount chain, WV is active west valley of Juan de Fuca ridge, MV is inactive middle valley.
- This is the figure that shows an interpretation of how this plate boundary formed over the past 3 Ma (Braunmiller and Nabalek, 2002). Below I include the text from the original figure caption in blockquote.
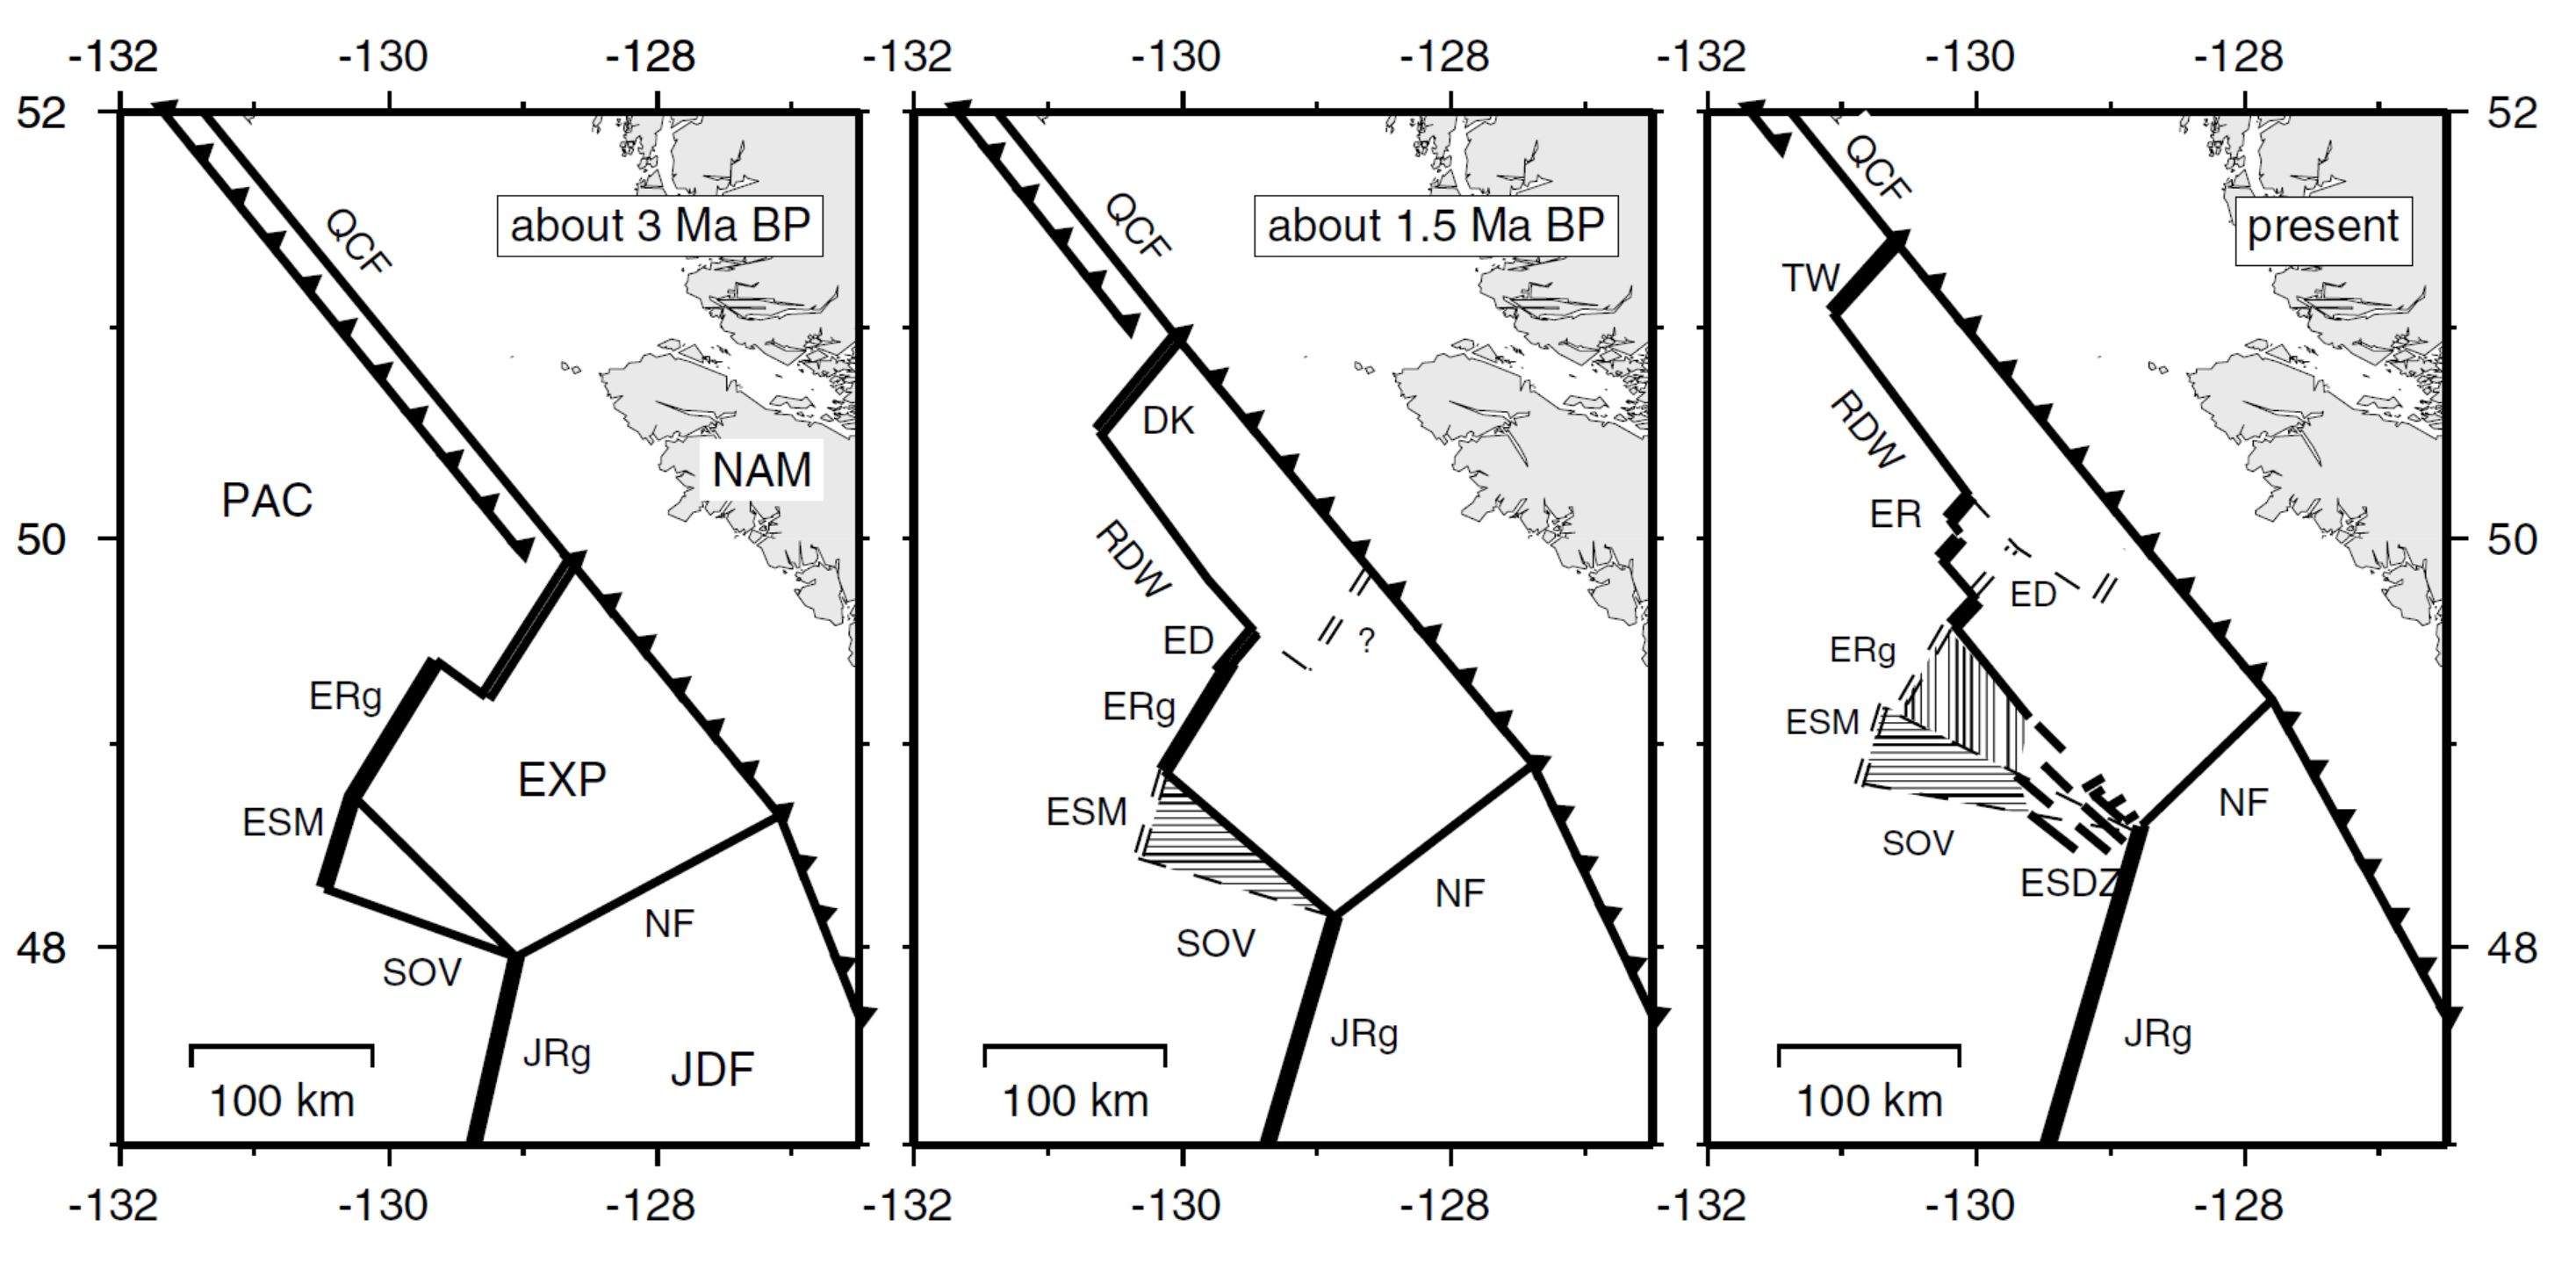
Schematic plate tectonic reconstruction of Explorer region during the last 3 Myr. Note the transfer of crustal blocks (hatched) from the Explorer to the Pacific plate; horizontal hatch indicates transfer before 1.5 Ma and vertical hatch transfer since then. Active boundaries are shown in bold and inactive boundaries are thin dashes. Single lines are transform faults, double lines are spreading centers; barbed lines are subduction zones with barbs in downgoing plate direction. QCF is Queen Charlotte fault, TW are the Tuzo Wilson seamounts, RDW is Revere-Dellwood-Wilson fault, DK are the Dellwood Knolls, ED is Explorer Deep, ER is Explorer Rift, ERg is Explorer Ridge, ESM is Explorer Seamount, SOV is Sovanco fracture zone, ESDZ is Eastern Sovanco Deformation Zone, JRg is Juan de Fuca ridge, and NF is Nootka fault. The question mark indicates ambiguity whether spreading offshore Brooks peninsula ceased when the Dellwood Knolls became active (requiring only one independently moving plate) or if both spreading centers, for a short time span, where active simultaneously (requiring Winona block motion independent from Explorer plate during that time).
- Below I include some inset maps from Audet et al. (2008 ) and Dziak (2006). Each of these authors have published papers about the Explorer plate. Dziak (2006) used bathymetric and seismologic data to evaluate the faulting in the region and discussed how the Explorer plate is accommodating a reorganization of the plate boundary. Audet et al. (2008 ) use terrestrial seismic data to evaluate the crust along northern Vancouver Island and present their tectonic map as part of this research (though they do not focus on the offshore part of the Explorer plate). I include these figures below along with their figure captions. Today’s earthquakes happened at the northwestern portion of these maps from Dziak (2006).
- This map shows the shape of the seafloor in this region and there is an inset map that shows the major fault systems here.
- This map shows the line work Dziak (2006) used to delineate the structures shown in the bathymetric map.
- This map shows the seismicity patterns (this matches the patterns in the animation above).
- Here Dziak (2006) shows how they interpret that this plate boundary is being reconfigured with time. Like the rest of the adjacent plate boundary (Queen Charlotte/Fairweather, Cascadia, San Andreas), there is an overall dextral (right-lateral) shear couple between the North America and Pacific plates. Some of the existing structures represent the orientation of faults from an earlier strain field. Eventually through going faults will align with the band of seismicity in the above map and above animation. At least, that is one hypothesis. Seems reasonable to me, given the very short record of earthquakes.
- From Audet et al. (2008), here is another view of the fault system in this part of the plate boundary.
Dziak, 2006

Bathymetric map of northern Juan de Fuca and Explorer Ridges. Map is composite of multibeam bathymetry and satellite altimetry (Sandwell and Smith, 1997). Principal structures are labeled: ERB—Explorer Ridge Basin, SSL—strike-slip lineation. Inset map shows conventional tectonic interpretation of region. Dashed box shows location of main figure. Solid lines are active plate boundaries, dashed line shows Winona-Explorer boundary, gray ovals represent seamount chains. Solid arrows show plate motion vectors from NUVEL-1A (DeMets et al., 1994) for Pacific–North America and from Wilson (1993) for Pacific–Juan de Fuca and Juan de Fuca–North America. Open arrows are Explorer relative motion averaged over past 1 m.y. (Riddihough, 1984). Abbreviations: RDW—Revere-Dellwood-Wilson,Win—Winona block, C.O.—Cobb offset, F.Z.—fracture zone. Endeavour segment is northernmost section of Juan de Fuca Ridge.

Structural interpretation map of Explorer–Juan de Fuca plate region based on composite multibeam bathymetry and satellite altimetry data (Fig. 1). Heavy lines are structural (fault) lineations, gray circles and ovals indicate volcanic cones and seamounts, dashed lines are turbidite channels. Location of magnetic anomaly 2A is shown; boundaries are angled to show regional strike of anomaly pattern.

Earthquake locations estimated using U.S. Navy hydrophone arrays that occurred between August 1991 and January 2002. Focal mechanisms are of large (Mw>4.5) earthquakes that occurred during same time period, taken from Pacific Geoscience Center, National Earthquake Information Center, and Harvard moment-tensor catalogs. Red mechanism shows location of 1992 Heck Seamount main shock.

Tectonic model of Explorer plate boundaries. Evidence presented here is consistent with zone of shear extending through Explorer plate well south of Sovanco Fracture Zone (SFZ) to include Heck, Heckle, and Springfield seamounts, and possibly Cobb offset (gray polygon roughly outlines shear zone). Moreover, Pacific– Juan de Fuca–North American triple junction may be reorganizing southward to establish at Cobb offset. QCF—Queen Charlotte fault.
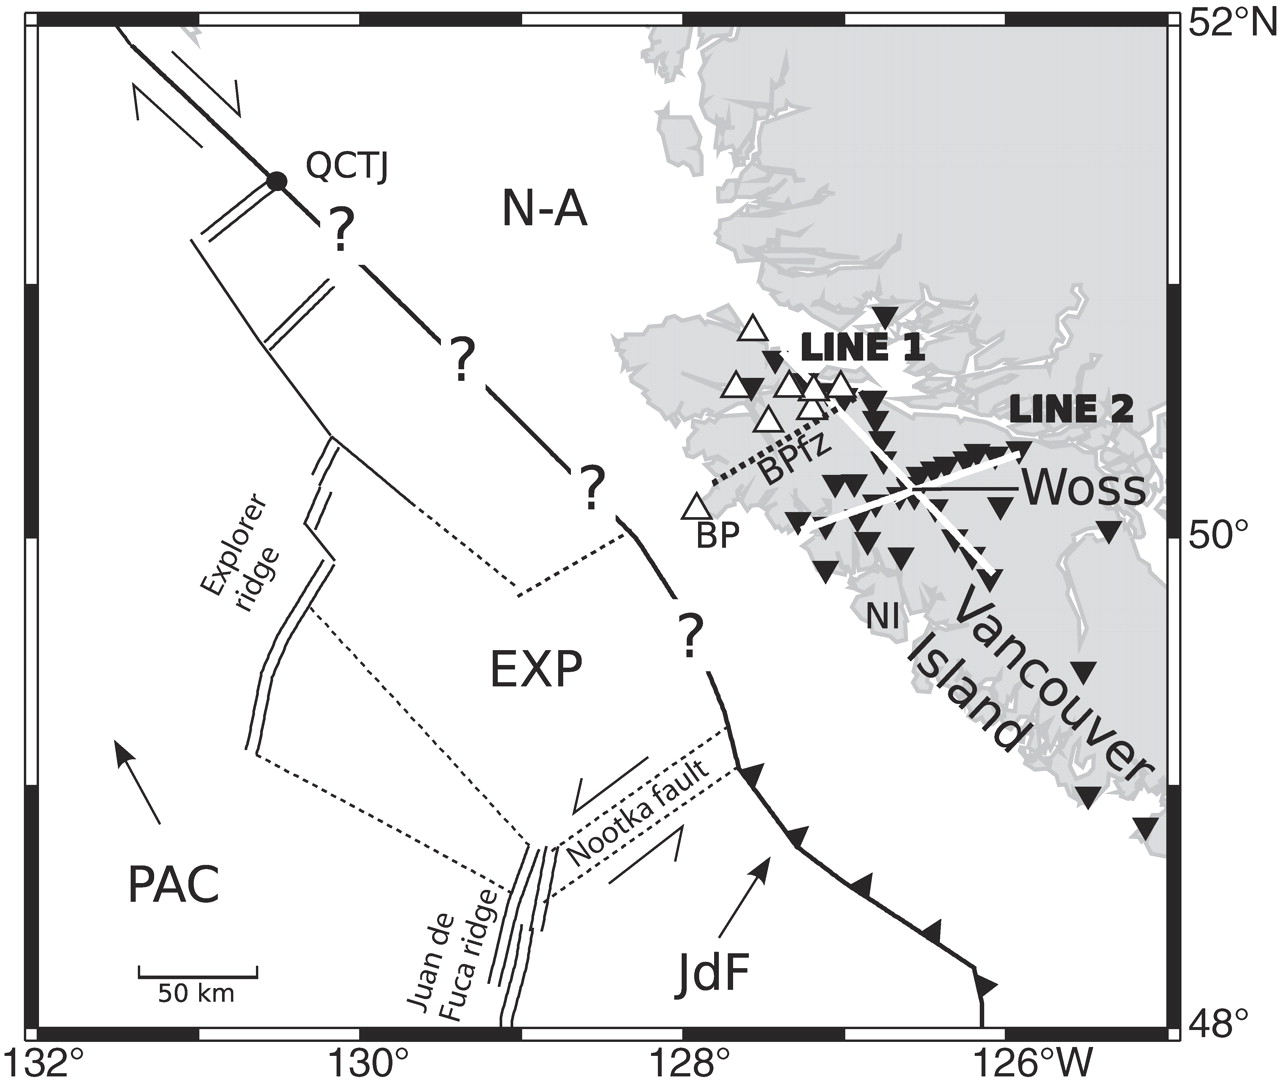
Identification of major tectonic features in western Canada. BP—Brooks Peninsula, BPfz—Brooks Peninsula fault zone, NI— Nootka Island, QCTJ—Queen Charlotte triple junction. Dotted lines delineate extinct boundaries or shear zones. Seismic stations are displayed as inverted black triangles. Station projections along line 1 and line 2 are plotted as thick white lines. White triangles represent Alert Bay volcanic field centers. Center of array locates town of Woss. Plates: N-A—North America; EXP—Explorer; JdF—Juan de Fuca; PAC—Pacific.
- Speaking of the Queen Charlotte/Fairweather fault system, here is another map that shows the tectonics of this region. Hyndman (2015) shows the region where the 2012 Haida Gwaii earthquake ruptured. I include two more figures below. This figure Below I include the text from the original figure caption in blockquote.

The Queen Charlotte fault (QCF) zone, the islands of Haida Gwaii and adjacent area, and the locations of the 2012 Mw 7.8 (ellipse), 2013 Mw 7.5 (solid line), and 1949 Ms 8.1 (dashed) earthquakes. The along margin extent of the 1949 event is not well constrained.
- This map shows the main and aftershocks from the 2012 Haida Gwaii earthquake sequence (Hyndman, 2015). This 2012 sequence is interesting because, prior to these earthquakes, it was unclear whether the fault along Haida Gwaii was a strike-slip or a thrust fault. For example, Riddihough (1984) suggests that there is no subduction going on along the Explorer plate at all. Turns out it is probably both. When this 2012 earthquake happened, I took a look at the bathymetry in Google Earth and noticed the Queen Charlotte Terrace, which looks suspiciously like an accretionary prism. This was convincing evidence for the thrust fault earthquakes. Below I include the text from the original figure caption in blockquote.

Aftershocks of the 2012 Mw 7.8 Haida Gwaii thrust 13 earthquake (after Cassidy et al., 2013). They approximately define the rupture area. The normal-faulting mechanisms for two of the larger aftershocks are also shown. Many of the aftershocks are within the incoming oceanic plate and within the overriding continental plate rather than on the thrust rupture plane.
- This is a great version of this figure that shows how there are overlapping subduction (thrust) and transform (strike-slip) faults along the Haida Gwaii region (Hyndman, 2015). Below I include the text from the original figure caption in blockquote.
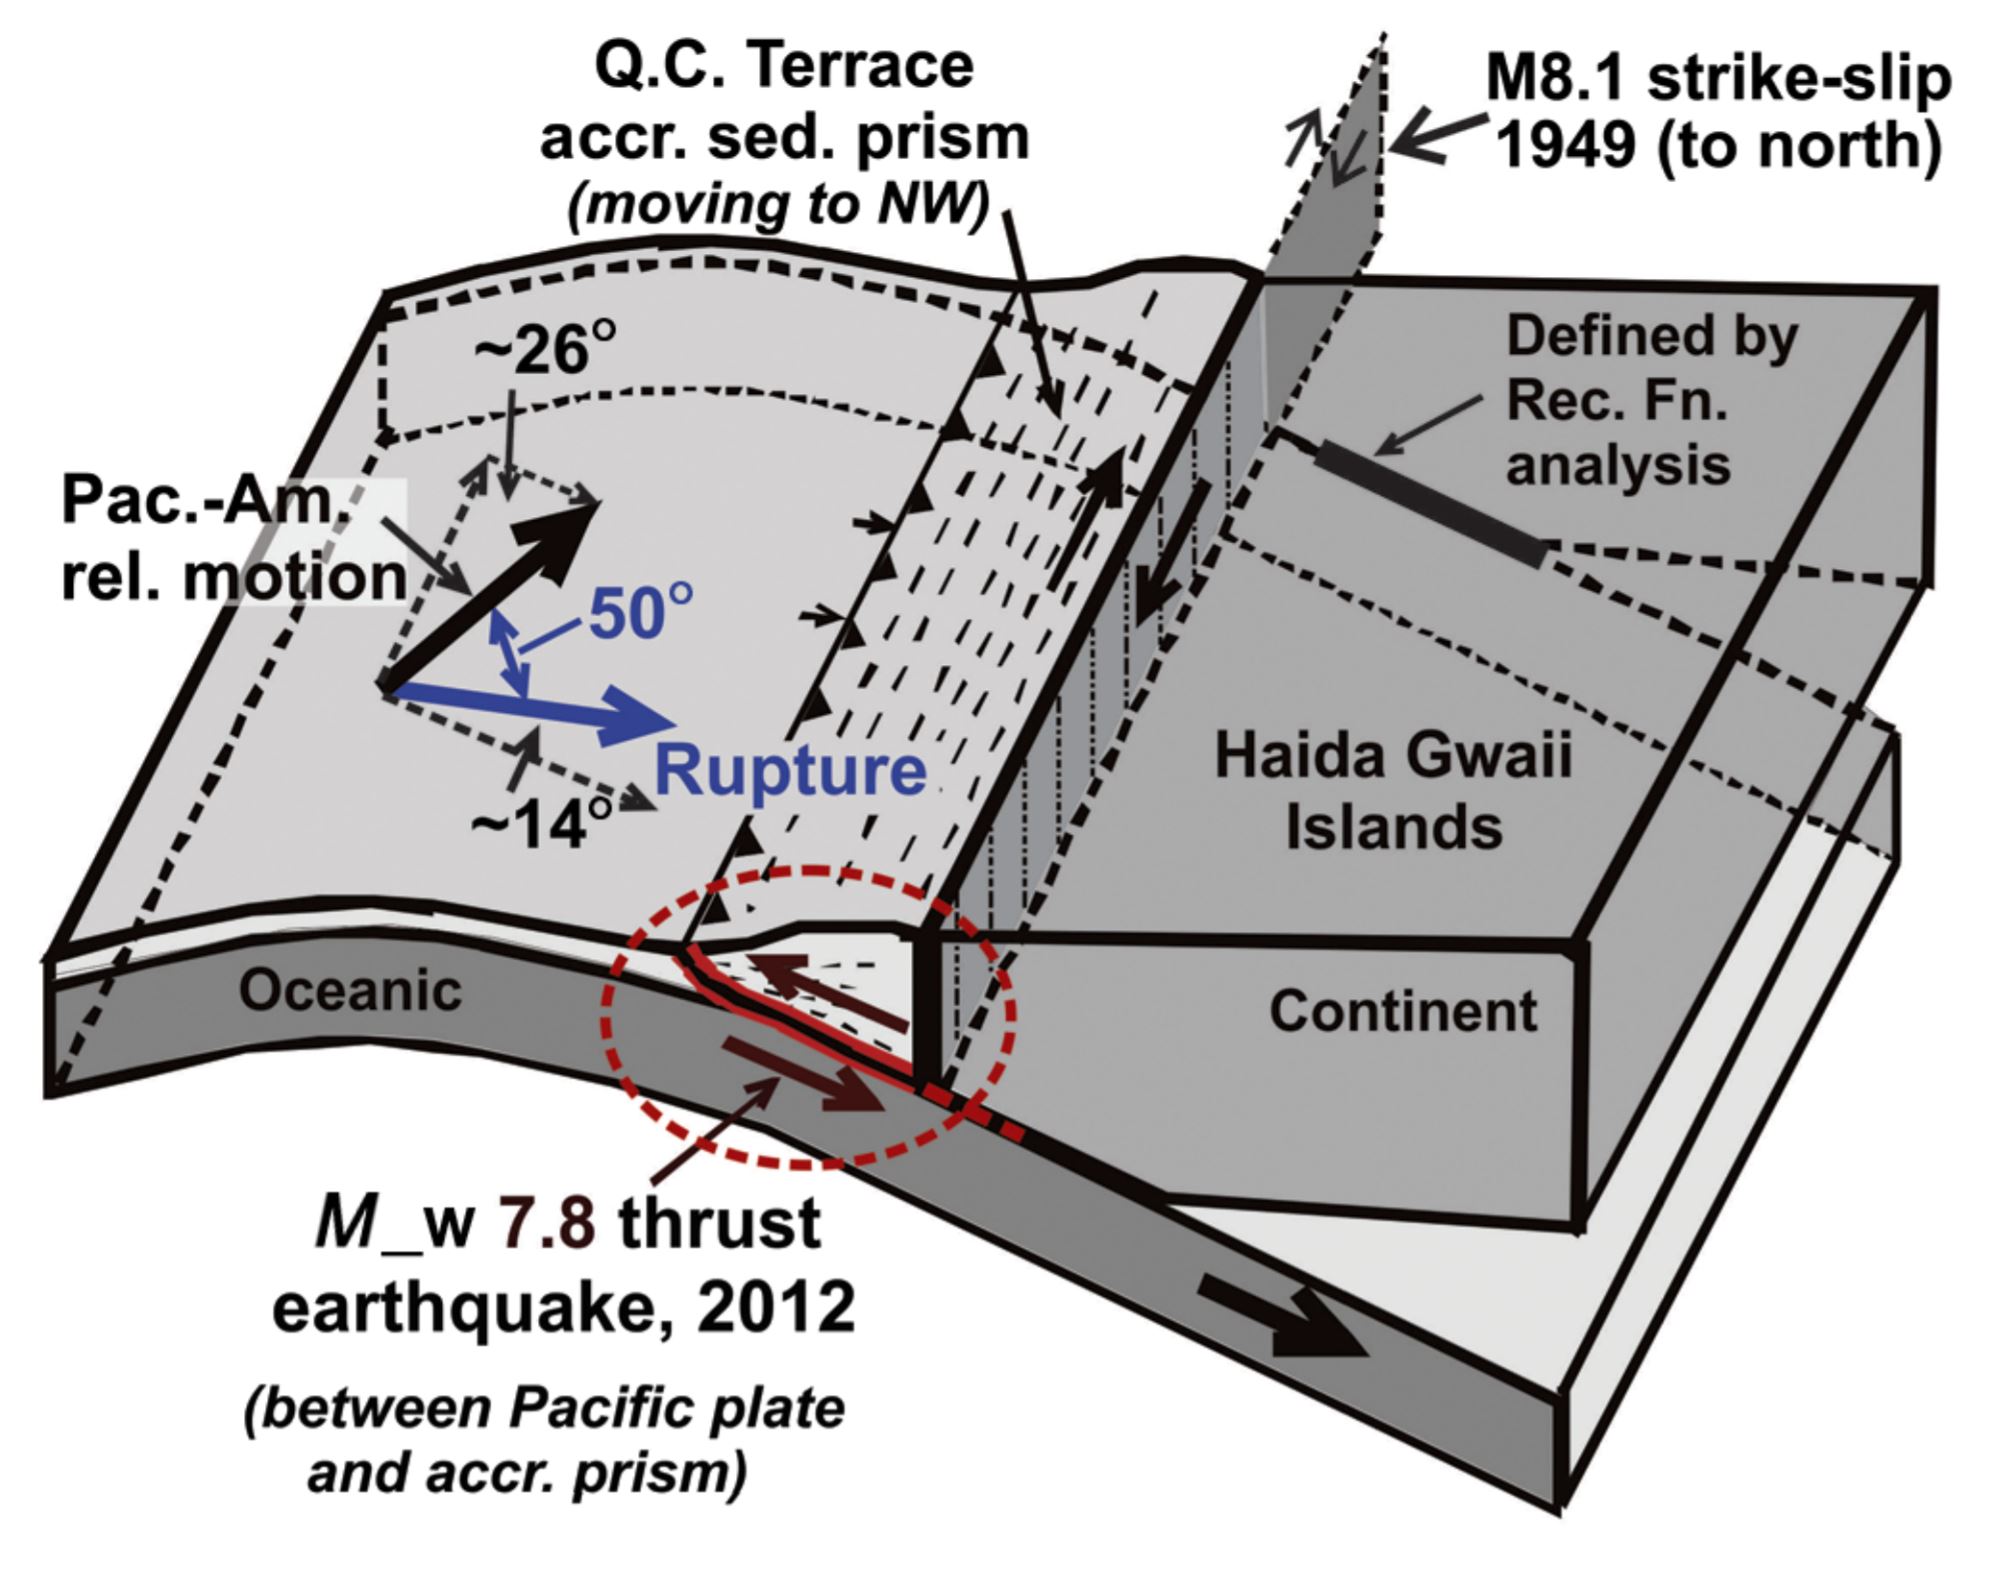
Model for the 2012 Mw 7.8 earthquake rupture and the partitioning of oblique convergence into margin parallel motion on the Queen Charlotte transcurrent fault and nearly orthogonal thrust convergence on the Haida Gwaii thrust fault.
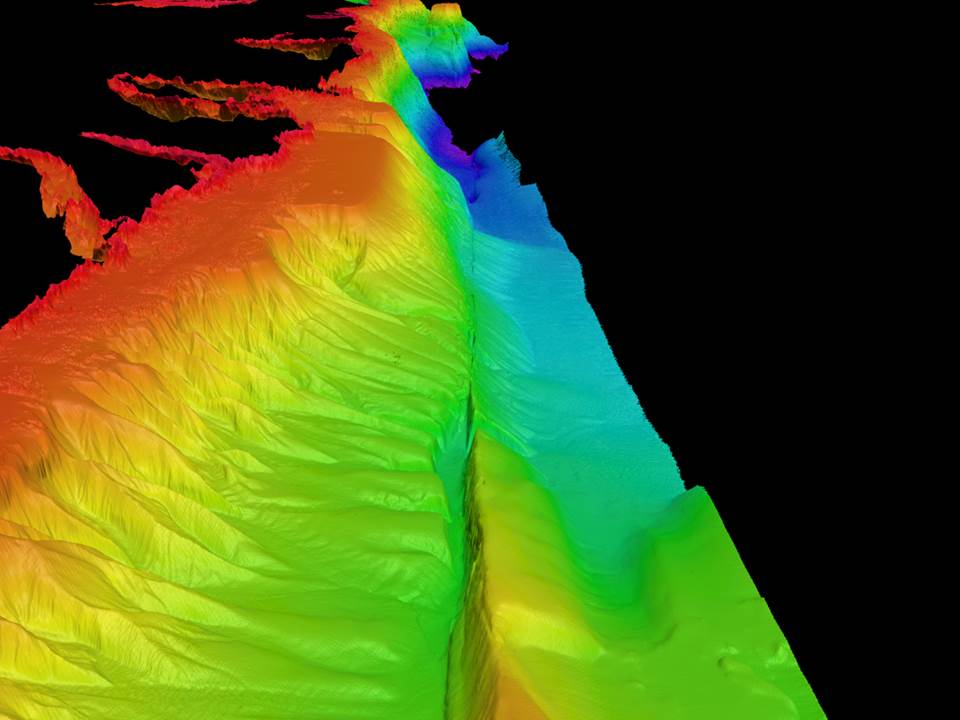
- Here is a fantastic view of the QCF. This is a plot of multibeam bathymetry from offshore of Haida Gwaii. This was posted by John Cassidy from his twitter feed. More about the cruise when these data were collected can be found here.
- Here is a figure that shows two ways of interpreting the Queen Charlotte triple junction region (Kreemer et al., 1998). Note the 1900-2017 seismicity map above, which supports the interpretation in the right panel (B). Something of trivial nature is that this article is from the pre-computer illustration era (see the squiggly hand drawn arrow in the right panel B). Below I include the text from the original figure caption in blockquote.

(A) Major tectonic features describing the micro-plate model for the Explorer region. The Explorer plate (EXP) is an independent plate and is in convergent motion towards the North American plate (NAM). V.I. D Vancouver Island; PAC D the Pacific plate; JdF D the Juan the Fuca plate. The accentuated zone between the Explorer and JdF ridges is the Sovanco transform zone and the two boundary lines do not indicate the presence of faults but define the boundaries of this zone of complex deformation. (B) The key features of the pseudo-plate model for the region are a major plate boundary transform fault zone between the North American and Pacific plates and the Nootka Transform, a left-lateral transform fault north of the Juan the Fuca plate.
Geologic Fundamentals
- For more on the graphical representation of moment tensors and focal mechnisms, check this IRIS video out:
- Here is a fantastic infographic from Frisch et al. (2011). This figure shows some examples of earthquakes in different plate tectonic settings, and what their fault plane solutions are. There is a cross section showing these focal mechanisms for a thrust or reverse earthquake. The upper right corner includes my favorite figure of all time. This shows the first motion (up or down) for each of the four quadrants. This figure also shows how the amplitude of the seismic waves are greatest (generally) in the middle of the quadrant and decrease to zero at the nodal planes (the boundary of each quadrant).

- Here is another way to look at these beach balls.
The two beach balls show the stike-slip fault motions for the M6.4 (left) and M6.0 (right) earthquakes. Helena Buurman's primer on reading those symbols is here. pic.twitter.com/aWrrb8I9tj
— AK Earthquake Center (@AKearthquake) August 15, 2018
- There are three types of earthquakes, strike-slip, compressional (reverse or thrust, depending upon the dip of the fault), and extensional (normal). Here is are some animations of these three types of earthquake faults. The following three animations are from IRIS.
Strike Slip:
Compressional:
Extensional:
- This is an image from the USGS that shows how, when an oceanic plate moves over a hotspot, the volcanoes formed over the hotspot form a series of volcanoes that increase in age in the direction of plate motion. The presumption is that the hotspot is stable and stays in one location. Torsvik et al. (2017) use various methods to evaluate why this is a false presumption for the Hawaii Hotspot.
- Here is a map from Torsvik et al. (2017) that shows the age of volcanic rocks at different locations along the Hawaii-Emperor Seamount Chain.

A cutaway view along the Hawaiian island chain showing the inferred mantle plume that has fed the Hawaiian hot spot on the overriding Pacific Plate. The geologic ages of the oldest volcano on each island (Ma = millions of years ago) are progressively older to the northwest, consistent with the hot spot model for the origin of the Hawaiian Ridge-Emperor Seamount Chain. (Modified from image of Joel E. Robinson, USGS, in “This Dynamic Planet” map of Simkin and others, 2006.)

Hawaiian-Emperor Chain. White dots are the locations of radiometrically dated seamounts, atolls and islands, based on compilations of Doubrovine et al. and O’Connor et al. Features encircled with larger white circles are discussed in the text and Fig. 2. Marine gravity anomaly map is from Sandwell and Smith.
- 1700.09.26 M 9.0 Cascadia’s 315th Anniversary 2015.01.26
- 1700.09.26 M 9.0 Cascadia’s 316th Anniversary 2016.01.26 updated in 2017 and 2018
- 1992.04.25 M 7.1 Cape Mendocino 25 year remembrance
- 1992.04.25 M 7.1 Cape Mendocino 25 Year Remembrance Event Page
- Earthquake Information about the CSZ 2015.10.08
- 2018.07.24 M 5.6 Gorda plate
- 2018.03.22 M 4.6/4.7 Gorda plate
- 2017.07.28 M 5.1 Gorda plate
- 2016.09.25 M 5.0 Gorda plate
- 2016.09.25 M 5.0 Gorda plate
- 2016.01.30 M 5.0 Gorda plate
- 2015.12.29 M 4.9 Gorda plate
- 2015.11.18 M 3.2 Gorda plate
- 2014.03.13 M 5.2 Gorda Rise
- 2014.03.09 M 6.8 Gorda plate p-1
- 2014.03.23 M 6.8 Gorda plate p-2
- 2018.08.22 M 6.2 Blanco fracture zone
- 2018.07.29 M 5.3 Blanco fracture zone
- 2015.06.01 M 5.8 Blanco fracture zone p-1
- 2015.06.01 M 5.8 Blanco fracture zone p-2 (animations)
- 2018.01.25 M 5.8 Mendocino fault
- 2017.09.22 M 5.7 Mendocino fault
- 2016.12.08 M 6.5 Mendocino fault, CA
- 2016.12.08 M 6.5 Mendocino fault, CA Update #1
- 2016.12.05 M 4.3 Petrolia CA
- 2016.10.27 M 4.1 Mendocino fault
- 2016.09.03 M 5.6 Mendocino
- 2016.01.02 M 4.5 Mendocino fault
- 2015.11.01 M 4.3 Mendocino fault
- 2015.01.28 M 5.7 Mendocino fault
- 2017.03.06 M 4.0 Cape Mendocino
- 2016.11.02 M 3.6 Oregon
- 2016.01.07 M 4.2 NAP(?)
- 2015.10.29 M 3.4 Bayside
- 2018.10.22 M 6.8 Explorer plate
- 2017.01.07 M 5.7 Explorer plate
- 2016.03.19 M 5.2 Explorer plate
- 2017.06.11 M 3.5 Gorda or NAP?
- 2016.07.21 M 4.7 Gorda or NAP? p-1
- 2016.07.21 M 4.7 Gorda or NAP? p-2
Cascadia subduction zone
General Overview
Earthquake Reports
Gorda plate
Blanco fracture zone
Mendocino fault
Mendocino triple junction
North America plate
Explorer plate
Uncertain
Social Media
Ground motion visualization for the largest of the 3 #earthquakes (M6.8) off the coast of Vancouver Island https://t.co/B3F8sA1Z1D pic.twitter.com/G4YB7LRgSk
— IRIS Earthquake Sci (@IRIS_EPO) October 22, 2018
Small #earthquake near Yosemite NP California riding on the surface waves of the M6.5+ #earthquakes W of Vancouver earthquakes.
Velocity (above) and acceleration (below, shows higher frequencies)https://t.co/pudAofzBZlhttps://t.co/bNfQHu9bf1 pic.twitter.com/z5YWbHer2R— Anthony Lomax 🌍🇪🇺 (@ALomaxNet) October 22, 2018
- Atwater, B.F., Musumi-Rokkaku, S., Satake, K., Tsuju, Y., Eueda, K., and Yamaguchi, D.K., 2005. The Orphan Tsunami of 1700—Japanese Clues to a Parent Earthquake in North America, USGS Professional Paper 1707, USGS, Reston, VA, 144 pp.
- Braunmiller, J. and Nabelek, J., 2002. Seismotectonics of the Explorer region in JGR, v. 107, NO. B10, 2208, doi:10.1029/2001JB000220, 2002
- Chaytor, J.D., Goldfinger, C., Dziak, R.P., and Fox, C.G., 2004. Active deformation of the Gorda plate: Constraining deformation models with new geophysical data: Geology v. 32, p. 353-356.
- Audet, P., Bostock, M.G., Mercier, J.-P., and Cassidy, J.F., 2008., Morphology of the Explorer–Juan de Fuca slab edge in northern Cascadia: Imaging plate capture at a ridge-trench-transform triple junction in Geology, v. 36, p. 895-898.
- Clarke, S. H., and Carver, G. C., 1992. Late Holocene Tectonics and Paleoseismicity, Southern Cascadia Subduction Zone, Science, vol. 255:188-192.
- Dziak, R.P., 2006. Explorer deformation zone: Evidence of a large shear zone and reorganization of the Pacific–Juan de Fuca–North American triple junction in Geology, v. 34, p. 213-216.
- Flück, P., Hyndman, R. D., Rogers, G. C., and Wang, K., 1997. Three-Dimensional Dislocation Model for Great Earthquakes of the Cascadia Subduction Zone, Journal of Geophysical Research, vol. 102: 20,539-20,550.
- Heaton, f f., Kanamori, F. F., 1984. Seismic Potential Associated with Subduction in the Northwest United States, Bulletin of the Seismological Society of America, vol. 74: 933-941.
- Hyndman, R. D., and Wang, K., 1995. The rupture zone of Cascadia great earthquakes from current deformation and the thermal regime, Journal of Geophysical Research, vol. 100: 22,133-22,154.
- Keemer, C., Govers, R., Furlong, K.P., and Holt, W.E., 1998. Plate boundary deformation between the Pacific and North America in the Explorer region in Tectonophysics, v. 293, p. 225-238.
- Meyer, B., Saltus, R., Chulliat, a., 2017. EMAG2: Earth Magnetic Anomaly Grid (2-arc-minute resolution) Version 3. National Centers for Environmental Information, NOAA. Model. doi:10.7289/V5H70CVX
- McPherson, R. M., 1989. Seismicity and Focal Mechanisms Near Cape Mendocino, Northern California: 1974-1984: M. S. thesis, Arcata, California, Humboldt State University, 75 p
- Nelson, A.R., Asquith, A.C., and Grant, W.C., 2004. Great Earthquakes and Tsunamis of the Past 2000 Years at the Salmon River Estuary, Central Oregon Coast, USA: Bulletin of the Seismological Society of America, Vol. 94, No. 4, pp. 1276–1292
- Plafker, G., 1972. Alaskan earthquake of 1964 and Chilean earthquake of 1960: Implications for arc tectonics in Journal of Geophysical Research, v. 77, p. 901-925.
- Riddihough, R., 1984. Recent Movements of the Juan de Fuca Plate System in JGR, v. 89, no. B8, p. 6980-6994.
- Wang, K., Wells, R., Mazzotti, S., Hyndman, R. D., and Sagiya, T., 2003. A revised dislocation model of interseismic deformation of the Cascadia subduction zone Journal of Geophysical Research, B, Solid Earth and Planets v. 108, no. 1.
References:
Return to the Earthquake Reports page.