We just had an interesting earthquake in the region of the Mendocino triple junction. Recent earthquakes in this region show different fault plane solutions, owing to complexity of this area.
In 1983 there was an earthquake ~10 km to the west of today’s earthquake which had a right-lateral oblique compressional focal mechanism. In 2015, there was an earthquake ~15 km to the east of today’s earthquake that also had a right-lateral strike-slip moment tensor. If today’s earthquake was oblique, it would be left-lateral extensional. Today’s earthquake is quite interesting. I will need to think about it further.
-
Here are some USGS websites for earthquakes discussed below.
- 1983.08.24 M 5.5 Mendocino
- 2015.01.28 M 5.7 Mendocino
- 2016.12.08 M 6.5 Mendocino
- 2017.03.06 M 4.0 Mendocino
-
Here are some Earthquake Reports for earthquakes discussed below.
- 2015.01.28 M 5.7 Mendocino
- 2015.01.28 M 5.7 Mendocino UPDATE #1
- 2016.12.08 M 6.5 Mendocino
- 2016.12.08 M 6.5 Mendocino UPDATE #1
- 2017.03.06 M 4.0 Mendocino
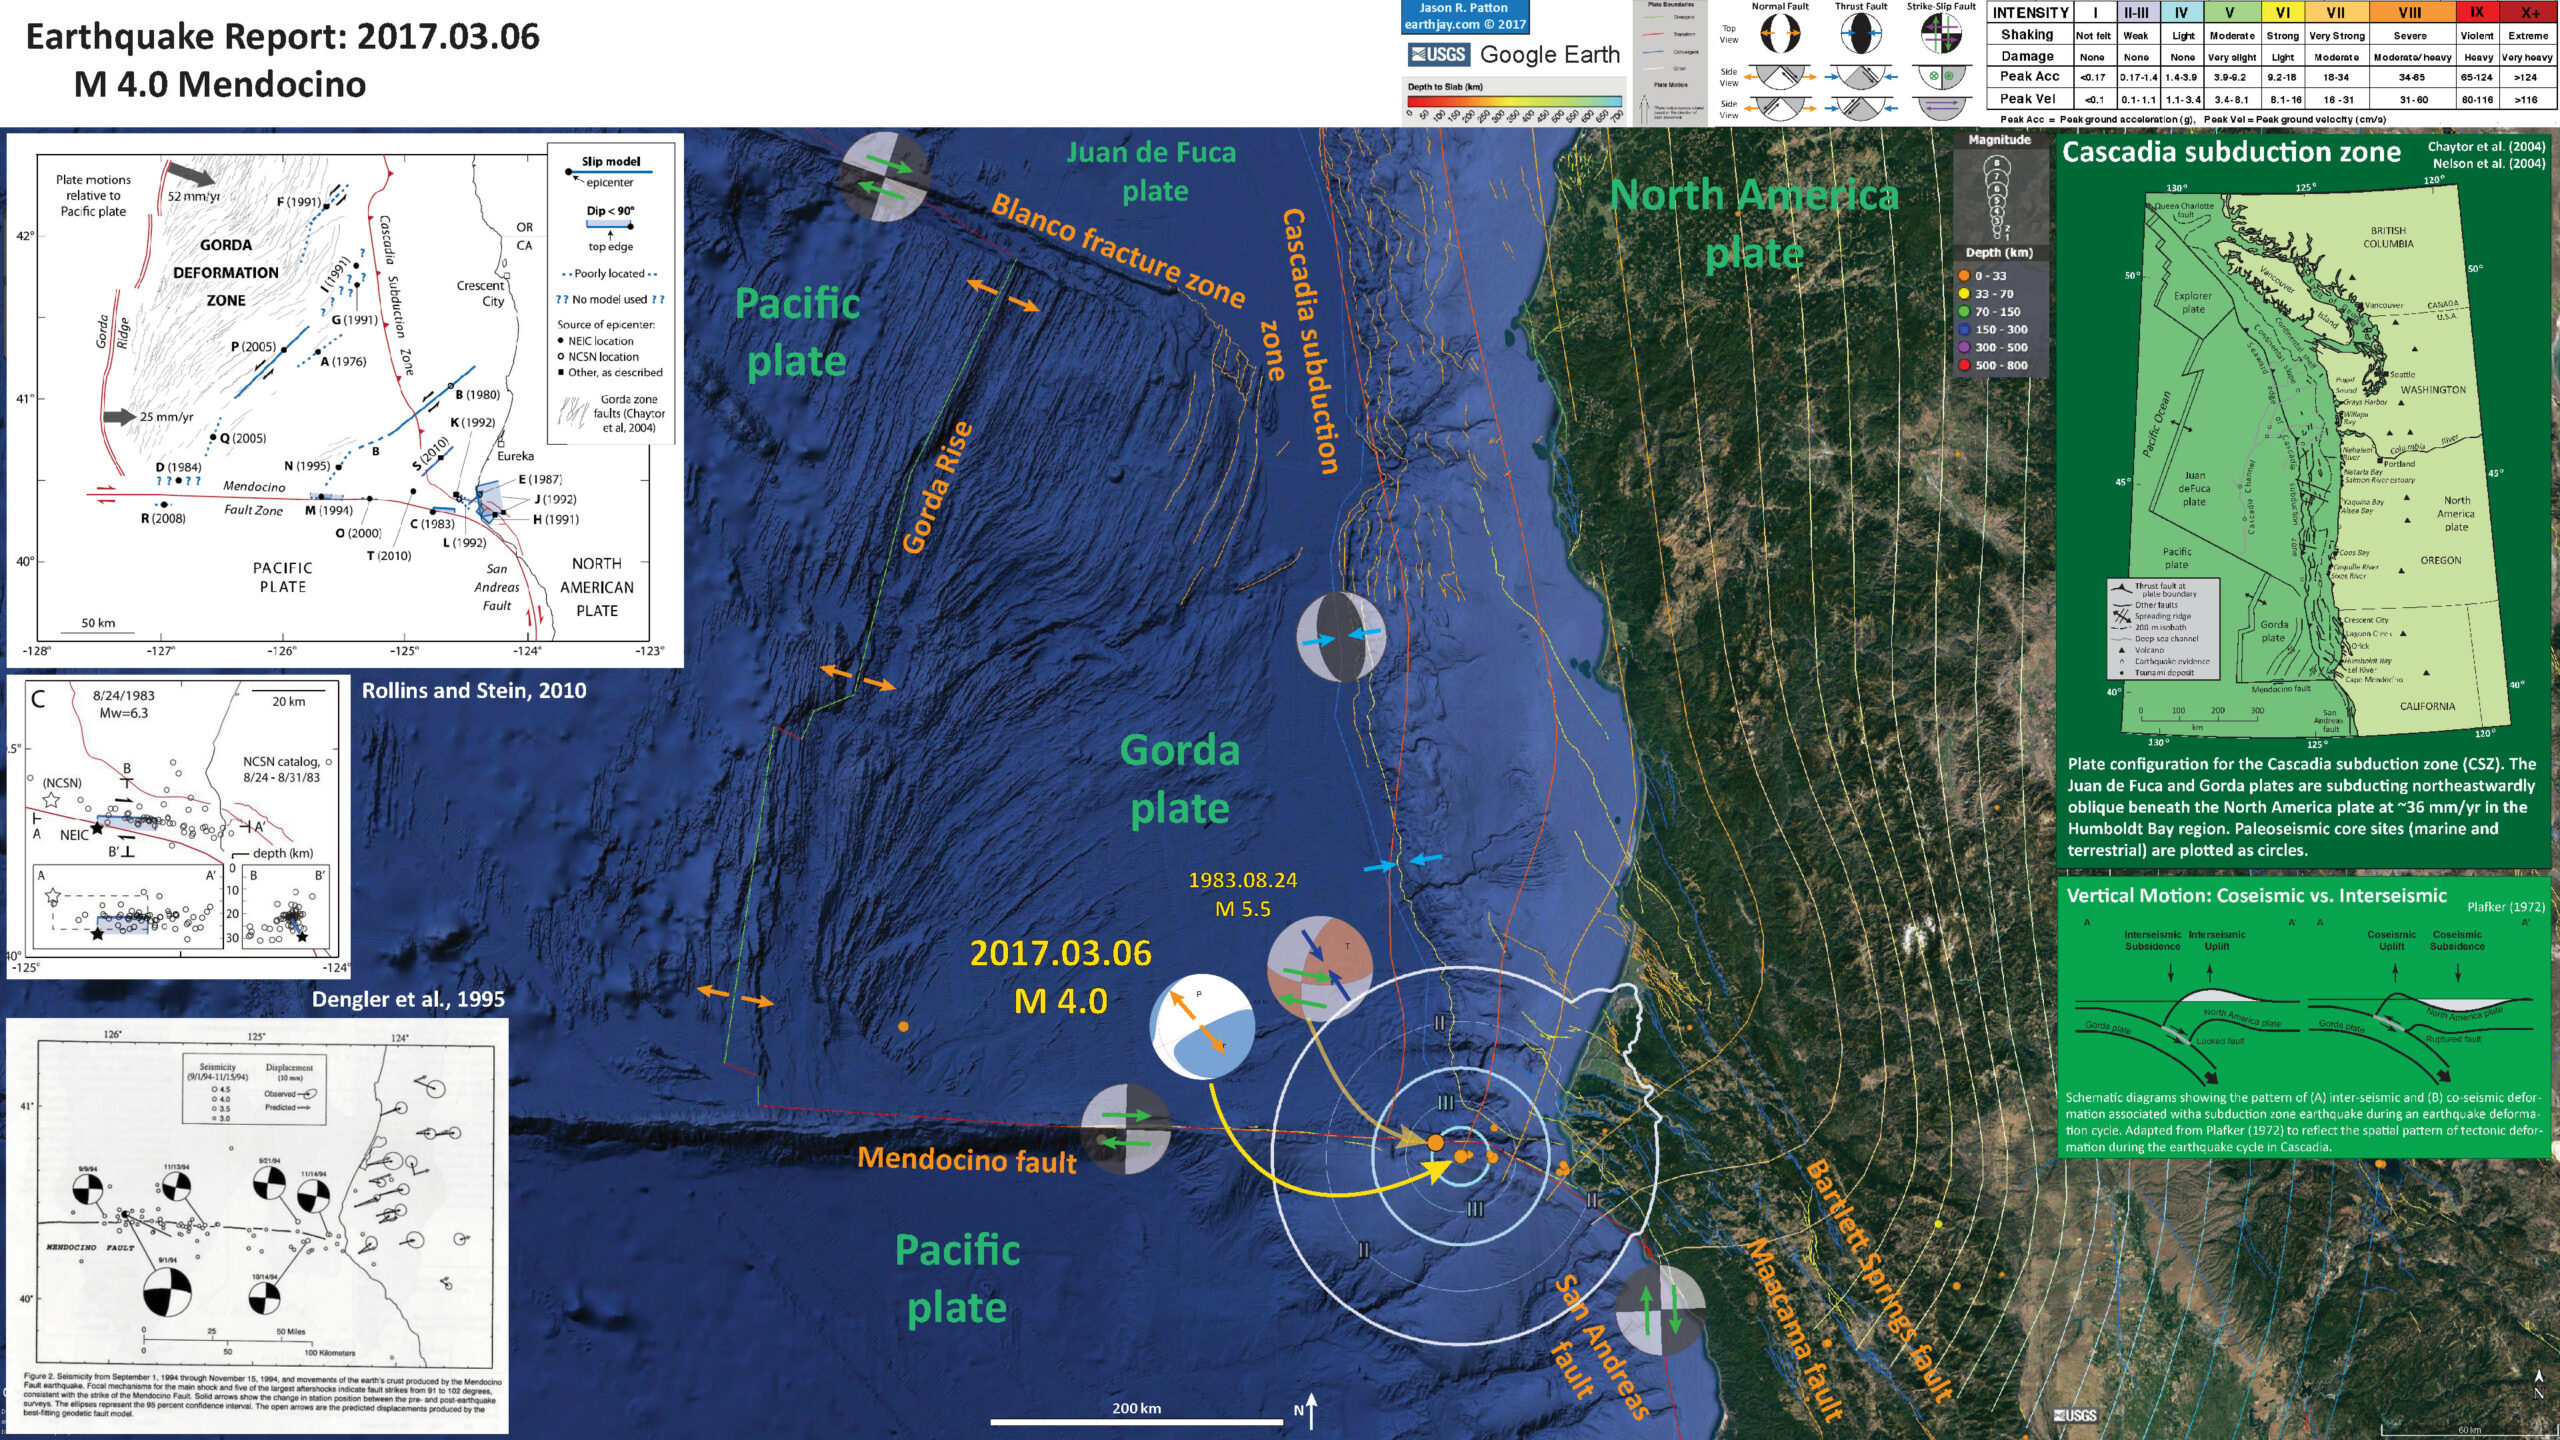
Below is my interpretive poster for this earthquake.
I plot the seismicity from the past month, with color representing depth and diameter representing magnitude (see legend).
- I placed a moment tensor / focal mechanism legend on the poster. There is more material from the USGS web sites about moment tensors and focal mechanisms (the beach ball symbols). Both moment tensors and focal mechanisms are solutions to seismologic data that reveal two possible interpretations for fault orientation and sense of motion. One must use other information, like the regional tectonics, to interpret which of the two possibilities is more likely. The moment tensor shows northwest-southeast compression. This is very strange. I initially thought it was a compressional earthquake (slightly oblique), but now interpret this as an extensional earthquake. I am struggling to explain this.
- I also include the shaking intensity contours on the map. These use the Modified Mercalli Intensity Scale (MMI; see the legend on the map). This is based upon a computer model estimate of ground motions, different from the “Did You Feel It?” estimate of ground motions that is actually based on real observations. The MMI is a qualitative measure of shaking intensity. More on the MMI scale can be found here and here. This is based upon a computer model estimate of ground motions, different from the “Did You Feel It?” estimate of ground motions that is actually based on real observations.
- I include the slab contours plotted (Hayes et al., 2012), which are contours that represent the depth to the subduction zone fault. These are mostly based upon seismicity. The depths of the earthquakes have considerable error and do not all occur along the subduction zone faults, so these slab contours are simply the best estimate for the location of the fault.
- In the upper right corner is a map of the Cascadia subduction zone (CSZ) and regional tectonic plate boundary faults. This is modified from several sources (Chaytor et al., 2004; Nelson et al., 2004)
- Below the CSZ map is an illustration modified from Plafker (1972). This figure shows how a subduction zone deforms between (interseismic) and during (coseismic) earthquakes. Today’s earthquake did not occur along the CSZ, so did not produce crustal deformation like this. However, it is useful to know this when studying the CSZ.
- In the upper left corner is a figure from Rollins and Stein (2010). In their paper they discuss how static coulomb stress changes from earthquakes may impart (or remove) stress from adjacent crust/faults. I also present their figure where they present seismic observations for the 1983.08.24 M 5.5 earthquake (Rollins and Stein list M 6.3).
- In the lower left corner is a figure from Dengler et al. (1995) that shows focal mechanisms from earthquakes in this region, along the Mendocino fault. Today’s earthquake is near the 1994 earthquake.
I include some inset figures in the poster.
- Here is a map from Rollins and Stein, showing their interpretations of different historic earthquakes in the region. This was published in response to the January 2010 Gorda plate earthquake. The faults are from Chaytor et al. (2004). The 1980, 1992, 1994, 2005, and 2010 earthquakes are plotted and labeled. I did not mention the 2010 earthquake, but it most likely was just like 1980 and 2005, a left-lateral strike-slip earthquake on a northeast striking fault.
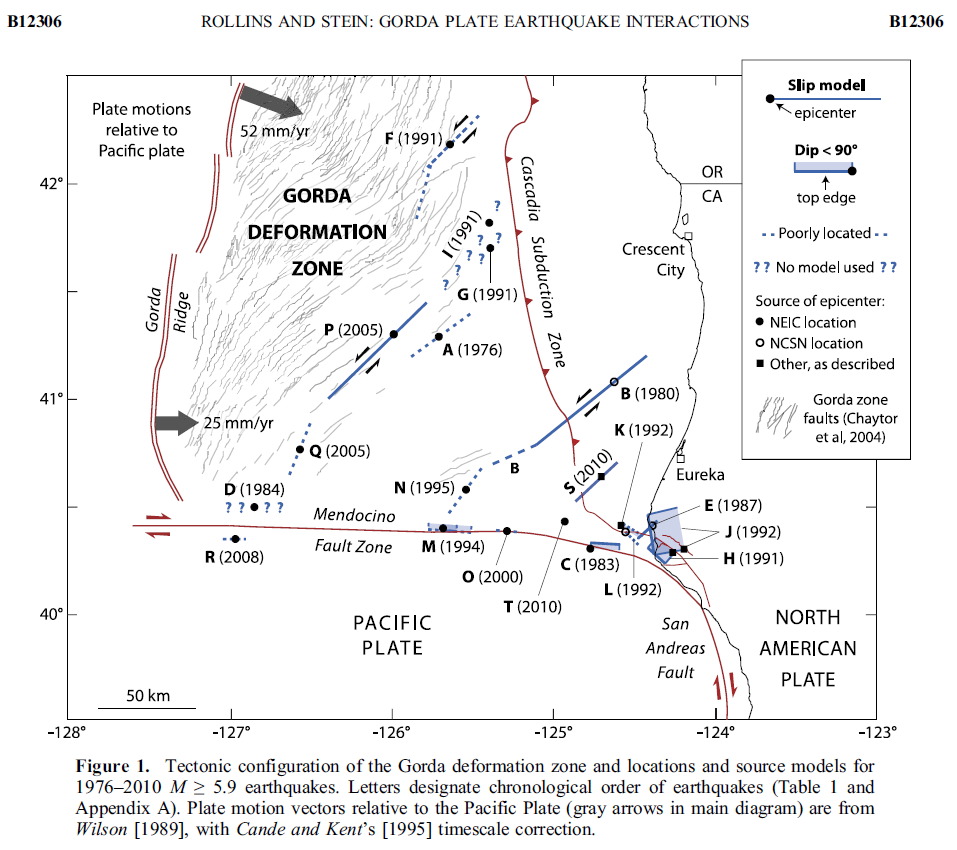
Tectonic configuration of the Gorda deformation zone and locations and source models for 1976–2010 M ≥ 5.9 earthquakes. Letters designate chronological order of earthquakes (Table 1 and Appendix A). Plate motion vectors relative to the Pacific Plate (gray arrows in main diagram) are from Wilson [1989], with Cande and Kent’s [1995] timescale correction.
- Here is a large scale map of the 1983 earthquake. The mainshock epicenter is a black star and epicenters are denoted as white circles. This earthquake is interpreted to be strike slip oblique (compression).

Source models for earthquakes A and B, 26 November 1976, Mw = 6.7, and 8 November 1980, Mw = 7.3; C, 24 August 1983, Mw = 6.1 (poorly constrained); D, 10 September 1984, Mw = 6.6 (no model made); E, 31 July 1987, Mw = 6.0, “WS2008” refers to Waldhauser and Schaff ’s [2008] double‐difference catalog; F, 13 July 1991, Mw = 6.8 (poorly constrained); G, 16 August 1991 (2226 UTC), Mw = 6.3 (no model made), open circles are NCSN locations for 16 August 1991 (2226 UTC) to 17 August 1991 (2216 UTC); H, 17 August 1991 (1929 UTC),Mw = 6.1; I, 17 August 1991 (2217 UTC), Mw = 7.1 (no model made); J, 25 April 1992, Mw = 6.9, open circles are from Waldhauser and Schaff ’s [2008] earthquake locations for 25 April 1992 (1806 UTC) to 26 April 1992 (0741 UTC); K and L, 26 April 1992 (0741 UTC), Mw = 6.5 and 26 April 1992 (1118 UTC), Mw = 6.6 (both poorly constrained), seismicity shallower than 15 km was excluded so that shallow aftershocks of (J) do not crowd figure; M, 1 September 1994, Mw = 7.0; N and O, 19 February 1995, Mw = 6.6, and 16 March 2000, Mw = 5.9; P, Q, and R, 15 June 2005, Mw = 7.2, 17 June 2005, Mw = 6.6 (poorly constrained), and 28 November 2008, Mw = 5.9 (poorly constrained); S and T, 10 January 2010, M = 6.5, and 4 February 2010, Mw = 5.9; Z, 18 April 1906, M = 7.8.
- Here is a plot of focal mechanisms from the Dengler et al. (1995) paper in California Geology.

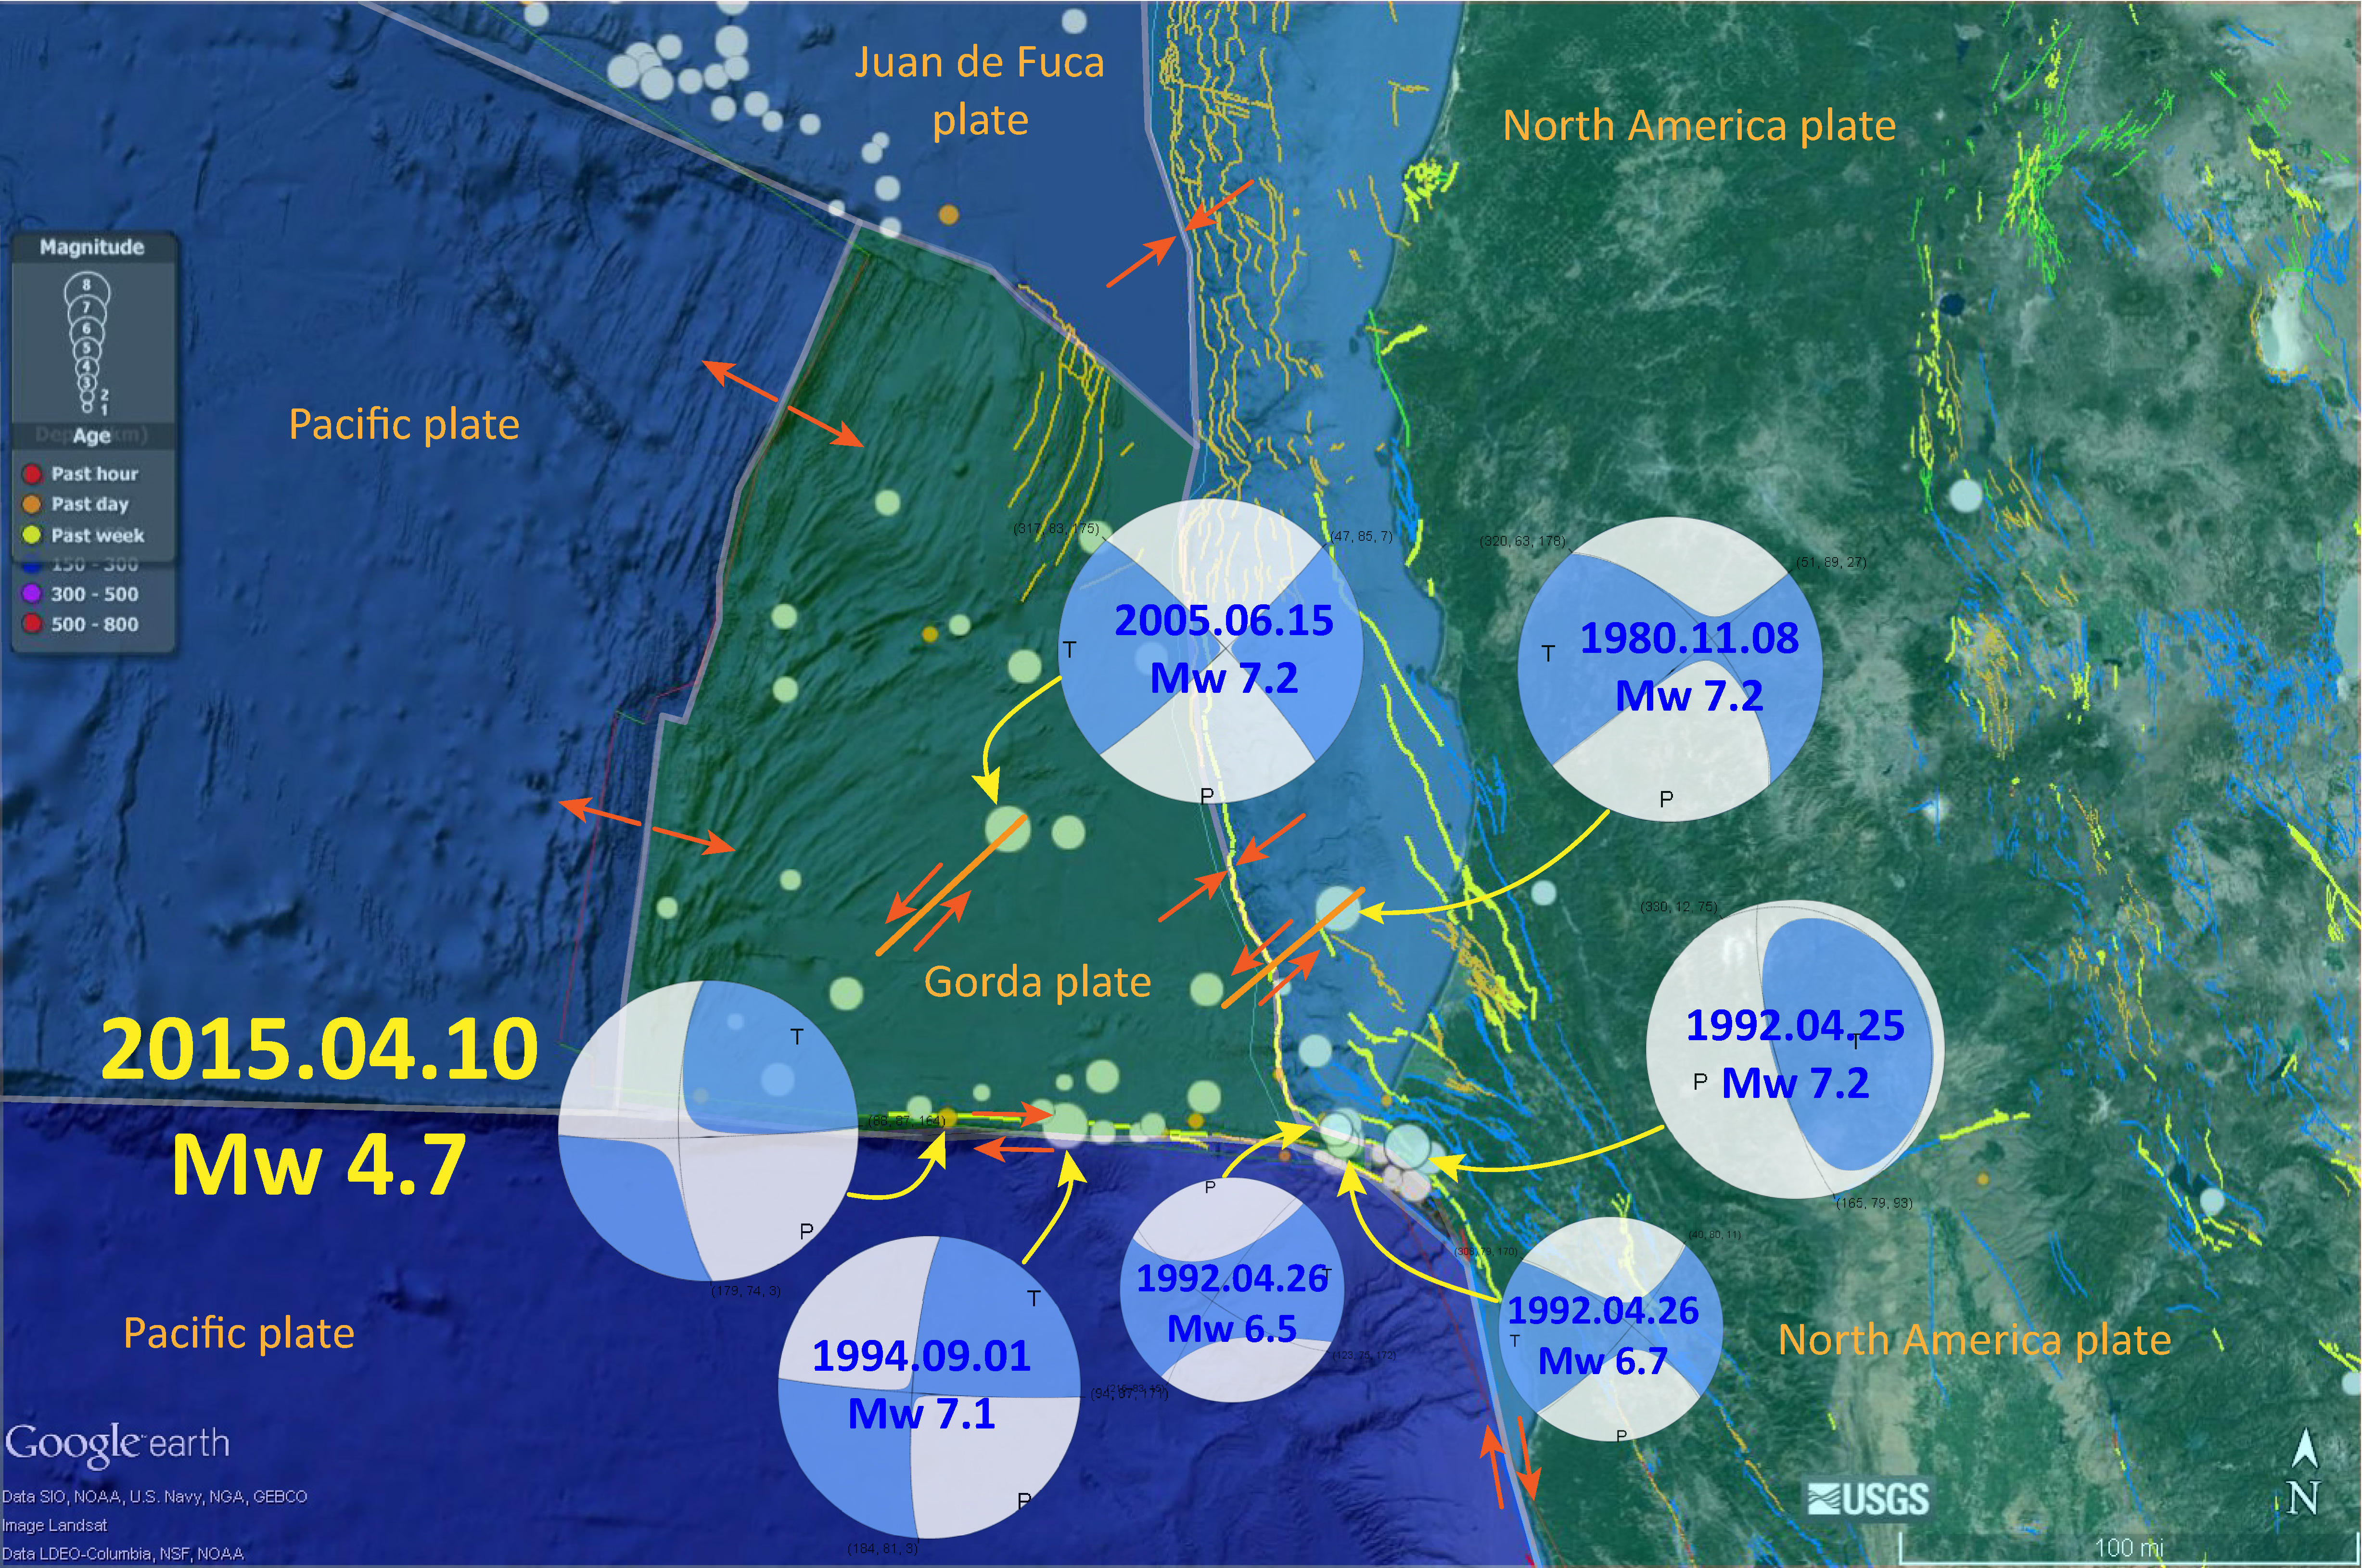
- In this map below, I label a number of other significant earthquakes in this Mendocino triple junction region. Another historic right-lateral earthquake on the Mendocino fault system was in 1994. There was a series of earthquakes possibly along the easternmost section of the Mendocino fault system in late January 2015, here is my post about that earthquake series.
There are three types of earthquakes, strike-slip, compressional (reverse or thrust, depending upon the dip of the fault), and extensional (normal). Here is are some animations of these three types of earthquake faults. Many of the earthquakes people are familiar with in the Mendocino triple junction region are either compressional or strike slip. The following three animations are from IRIS.
Strike Slip:
Compressional:
Extensional:
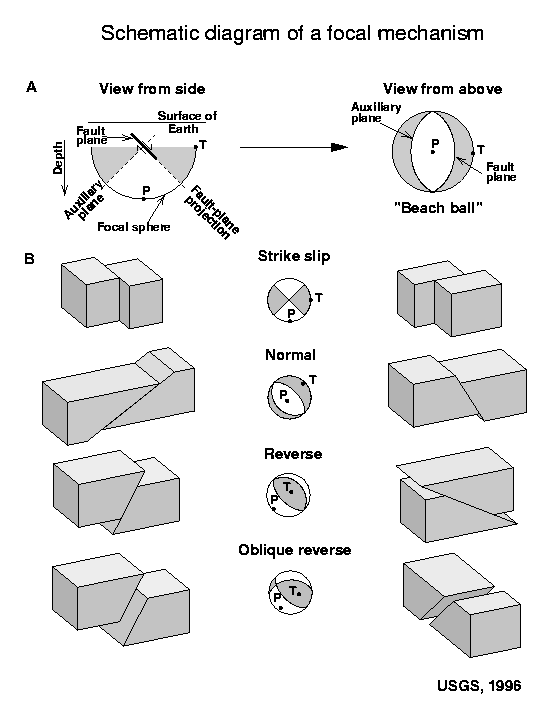
Here is a primer that helps people learn how to interpret focal mechanisms and moment tensors. Moment tensors are calculated differently from focal mechanisms, but the interpretation of their graphical solution is similar. This is from the USGS.
For more on the graphical representation of moment tensors and focal mechnisms, check this IRIS video out:
This figure shows what a transform plate boundary fault is. Looking down from outer space, the crust on either side of the fault moves side-by-side. When one is standing on the ground, on one side of the fault, looking across the fault as it moves… If the crust on the other side of the fault moves to the right, the fault is a “right lateral” strike slip fault. The Mendocino and San Andreas faults are right-lateral (dextral) strike-slip faults.
![]()
Here is an IRIS animation showing a transform plate boundary fault as it relates to spreading ridges.
- Atwater, B.F., Musumi-Rokkaku, S., Satake, K., Tsuju, Y., Eueda, K., and Yamaguchi, D.K., 2005. The Orphan Tsunami of 1700—Japanese Clues to a Parent Earthquake in North America, USGS Professional Paper 1707, USGS, Reston, VA, 144 pp.
- Chaytor, J.D., Goldfinger, C., Dziak, R.P., and Fox, C.G., 2004. Active deformation of the Gorda plate: Constraining deformation models with new geophysical data: Geology v. 32, p. 353-356.
- Dengler, L.A., Moley, K.M., McPherson, R.C., Pasyanos, M., Dewey, J.W., and Murray, M., 1995. The September 1, 1994 Mendocino Fault Earthquake, California Geology, Marc/April 1995, p. 43-53.
- Geist, E.L. and Andrews D.J., 2000. Slip rates on San Francisco Bay area faults from anelastic deformation of the continental lithosphere, Journal of Geophysical Research, v. 105, no. B11, p. 25,543-25,552.
- Irwin, W.P., 1990. Quaternary deformation, in Wallace, R.E. (ed.), 1990, The San Andreas Fault system, California: U.S. Geological Survey Professional Paper 1515, online at: http://pubs.usgs.gov/pp/1990/1515/
- McLaughlin, R.J., Sarna-Wojcicki, A.M., Wagner, D.L., Fleck, R.J., Langenheim, V.E., Jachens, R.C., Clahan, K., and Allen, J.R., 2012. Evolution of the Rodgers Creek–Maacama right-lateral fault system and associated basins east of the northward-migrating Mendocino Triple Junction, northern California in Geosphere, v. 8, no. 2., p. 342-373.
- Nelson, A.R., Asquith, A.C., and Grant, W.C., 2004. Great Earthquakes and Tsunamis of the Past 2000 Years at the Salmon River Estuary, Central Oregon Coast, USA: Bulletin of the Seismological Society of America, Vol. 94, No. 4, pp. 1276–1292
- Rollins, J.C. and Stein, R.S., 2010. Coulomb stress interactions among M ≥ 5.9 earthquakes in the Gorda deformation zone and on the Mendocino Fault Zone, Cascadia subduction zone, and northern San Andreas Fault: Journal of Geophysical Research, v. 115, B12306, doi:10.1029/2009JB007117, 2010.
- Stoffer, P.W., 2006, Where’s the San Andreas Fault? A guidebook to tracing the fault on public lands in the San Francisco Bay region: U.S. Geological Survey General Interest Publication 16, 123 p., online at http://pubs.usgs.gov/gip/2006/16/
- Wallace, Robert E., ed., 1990, The San Andreas fault system, California: U.S. Geological Survey Professional Paper 1515, 283 p. [http://pubs.usgs.gov/pp/1988/1434/].