I was at a workshop to develop a unified strategy for research and monitoring in the Klamath River estuary (led by the Yurok Tribe, Andreas Krauss) yesterday and missed feeling the first of two M 4.6-4.7 earthquakes. I was presenting the results from our tectonic geodetic studies as they moderate Sea Level Rise at the mouth of the Klamath River (and control sedimentation there). However, I was home in Manila, CA when the second earthquake hit. I felt a sharp and short motion (1-2 seconds max in duration). But I was exhausted still from the death of my cat Chicken. So, I needed to wait until today to put this report together.
The Cascadia subduction zone (CSZ) is a convergent plate boundary fault formed by the interaction between the downgoing oceanic Gorda plate (GP) beneath the continental North America plate (NAP). More about the CSZ can be found here.
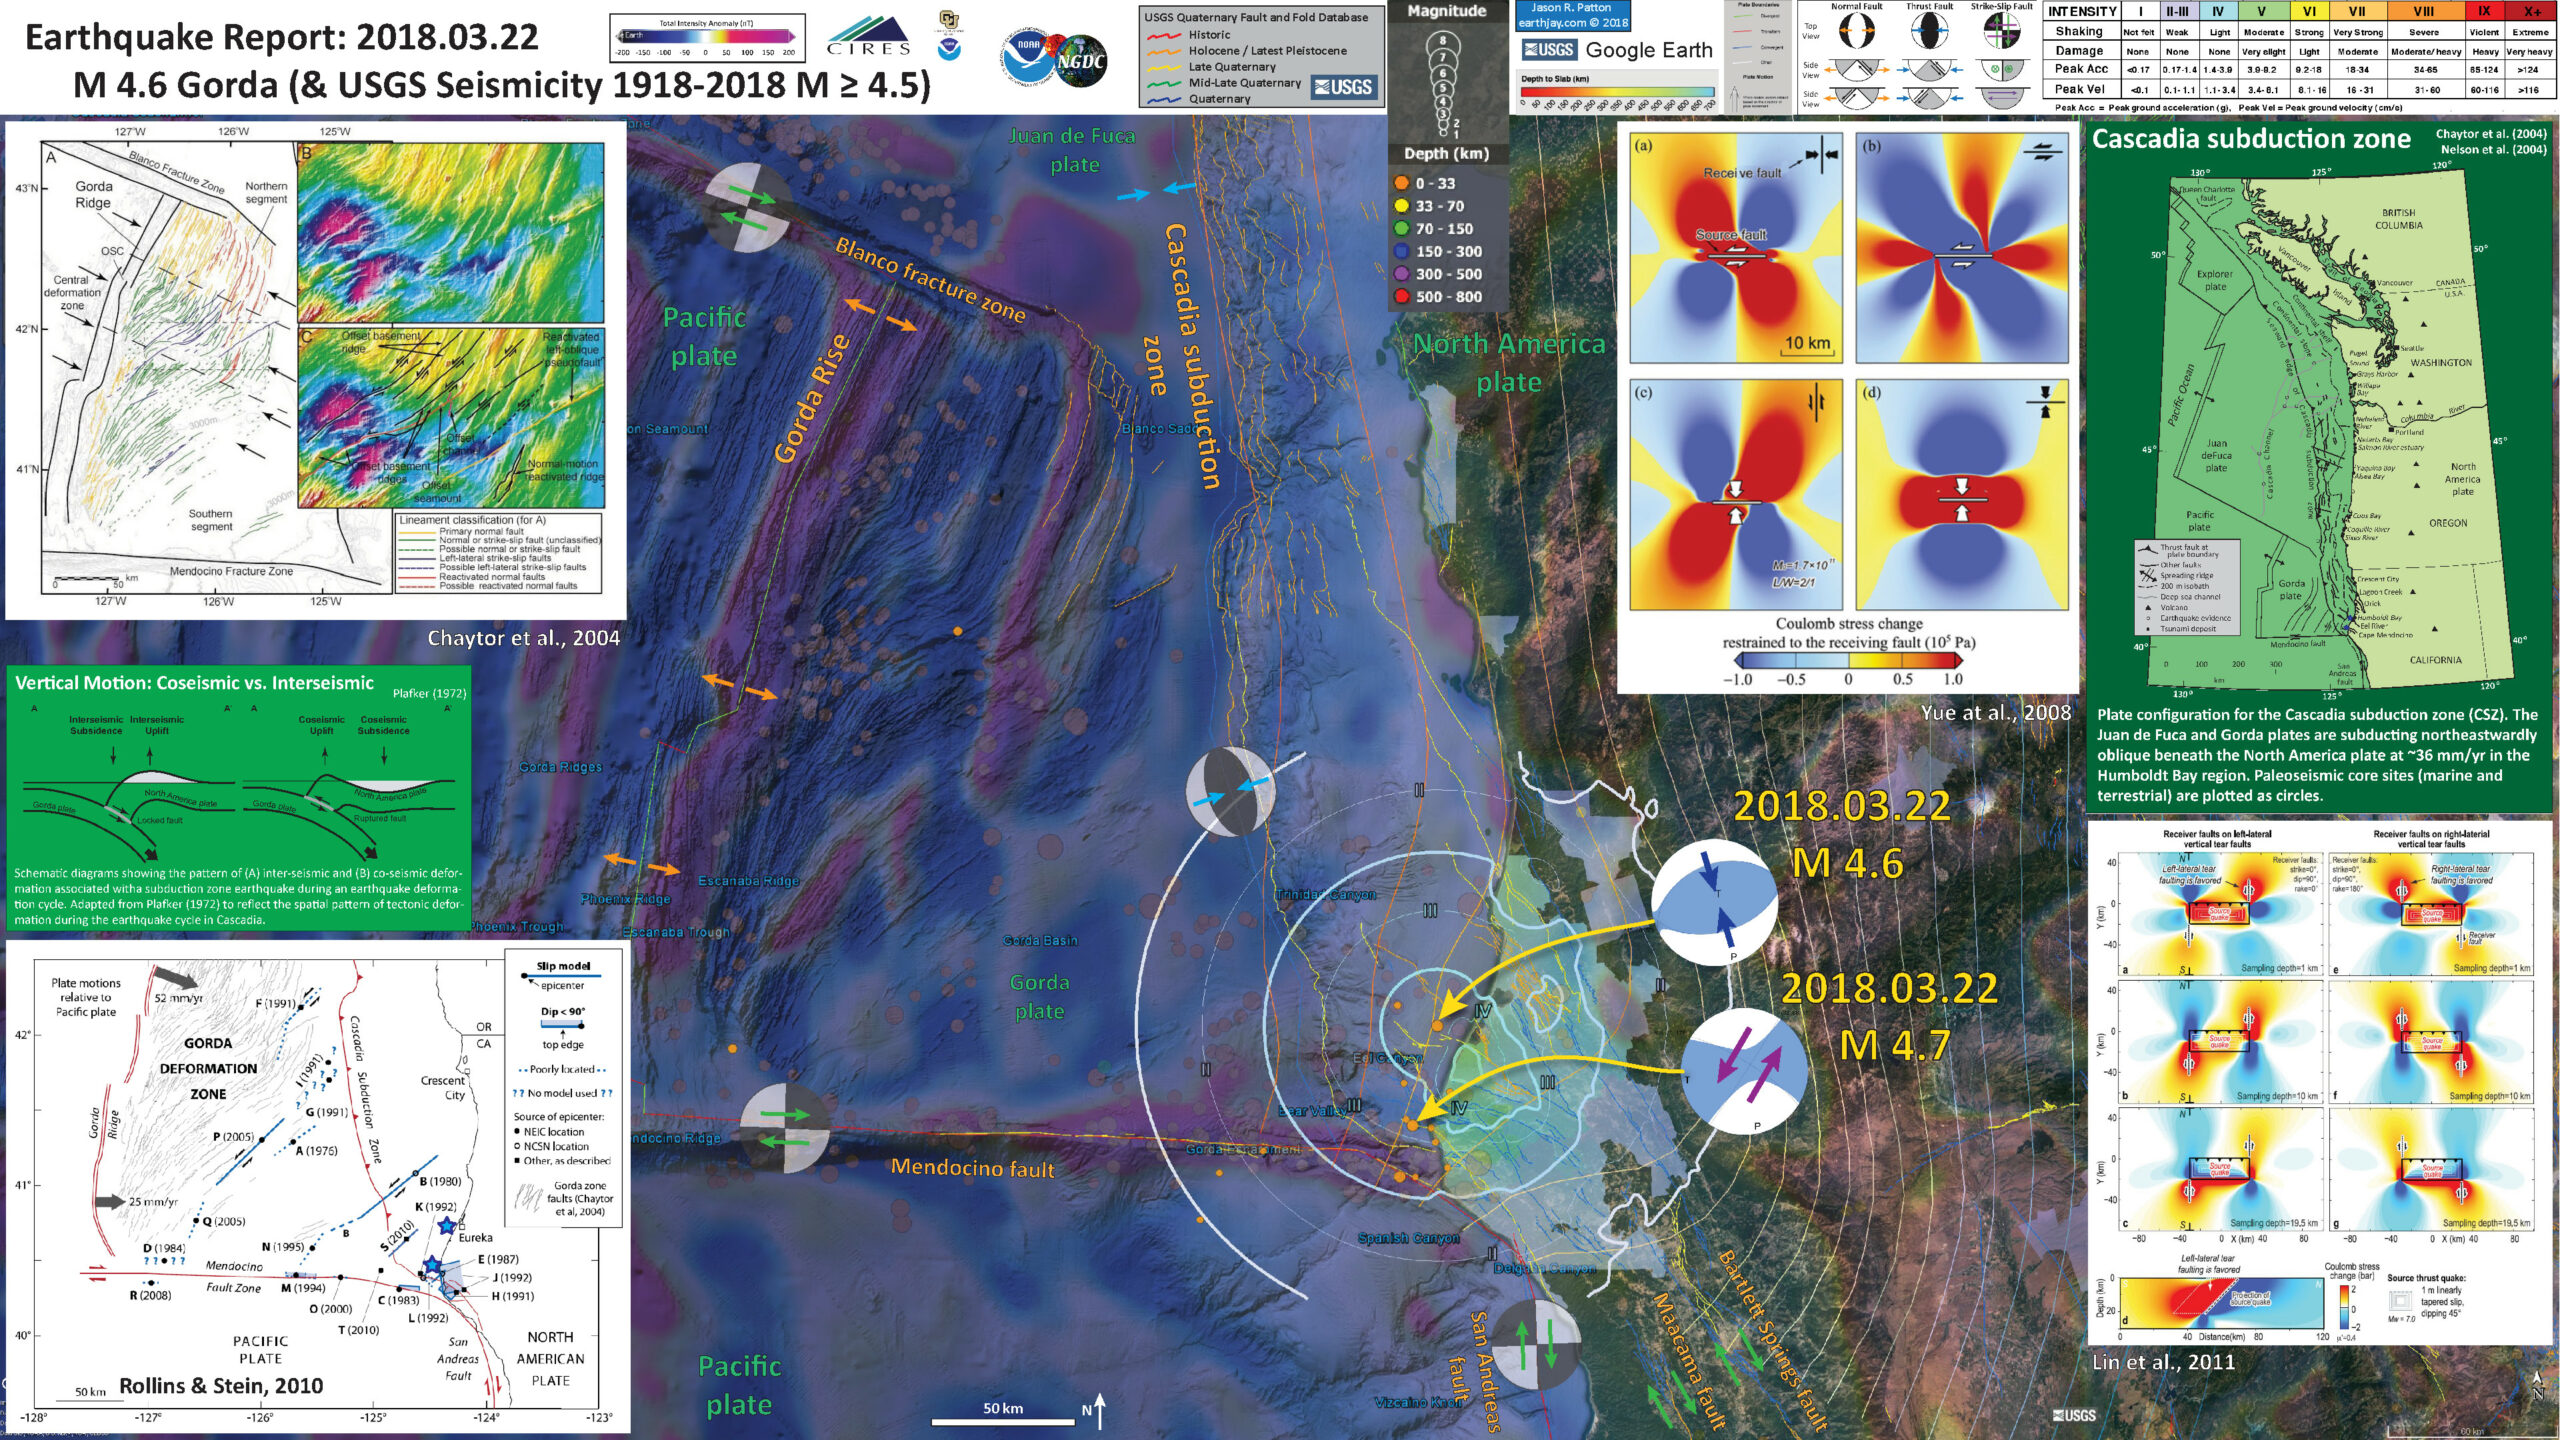
The first M 4.6 was a thrust earthquake within the Gorda plate. The CSZ megathrust fault slab depth is about 15 km at the location of these 2 earthquakes. The M 4.7 earthquake is a strike-slip earthquake. Because of the predominant northeast striking left-lateral faults in the GP, I interpret this earthquake to be left-lateral.
My initial thought was that these two EQs could be related. So, I rummaged the literature to find papers that present research of static coulomb stress changes between earthquakes and faults similar to what we had yesterday. When an earthquake fault slips during an earthquake, the crust deforms elastically. This causes some regions to extend and other regions to compress. These extension/compression changes cause static stresses on faults to change. As the seismic waves travel through the crust, this can cause dynamic changes in stress along faults. Both of these types of stress change (static and dynamic) are very small. If there is a fault that is oriented correctly, has a high stress state (almost ready to slip during an earthquake), and has a sufficiently large enough stress change, the first earthquake may trigger a second earthquake.
Because the second earthquake happened long after the main seismic waves had stopped traveling through the region, the M 4.7 earthquake could not have been dynamically triggered by the earlier M 4.6 earthquake. However, based on my review of the literature, it appears that the M 4.6 may have triggered the M 4.7 earthquake.
Below is my interpretive poster for this earthquake
I plot the seismicity from the past month, with color representing depth and diameter representing magnitude (see legend). I include earthquake epicenters from 1918-2018 with magnitudes M ≥ 4.5 (and down to M ≥ 4.5 in a second poster).
I plot the USGS fault plane solutions (moment tensors in blue and focal mechanisms in orange) for the M 4.6 & 4.7 earthquakes. I include generic fault plane solutions for the other fault systems in the region.
I include posters that show either M 4.6 or M 4.7 MMI and Did You Feel It data. I also have version that include emag2 magnetic anomaly data. These mag anomaly data nicely show the structure of the oceanic crust formed at the Gorda spreading center (the anomalies are initially parallel to the spreading center; that these anomalies are parallel to the spreading center was some key evidence for the plate tectonic hypothesis prior to it being accepted as a theory).
- I placed a moment tensor / focal mechanism legend on the poster. There is more material from the USGS web sites about moment tensors and focal mechanisms (the beach ball symbols). Both moment tensors and focal mechanisms are solutions to seismologic data that reveal two possible interpretations for fault orientation and sense of motion. One must use other information, like the regional tectonics, to interpret which of the two possibilities is more likely.
- I also include the shaking intensity contours on the map. These use the Modified Mercalli Intensity Scale (MMI; see the legend on the map). This is based upon a computer model estimate of ground motions, different from the “Did You Feel It?” estimate of ground motions that is actually based on real observations. The MMI is a qualitative measure of shaking intensity. More on the MMI scale can be found here and here. This is based upon a computer model estimate of ground motions, different from the “Did You Feel It?” estimate of ground motions that is actually based on real observations.
- I include the slab contours plotted (McCrory et al., 2012), which are contours that represent the depth to the subduction zone fault. These are mostly based upon seismicity. The depths of the earthquakes have considerable error and do not all occur along the subduction zone faults, so these slab contours are simply the best estimate for the location of the fault.
-
I include some inset figures.
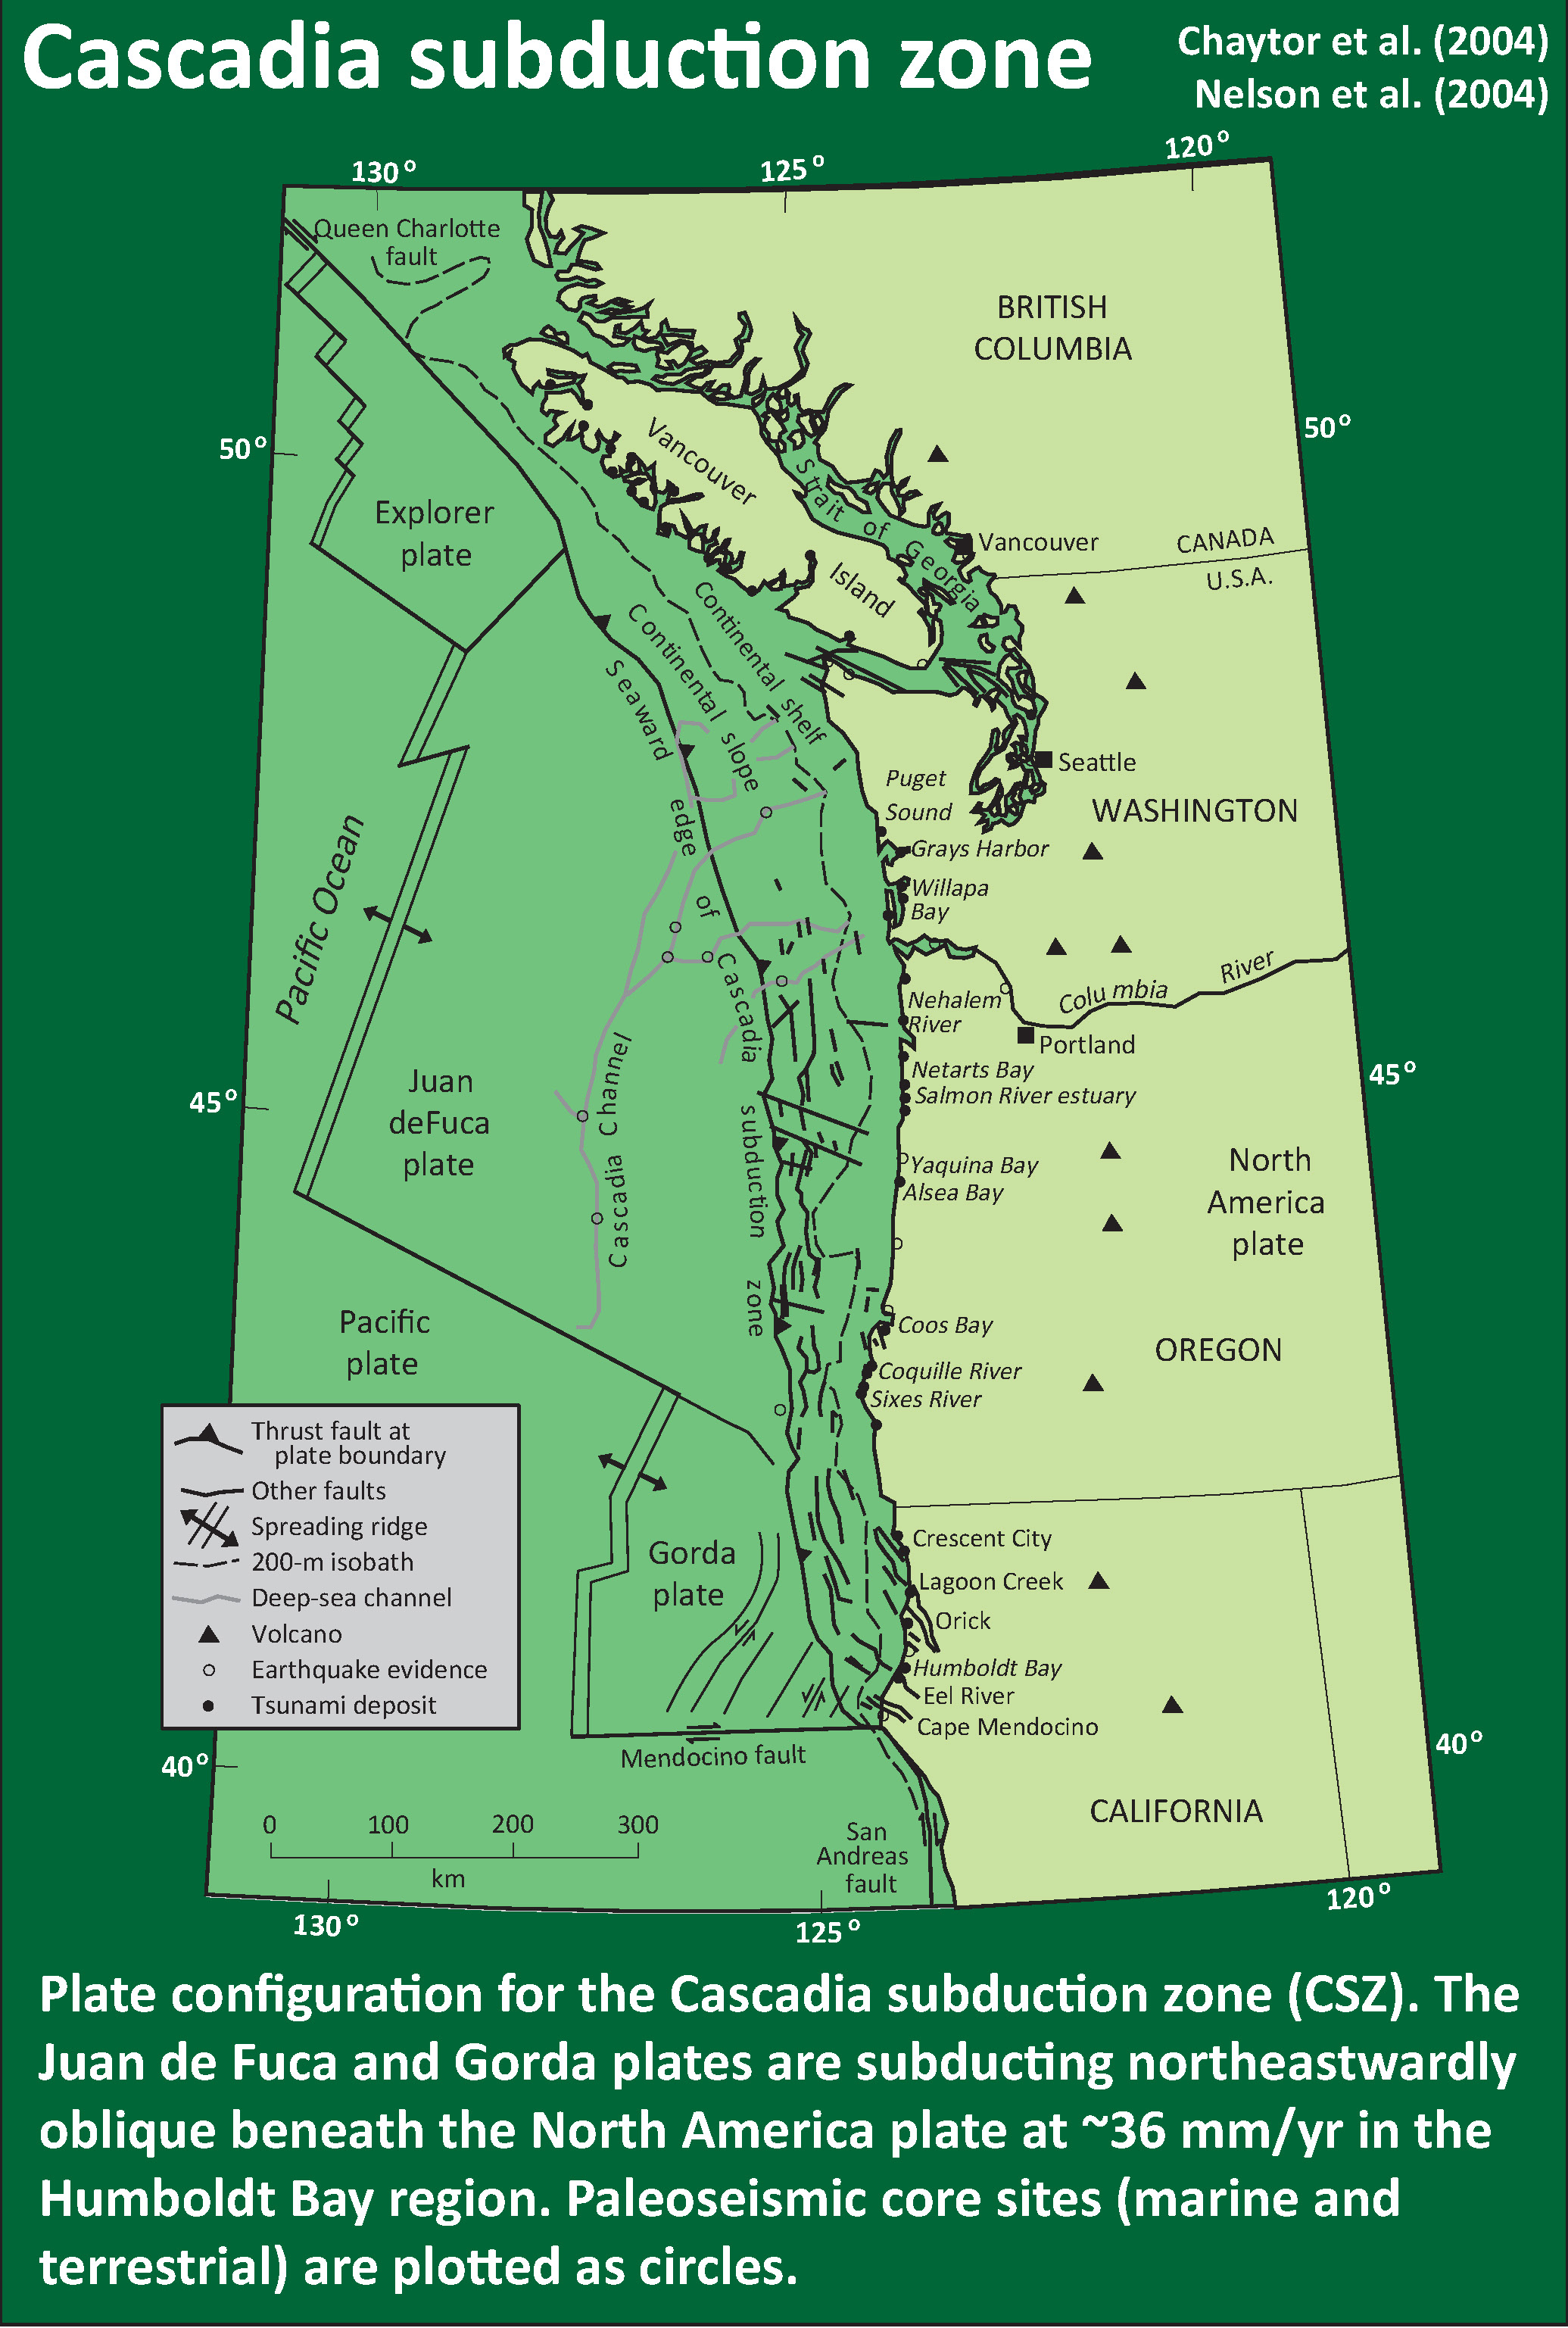
- In the upper right corner is a map of the Cascadia subduction zone (CSZ) and regional tectonic plate boundary faults. This is modified from several sources (Chaytor et al., 2004; Nelson et al., 2004). I placed a blue stars in the general location of today’s earthquakes.
- In the upper left corner is a map from Chaytor et al. (2004) that shows some details of the faulting in the region. This figure shows the predominant tectonic fabric in the GP (northeast striking left-lateral faults). More about this figure can be found below.
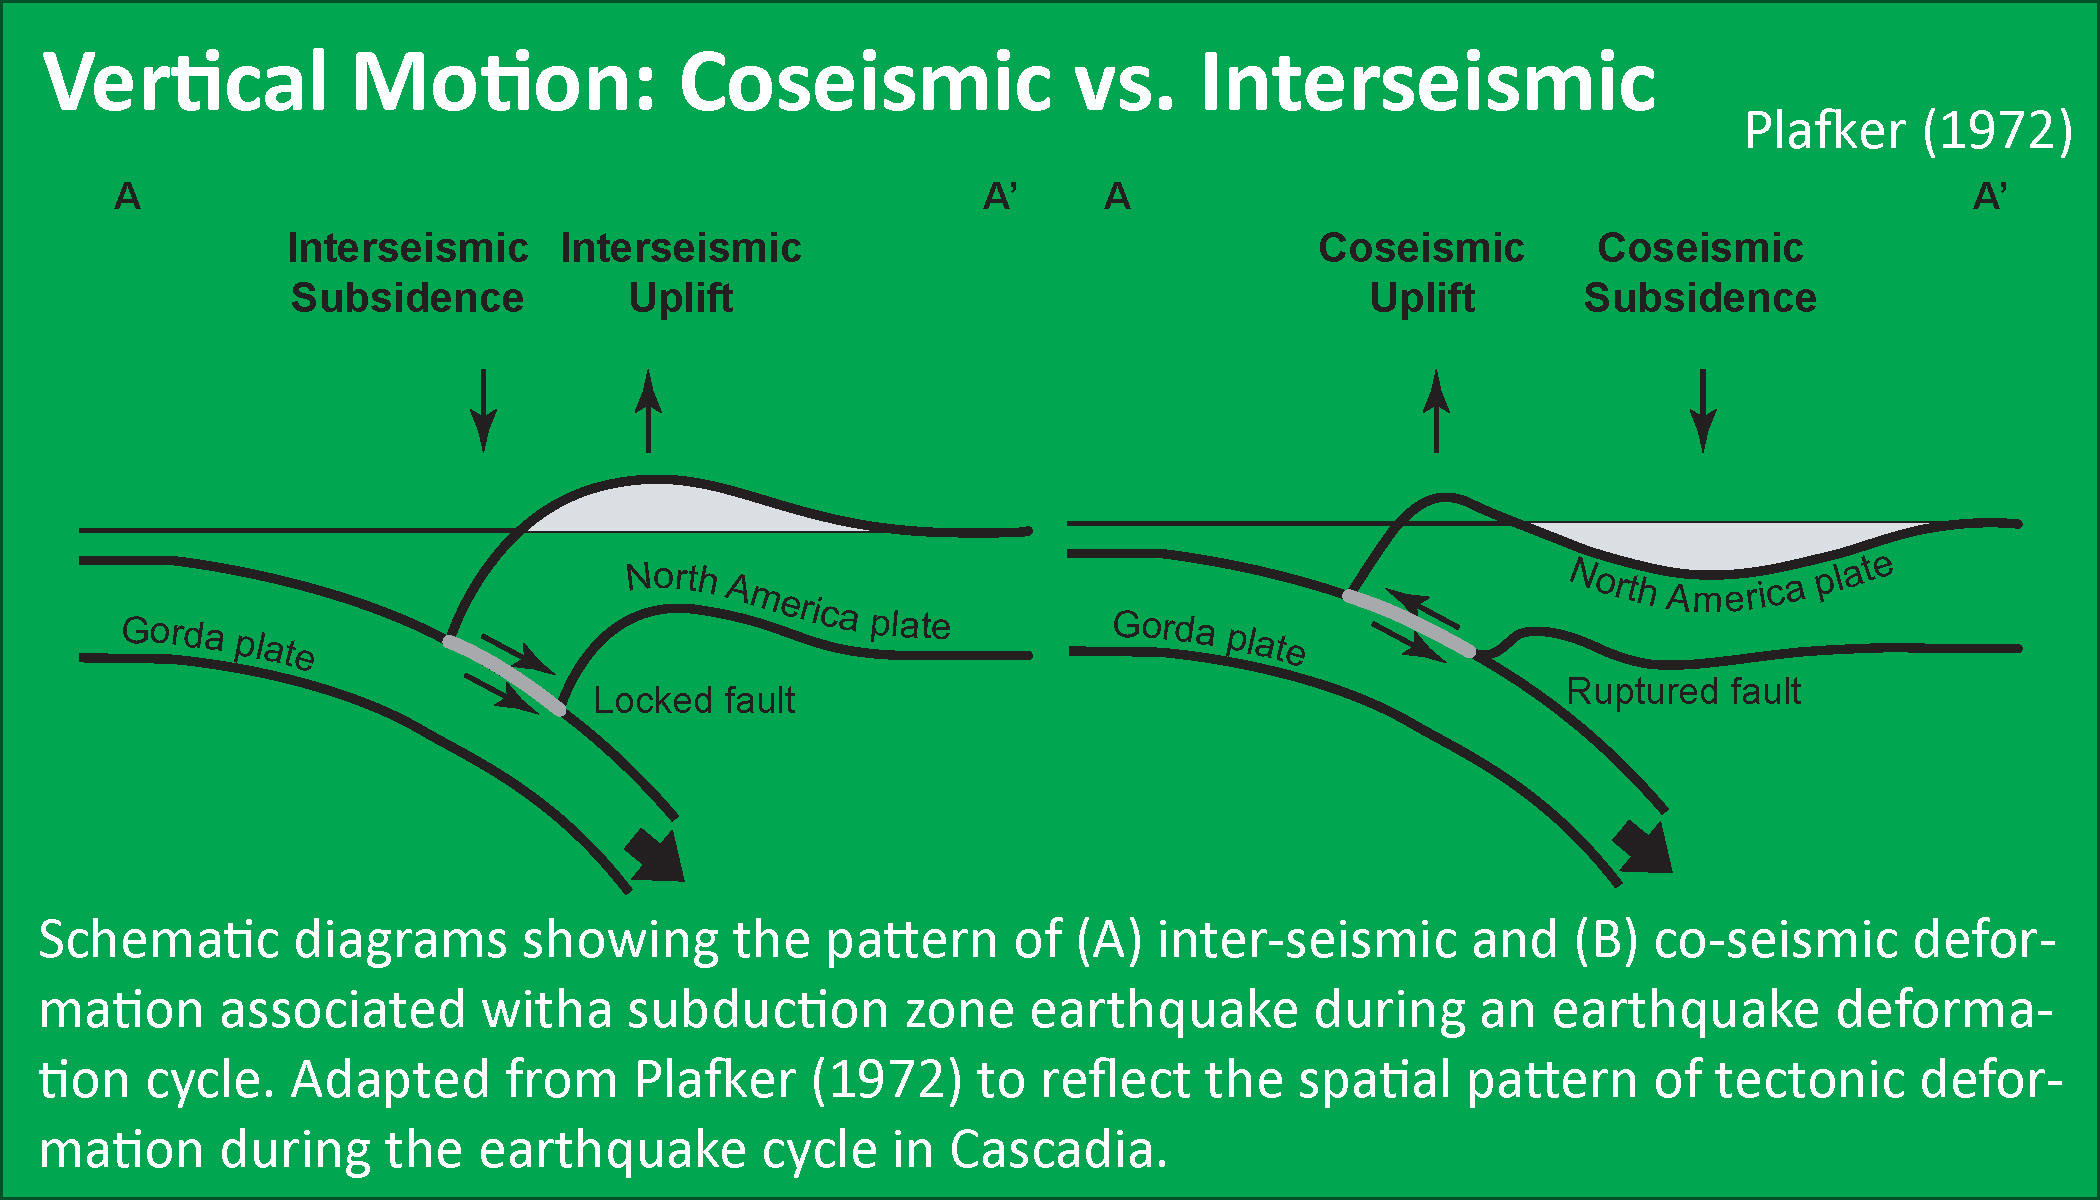
- Below the Chaytor figure is an illustration modified from Plafker (1972). This figure shows how a subduction zone deforms between (interseismic) and during (coseismic) earthquakes. Today’s earthquake did not occur along the CSZ, so did not produce crustal deformation like this. However, it is useful to know this when studying the CSZ. Today’s earthquakes happened in the lower Gorda plate
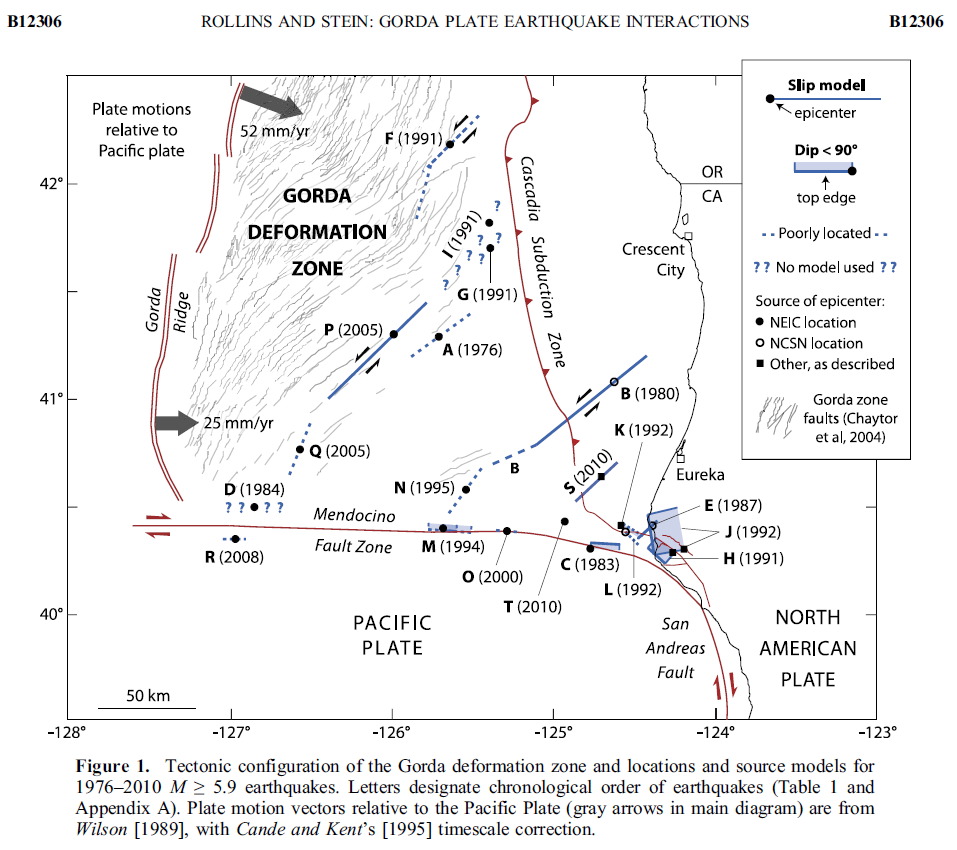
- In the lower left corner is a figure from Rollins and Stein (2010). In their paper they discuss how static coulomb stress changes from earthquakes may impart (or remove) stress from adjacent crust/faults. I place a blues star in the general location of today’s earthquakes.
- To the left of the CSZ map is a figure from Yue et al. (2008) that shows the results of their static coulomb modeling. They model static changes in stress change from source earthquakes (strike-slip in upper panel and thrust faults in lower panel) imparted onto receiver faults. The lower left example (c) shows the stress change imparted following a thrust fault source earthquake imparted onto a left-lateral strike-slip receiver fault. If we rotate this panel counterclockwise (about 25°)to match the orientation of the M 4.6 earthquake, we may observe that the M 4.7 earthquake resides in the quadrant that saw an increase in static coulomb stress (colored red).
- In the lower right corner is another example of static coulomb stress modeling from Lin et al. (2011). The left panel shows what static stress changes may be imparted from a source thrust fault onto left lateral strike-slip faults (“tear” faults are strike-slip faults that connect thrust faults). These left panels also show an increase in static coulomb stress in the lower left quadrant. I take these two examples as supporting evidence for my hypothesis that the M 4.6 earthquake triggered the M 4.7 earthquake.
M 4.6 MMI/DYFI
M 4.6 MMI/DYFI emag2

M 4.7 MMI/DYFI

M 4.7 MMI/DYFI emag2

USGS Earthquake Pages
- 2018.03.22 M 4.6 Gorda
- 2018.03.22 M 4.7 Gorda
These are from this current sequence
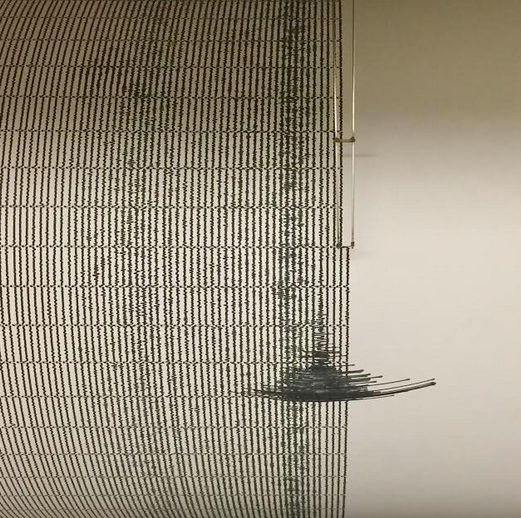
- Here is the Baby Benioff Seismograph from Humboldt State Univ. Dept. of Geology. See social media below.
UPDATE: 2018.03.23 22:10 local time
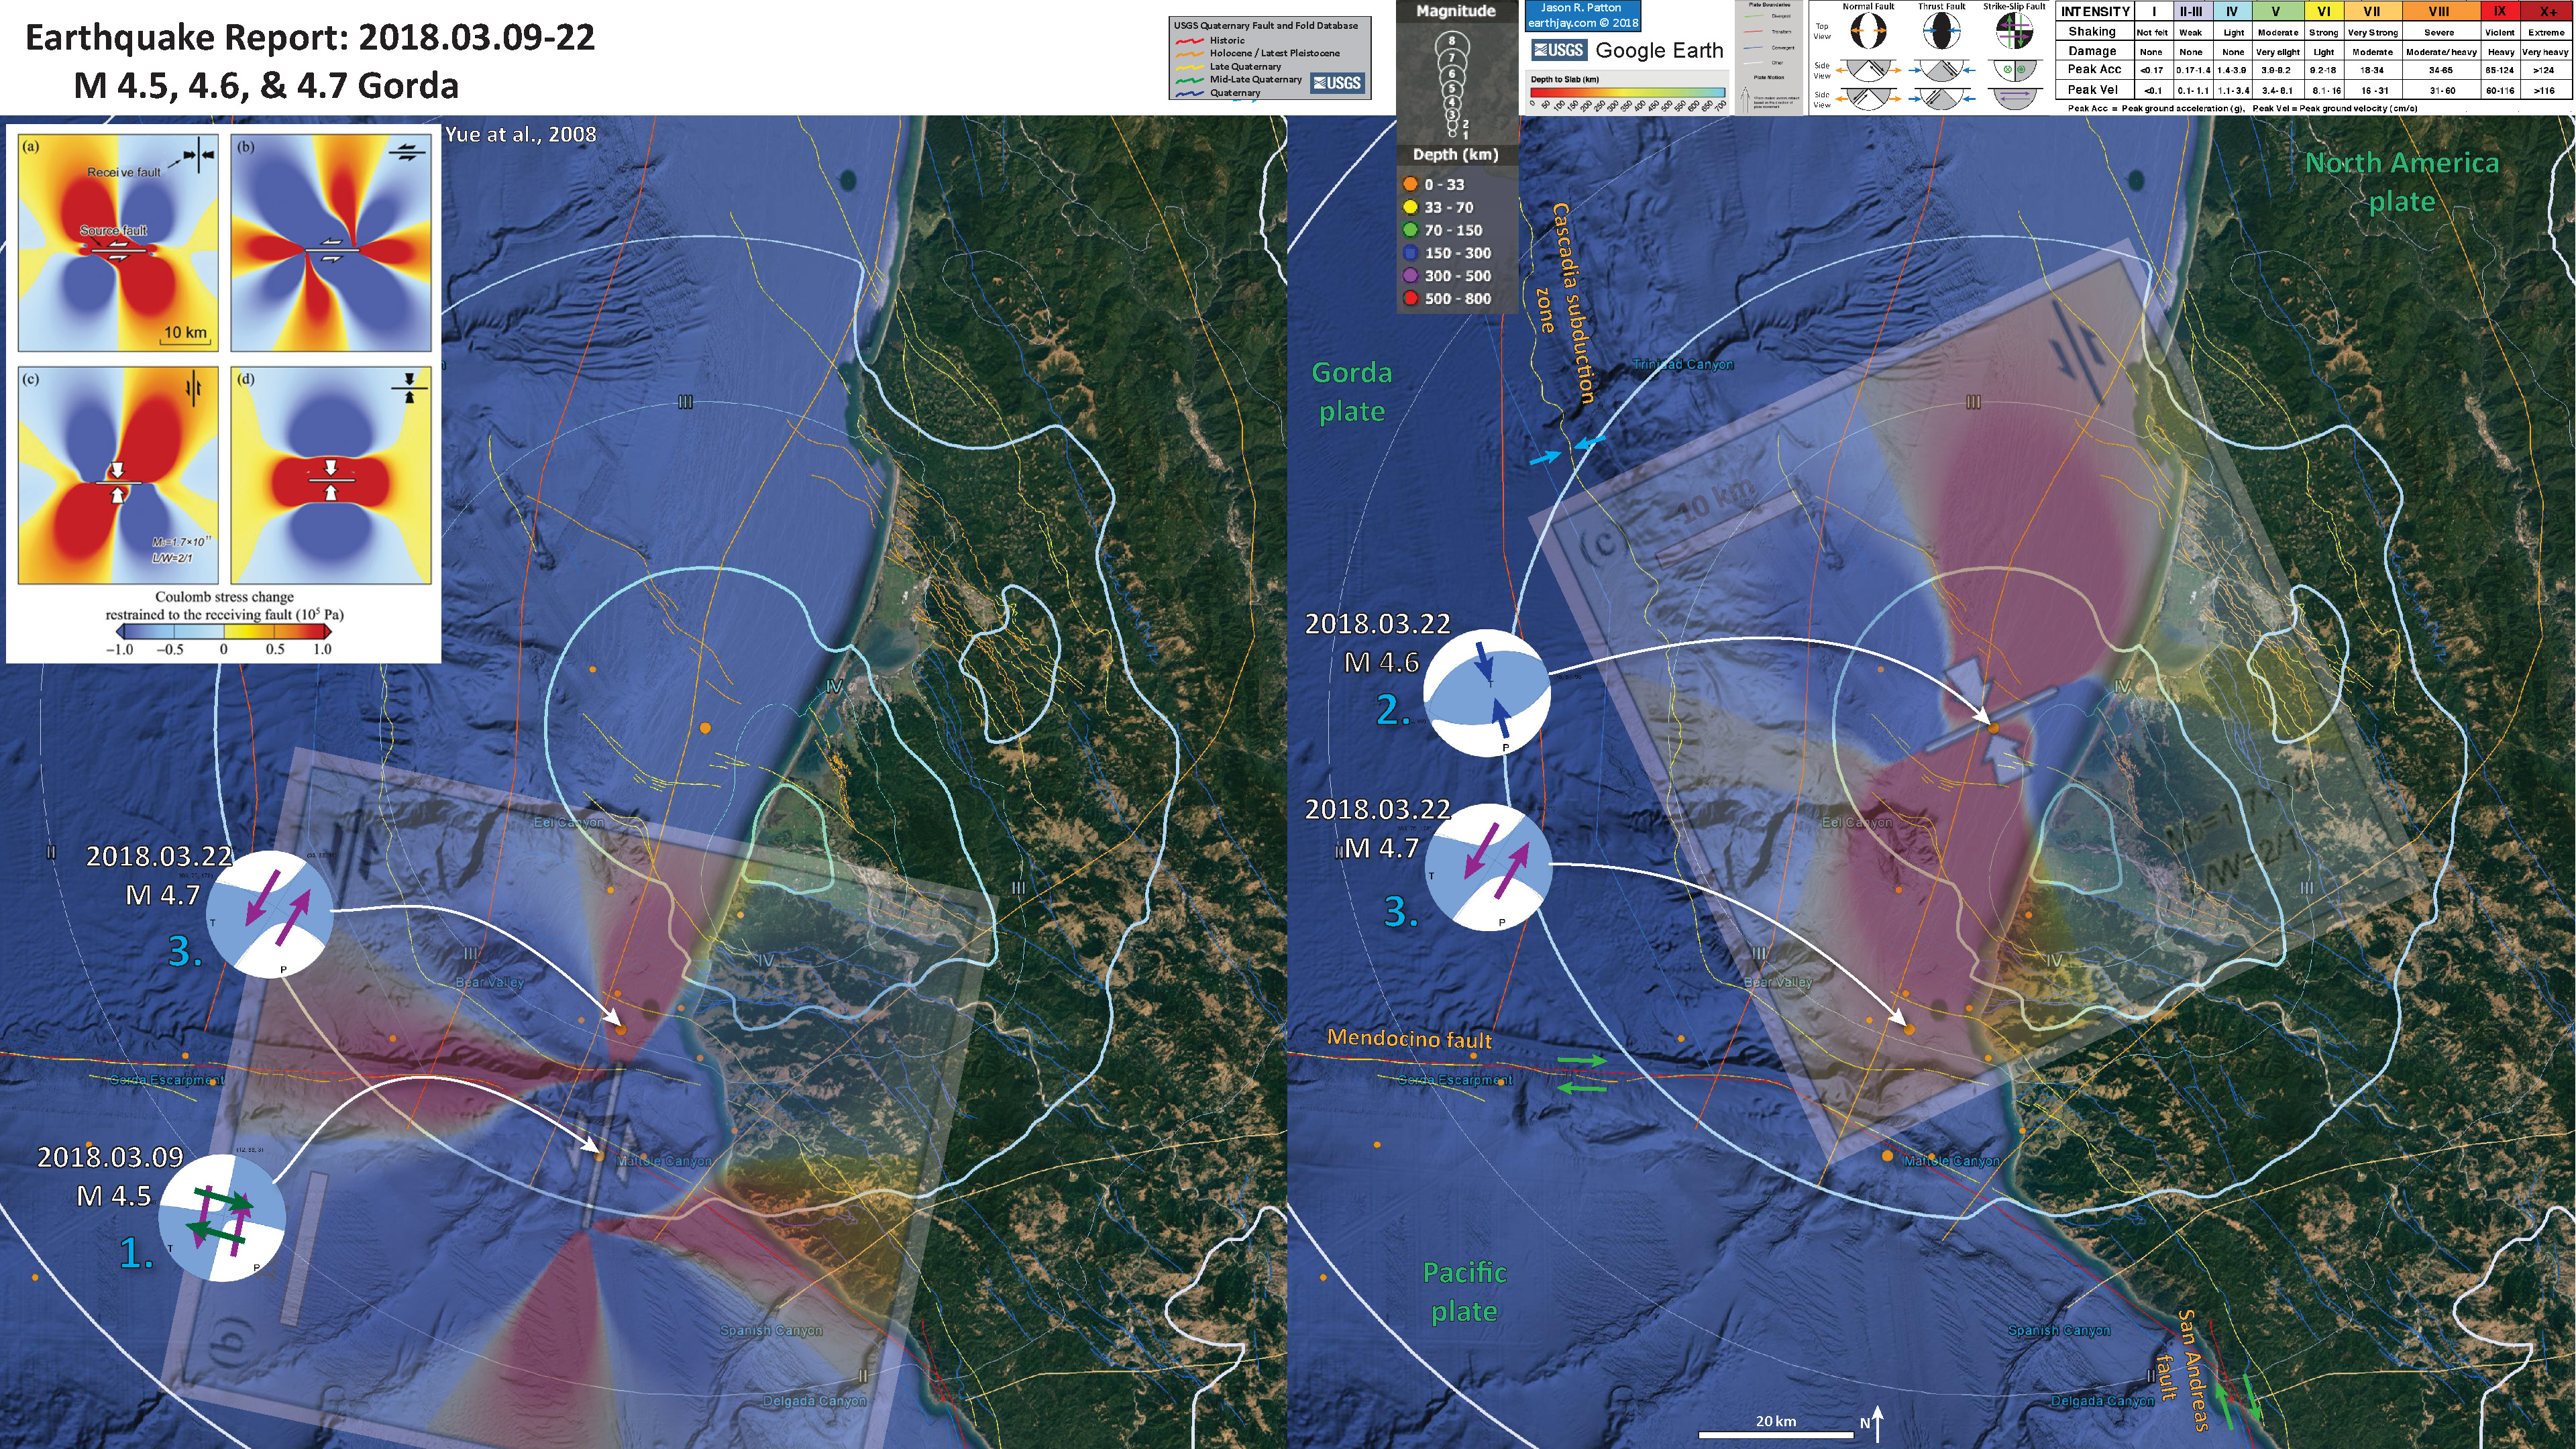
- I later noticed that there was a M 4.5 earlier on 2018.03.09 south of these two M 4.6 and 4.7 earthquakes. I here prepare an overlay analysis of the seismicity with the Yue et al. (2008) results compared to these 3 earthquakes in a sequence. The below figure has two panels representing the hypothetical static coulomb stress changes between these three earthquakes. Earthquake order number is labeled in cyan.
- I orient the Yue et al. (2008) figures relative to the primary nodal plane strike preferred USGS interpretation. In other words, I use the orientation of the USGS preferred fault plane solution to orient the Yue et al. (2008) coulomb stress change figures.
- These overlays are scaled relative to the published scale.
- Note how the largest magnitude (M 4.7) earthquake is in a region of increased static coulomb stress from both the prior earthquakes. These stress changes are very small and the magnitudes are probably not scaled appropriately for the space, so this is possibly a conjectural interpretation.
- The left panel shows what stress changes might happen on left-lateral strike-slip receiver faults given a left-lateral strike-slip source fault. The M 4.7 EQ is in the region of increased static coulomb stress.
- The right panel shows what stress changes might happen on left-lateral striek-slip receiver faults given a thrust fault source earthquake. The M 4.7 EQ is AGAIN in the region of increased static coulomb stress.
Some Relevant Discussion and Figures
- Here is a map of the Cascadia subduction zone, modified from Nelson et al. (2006). The Juan de Fuca and Gorda plates subduct norteastwardly beneath the North America plate at rates ranging from 29- to 45-mm/yr. Sites where evidence of past earthquakes (paleoseismology) are denoted by white dots. Where there is also evidence for past CSZ tsunami, there are black dots. These paleoseismology sites are labeled (e.g. Humboldt Bay). Some submarine paleoseismology core sites are also shown as grey dots. The two main spreading ridges are not labeled, but the northern one is the Juan de Fuca ridge (where oceanic crust is formed for the Juan de Fuca plate) and the southern one is the Gorda rise (where the oceanic crust is formed for the Gorda plate).
- Here is a version of the CSZ cross section alone (Plafker, 1972). This shows two parts of the earthquake cycle: the interseismic part (between earthquakes) and the coseismic part (during earthquakes). Regions that experience uplift during the interseismic period tend to experience subsidence during the coseismic period.
- Here is a map from Chaytor et al. (2004) that shows some details of the faulting in the region. The moment tensor (at the moment i write this) shows a north-south striking fault with a reverse or thrust faulting mechanism. While this region of faulting is dominated by strike slip faults (and most all prior earthquake moment tensors showed strike slip earthquakes), when strike slip faults bend, they can create compression (transpression) and extension (transtension). This transpressive or transtentional deformation may produce thrust/reverse earthquakes or normal fault earthquakes, respectively. The transverse ranges north of Los Angeles are an example of uplift/transpression due to the bend in the San Andreas fault in that region.
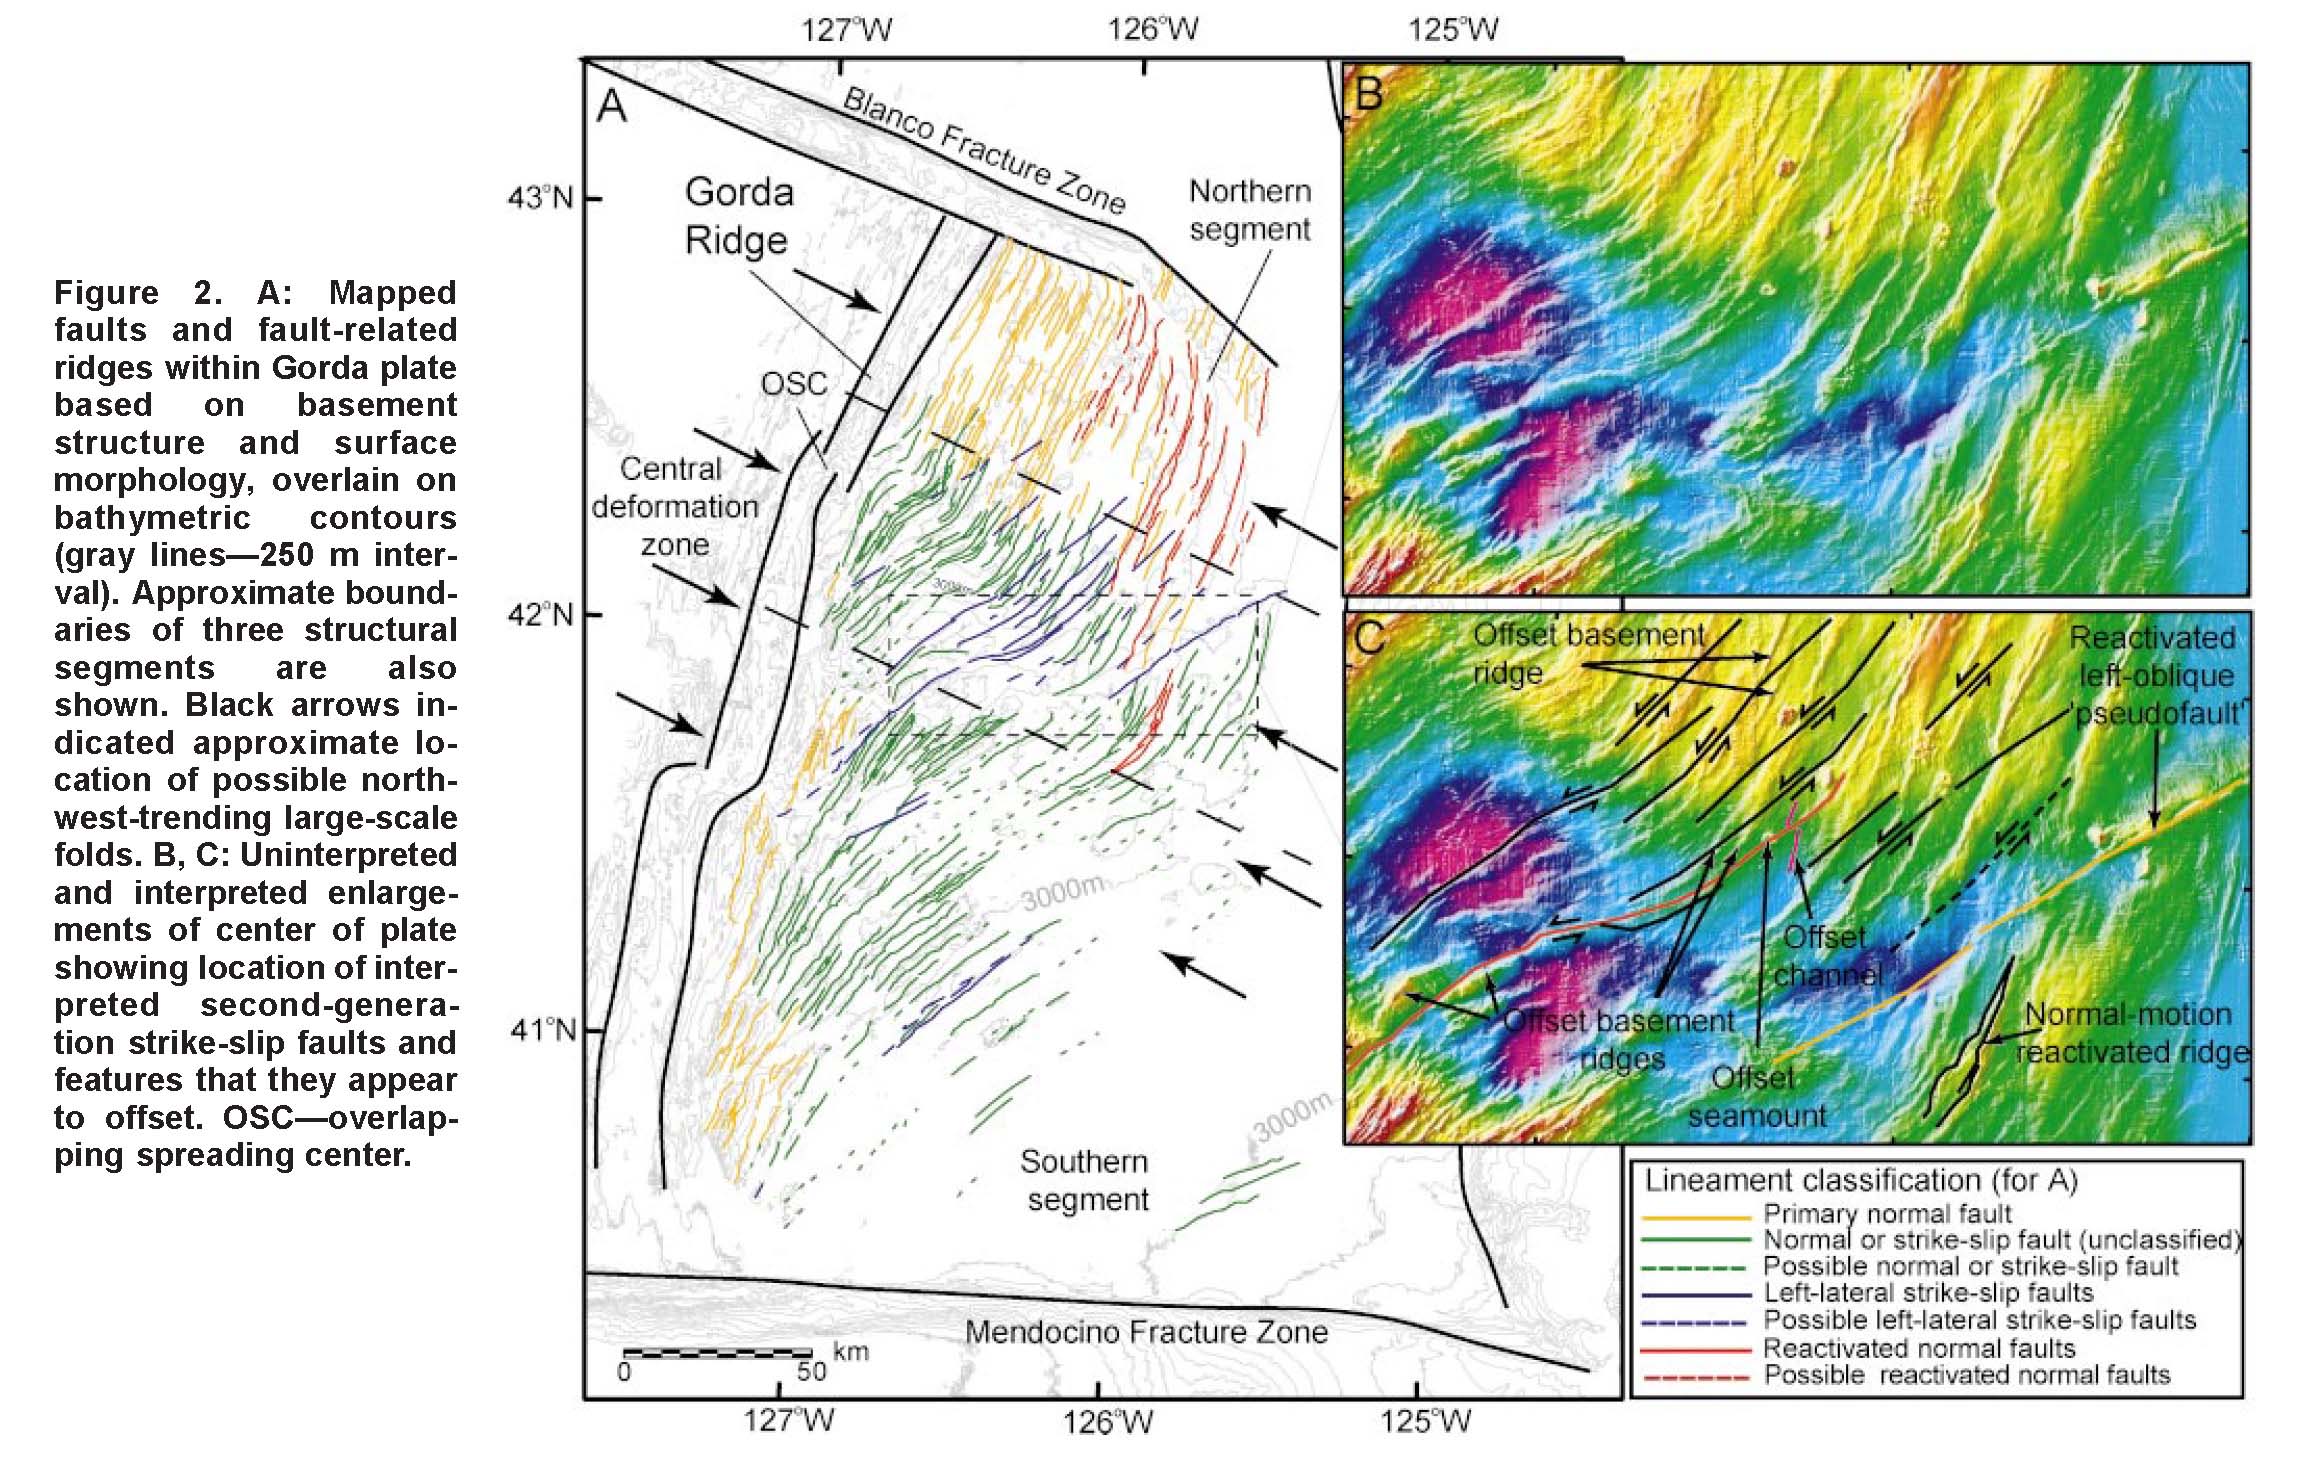
- These are the models for tectonic deformation within the Gorda plate as presented by Jason Chaytor in 2004.
- Here is a map from Rollins and Stein, showing their interpretations of different historic earthquakes in the region. This was published in response to the Januray 2010 Gorda plate earthquake. The faults are from Chaytor et al. (2004).
- In this map below, I label a number of other significant earthquakes in this Mendocino triple junction region. Another historic right-lateral earthquake on the Mendocino fault system was in 1994. There was a series of earthquakes possibly along the easternmost section of the Mendocino fault system in late January 2015, here is my post about that earthquake series.
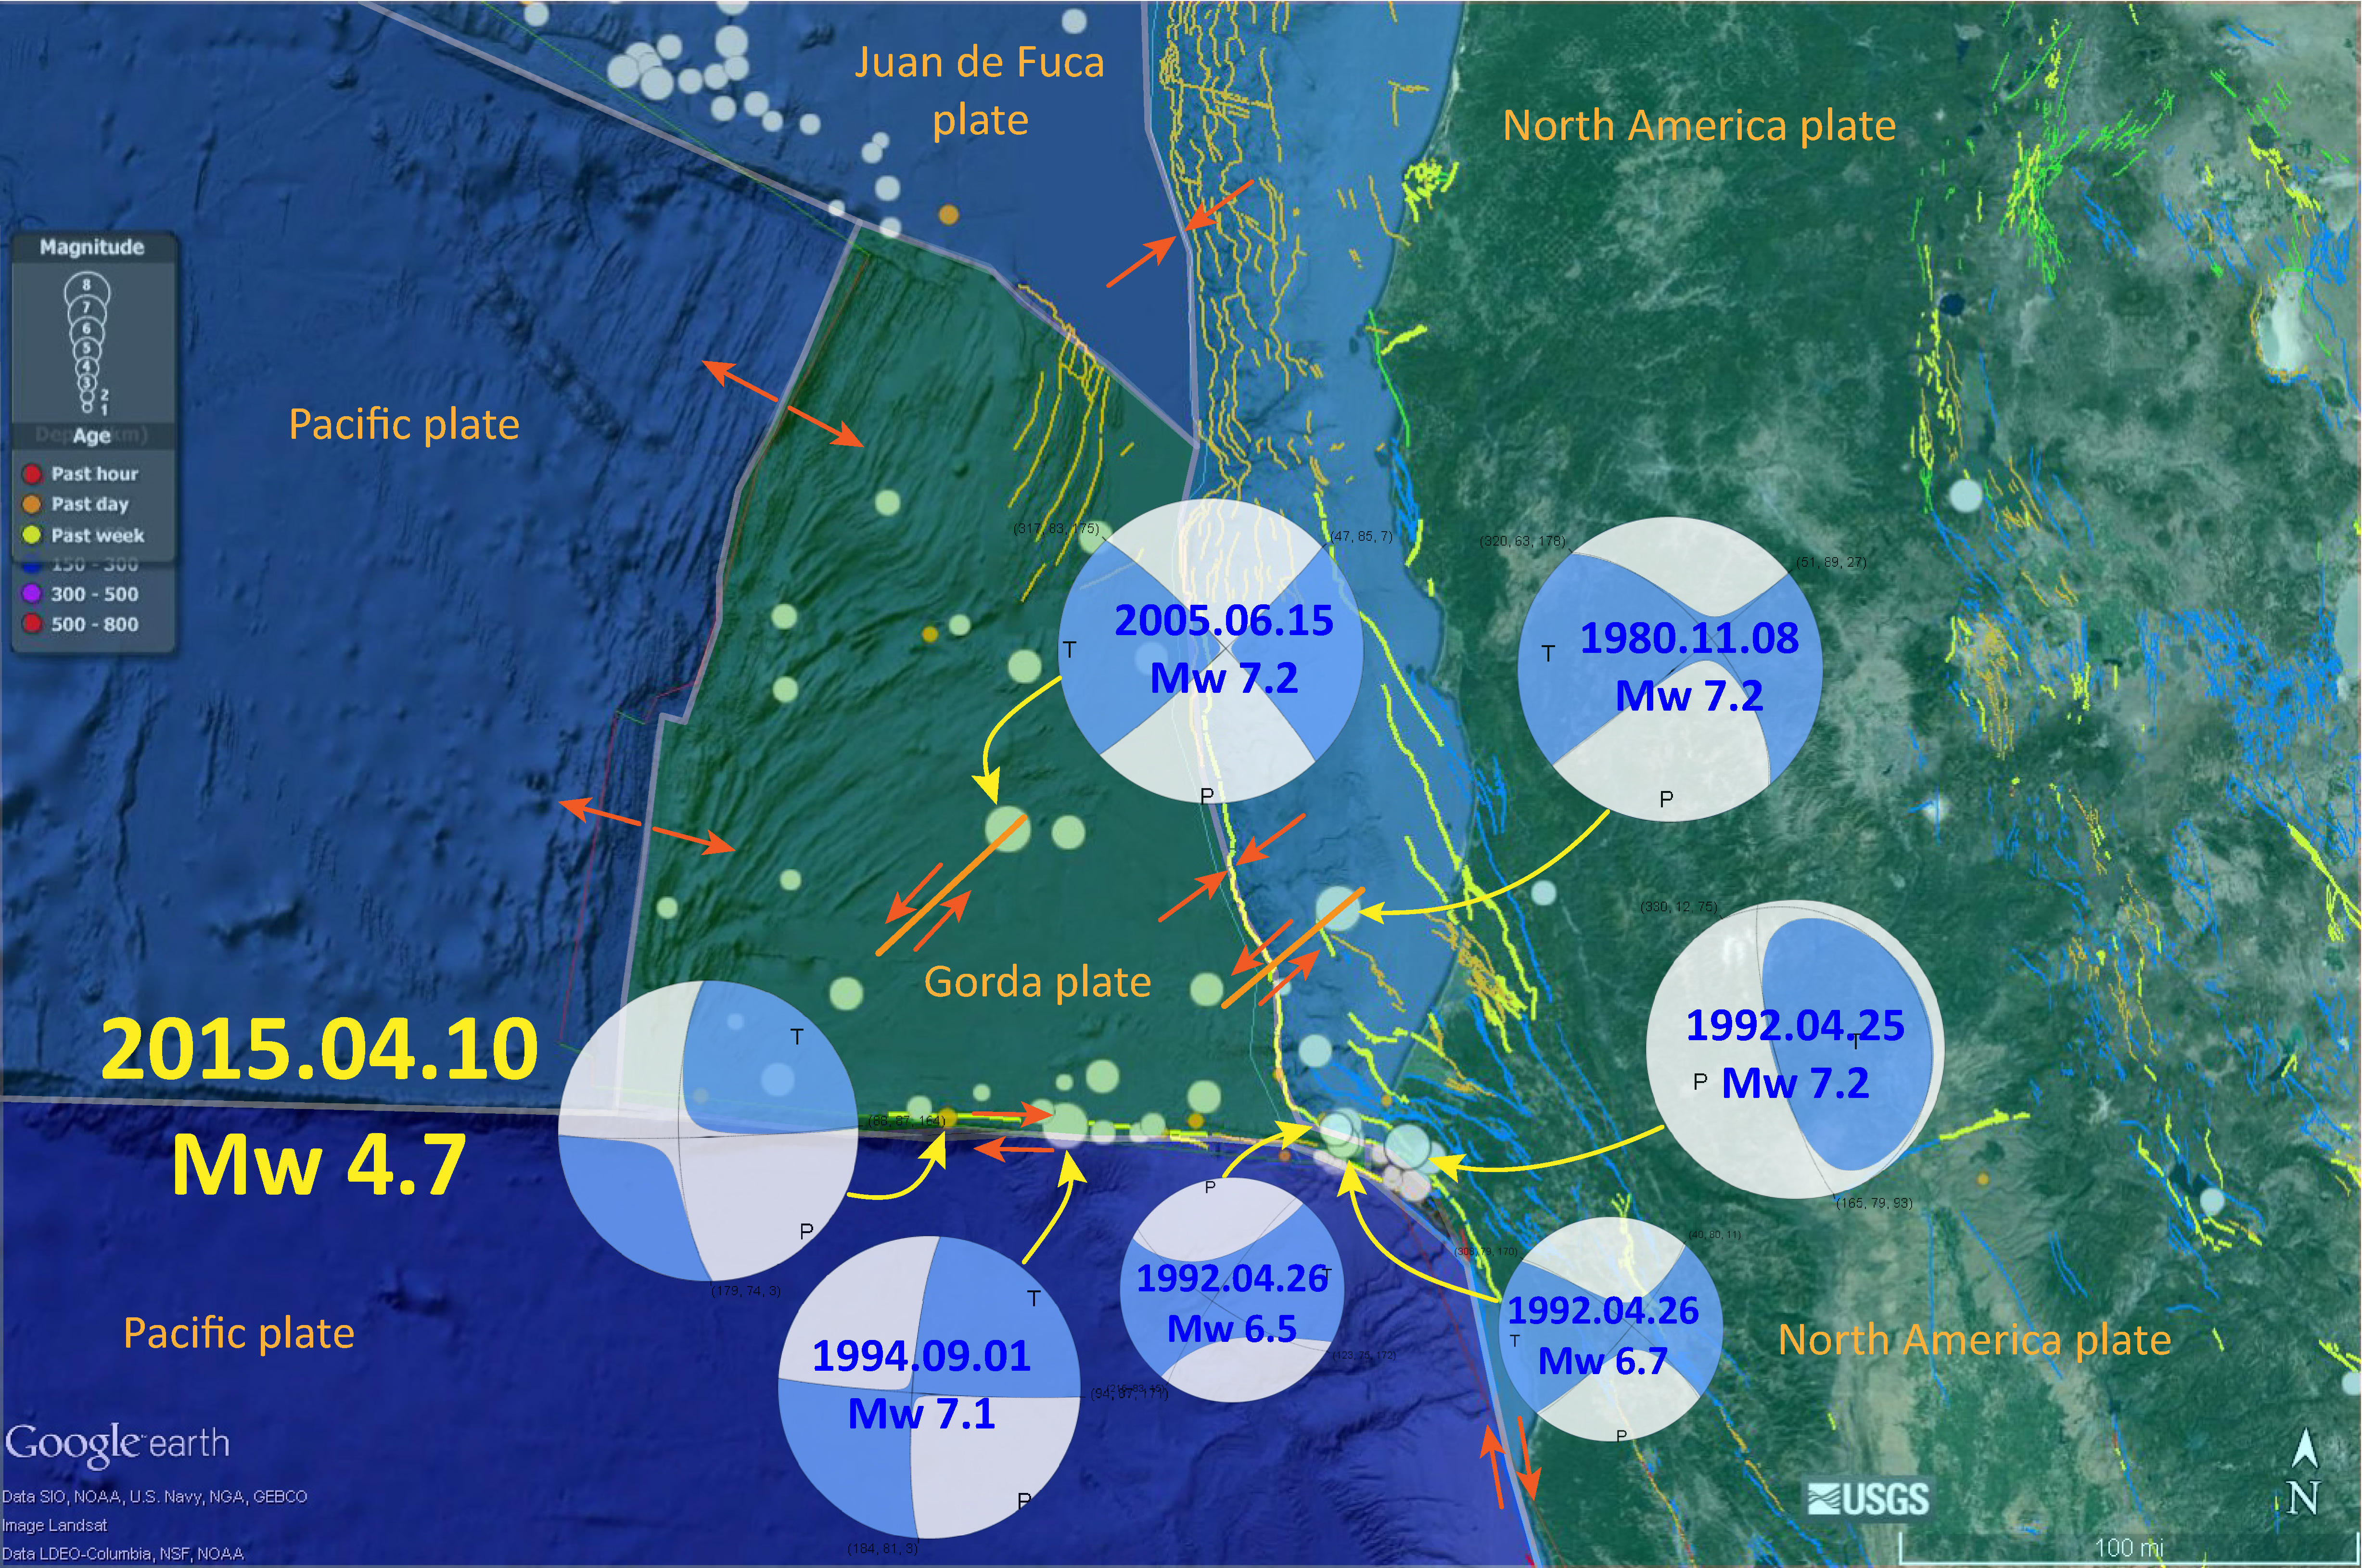
The Gorda and Juan de Fuca plates subduct beneath the North America plate to form the Cascadia subduction zone fault system. In 1992 there was a swarm of earthquakes with the magnitude Mw 7.2 Mainshock on 4/25. Initially this earthquake was interpreted to have been on the Cascadia subduction zone (CSZ). The moment tensor shows a compressional mechanism. However the two largest aftershocks on 4/26/1992 (Mw 6.5 and Mw 6.7), had strike-slip moment tensors. These two aftershocks align on what may be the eastern extension of the Mendocino fault.
There have been several series of intra-plate earthquakes in the Gorda plate. Two main shocks that I plot of this type of earthquake are the 1980 (Mw 7.2) and 2005 (Mw 7.2) earthquakes. I place orange lines approximately where the faults are that ruptured in 1980 and 2005. These are also plotted in the Rollins and Stein (2010) figure above. The Gorda plate is being deformed due to compression between the Pacific plate to the south and the Juan de Fuca plate to the north. Due to this north-south compression, the plate is deforming internally so that normal faults that formed at the spreading center (the Gorda Rise) are reactivated as left-lateral strike-slip faults. In 2014, there was another swarm of left-lateral earthquakes in the Gorda plate. I posted some material about the Gorda plate setting on this page.
- Here is the Yue et al. (2008) figure, along with their figure caption below.

Coulomb stress change for different combination of faults. The thick while line marks the source fault, and the white arrows indicate the focal mechanism. The black line and the black arrows represent the orientation of the receiving fault and its mechanism, respectively.
- Here is the figure from Lin et al. (2011), along with their figure caption.
![]()
Maps showing Coulomb stress changes caused by an M = 7.0 earthquake on adjacent tear faults. The source is the same as in Figure 4. Coulomb stresses are calculated on (a–c) left‐lateral and (e–g) right‐lateral tear faults. Stress is sampled at depth of 1 km (Figures 6a and 6e), 10 km (Figures 6b and 6f), and 19.5 km (Figures 6c and 6g). (d) Cross section at the right end of the source earthquake (cross section position shown in Figure 6a). Note that left‐lateral tear faulting is favored in one position with respect to the thrust, while right‐lateral faulting is favored in the opposite position.
Social Media
Geologic Fundamentals
- For more on the graphical representation of moment tensors and focal mechnisms, check this IRIS video out:
- Here is a fantastic infographic from Frisch et al. (2011). This figure shows some examples of earthquakes in different plate tectonic settings, and what their fault plane solutions are. There is a cross section showing these focal mechanisms for a thrust or reverse earthquake. The upper right corner includes my favorite figure of all time. This shows the first motion (up or down) for each of the four quadrants. This figure also shows how the amplitude of the seismic waves are greatest (generally) in the middle of the quadrant and decrease to zero at the nodal planes (the boundary of each quadrant).

- There are three types of earthquakes, strike-slip, compressional (reverse or thrust, depending upon the dip of the fault), and extensional (normal). Here is are some animations of these three types of earthquake faults. The following three animations are from IRIS.
Strike Slip:
Compressional:
Extensional:
- 1700.09.26 M 9.0 Cascadia’s 315th Anniversary 2015.01.26
- 1700.09.26 M 9.0 Cascadia’s 316th Anniversary 2016.01.26 updated in 2017 and 2018
- 1992.04.25 M 7.1 Cape Mendocino 25 year remembrance
- 1992.04.25 M 7.1 Cape Mendocino 25 Year Remembrance Event Page
- Earthquake Information about the CSZ 2015.10.08
- 2018.03.22 M 4.6/4.7 Gorda plate
- 2017.07.28 M 5.1 Gorda plate
- 2016.09.25 M 5.0 Gorda plate
- 2016.09.25 M 5.0 Gorda plate
- 2016.01.30 M 5.0 Gorda plate
- 2015.12.29 M 4.9 Gorda plate
- 2015.11.18 M 3.2 Gorda plate
- 2014.03.13 M 5.2 Gorda Rise
- 2014.03.09 M 6.8 Gorda plate p-1
- 2014.03.23 M 6.8 Gorda plate p-2
- 2015.06.01 M 5.8 Blanco fracture zone p-1
- 2015.06.01 M 5.8 Blanco fracture zone p-2 (animations)
- 2018.01.25 M 5.8 Mendocino fault
- 2017.09.22 M 5.7 Mendocino fault
- 2016.12.08 M 6.5 Mendocino fault, CA
- 2016.12.08 M 6.5 Mendocino fault, CA Update #1
- 2016.12.05 M 4.3 Petrolia CA
- 2016.10.27 M 4.1 Mendocino fault
- 2016.09.03 M 5.6 Mendocino
- 2016.01.02 M 4.5 Mendocino fault
- 2015.11.01 M 4.3 Mendocino fault
- 2015.01.28 M 5.7 Mendocino fault
- 2017.03.06 M 4.0 Cape Mendocino
- 2016.11.02 M 3.6 Oregon
- 2016.01.07 M 4.2 NAP(?)
- 2015.10.29 M 3.4 Bayside
- 2017.01.07 M 5.7 Explorer plate
- 2016.03.19 M 5.2 Explorer plate
- 2017.06.11 M 3.5 Gorda or NAP?
- 2016.07.21 M 4.7 Gorda or NAP? p-1
- 2016.07.21 M 4.7 Gorda or NAP? p-2
Cascadia subduction zone
General Overview
Earthquake Reports
Gorda plate
Blanco fracture zone
Mendocino fault
Mendocino triple junction
North America plate
Explorer plate
Uncertain
- Atwater, B.F., Musumi-Rokkaku, S., Satake, K., Tsuju, Y., Eueda, K., and Yamaguchi, D.K., 2005. The Orphan Tsunami of 1700—Japanese Clues to a Parent Earthquake in North America, USGS Professional Paper 1707, USGS, Reston, VA, 144 pp.
- Chaytor, J.D., Goldfinger, C., Dziak, R.P., and Fox, C.G., 2004. Active deformation of the Gorda plate: Constraining deformation models with new geophysical data: Geology v. 32, p. 353-356.
- Dengler, L.A., Moley, K.M., McPherson, R.C., Pasyanos, M., Dewey, J.W., and Murray, M., 1995. The September 1, 1994 Mendocino Fault Earthquake, California Geology, Marc/April 1995, p. 43-53.
- Frisch, W., Meschede, M., Blakey, R., 2011. Plate Tectonics, Springer-Verlag, London, 213 pp.
- Geist, E.L. and Andrews D.J., 2000. Slip rates on San Francisco Bay area faults from anelastic deformation of the continental lithosphere, Journal of Geophysical Research, v. 105, no. B11, p. 25,543-25,552.
- Irwin, W.P., 1990. Quaternary deformation, in Wallace, R.E. (ed.), 1990, The San Andreas Fault system, California: U.S. Geological Survey Professional Paper 1515, online at: http://pubs.usgs.gov/pp/1990/1515/
- Lin, J., R. S. Stein, M. Meghraoui, S. Toda, A. Ayadi, C. Dorbath, and S. Belabbes (2011), Stress transfer among en echelon and opposing thrusts and tear faults: Triggering caused by the 2003 Mw = 6.9 Zemmouri, Algeria, earthquake, J. Geophys. Res., 116, B03305, doi:10.1029/2010JB007654.
- McCrory, P.A.,. Blair, J.L., Waldhauser, F., kand Oppenheimer, D.H., 2012. Juan de Fuca slab geometry and its relation to Wadati-Benioff zone seismicity in JGR, v. 117, B09306, doi:10.1029/2012JB009407.
- McLaughlin, R.J., Sarna-Wojcicki, A.M., Wagner, D.L., Fleck, R.J., Langenheim, V.E., Jachens, R.C., Clahan, K., and Allen, J.R., 2012. Evolution of the Rodgers Creek–Maacama right-lateral fault system and associated basins east of the northward-migrating Mendocino Triple Junction, northern California in Geosphere, v. 8, no. 2., p. 342-373.
- Nelson, A.R., Asquith, A.C., and Grant, W.C., 2004. Great Earthquakes and Tsunamis of the Past 2000 Years at the Salmon River Estuary, Central Oregon Coast, USA: Bulletin of the Seismological Society of America, Vol. 94, No. 4, pp. 1276–1292
- Rollins, J.C. and Stein, R.S., 2010. Coulomb stress interactions among M ≥ 5.9 earthquakes in the Gorda deformation zone and on the Mendocino Fault Zone, Cascadia subduction zone, and northern San Andreas Fault: Journal of Geophysical Research, v. 115, B12306, doi:10.1029/2009JB007117, 2010.
- Stoffer, P.W., 2006, Where’s the San Andreas Fault? A guidebook to tracing the fault on public lands in the San Francisco Bay region: U.S. Geological Survey General Interest Publication 16, 123 p., online at http://pubs.usgs.gov/gip/2006/16/
- Yue, H., Zhang, Z., Chen, Y.J., 2008. Interaction between adjacent left-lateral strike-slip faults and thrust faults: the 1976 Songpan earthquake sequence in Chinese Science Bulletin, v. 53, no. 16, p. 2520-2526
- Wallace, Robert E., ed., 1990, The San Andreas fault system, California: U.S. Geological Survey Professional Paper 1515, 283 p. [http://pubs.usgs.gov/pp/1988/1434/].
Jay, so sorry to read about Chicken. So painful to lose a good friend.
Thanks for this site, though. Much of it is beyond my level of understanding at this point, but it’s still fascinating.
Please pardon me for being presumptuous, but as soon as you are ready, consider getting another cat. I’ve been told “they come back to us,” but whether that is true or not, they leave a feline-shaped hole that only another cat can fill. Take good care.
Thanks Su!