IRIS and the US Geological Survey have recently produced an educational video about tectonic earthquakes in the region of the US Pacific Northwest. The project was funded by the National Science Foundation.
The Video
YT link for the embedded video below.
mp4 link for the embedded video below.
mp4 embedded video:
YT embedded video:
I recently collected a core with a thick sandy deposit that is hypothesized to be the sedimentary deposit that was the result of tsunami deposition following the 1700 A.D. Cascadia subduction zone earthquake. Here is my post about that core.
Here is a composite of the two cores that I collected. The top of the core is on the left. Some interpret this to be the 1700 AD tsunami deposit.

- YT link for the embedded video below:
- Hemphill-Haley, E., 1995. Diatom evidence for earthquake-induced subsidence and tsunami 300 yr ago in southern coastal Washington in GSA Bulletin, v. 107, p. 367-378.
- Nelson, A.R., Shennan, I., and Long, A.J., 1996. Identifying coseismic subsidence in tidal-wetland stratigraphic sequences at the Cascadia subduction zone of western North America in Journal of Geophysical Research, v. 101, p. 6115-6135.
- Atwater, B.F. and Hemphill-Haley, E., 1997. Recurrence Intervals for Great Earthquakes of the Past 3,500 Years at Northeastern Willapa Bay, Washington in U.S. Geological Survey Professional Paper 1576, Washington D.C., 119 pp.
I have compiled some literature about the CSZ earthquake and tsunami. Here is a short list that might help us learn about what is contained within the core that I collected.
Earlier this year was the 315th anniversary of the 1700 AD Cascadia subduction zone earthquake and tsunami. I compiled some information about that earthquake and tsunami. I included some information about the plate tectonics of the region. Here is the post for that anniversary.
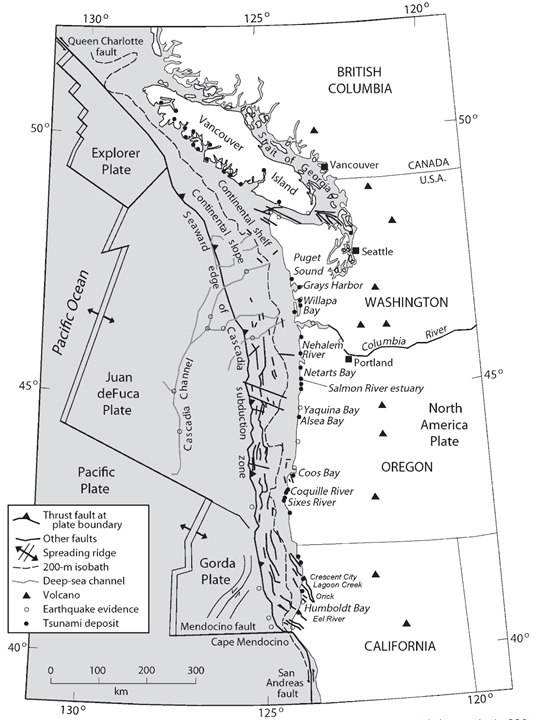
Here is a map of the Cascadia subduction zone, modified from Nelson et al. (2006). The Juan de Fuca and Gorda plates subduct norteastwardly beneath the North America plate at rates ranging from 29- to 45-mm/yr. Sites where evidence of past earthquakes (paleoseismology) are denoted by white dots. Where there is also evidence for past CSZ tsunami, there are black dots. These paleoseismology sites are labeled (e.g. Humboldt Bay). Some submarine paleoseismology core sites are also shown as grey dots. The two main spreading ridges are not labeled, but the northern one is the Juan de Fuca ridge (where oceanic crust is formed for the Juan de Fuca plate) and the southern one is the Gorda rise (where the oceanic crust is formed for the Gorda plate).
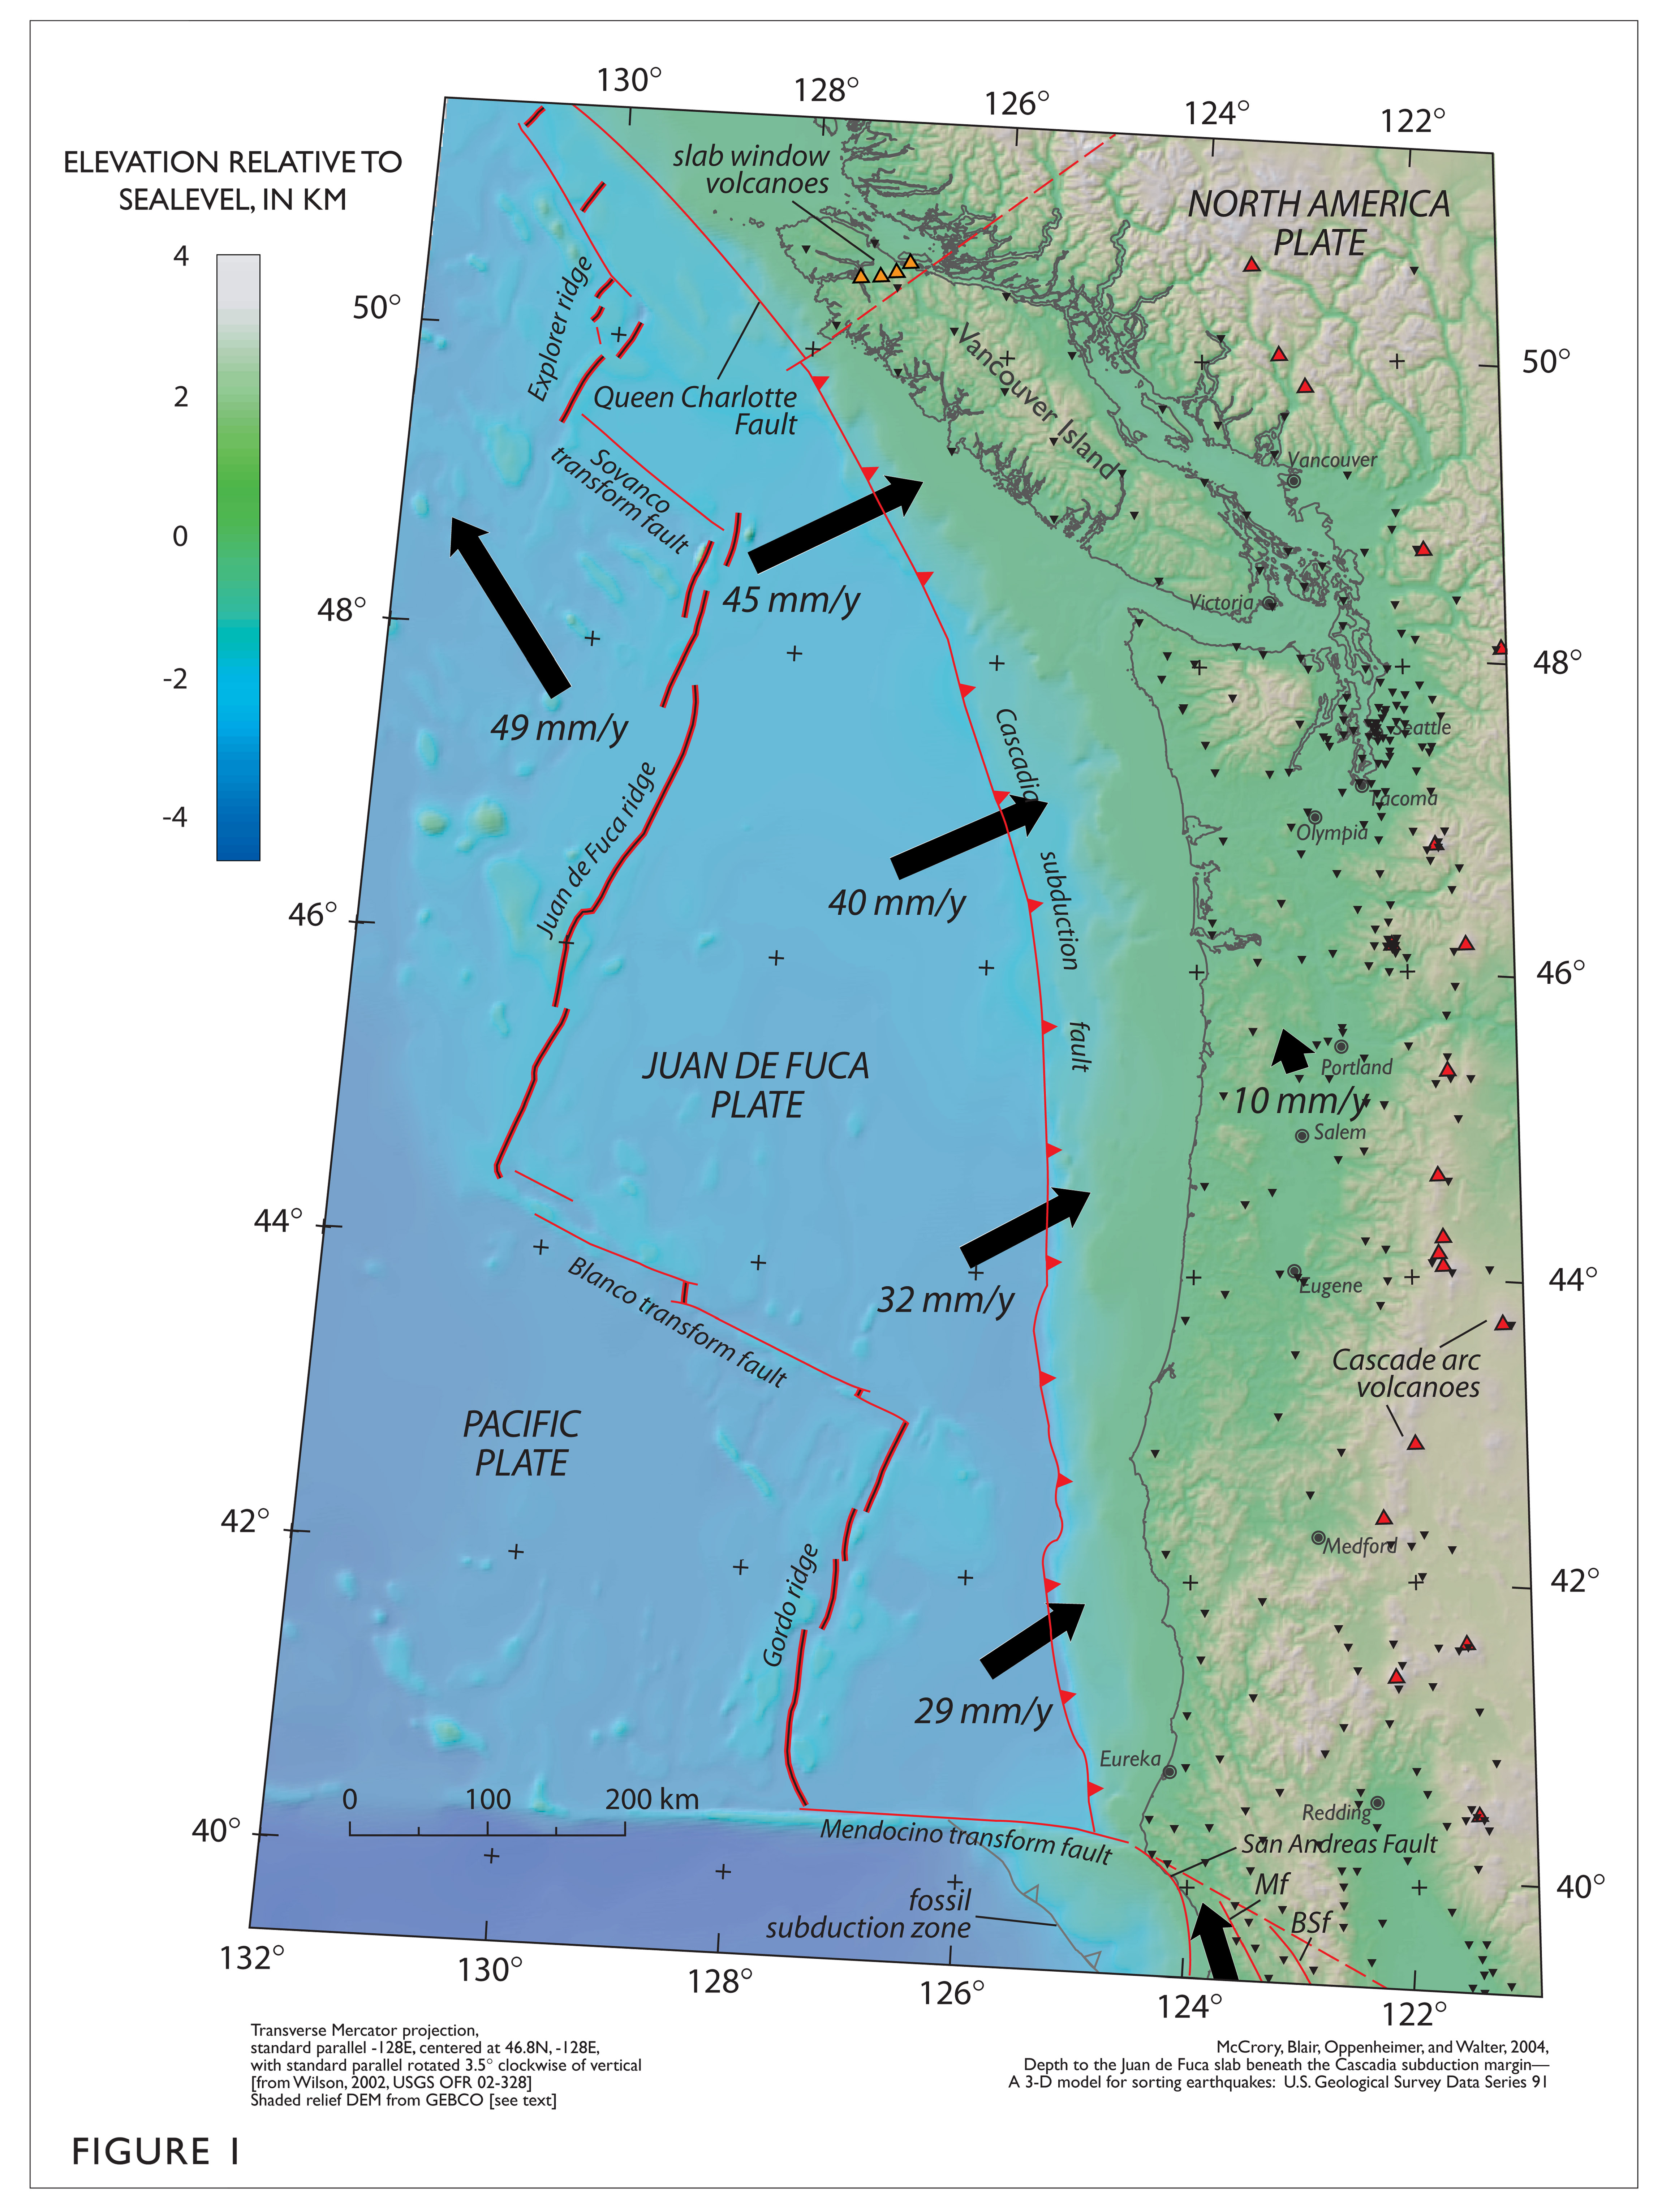
This map (McCrory et al., 2006) shows the secular (ongoing modern) rates of motion for the Juan de Fuca and Gorda plates relative to the North America plate (Wilson, 1998; McCrory, 2000). Red triangles denote active arc volcanoes.
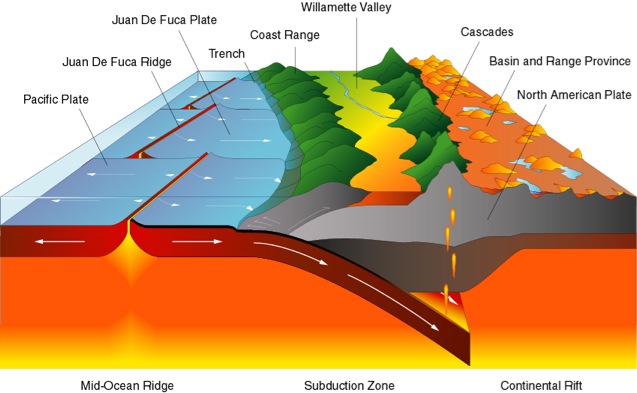
Here is a view of the subduction zone showing the landscape and the plate configuration within the Earth. The cross section is located near the southern Willamette Valley. This is schematic and does not completely match the real geography. Note how the downgoing plate melts and the rising magma leads to volcanism of the Cascade volcanoes (a volcanic arc).
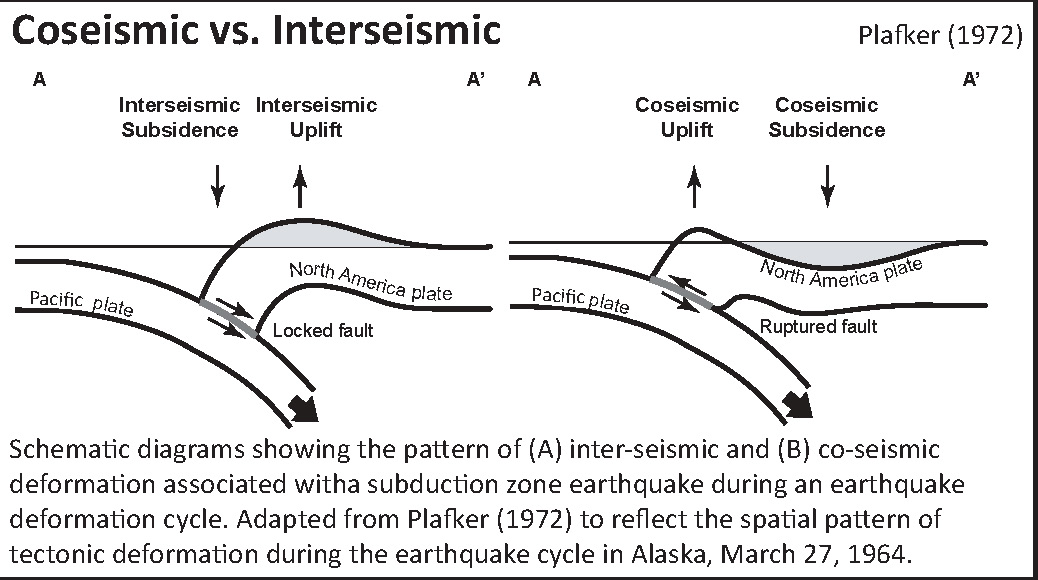
Here is a version of the CSZ cross section alone (Plafker, 1972).

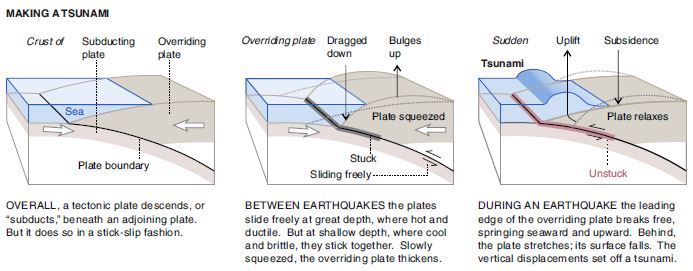
This figure shows how a subduction zone deforms between (interseismic) and during (coseismic) earthquakes. We also can see how a subduction zone generates a tsunami. Atwater et al., 2005.
Here is an animation produced by the folks at Cal Tech following the 2004 Sumatra-Andaman subduction zone earthquake. I have several posts about that earthquake here and here. One may learn more about this animation, as well as download this animation here.
This figure shows the regions that participate in this interseismic and coseismic deformation at Cascadia. Atwater et al., 2005. Black dots on the map show sites where evidence for coseismic subsidence has been found in coastal marshes, lakes, and estuaries.
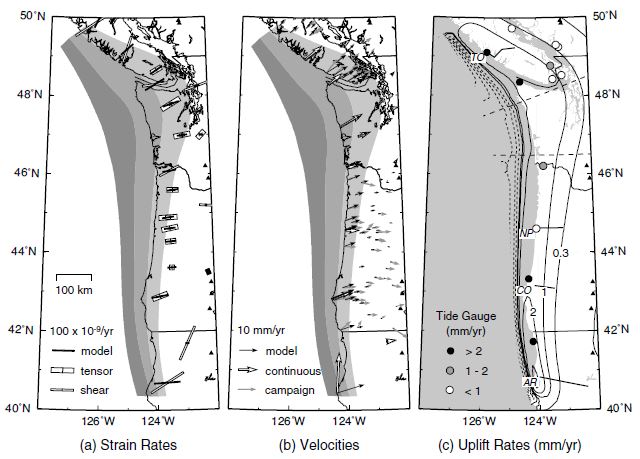
This shows how the CSZ is deforming vertically today (Wang et al., 2003). The panel on the right shows the vertical motion in mm/yr.
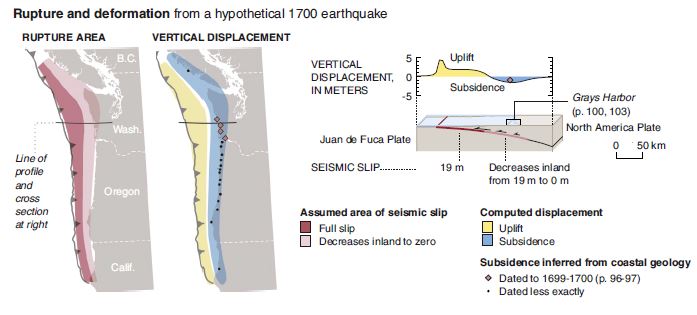
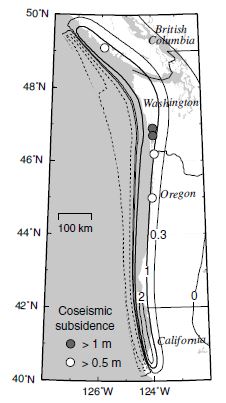
This figure, also from Wang et al. (2003), shows their estimate of how the coseismic vertical motion may happen. Contours are in meters.
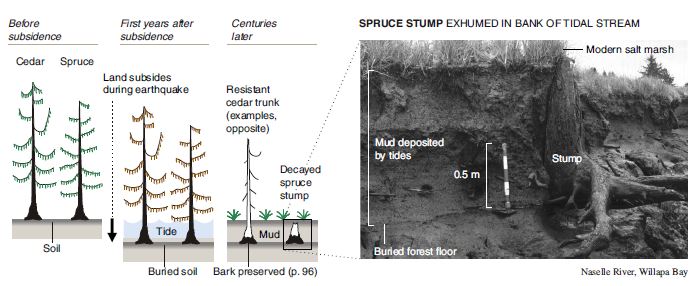
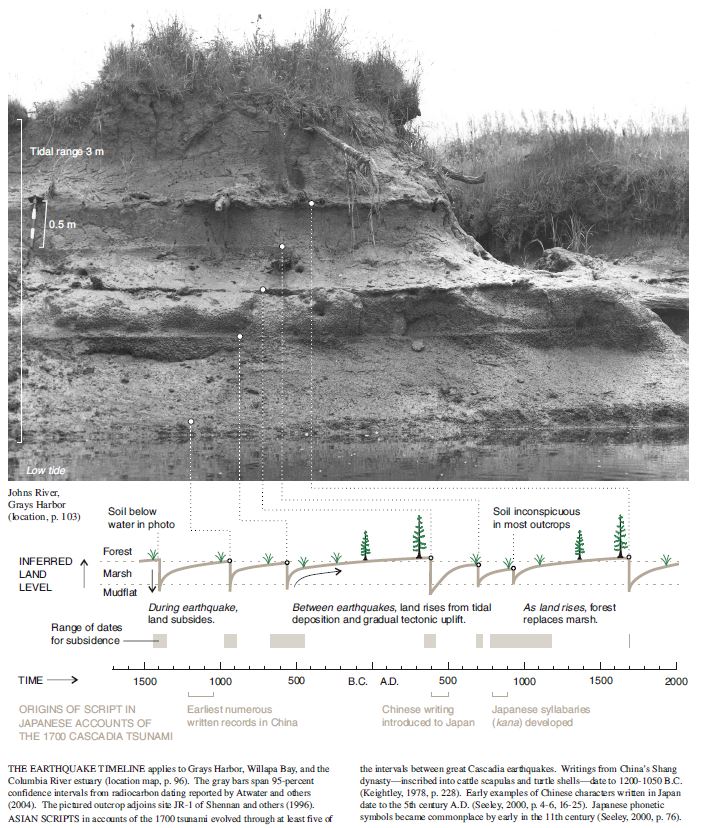
Here is a graphic showing the sediment-stratigraphic evidence of earthquakes in Cascadia. Atwater et al., 2005. There are 3 panels on the left, showing times of (1) prior to earthquake, (2) several years following the earthquake, and (3) centuries after the earthquake. Before the earthquake, the ground is sufficiently above sea level that trees can grow without fear of being inundated with salt water. During the earthquake, the ground subsides (lowers) so that the area is now inundated during high tides. The salt water kills the trees and other plants. Tidal sediment (like mud) starts to be deposited above the pre-earthquake ground surface. This sediment has organisms within it that reflect the tidal environment. Eventually, the sediment builds up and the crust deforms interseismically until the ground surface is again above sea level. Now plants that can survive in this environment start growing again. There are stumps and tree snags that were rooted in the pre-earthquake soil that can be used to estimate the age of the earthquake using radiocarbon age determinations. The tree snags form “ghost forests.
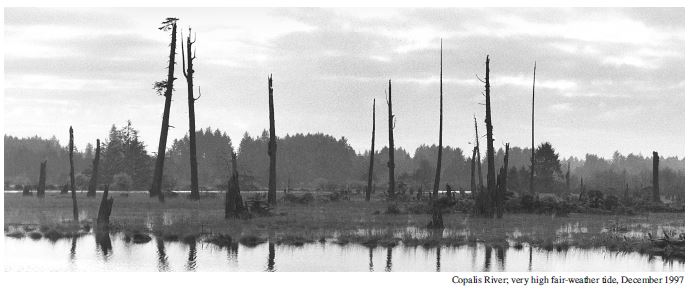
Here is a photo of the ghost forest, created from coseismic subsidence during the Jan. 26, 1700 Cascadia subduction zone earthquake. Atwater et al., 2005.
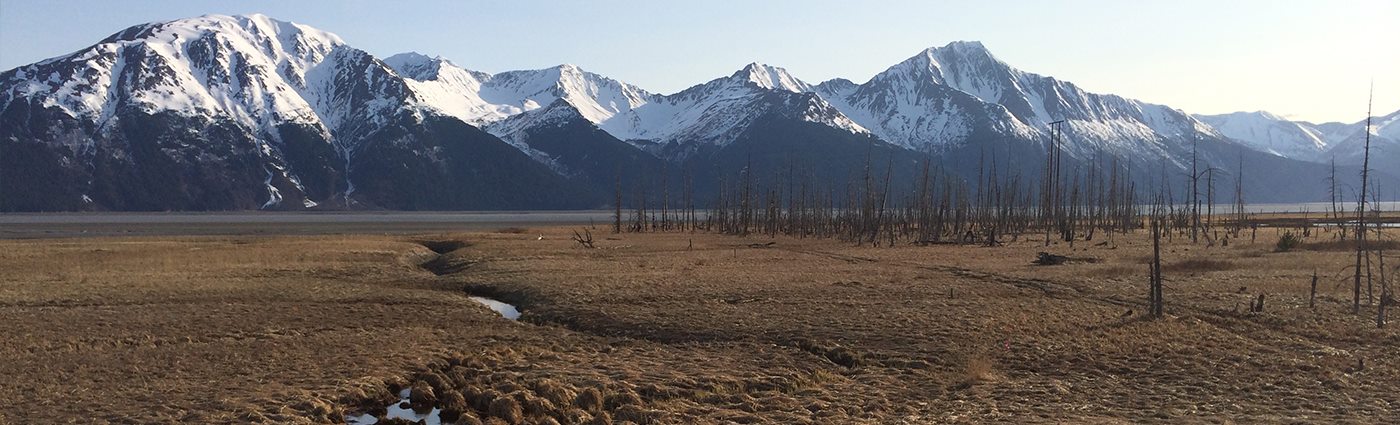
Here is a photo I took in Alaska, where there was a subduction zone earthquake in 1964. These tree snags were living trees prior to the earthquake and remain to remind us of the earthquake hazards along subduction zones.
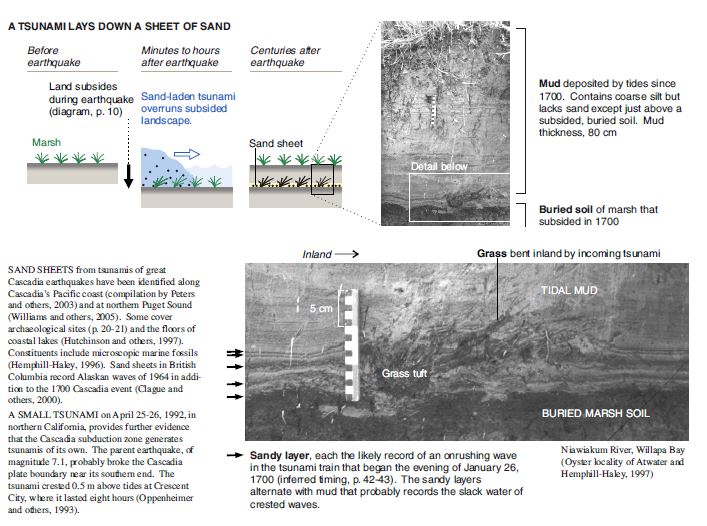
This shows how a tsunami deposit may be preserved in the sediment stratigraphy following a subduction zone earthquake, like in Cascadia. Atwater et al., 2005. If there is a source of sediment to be transported by a tsunami, it will come along for the ride and possibly be deposited upon the pre-earthquake ground surface. Following the earthquake, tidal sediment is deposited above the tsunami transported sediment. Sometimes plants that were growing prior to the earthquake get entombed within the tsunami deposit.
Here is a new animation of the tsunami that was triggered during the 1700 AD CSZ earthquake. This is just a model and has considerable uncertainty associated with it. From the US NWS Pacific Tsunami Warning Center (PTWC).
This is the timeline of prehistoric earthquakes as preserved in sediment stratigraphy in Grays Harbor and Willapa Bay, Washington. Atwater et al., 2005. This timeline is based upon numerous radiocarbon age determinations for materials that died close to the time of the prehistoric earthquakes inferred from the sediment stratigraphy at locations along the Grays Harbor, Willapa Bay, and Columbia River estuary paleoseismic sites.
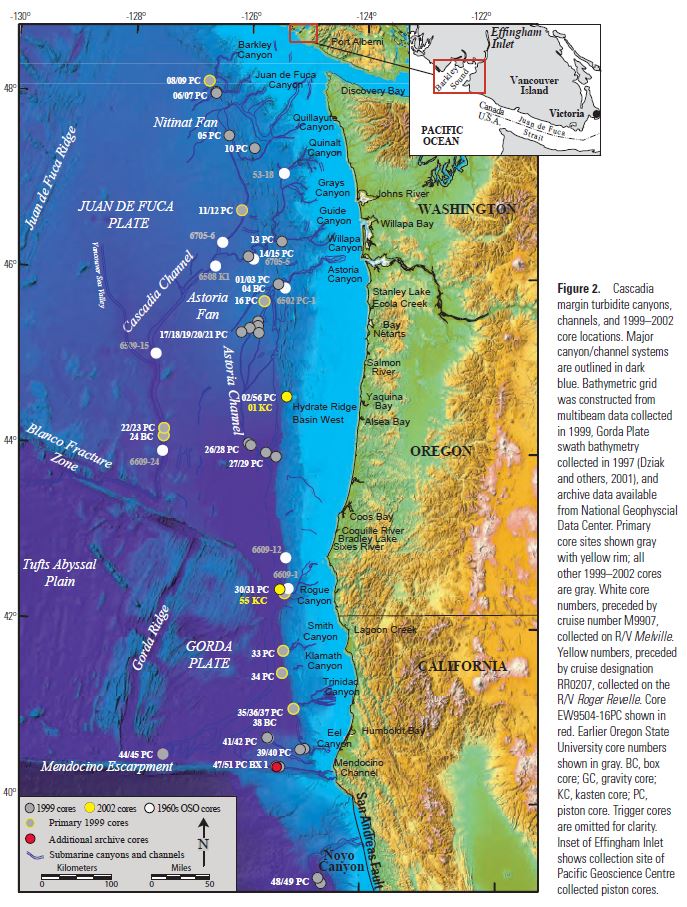
Offshore, Goldfinger and others (from the 1960’s into the 21st Century, see references in Goldfinger et al., 2012) collected cores in the deep sea. These cores contain submarine landslide deposits (called turbidites). These turbidites are thought to have been deposited as a result of strong ground shaking from large magnitude earthquakes. Goldfinger et al. (2012) compile their research in the USGS professional paper. This map shows where the cores are located.
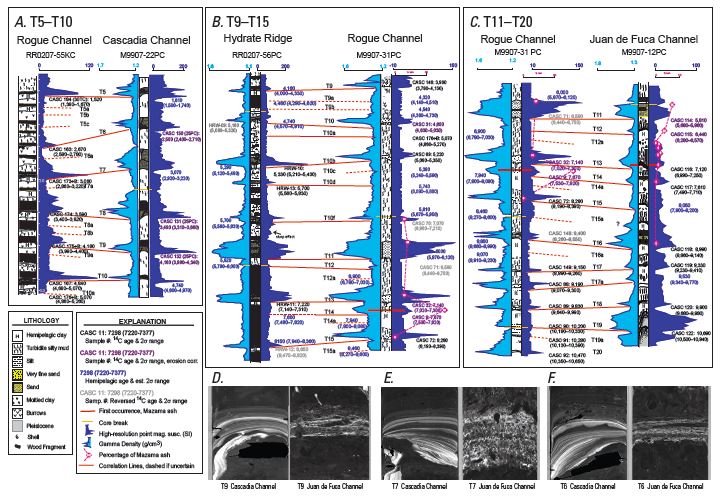
Here is an example of how these “seismoturbidites” have been correlated. The correlations are the basis for the interpretation that these submarine landslides were triggered by Cascadia subduction zone earthquakes. This correlation figure demonstrates how well these turbidites have been correlated. Goldfinger et al., 2012
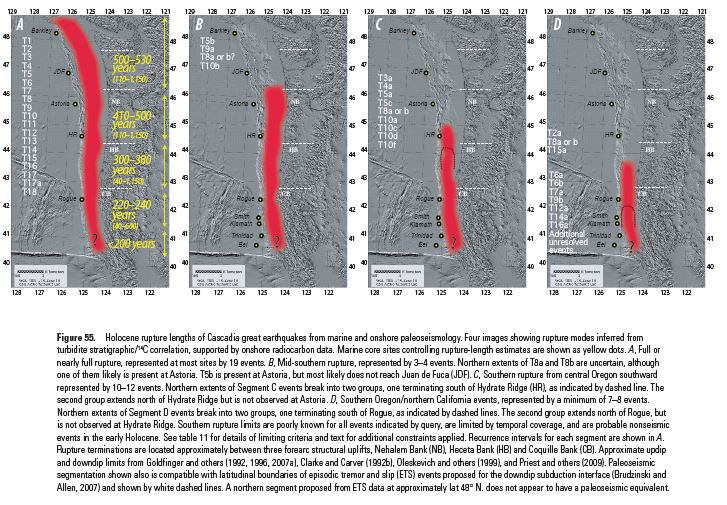
This map shows the various possible prehistoric earthquake rupture regions (patches) for the past 10,000 years. Goldfinger et al., 2012. These rupture scenarios have been adopted by the USGS hazards team that determines the seismic hazards for the USA.
I have a paper that also discusses the paleoseismology and sedimentary settings in Cascadia (and Sumatra). Patton et al., 2013.
Here is my abstract:
Turbidite deposition along slope and trench settings is evaluated for the Cascadia and Sumatra–Andaman subduction zones. Source proximity, basin effects, turbidity current flow path, temporal and spatial earthquake rupture, hydrodynamics, and topography all likely play roles in the deposition of the turbidites as evidenced by the vertical structure of the final deposits. Channel systems tend to promote low-frequency components of the content of the current over longer distances, while more proximal slope basins and base-of-slope apron fan settings result in a turbidite structure that is likely influenced by local physiography and other factors. Cascadia’s margin is dominated by glacial cycle constructed pathways which promote turbidity current flows for large distances. Sumatra margin pathways do not inherit these antecedent sedimentary systems, so turbidity currents are more localized.
The Gorda plate is deforming due to north-south compression between the Pacific and Juan de Fuca plates. There have been many papers written about this. The most recent and comprehensive review is from Jason Chaytor (Chaytor et al., 2004). Here is a map of the Cascadia subduction zone, as modified from Nelson et al. (2006) and Chaytor et al. (2004). I have updated the figure to be good for projections in a dark room (green) and to have the correct sense of motion on the two transform plate boundaries at either end of the CSZ (Queen Charlotte and San Andreas faults).

Here is the Chaytor et al. (2004) map that shows their interpretation of the structural relations in the Gorda plate.

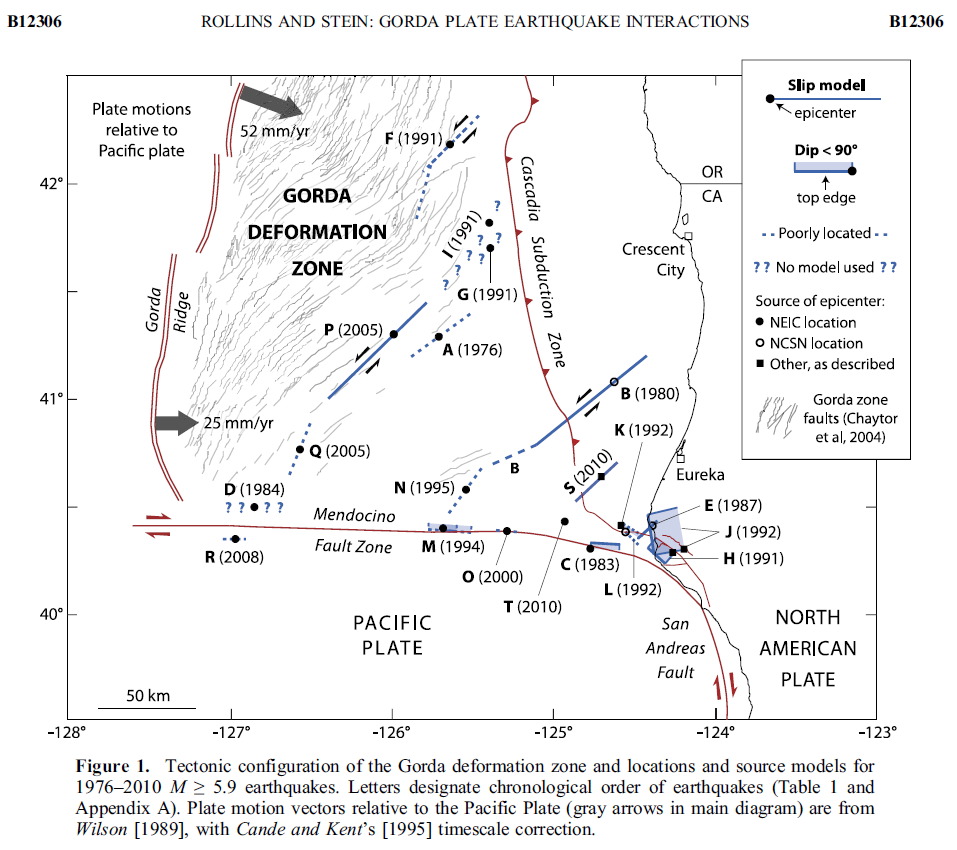
Here is a map from Rollins and Stein, showing their interpretations of different historic earthquakes in the region. This was published in response to the Januray 2010 Gorda plate earthquake. The faults are from Chaytor et al. (2004).
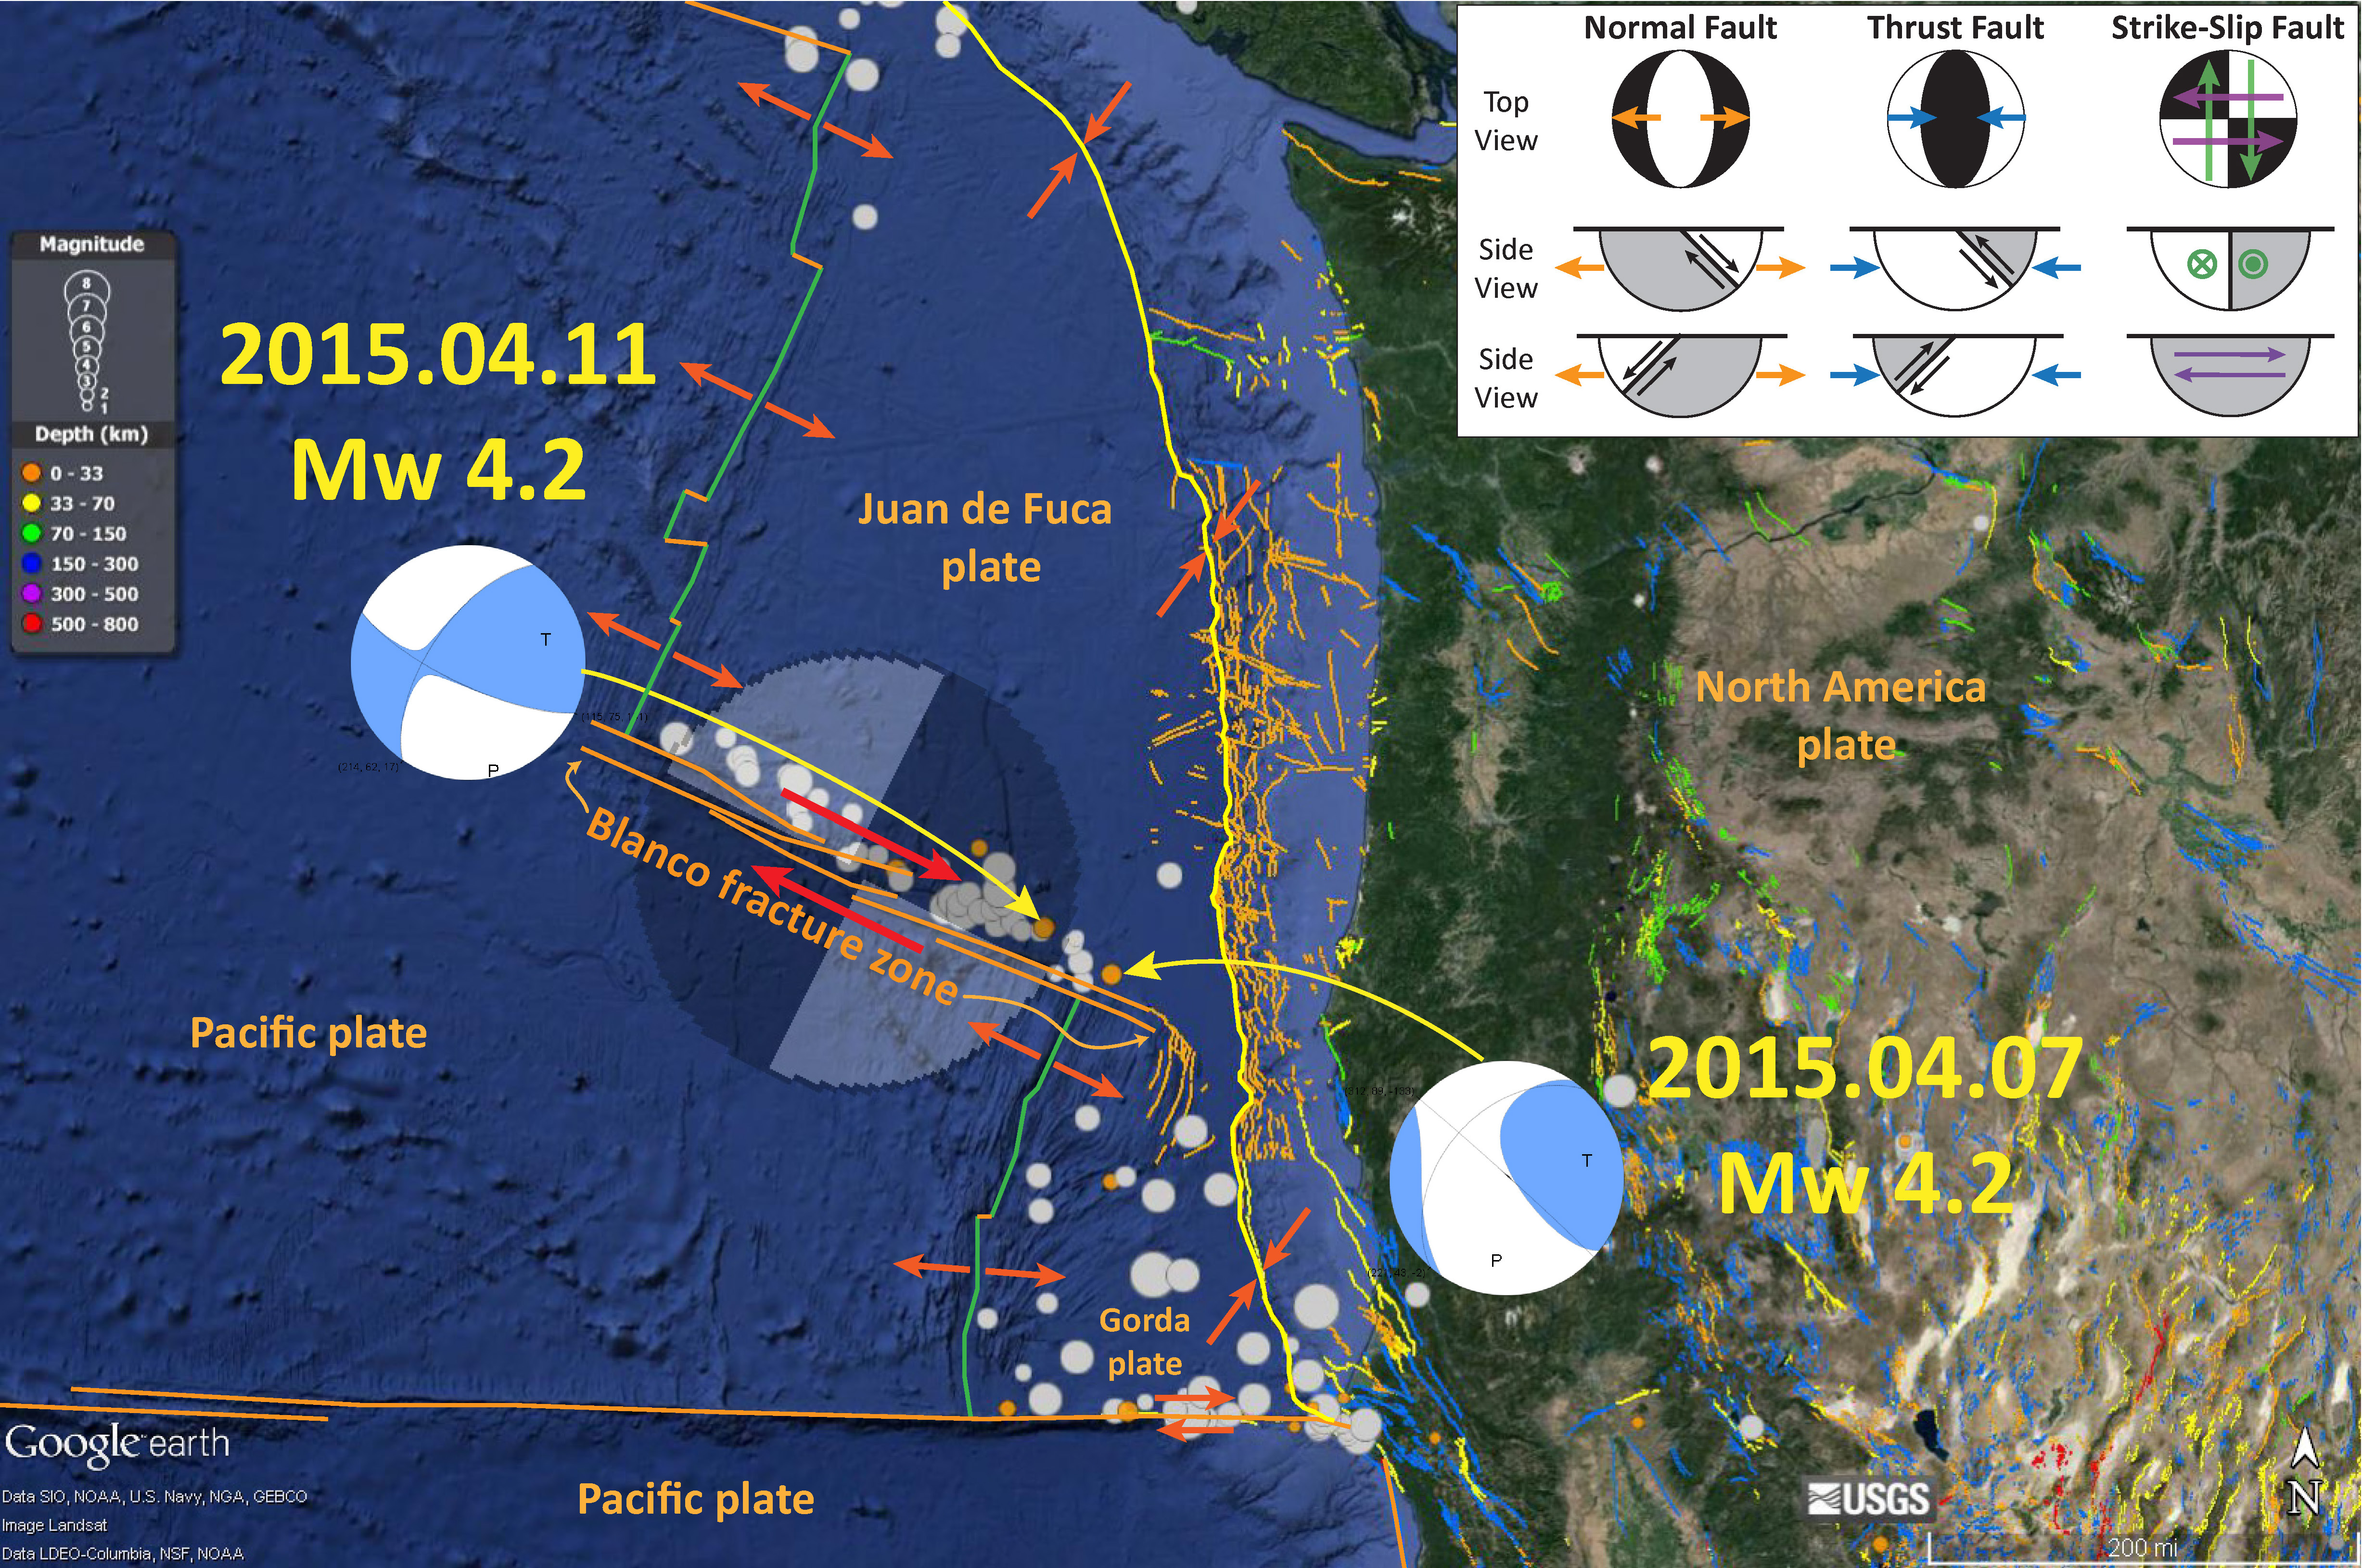
The Blanco fracture zone is also an active transform plate boundary. The BFZ is a strike slip fault system that connects two spreading ridges, the Gorda Rise and the Juan de Fuca Ridge. Here is a map that shows the tectonic setting and some earthquakes related to the BFZ from April 2015. There are some animations on this web page showing seismicity with time along the BFZ, over the past 15
years.
References:
- Atwater, B.F., Musumi-Rokkaku, S., Satake, K., Tsuju, Y., Eueda, K., and Yamaguchi, D.K., 2005. The Orphan Tsunami of 1700—Japanese Clues to a Parent Earthquake in North America, USGS Professional Paper 1707, USGS, Reston, VA, 144 pp.
- Goldfinger, C., Nelson, C.H., Morey, A., Johnson, J.E., Gutierrez-Pastor, J., Eriksson, A.T., Karabanov, E., Patton, J., Gràcia, E., Enkin, R., Dallimore, A., Dunhill, G., and Vallier, T., 2012. Turbidite Event History: Methods and Implications for Holocene Paleoseismicity of the Cascadia Subduction Zone, USGS Professional Paper # 1661F. U.S. Geological Survey, Reston, VA, 184 pp.
- McCrory, P.A., 2000. Upper plate contraction north of the migrating Mendocino triple junction, northern California: Implications for partitioning of strain: Tectonics, v. 19, p. 11441160.
- McCrory, P. A., Blair, J. L., Oppenheimer, D. H., and Walter, S. R., 2006. Depth to the Juan de Fuca slab beneath the Cascadia subduction margin; a 3-D model for sorting earthquakes U. S. Geological Survey
- Nelson, A.R., Kelsey, H.M., Witter, R.C., 2006. Great earthquakes of variable magnitude at the Cascadia subduction zone. Quaternary Research 65, 354-365.
- Patton, J. R., Goldfinger, C., Morey, A. E., Romsos, C., Black, B., Djadjadihardja, Y., and Udrekh, 2013. Seismoturbidite record as preserved at core sites at the Cascadia and Sumatra–Andaman subduction zones, Nat. Hazards Earth Syst. Sci., 13, 833-867, doi:10.5194/nhess-13-833-2013, 2013.
- Plafker, G., 1972. Alaskan earthquake of 1964 and Chilean earthquake of 1960: Implications for arc tectonics in Journal of Geophysical Research, v. 77, p. 901-925.
- Wang, K., Wells, R., Mazzotti, S., Hyndman, R. D., and Sagiya, T., 2003. A revised dislocation model of interseismic deformation of the Cascadia subduction zone Journal of Geophysical Research, B, Solid Earth and Planets v. 108, no. 1.
11 thoughts on “Cascadia subduction zone: Tectonic Earthquakes of the Pacific Northwest”