In the past 2 days there have been a few earthquakes in the Explorer plate region along the Pacific-North America plate boundary. On March 19 of this year there was a series of earthquakes in this same region (to the southeast of today’s earthquakes). Here is my report for the March 2016 earthquakes.
The Cascadia subduction zone (CSZ) is an approximately 1,200-kilometer convergent plate boundary that extends from northern California to Vancouver Island, Canada (inset figure). The Explorer, Juan de Fuca, and Gorda plates are subducting eastwardly below the North American plate. Seismicity, crustal deformation, and geodesy provide evidence that the Cascadia subduction zone is locked and is capable of producing a great (magnitude greater than or equal to 8.5) earthquake (Heaton and Kanamori, 1984; McPherson, 1989; Clarke and Carver, 1992; Hyndman and Wang, 1995; Flück and others, 1997).
The Queen Charlotte fault (QCF) is a dextral (right-lateral) transform plate boundary (strike-slip) fault that forms the Pacific-North America plate boundary north of Vancouver Island. There have been a series of earthquakes along this fault system in the last 100 years, including earthquakes in the 1920s, 1940s, and 2010s. At its southern terminus it meets the CSZ and Explorer ridge (a spreading ridge system that forms oceanic lithosphere of the Explorer plate) to form the Queen Charlotte triple junction (QCTJ labeled on the interpretive poster below). I also include a map below showing the earthquakes with magnitudes M ≥ 7.0 for this time period. The southernmost part of the QCF also has a subduction zone beneath the strike-slip fault. This part of the boundary had a subduction zone earthquake in 2012.
Below is my interpretive poster for this earthquake.
I plot the seismicity from the past month, with color representing depth and diameter representing magnitude (see legend).
- I placed a moment tensor / focal mechanism legend on the poster. There is more material from the USGS web sites about moment tensors and focal mechanisms (the beach ball symbols). Both moment tensors and focal mechanisms are solutions to seismologic data that reveal two possible interpretations for fault orientation and sense of motion. One must use other information, like the regional tectonics, to interpret which of the two possibilities is more likely. The moment tensor shows northeast-southwest compression, perpendicular to the convergence at this plate boundary. Most of the recent seismicity in this region is associated with convergence along the New Britain trench or the South Solomon trench.
- I also include the shaking intensity contours on the map. These use the Modified Mercalli Intensity Scale (MMI; see the legend on the map). This is based upon a computer model estimate of ground motions, different from the “Did You Feel It?” estimate of ground motions that is actually based on real observations. The MMI is a qualitative measure of shaking intensity. More on the MMI scale can be found here and here. This is based upon a computer model estimate of ground motions, different from the “Did You Feel It?” estimate of ground motions that is actually based on real observations.
- In the upper right corner is a map of the Cascadia subduction zone (CSZ) and regional tectonic plate boundary faults. This is modified from several sources (Chaytor et al., 2004; Nelson et al., 2004). I place a red star in the general location of today’s seismicity.
- Below the CSZ map is an illustration modified from Plafker (1972). This figure shows how a subduction zone deforms between (interseismic) and during (coseismic) earthquakes. Today’s earthquake did not occur along the CSZ, so did not produce crustal deformation like this. However, it is useful to know this when studying the CSZ.
- To the left of the CSZ map is a map showing the plate boundary faults associated with the northern CSZ and to the north (including the Queen Charlotte fault; Braunmiller and Nabalek, 2002). I place a red star in the general location of today’s seismicity. These earthquakes occurred in the region east of the Explorer rift. This region of the world still contains some major tectonic mysteries and this is quite exciting. This shows the Winona Block as a microplate between the Pacific and North America plates, north of the Explorer plate. The Winona Block is labeled “WIN BLOCK” on the map. Note that there are two spreading ridges on the western and central part of this block. It is possible that the Explorer ridge-rift system extends into the Winona Block to form a third spreading ridge in the Winona Block.
- In the upper left corner is a map from Braunmiller and Nabalek (2002) that shows focal mechanisms and bathymetry for the Pacific-Explorer plate boundary region. I place a red star in the general location of today’s seismicity.
- In the lower left corner is a figure that shows an interpretation of how this plate boundary developed over the past 3 million years (Braunmiller and Nabalek, 2002). I place a red star in the general location of today’s seismicity.
I include some inset figures in the poster.

- Here is the same map, but with the seismicity from 1900-2017 plotted. These are USGS earthquakes with magnitudes M ≥ 5.0 for this time period. These are the same earthquakes plotted in the video below.
- Here is a larger scale map showing these earthquakes from the last couple of days. Note how these earthquakes align along a north-northeast striking orientation. This orientation matches the lineations that are co-parallel to the spreading ridges in this area. These could be strike-slip fault earthquakes, but the orientation of the moment tensor solutions do not align with the strike-slip faults in this region. This is why I interpret these to be extensional (normal) earthquakes.
- Here is my Earthquake Report interpretive poster for the earthquake from March 2016. The Earthquake Report can be found here.
- Here is a video showing the earthquake epicenters for the period of 1900-2017 for USGS earthquakes with magnitudes M ≥ 5.0. Here is a link to the embedded video below (2.5 MB mp4).
- Here is the map with the seismicity from 1900-2017 plotted. These are USGS earthquakes with magnitudes M ≥ 7.0 for this time period. I include the moment tensors from the 2012 and 2013 earthquakes (the only earthquakes for this time period that have USGS moment tensors). The 2012 earthquake generated a tsunami. I discuss the 2012 “Haida Gwai” earthquake here.
- Here is the general tectonic map of the region (Braunmiller and Nabalek, 2002). Today’s earthquakes happened in a place that suggest the Explorer ridge extends further to the north into the Winona Block. Below I include the text from the original figure caption in blockquote.

Map of Explorer region and surroundings. Plate boundaries are based on Riddihough’s [1984] and Davis and Riddihough’s [1982] tectonic models. Solid lines are active plate boundaries (single lines are transform faults, double lines are spreading centers, barbed lines are subduction zones with barbs in downgoing plate direction). The wide double line outlines the width of the Sovanco fracture zone, and the dots sketch the Explorer-Winona boundary. Plate motion vectors (solid arrows) are from NUVEL-1A [DeMets et al., 1994] for Pacific-North America motion and from Wilson [1993] for Pacific-Juan de Fuca and Juan de Fuca-North America motion. Open arrows are Explorer relative plate motions averaged over last 1 Myr [Riddihough, 1984] (in text, we refer to these most recent magnetically determined plate motions as the ‘‘Riddihough model’’). Winona block motions (thin arrows), described only qualitatively by Davis and Riddihough [1982], are not to scale. Abbreviations are RDW for Revere-Dellwood- Wilson, Win for Winona, FZ for fault zone, I for island, S for seamount, Pen for peninsula.
- Here is the larger scale figure that shows the details of the plate boundary in this region (Braunmiller and Nabalek, 2002). Below I include the text from the original figure caption in blockquote.

Close-up of the Pacific-Explorer boundary. Plotted are fault plane solutions (gray scheme as in Figure 3) and well-relocated earthquake epicenters. The SeaBeam data are from the RIDGE Multibeam Synthesis Project (http://imager.ldeo.columbia.edu) at the Lamont-Doherty Earth observatory. Epicenters labeled by solid triangles are pre-1964, historical earthquakes (see Appendix B). Solid lines mark plate boundaries inferred from bathymetry and side-scan data [Davis and Currie, 1993]; dashed were inactive. QCF is Queen Charlotte fault, TW are Tuzo Wilson seamounts, RDW is Revere-Dellwood-Wilson fault, DK are Dellwood Knolls, PRR is Paul Revere ridge, ER is Explorer Rift, ED is Explorer Deep, SERg is Southern Explorer ridge, ESM is Explorer seamount, SETB is Southwest Explorer Transform Boundary, SAT is Southwestern Assimilated Territory, ESDZ is Eastern Sovanco Deformation Zone, HSC is Heck seamount chain, WV is active west valley of Juan de Fuca ridge, MV is inactive middle valley.
- This is the figure that shows an interpretation of how this plate boundary formed over the past 3 Ma (Braunmiller and Nabalek, 2002). Below I include the text from the original figure caption in blockquote.
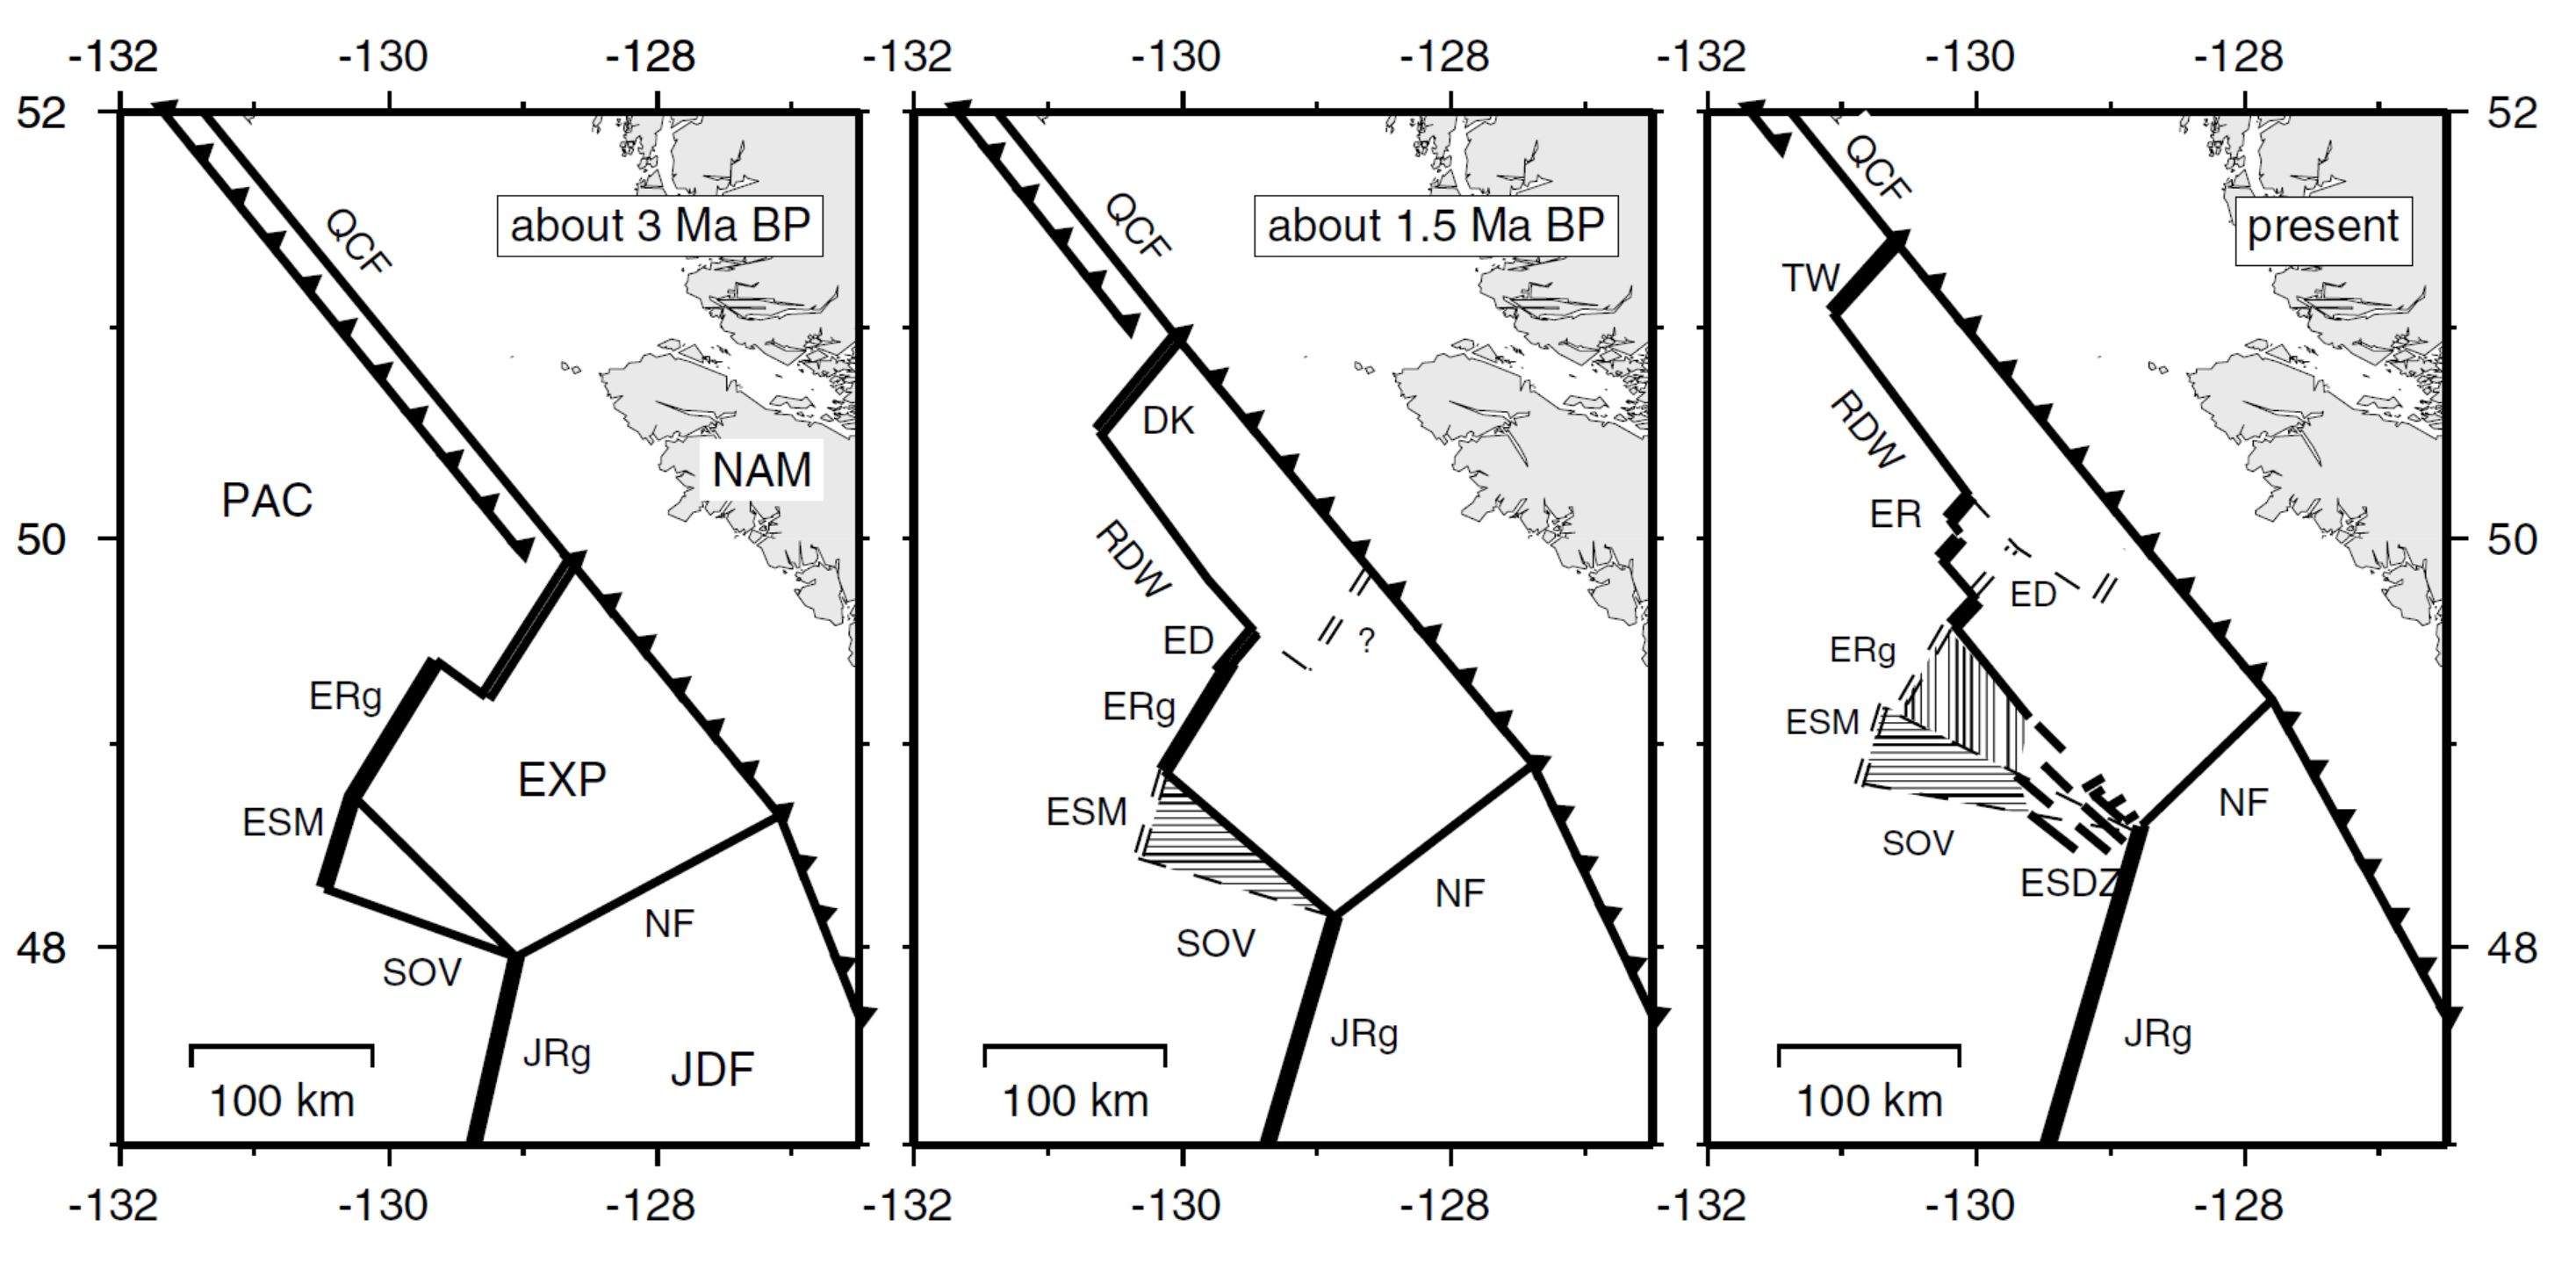
Schematic plate tectonic reconstruction of Explorer region during the last 3 Myr. Note the transfer of crustal blocks (hatched) from the Explorer to the Pacific plate; horizontal hatch indicates transfer before 1.5 Ma and vertical hatch transfer since then. Active boundaries are shown in bold and inactive boundaries are thin dashes. Single lines are transform faults, double lines are spreading centers; barbed lines are subduction zones with barbs in downgoing plate direction. QCF is Queen Charlotte fault, TW are the Tuzo Wilson seamounts, RDW is Revere-Dellwood-Wilson fault, DK are the Dellwood Knolls, ED is Explorer Deep, ER is Explorer Rift, ERg is Explorer Ridge, ESM is Explorer Seamount, SOV is Sovanco fracture zone, ESDZ is Eastern Sovanco Deformation Zone, JRg is Juan de Fuca ridge, and NF is Nootka fault. The question mark indicates ambiguity whether spreading offshore Brooks peninsula ceased when the Dellwood Knolls became active (requiring only one independently moving plate) or if both spreading centers, for a short time span, where active simultaneously (requiring Winona block motion independent from Explorer plate during that time).
- Below I include some inset maps from Audet et al. (2008 ) and Dziak (2006). Each of these authors have published papers about the Explorer plate. Dziak (2006) used bathymetric and seismologic data to evaluate the faulting in the region and discussed how the Explorer plate is accommodating a reorganization of the plate boundary. Audet et al. (2008 ) use terrestrial seismic data to evaluate the crust along northern Vancouver Island and present their tectonic map as part of this research (though they do not focus on the offshore part of the Explorer plate). I include these figures below along with their figure captions. Today’s earthquakes happened at the northwestern portion of these maps from Dziak (2006).
- Dziak, 2006
- Dziak, 2006
- Dziak, 2006
- Dziak, 2006
- Audet et al., 2008

Bathymetric map of northern Juan de Fuca and Explorer Ridges. Map is composite of multibeam bathymetry and satellite altimetry (Sandwell and Smith, 1997). Principal structures are labeled: ERB—Explorer Ridge Basin, SSL—strike-slip lineation. Inset map shows conventional tectonic interpretation of region. Dashed box shows location of main figure. Solid lines are active plate boundaries, dashed line shows Winona-Explorer boundary, gray ovals represent seamount chains. Solid arrows show plate motion vectors from NUVEL-1A (DeMets et al., 1994) for Pacific–North America and from Wilson (1993) for Pacific–Juan de Fuca and Juan de Fuca–North America. Open arrows are Explorer relative motion averaged over past 1 m.y. (Riddihough, 1984). Abbreviations: RDW—Revere-Dellwood-Wilson,Win—Winona block, C.O.—Cobb offset, F.Z.—fracture zone. Endeavour segment is northernmost section of Juan de Fuca Ridge.

Structural interpretation map of Explorer–Juan de Fuca plate region based on composite multibeam bathymetry and satellite altimetry data (Fig. 1). Heavy lines are structural (fault) lineations, gray circles and ovals indicate volcanic cones and seamounts, dashed lines are turbidite channels. Location of magnetic anomaly 2A is shown; boundaries are angled to show regional strike of anomaly pattern.

Earthquake locations estimated using U.S. Navy hydrophone arrays that occurred between August 1991 and January 2002. Focal mechanisms are of large (Mw>4.5) earthquakes that occurred during same time period, taken from Pacific Geoscience Center, National Earthquake Information Center, and Harvard moment-tensor catalogs. Red mechanism shows location of 1992 Heck Seamount main shock.

Tectonic model of Explorer plate boundaries. Evidence presented here is consistent with zone of shear extending through Explorer plate well south of Sovanco Fracture Zone (SFZ) to include Heck, Heckle, and Springfield seamounts, and possibly Cobb offset (gray polygon roughly outlines shear zone). Moreover, Pacific– Juan de Fuca–North American triple junction may be reorganizing southward to establish at Cobb offset. QCF—Queen Charlotte fault.
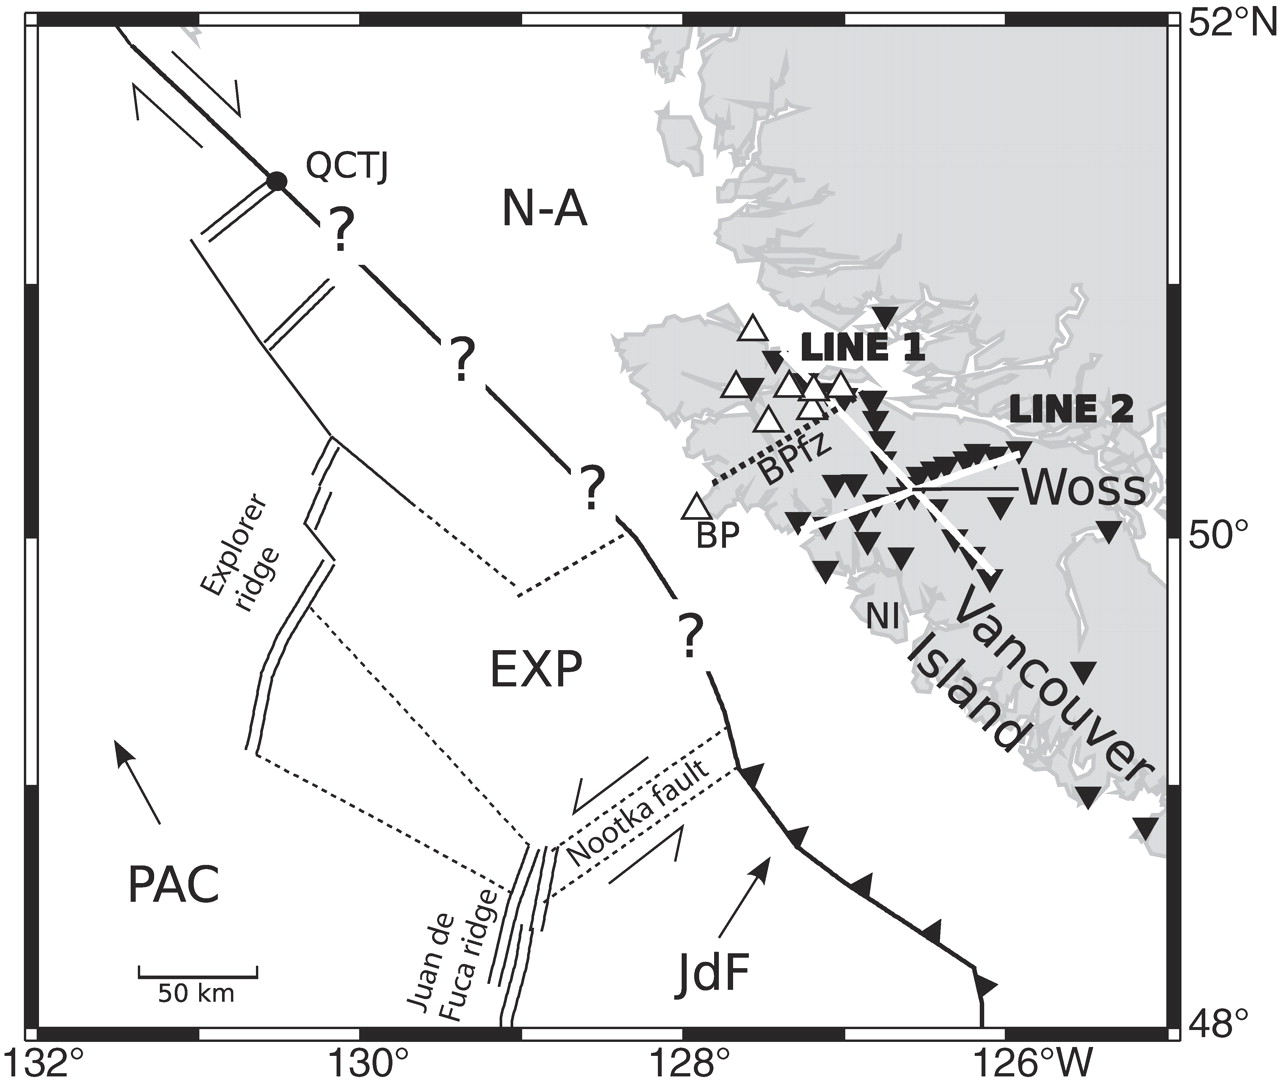
Identification of major tectonic features in western Canada. BP—Brooks Peninsula, BPfz—Brooks Peninsula fault zone, NI— Nootka Island, QCTJ—Queen Charlotte triple junction. Dotted lines delineate extinct boundaries or shear zones. Seismic stations are displayed as inverted black triangles. Station projections along line 1 and line 2 are plotted as thick white lines. White triangles represent Alert Bay volcanic field centers. Center of array locates town of Woss. Plates: N-A—North America; EXP—Explorer; JdF—Juan de Fuca; PAC—Pacific.
- Here is another map that shows the tectonics of this region. Hyndman (2015) shows the region where the 2012 Haida Gwaii earthquake ruptured. I include two more figures below. This figure Below I include the text from the original figure caption in blockquote.

The Queen Charlotte fault (QCF) zone, the islands of Haida Gwaii and adjacent area, and the locations of the 2012 Mw 7.8 (ellipse), 2013 Mw 7.5 (solid line), and 1949 Ms 8.1 (dashed) earthquakes. The along margin extent of the 1949 event is not well constrained.
- This map shows the main and aftershocks from the 2012 Haida Gwaii earthquake sequence (Hyndman, 2015). This 2012 sequence is interesting because, prior to these earthquakes, it was unclear whether the fault along Haida Gwaii was a strike-slip or a thrust fault. For example, Riddihough (1984) suggests that there is no subduction going on along the Explorer plate at all. Turns out it is probably both. When this 2012 earthquake happened, I took a look at the bathymetry in Google Earth and noticed the Queen Charlotte Terrace, which looks suspiciously like an accretionary prism. This was convincing evidence for the thrust fault earthquakes. Below I include the text from the original figure caption in blockquote.

Aftershocks of the 2012 Mw 7.8 Haida Gwaii thrust 13 earthquake (after Cassidy et al., 2013). They approximately define the rupture area. The normal-faulting mechanisms for two of the larger aftershocks are also shown. Many of the aftershocks are within the incoming oceanic plate and within the overriding continental plate rather than on the thrust rupture plane.
- This is a great version of this figure that shows how there are overlapping subduction (thrust) and transform (strike-slip) faults along the Haida Gwaii region (Hyndman, 2015). Below I include the text from the original figure caption in blockquote.
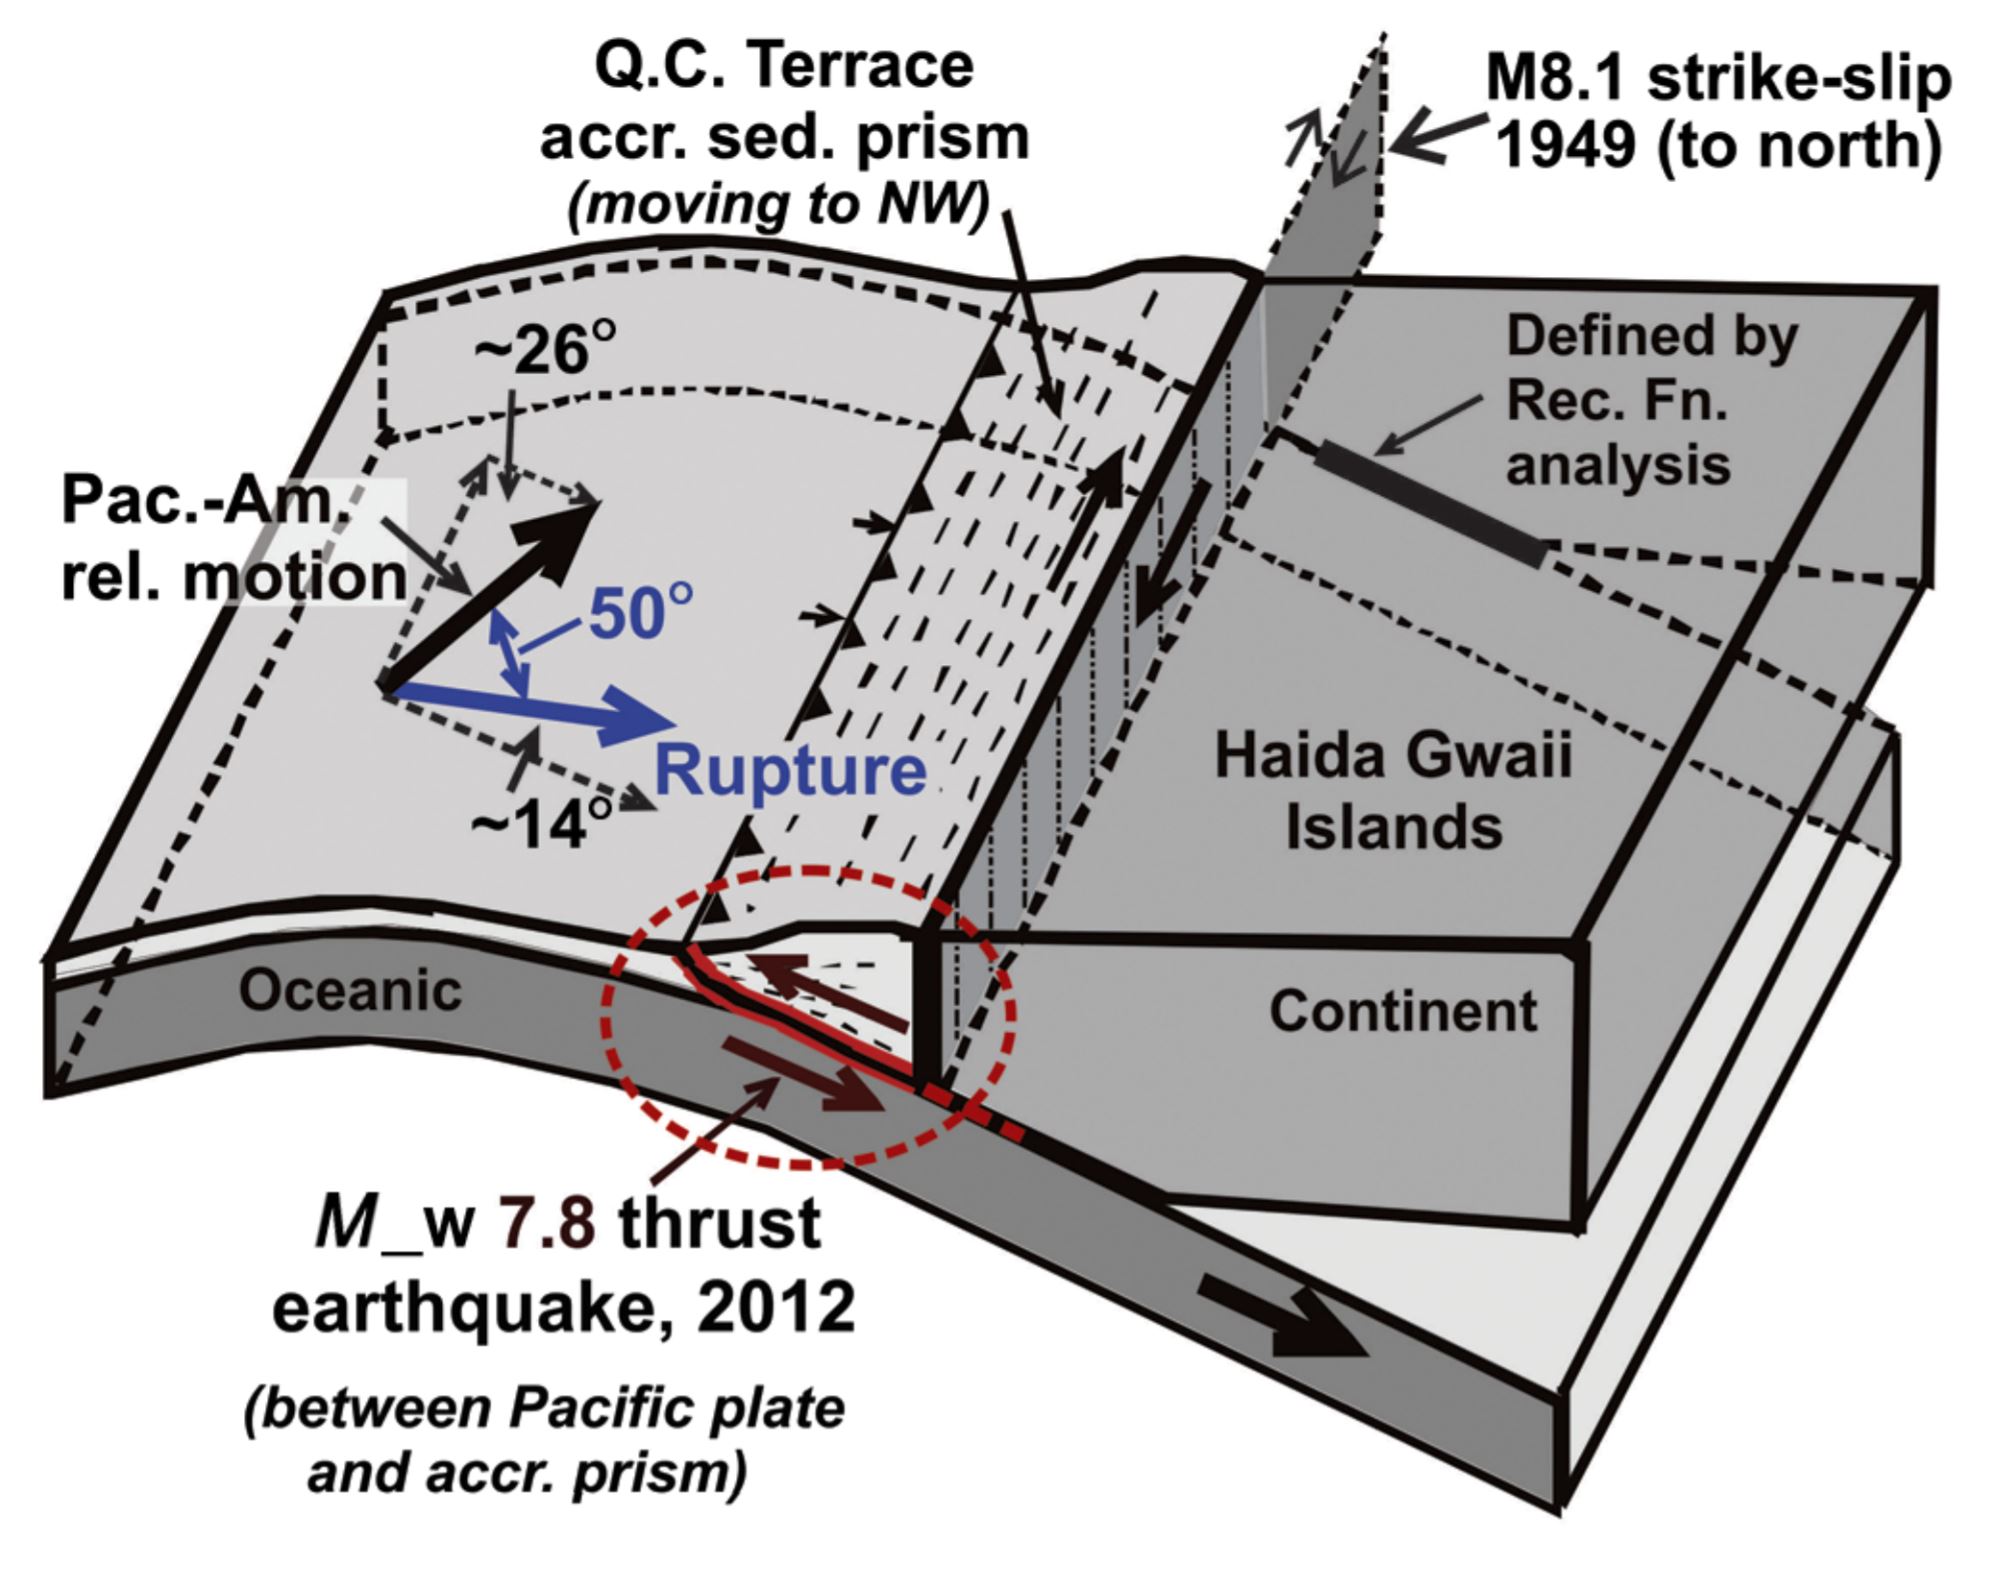
Model for the 2012 Mw 7.8 earthquake rupture and the partitioning of oblique convergence into margin parallel motion on the Queen Charlotte transcurrent fault and nearly orthogonal thrust convergence on the Haida Gwaii thrust fault.
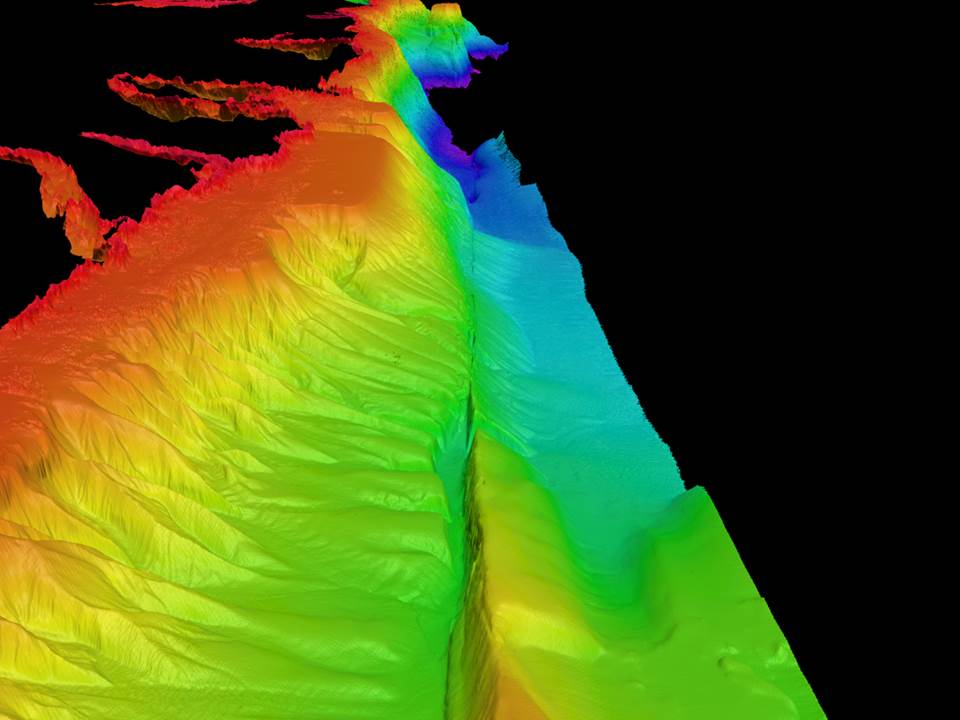
- Here is a fantastic view of the QCF. This is a plot of multibeam bathymetry from offshore of Haida Gwaii. This was posted by John Cassidy from his twitter feed. More about the cruise when these data were collected can be found here.
- Here is a figure that shows two ways of interpreting the Queen Charlotte triple junction region (Kreemer et al., 1998). Note the 1900-2017 seismicity map above, which supports the interpretation in the right panel (B). Something of trivial nature is that this article is from the pre-computer illustration era (see the squiggly hand drawn arrow in the right panel B). Below I include the text from the original figure caption in blockquote.

(A) Major tectonic features describing the micro-plate model for the Explorer region. The Explorer plate (EXP) is an independent plate and is in convergent motion towards the North American plate (NAM). V.I. D Vancouver Island; PAC D the Pacific plate; JdF D the Juan the Fuca plate. The accentuated zone between the Explorer and JdF ridges is the Sovanco transform zone and the two boundary lines do not indicate the presence of faults but define the boundaries of this zone of complex deformation. (B) The key features of the pseudo-plate model for the region are a major plate boundary transform fault zone between the North American and Pacific plates and the Nootka Transform, a left-lateral transform fault north of the Juan the Fuca plate.
References:
- Atwater, B.F., Musumi-Rokkaku, S., Satake, K., Tsuju, Y., Eueda, K., and Yamaguchi, D.K., 2005. The Orphan Tsunami of 1700—Japanese Clues to a Parent Earthquake in North America, USGS Professional Paper 1707, USGS, Reston, VA, 144 pp.
- Braunmiller, J. and Nabelek, J., 2002. Seismotectonics of the Explorer region in JGR, v. 107, NO. B10, 2208, doi:10.1029/2001JB000220, 2002
- Chaytor, J.D., Goldfinger, C., Dziak, R.P., and Fox, C.G., 2004. Active deformation of the Gorda plate: Constraining deformation models with new geophysical data: Geology v. 32, p. 353-356.
- Audet, P., Bostock, M.G., Mercier, J.-P., and Cassidy, J.F., 2008., Morphology of the Explorer–Juan de Fuca slab edge in northern Cascadia: Imaging plate capture at a ridge-trench-transform triple junction in Geology, v. 36, p. 895-898.
- Clarke, S. H., and Carver, G. C., 1992. Late Holocene Tectonics and Paleoseismicity, Southern Cascadia Subduction Zone, Science, vol. 255:188-192.
- Dziak, R.P., 2006. Explorer deformation zone: Evidence of a large shear zone and reorganization of the Pacific–Juan de Fuca–North American triple junction in Geology, v. 34, p. 213-216.
- Flück, P., Hyndman, R. D., Rogers, G. C., and Wang, K., 1997. Three-Dimensional Dislocation Model for Great Earthquakes of the Cascadia Subduction Zone, Journal of Geophysical Research, vol. 102: 20,539-20,550.
- Heaton, f f., Kanamori, F. F., 1984. Seismic Potential Associated with Subduction in the Northwest United States, Bulletin of the Seismological Society of America, vol. 74: 933-941.
- Hyndman, R. D., and Wang, K., 1995. The rupture zone of Cascadia great earthquakes from current deformation and the thermal regime, Journal of Geophysical Research, vol. 100: 22,133-22,154.
- Keemer, C., Govers, R., Furlong, K.P., and Holt, W.E., 1998. Plate boundary deformation between the Pacific and North America in the Explorer region in Tectonophysics, v. 293, p. 225-238.
- McPherson, R. M., 1989. Seismicity and Focal Mechanisms Near Cape Mendocino, Northern California: 1974-1984: M. S. thesis, Arcata, California, Humboldt State University, 75 p
- Nelson, A.R., Asquith, A.C., and Grant, W.C., 2004. Great Earthquakes and Tsunamis of the Past 2000 Years at the Salmon River Estuary, Central Oregon Coast, USA: Bulletin of the Seismological Society of America, Vol. 94, No. 4, pp. 1276–1292
- Plafker, G., 1972. Alaskan earthquake of 1964 and Chilean earthquake of 1960: Implications for arc tectonics in Journal of Geophysical Research, v. 77, p. 901-925.
- Riddihough, R., 1984. Recent Movements of the Juan de Fuca Plate System in JGR, v. 89, no. B8, p. 6980-6994.
- Wang, K., Wells, R., Mazzotti, S., Hyndman, R. D., and Sagiya, T., 2003. A revised dislocation model of interseismic deformation of the Cascadia subduction zone Journal of Geophysical Research, B, Solid Earth and Planets v. 108, no. 1.