Early this morning, I was awakened by a mild jolt. I thought, well, seems like a M 3+- nearby. I did not get out of bed. The main shaking lasted a couple of seconds, though it seemed that there was some additional shaking for several more seconds afterwards (secondary shaking? I live in the Manila Dunes, which overlie several kms of water saturated sediment.
- Here is the USGS website for today’s M 3.5 earthquake.
This earthquake is quite interesting. The hypocentral depth is about 20 km. The subduction zone fault has been modeled to be between 15 and 20 km depth at this location (McCrory et al., 2006, 2012). There is considerable uncertainty associated with this slab model (the “slab” refers to the downgoing oceanic lithosphere of the Gorda plate). If this earthquake were an interface event (on the subduction zone), the moment tensor would probably be a thrust fault solution. However, the USGS moment tensor is for a strike-slip earthquake. There was an M 4.8 earthquake on 2016.07.21 that had a similar orientation. Here are my two earthquake reports for that earthquake: (1) initial report and (2) update # 1. I also spoke with Bob McPherson about this earthquake and, without speaking for him, we agreed that this is indeed an interesting earthquake.
- So, we can probably rule out this as a subduction zone interface earthquake. Then lets consider the other two options: (1) Gorda plate intraplate earthquake or (2) North America plate intraplate earthquake.
- The Gorda plate has a structural grain associated with its initial formation at the Gorda Rise. These faults initially form as ~north-south striking normal faults. As the plate is deformed with time, the faults in the southern half of the plate rotate in a clockwise fashion. As a result of the north-south compression (from the Pacific plate moving northwards,
crushing the Gorda plate), these northeast striking faults slip with a left-lateral strike-slip motion. Today’s M 3.5 earthquake is not oriented with a northeast orientation. However, as these faults extend northwards, the strike of the faults tend to rotate back with a more northerly strike. It is possible that the faults in the Gorda plate have a north-south strike in the region of today’s earthquake. If this were the case, this would be a north-south striking left-lateral strike-slip earthquake. - The North America plate (NAP) in this region has been sliced and diced by a suite of different tectonic forces that have changed with time. Prior to about 0.5 million years ago, the dominant tectonic regime was simply the subduction zone. The subduction zone exerted stresses into the NAP that resulted in thrust faults (and possibly forearc sliver faults). After that, the San Andreas fault (and the Mendocino triple junction, MTJ) came on the scene. Tertiary rocks have been uplifted and tilted northwards because of this influence. Also, the earlier formed thrust faults may rotate around to a more east-west orientation in the Humboldt Bay and south region. As the MTJ migrates north (which may not be the best way to view this motion), some San Andreas oriented fault motion has penetrated into the region north of the MTJ. The Trinidad and Big Lagoon faults are mapped as strike-slip faults offshore. These faults may have formed this sense of motion prior to the MTJ arrival (due to oblique plate motion on the subduction zone, formed as forearc sliver faults; Lange et al., 2008). One of the strands of the Big Lagoon fault zone is oriented north-south. The only (major) problem with this possibility is that these NAP strike-slip faults are all right-lateral. Today’s moment tensor, if using the north-south solution, is left-lateral. So, this is not a reasonable interpretation.
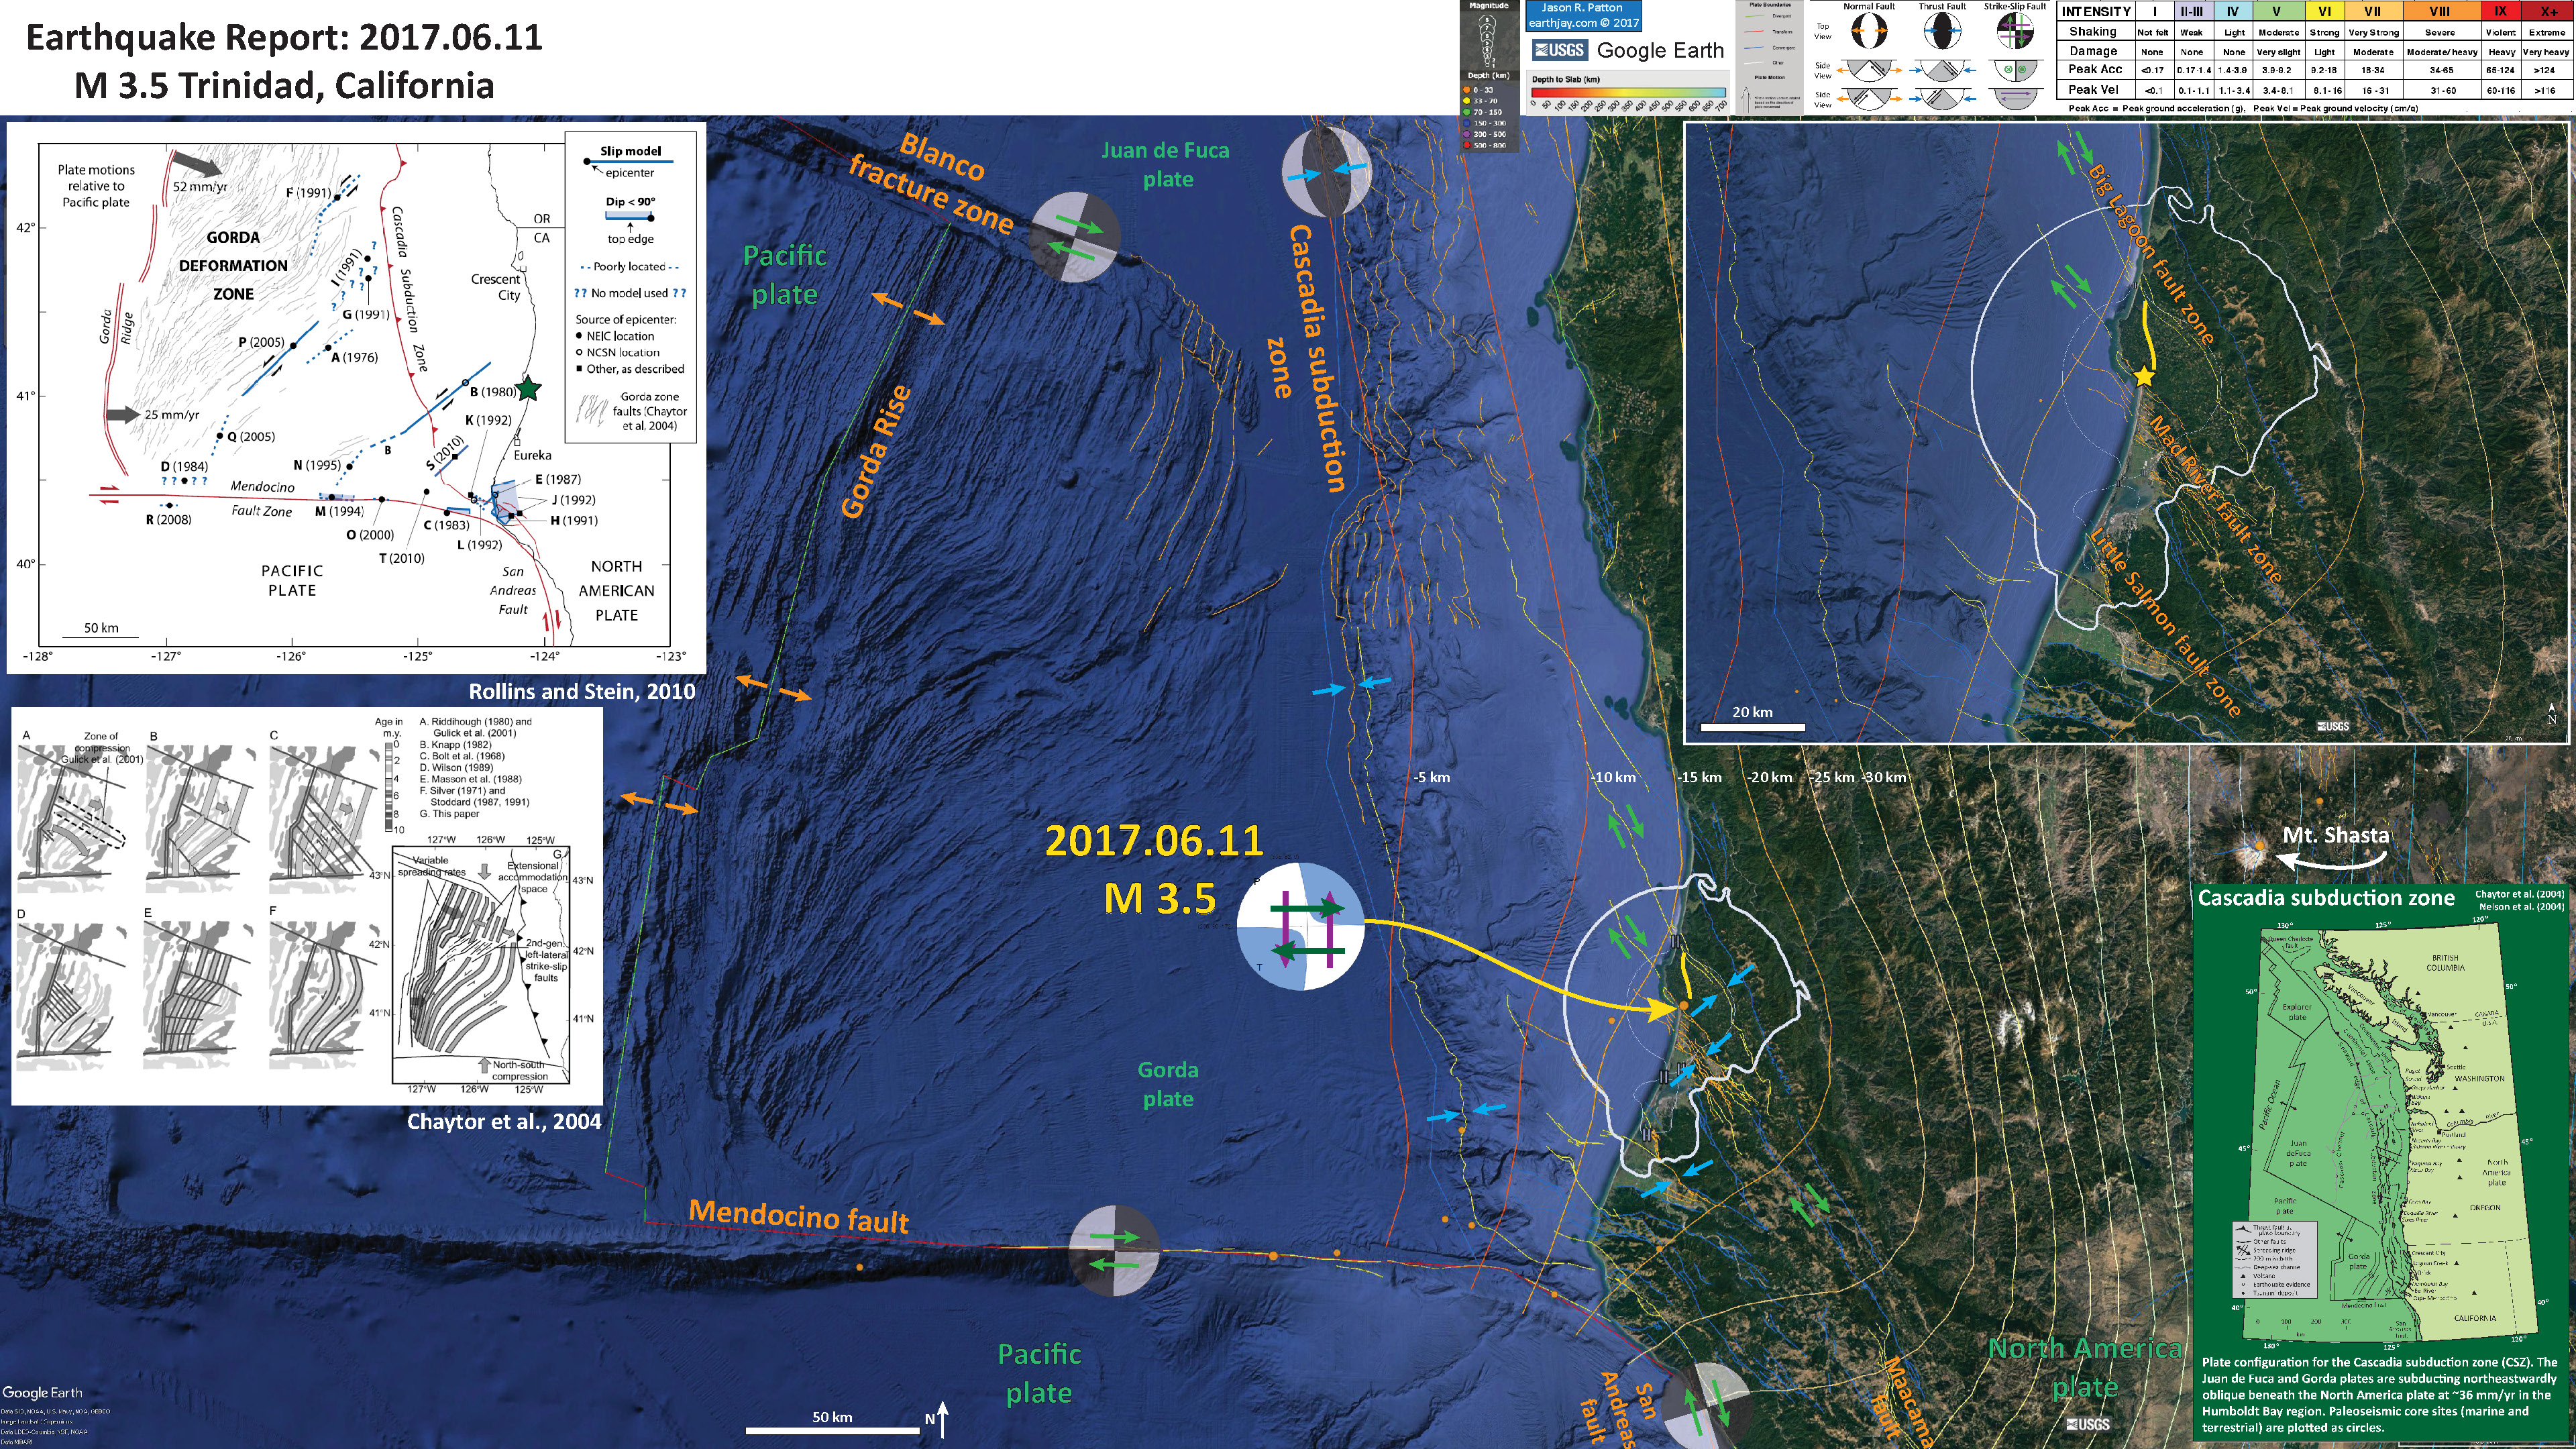
Below is my interpretive poster for this earthquake.
I plot the seismicity from the past month, with color representing depth and diameter representing magnitude (see legend). I highlighted the north-south striking Big Lagoon fault with a yellow line. I also labeled Mt. Shasta. I placed labels for the three major thrust fault systems in this region (Big Lagoon fault zone, Mad River fault zone, and the Little Salmon fault zone). The Big Lagoon and Mad River fault zones have offshore strike-slip motion. Also, the Little Salmon fault probably also has significant strike-slip motion (Pollitz et al., 2010).
- I placed a moment tensor / focal mechanism legend on the poster. There is more material from the USGS web sites about moment tensors and focal mechanisms (the beach ball symbols). Both moment tensors and focal mechanisms are solutions to seismologic data that reveal two possible interpretations for fault orientation and sense of motion. One must use other information, like the regional tectonics, to interpret which of the two possibilities is more likely.
- I also include the shaking intensity contours on the map. These use the Modified Mercalli Intensity Scale (MMI; see the legend on the map). This is based upon a computer model estimate of ground motions, different from the “Did You Feel It?” estimate of ground motions that is actually based on real observations. The MMI is a qualitative measure of shaking intensity. More on the MMI scale can be found here and here. This is based upon a computer model estimate of ground motions, different from the “Did You Feel It?” estimate of ground motions that is actually based on real observations.
- I include the slab contours plotted (McCrory et al., 2006, 2012), which are contours that represent the depth to the subduction zone fault. These are mostly based upon seismicity. The depths of the earthquakes have considerable error and do not all occur along the subduction zone faults, so these slab contours are simply the best estimate for the location of the fault. I label the shallowest contours.
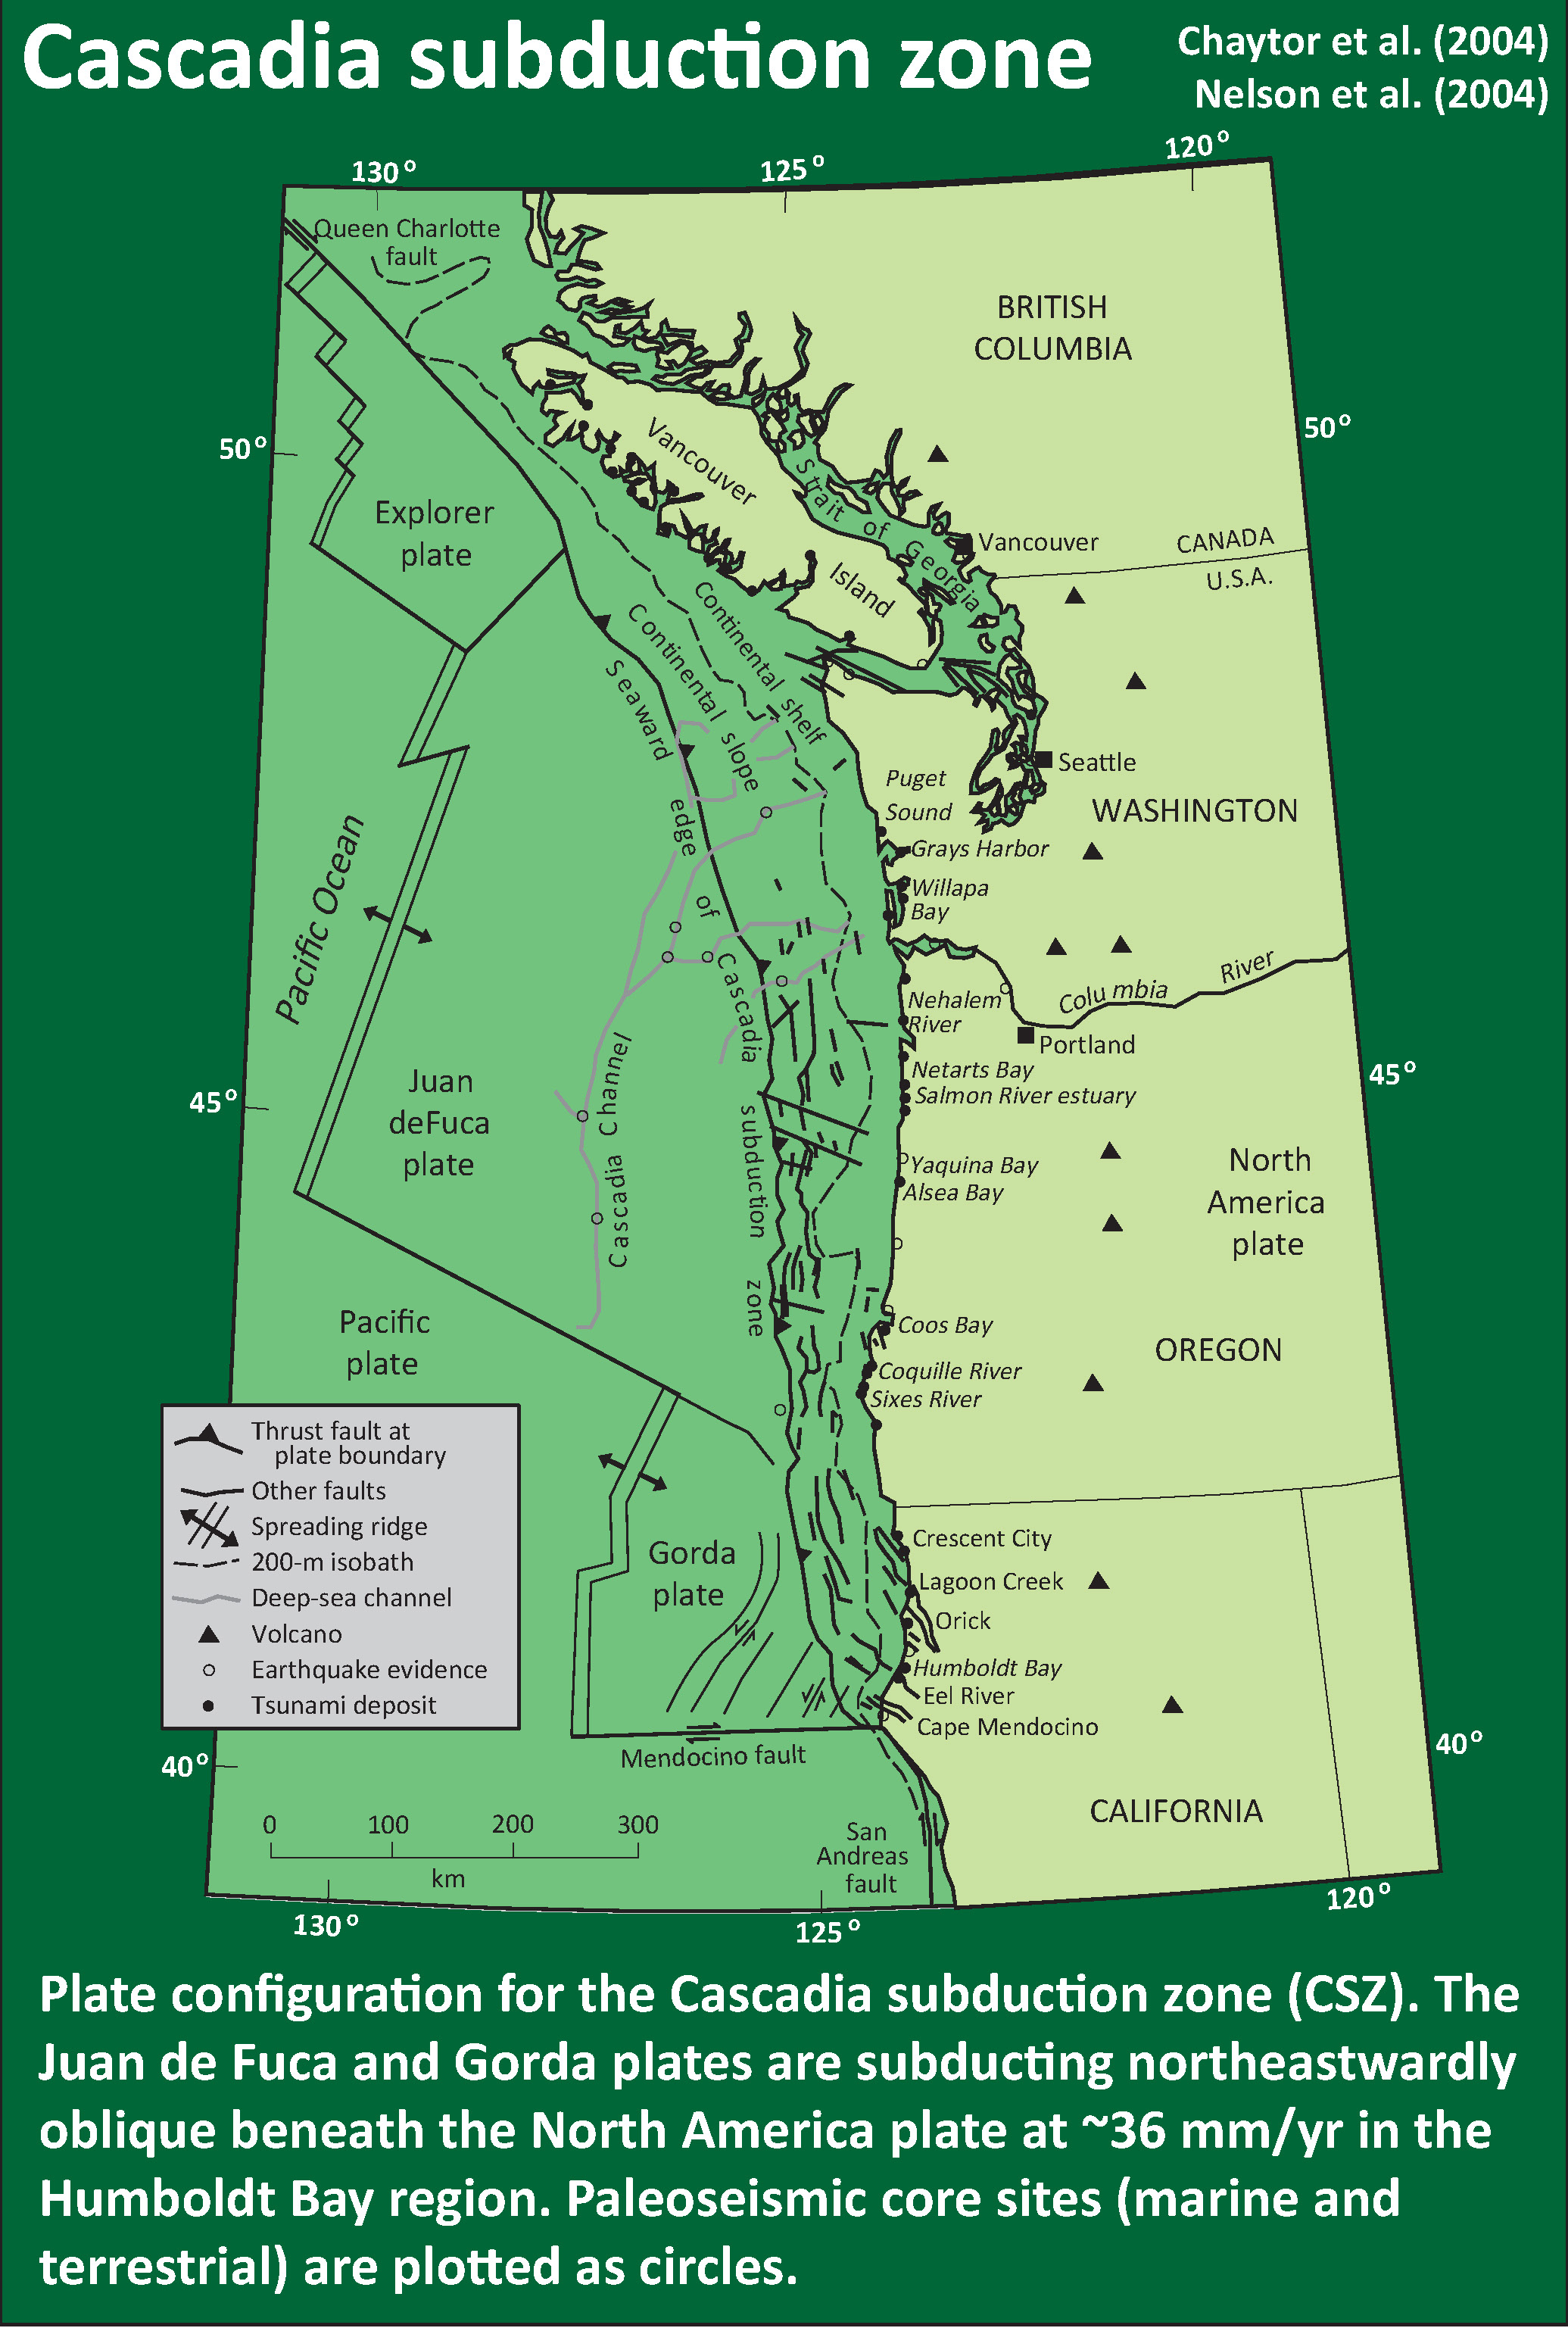
- In the lower right corner I include a map of the Cascadia subduction zone (Chaytor et al., 2004; Nelson et al., 2004, 2006). I mention more about this below.
- In the upper left corner I include a map from Rollins and Stein (2010) that show some historic earthquakes in the context of the regional tectonics. Their paper documents how these different earthquakes impose increased and decreased coulomb stress upon different faults following these earthquakes.
- Below the Rollins and Stein (2010) figure is a figure from Chaytor et al. (2004) that shows 7 different models to explain the internal deformation in the Gorda plate.
- In the upper right corner is a larger scale map showing the USGS Quaternary fault and fold database faults overlain upon Google Earth imagery (just like the main map). I also include labels like in the main map.
I include some inset figures in the poster.
Here is the interpretive poster for the 2016.07.21 Bayside Earthquake.
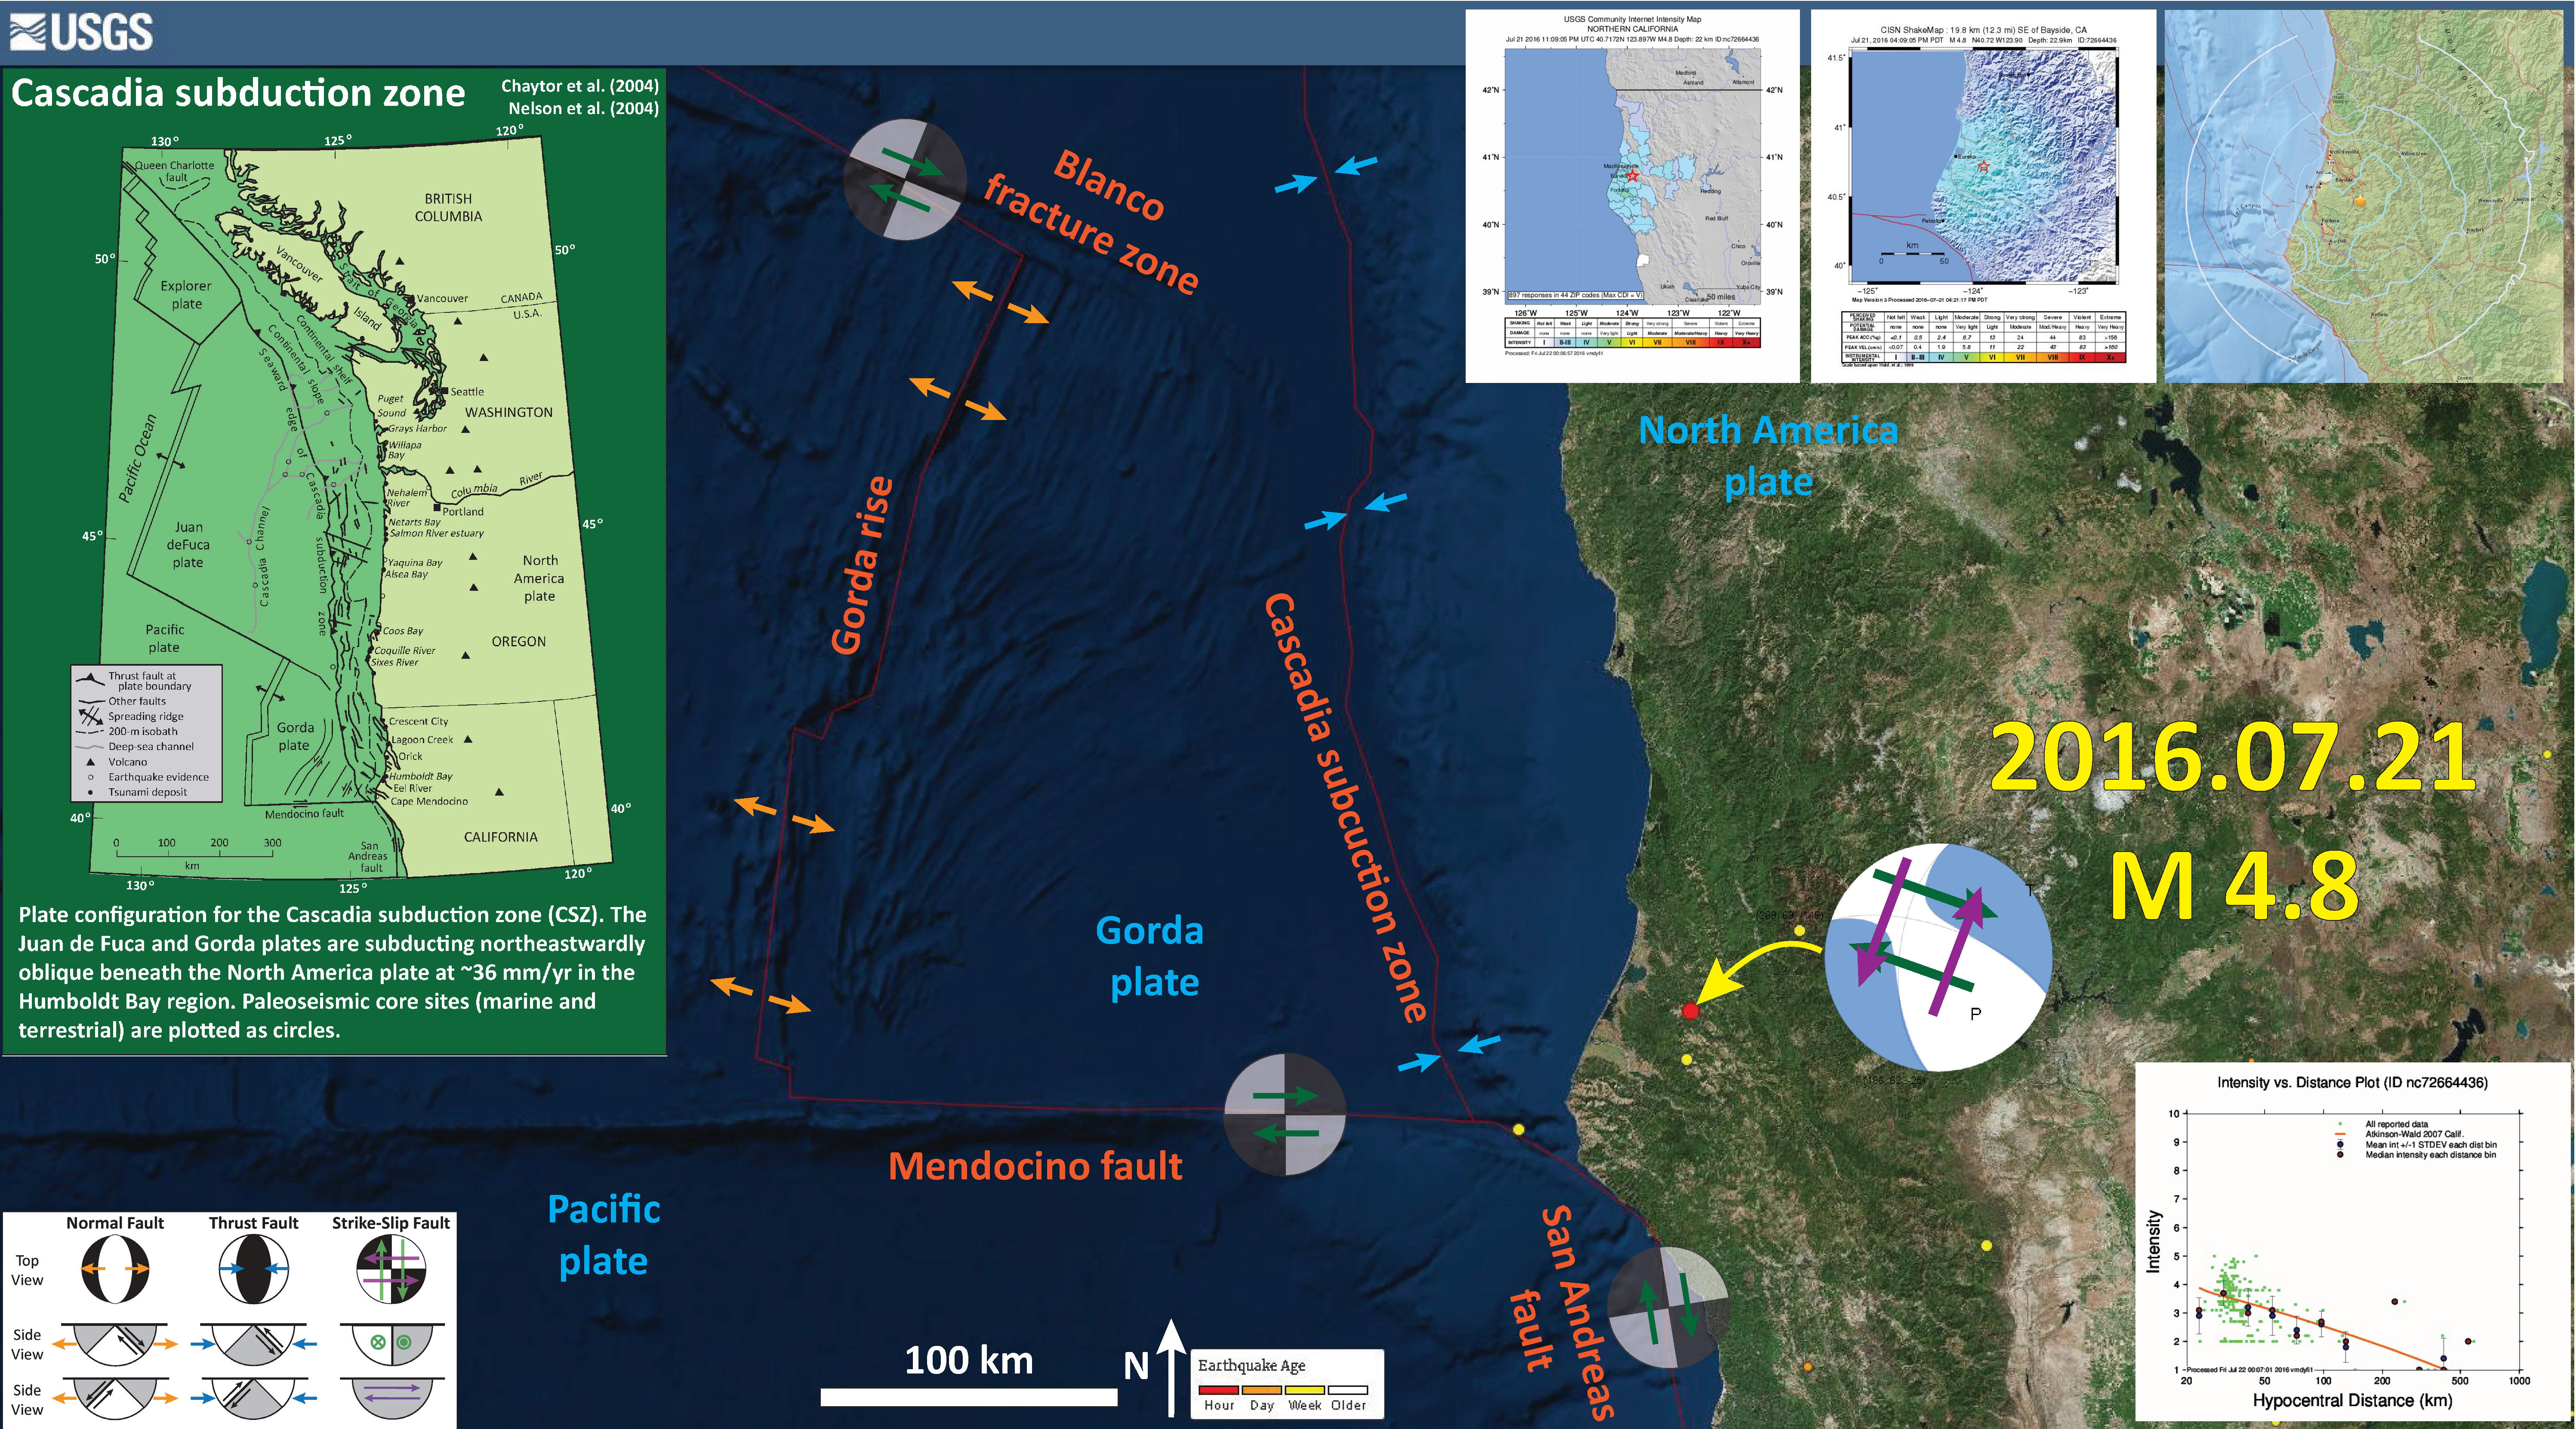
- Here is a map of the Cascadia subduction zone, modified from Nelson et al. (2004). The Juan de Fuca and Gorda plates subduct norteastwardly beneath the North America plate at rates ranging from 29- to 45-mm/yr. Sites where evidence of past earthquakes (paleoseismology) are denoted by white dots. Where there is also evidence for past CSZ tsunami, there are black dots. These paleoseismology sites are labeled (e.g. Humboldt Bay). Some submarine paleoseismology core sites are also shown as grey dots. The two main spreading ridges are not labeled, but the northern one is the Juan de Fuca ridge (where oceanic crust is formed for the Juan de Fuca plate) and the southern one is the Gorda rise (where the oceanic crust is formed for the Gorda plate).
- Here is a version of the CSZ cross section alone (Plafker, 1972). This shows two parts of the earthquake cycle: the interseismic part (between earthquakes) and the coseismic part (during earthquakes). Regions that experience uplift during the interseismic period tend to experience subsidence during the coseismic period.

- Here is a figure from Chaytor et al. (2004) that shows how they interpret the different faults based upon bathymetric data. Note the north-south striking faults in the northern part of the Gorda plate. However, they are normal faults, not strike slip. So, this makes it more difficult (again) to interpret today’s M 3.5 earthquake.
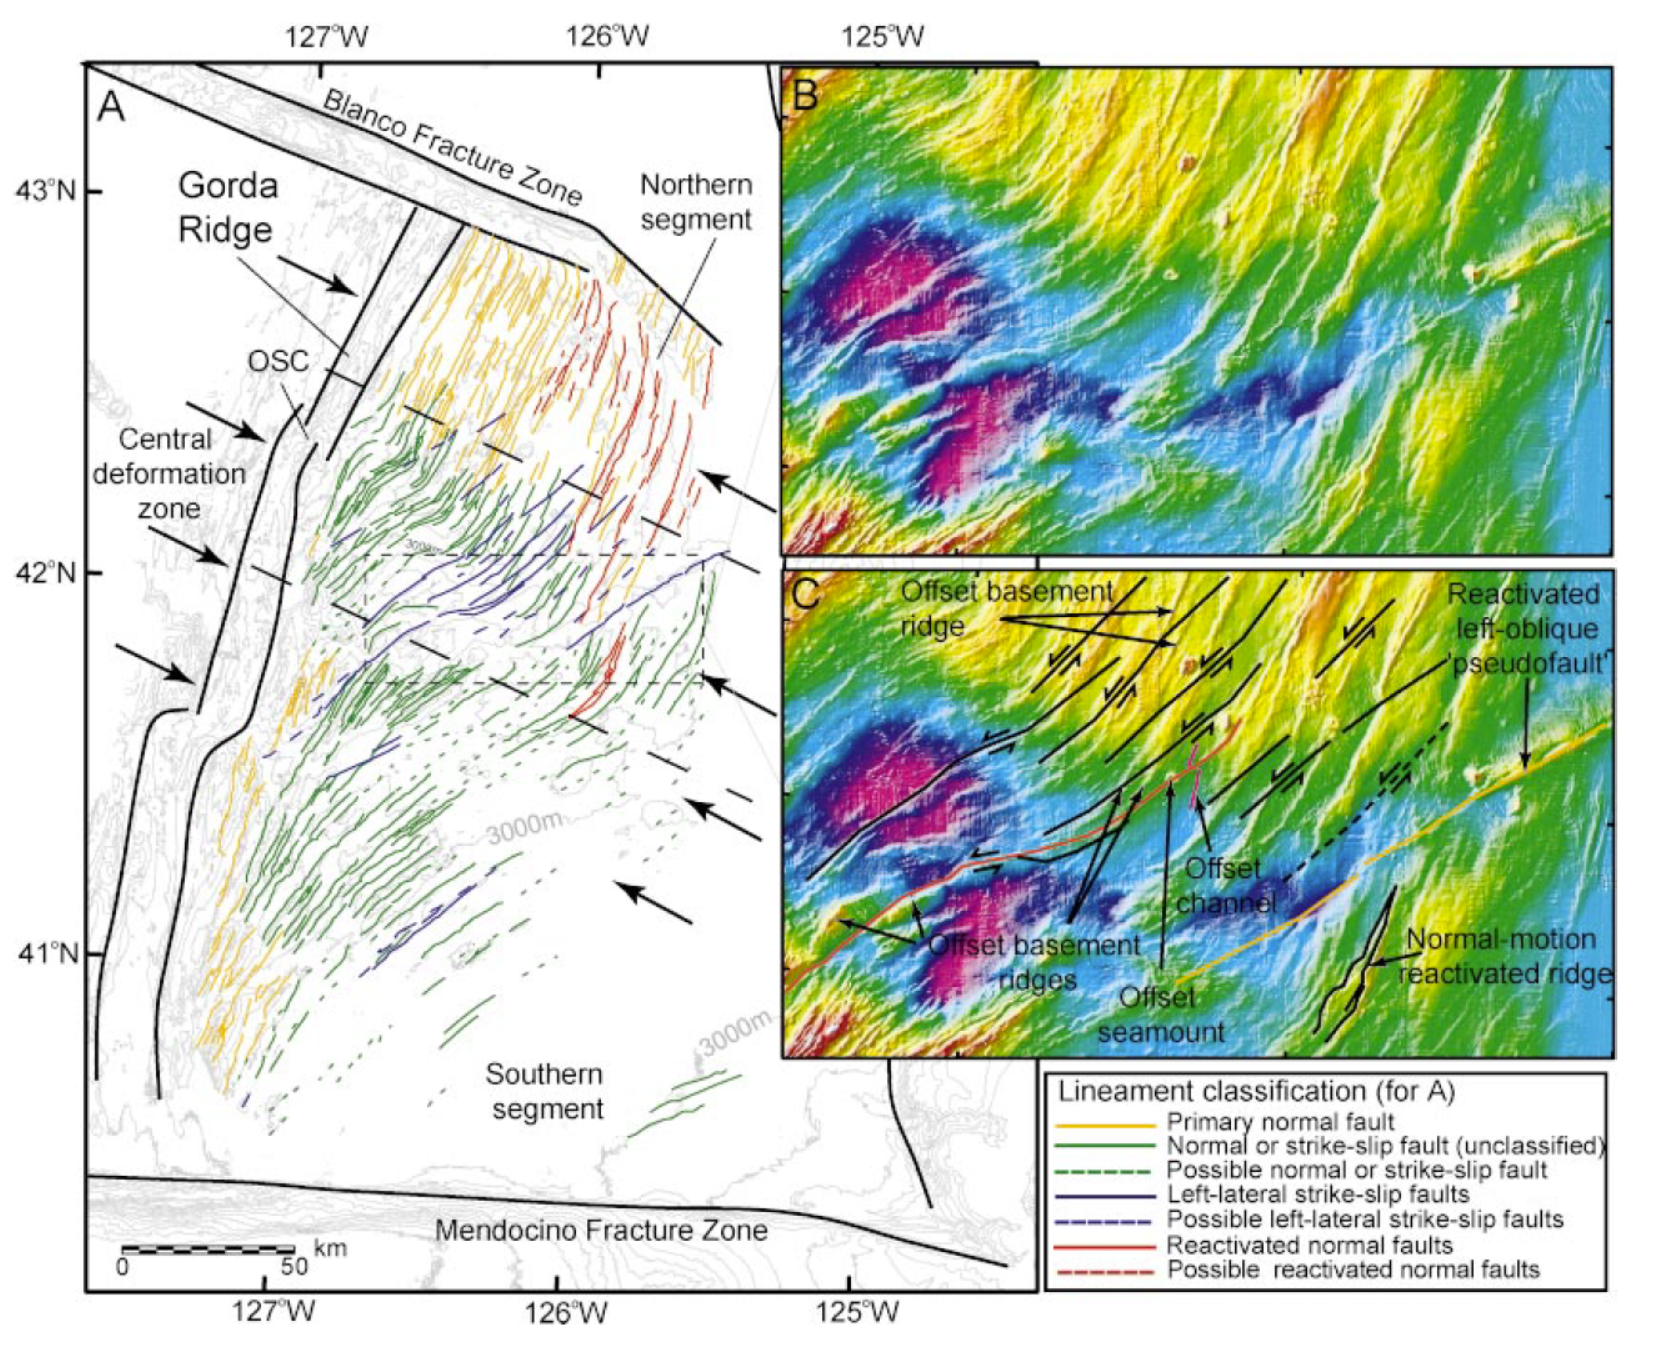
A: Mapped faults and fault-related ridges within Gorda plate based on basement structure and surface morphology, overlain on bathymetric contours (gray lines—250 m interval). Approximate boundaries of three structural segments are also shown. Black arrows indicated approximate location of possible northwest- trending large-scale folds. B, C:
Uninterpreted and interpreted enlargements of center of plate showing location of interpreted second-generation strike-slip faults and features that they appear to offset. OSC—overlapping spreading center.
- Here is another figure from Chaytor et al. (2004) that shows the different models for the Gorda plate faults.
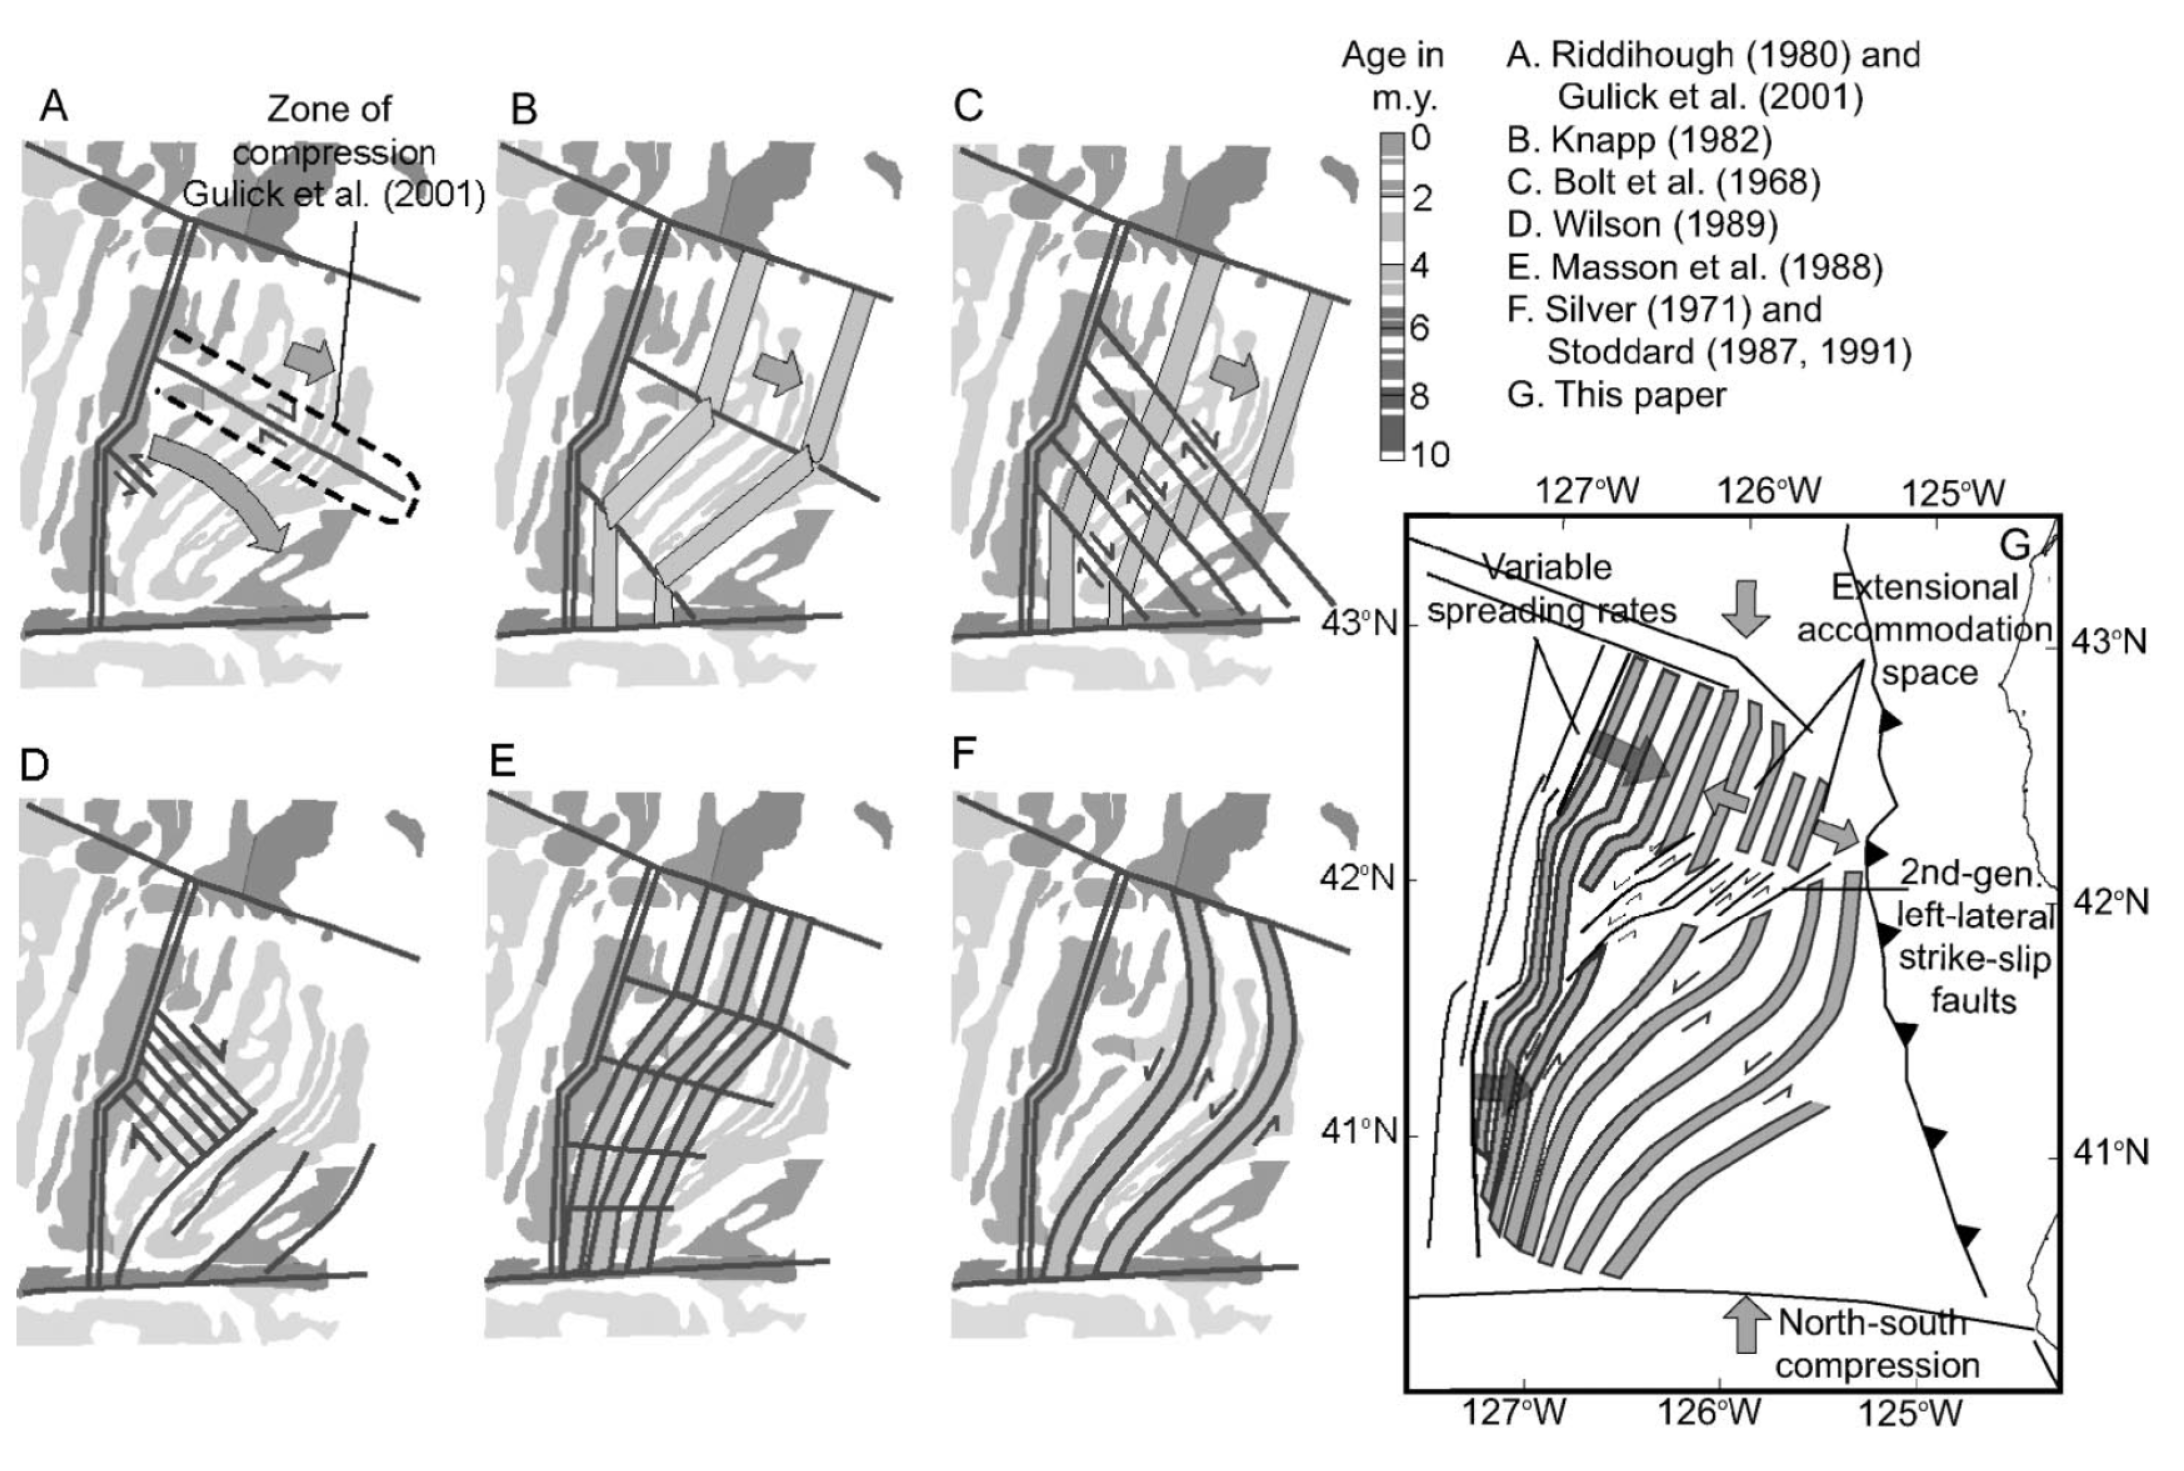
Models of brittle deformation for Gorda plate overlain on magnetic anomalies modified from Raff and Mason (1961). Models A–F were proposed prior to collection and analysis of full-plate multibeam data. Deformation model of Gulick et al. (2001) is included in model A. Model G represents modification of Stoddard’s (1987) flexural-slip model proposed in this paper.
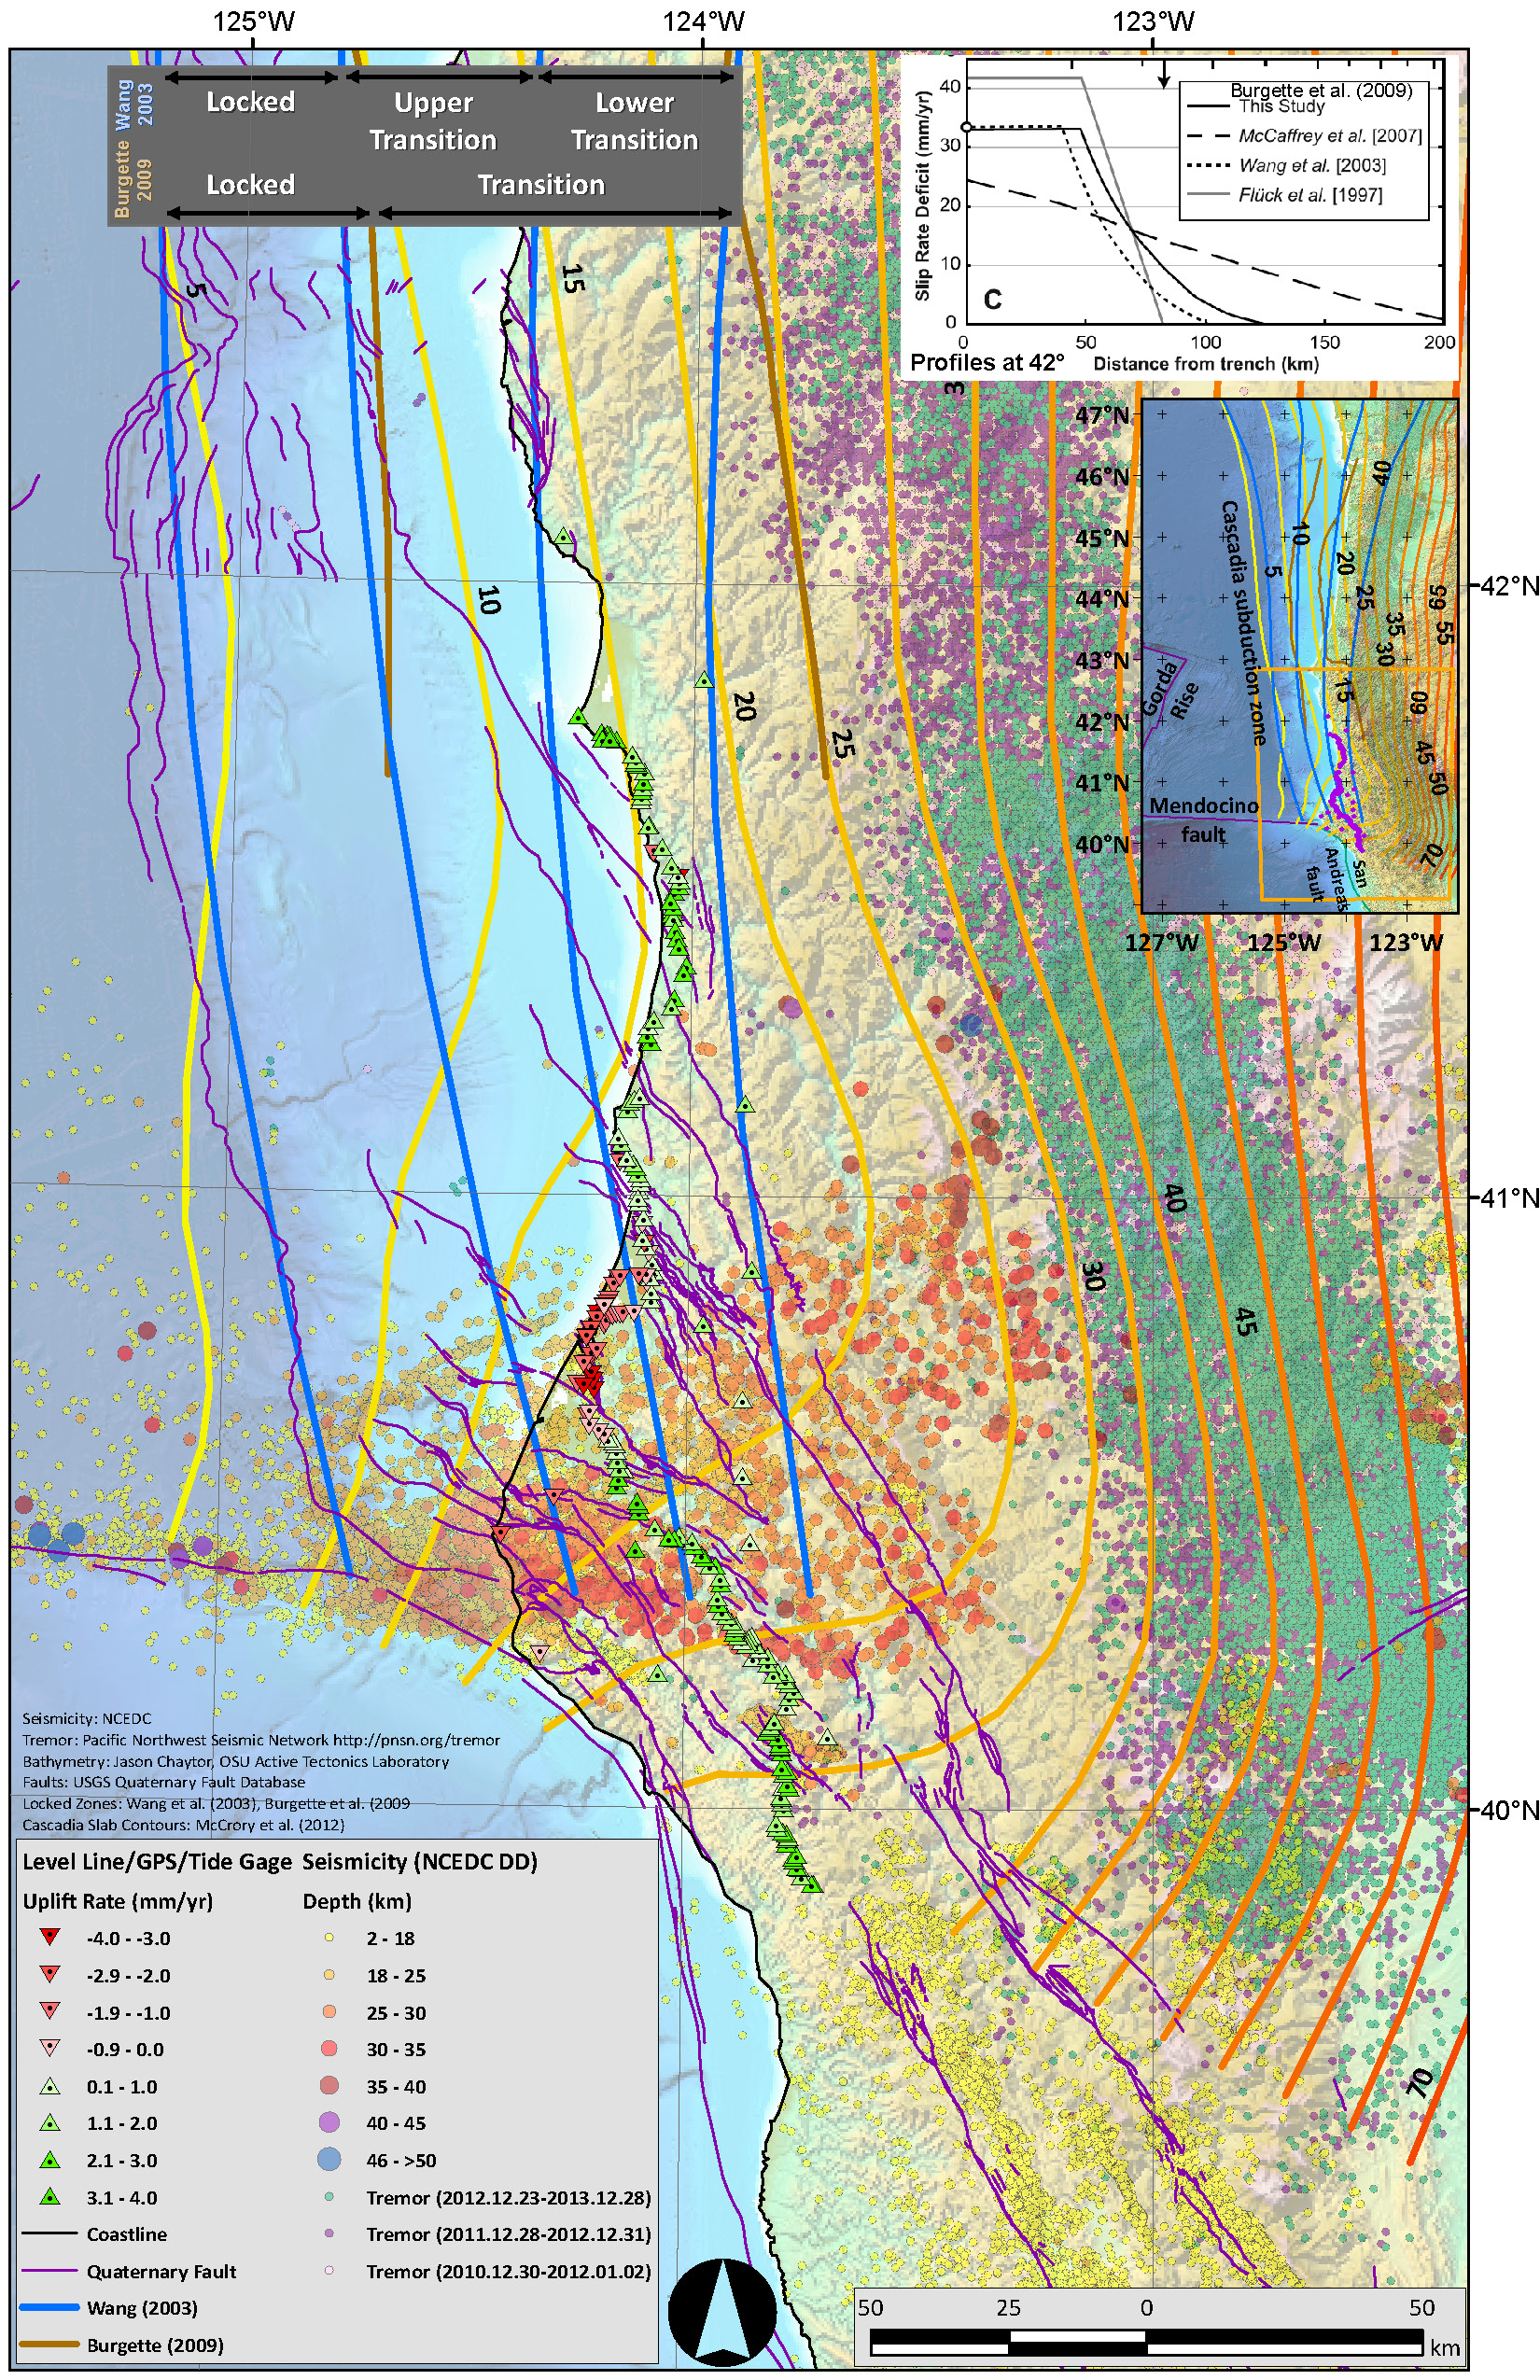
- Here is a map showing a number of data sets. Seismicity is plotted versus depth (NCEDC). Tremor is plotted (Pacific Northwest Seismic Network). Vertical Deformation rates are plotted (unpublished). Slab depth contours (km) are plotted (McCrory et al., 2006). Fault locking zones are plotted (Wang et al., 2003; Burgette et al., 2009). Bob McPherson (Humboldt State University, Department of Geology) is currently working on a research paper where he will discuss how the seismicity reveals the location of the seismogenically locked fault zone.
- Here is a great illustration that shows how forearc sliver faults form due to oblique convergence at a subduction zone (Lange et al., 2008). Strain is partitioned into fault normal faults (the subduction zone) and fault parallel faults (the forearc sliver faults, which are strike-slip). This figure is for southern Chile, but is applicable globally.

Proposed tectonic model for southern Chile. Partitioning of the oblique convergence vector between the Nazca plate and South American plate results in a dextral strike-slip fault zone in the magmatic arc and a northward moving forearc sliver. Modified after Lavenu and Cembrano (1999).
- As mentioned above, Pollitz et al. (2010) modeled interseismic deformation along faults in the Pacific northwest and fit this deformation to GPS geodetic data. The authors evaluated how San Andreas type fault motion penetrates into the southern Cascadia subduction zone. Below are two figures from their paper that helps us understand their interpretations. The upper figure shows the GPS velocity field and the strain rate field for this region of northern California. The lower panel shows an estimate of right-lateral strike-slip rates for the Little Salmon fault.

Left-hand panel: velocity field obtained after correcting the observed GPS velocity field (Fig. 3) for the effect of deformation associated with all GDZ, Juan de Fuca, and Explorer plate boundaries. The sources that contribute to the correction are faults #30–46 and 81 of Table 1. Right-hand panel: strain rate fields corresponding to the plotted velocity fields, represented by the amplitudes and directions of the principal strain rate axes (thick and thin line segments denoting a principal contractile or tensile strain rate axis, respectively) and rotation rate (indicated by color shading). It is derived from the velocity field using the velocity-gradient determination method described in appendix A of Pollitz & Vergnolle (2006).
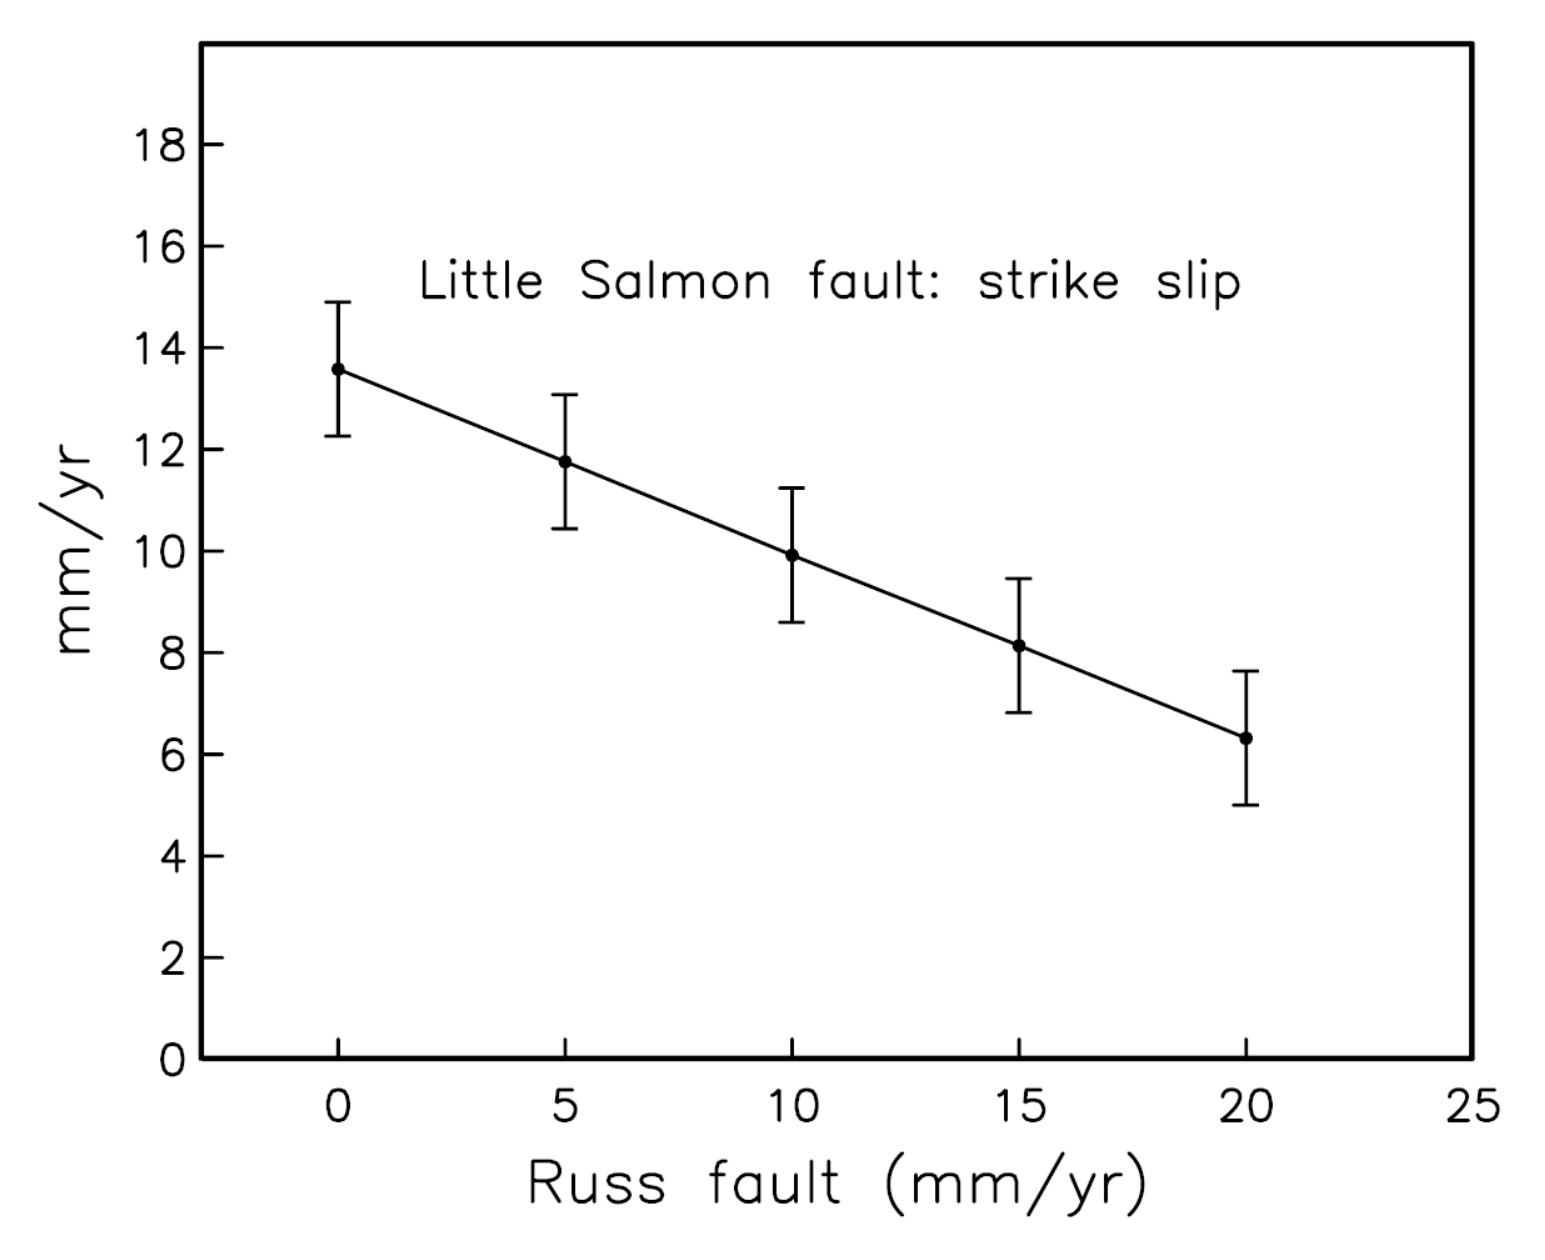
Estimated right-lateral strike-slip rate on the Little Salmon fault as a function of strike-slip rate on the Russ fault. Reverse slip rate on the Mad River fault is held fixed at 10 mmyr−1. Slip rates are plotted with ±1 SD.
- 1700.09.26 M 9.0 Cascadia’s 315th Anniversary 2015.01.26
- 1700.09.26 M 9.0 Cascadia’s 316th Anniversary 2016.01.26
- 1992.04.25 M 7.1 Cape Mendocino 25 year remembrance
- 1992.04.25 M 7.1 Cape Mendocino 25 Year Remembrance Event Page
- Earthquake Information about the CSZ 2015.10.08
- 2016.09.25 M 5.0 Gorda plate
- 2016.09.25 M 5.0 Gorda plate
- 2016.07.21 M 4.7 Gorda plate p-1
- 2016.07.21 M 4.7 Gorda plate p-2
- 2016.01.30 M 5.0 Gorda plate
- 2015.12.29 M 4.9 Gorda plate
- 2015.11.18 M 3.2 Gorda plate
- 2014.03.13 M 5.2 Gorda Rise
- 2014.03.09 M 6.8 Gorda plate p-1
- 2014.03.23 M 6.8 Gorda plate p-2
- 2015.06.01 M 5.8 Blanco fracture zone p-1
- 2015.06.01 M 5.8 Blanco fracture zone p-2 (animations)
- 2016.12.08 M 6.5 Mendocino fault, CA
- 2016.12.08 M 6.5 Mendocino fault, CA Update #1
- 2016.12.05 M 4.3 Petrolia CA
- 2016.10.27 M 4.1 Mendocino fault
- 2016.09.03 M 5.6 Mendocino
- 2016.01.02 M 4.5 Mendocino fault
- 2015.11.01 M 4.3 Mendocino fault
- 2015.01.28 M 5.7 Mendocino fault
- 2017.03.06 M 4.0 Cape Mendocino
- 2016.11.02 M 3.6 Oregon
- 2016.01.07 M 4.2 NAP(?)
- 2015.10.29 M 3.4 Bayside
- 2017.01.07 M 5.7 Explorer plate
- 2016.03.19 M 5.2 Explorer plate
Cascadia subduction zone
General Overview
Earthquake Reports
Gorda plate
Blanco fracture zone
Mendocino fault
Mendocino triple junction
North America plate
Explorer plate
References
- Atwater, B.F., Musumi-Rokkaku, S., Satake, K., Tsuju, Y., Eueda, K., and Yamaguchi, D.K., 2005. The Orphan Tsunami of 1700—Japanese Clues to a Parent Earthquake in North America, USGS Professional Paper 1707, USGS, Reston, VA, 144 pp.
- Burgette, R. et al., 2009. Interseismic uplift rates for western Oregon and along-strike variation in locking on the Cascadia subduction zone in Journal of Geophysical Research, v. 114, B01408, doi:10.1029/2008JB005679
- Chaytor, J.D., Goldfinger, C., Dziak, R.P., and Fox, C.G., 2004. Active deformation of the Gorda plate: Constraining deformation models with new geophysical data: Geology v. 32, p. 353-356
- Lange, D., Cembrano, J., Rietbrock, A., Haberland, C., Dahm, T., and Bataille, K., 2008. First seismic record for intra-arc strike-slip tectonics along the Liquiñe-Ofqui fault zone at the obliquely convergent plate margin of the southern Andes in Tectonophysics, v. 455, p. 14-24
- McCrory, P. A., Blair, J. L., Oppenheimer, D. H., and Walter, S. R., 2006. Depth to the Juan de Fuca slab beneath the Cascadia subduction margin; a 3-D model for sorting earthquakes U. S. Geological Survey
- McCrory, P. A., Blair, J. L., Waldhauser, F., and Oppenheimer, D. H., 2012. Juan de Fuca slab geometry and its relation to Wadati-Benioff zone seismicity in JGR, v. 117, doi:10.1029/2012JB009407
- Nelson, A.R., Asquith, A.C., and Grant, W.C., 2004. Great Earthquakes and Tsunamis of the Past 2000 Years at the Salmon River Estuary, Central Oregon Coast, USA: Bulletin of the Seismological Society of America, Vol. 94, No. 4, pp. 1276–1292
- Nelson, A.R., Kelsey, H.M., and Witter, R.C., 2006. Great earthquakes of variable magnitude at the Cascadia subduction zone: Quaternary Research, doi:10.1016/j.yqres.2006.02.009, p. 354-365.
- Plafker, G., 1972. Alaskan earthquake of 1964 and Chilean earthquake of 1960: Implications for arc tectonics in Journal of Geophysical Research, v. 77, p. 901-925.
- Pollitz, F.F., McCrory, P., Wilson, D., Svarc, J., Puskas, C., and Smith, R.B., 2010. Viscoelastic-cycle model of interseismic deformation in the northwestern United States in GJI, v. 181, p. 665-696, doi: 10.1111/j.1365-246X.2010.04546.x
- Rollins, J.C., Stein, R.S., 2010. Coulomb Stress Interactions Among M ≥ 5.9 Earthquakes in the Gorda Deformation Zone and on the Mendocino Fault Zone, Cascadia Subduction Zone, and Northern San Andreas Fault. Journal of Geophysical Research 115, 19 pp.
- USGS Quaternary Fault Database: http://earthquake.usgs.gov/hazards/qfaults/
- Wang, K., Wells, R., Mazzotti, S., Hyndman, R. D., and Sagiya, T., 2003. A revised dislocation model of interseismic deformation of the Cascadia subduction zone Journal of Geophysical Research, B, Solid Earth and Planets v. 108, no. 1.
Thanks for the detailed information.