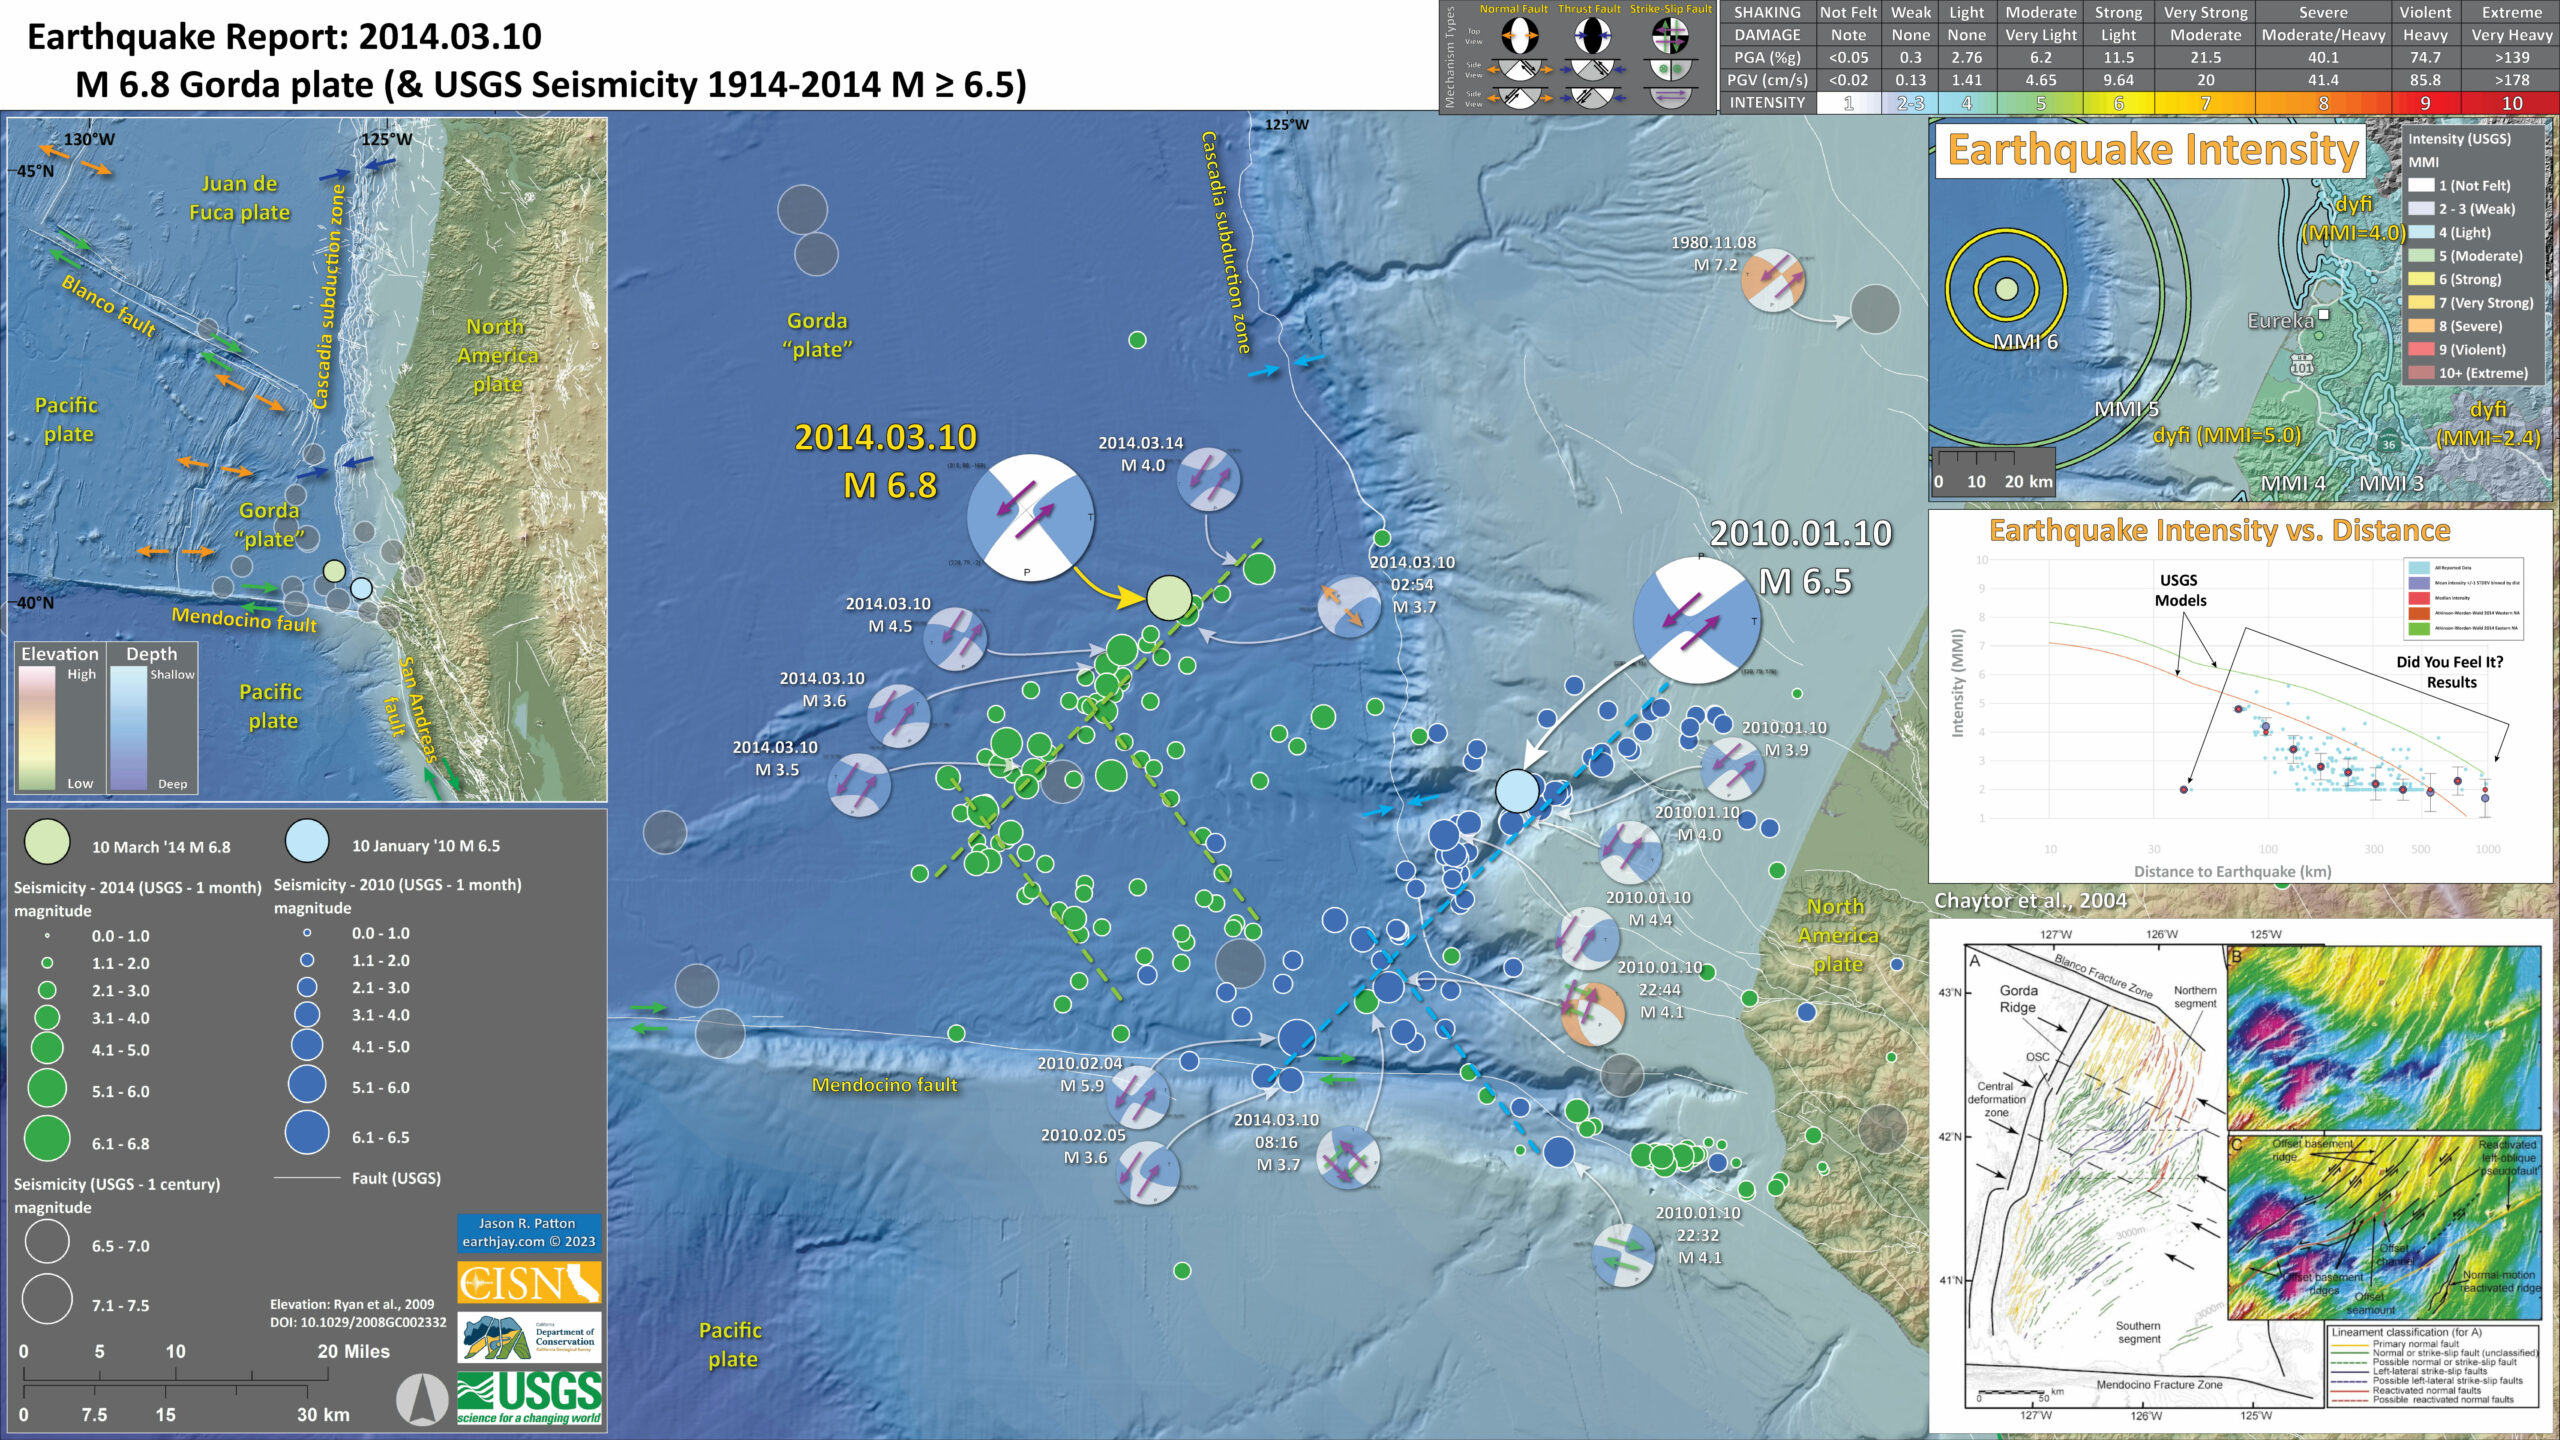
I have put together a couple animations of the earthquake epicenters preceding, during, and following the recent earthquake swarm in the Gorda plate. Here is the first page I put together for this M 6.8 earthquake. Here are some maps I put together to explain the epicenter pattern and how it might relate to faults in the Gorda plate.
There was also a M 5.2 extensional earthquake in the Gorda rise (where the Gorda plate is created, it is like the Mid-Atlantic Ridge). Looking at the animations below, one may notice that there were a couple earthquakes in the region of this M 5.2 prior to the 2014 March Gorda Earthquake Swarm. While it may be considered that the Gorda earthquakes triggered the M 5.2, it is evident that the fault that slipped during the M 5.2 was probably getting ready to rupture. This is true for most triggered earthquakes. The change in stress on faults due to loading from other earthquakes is very very small compared to the amount of stress necessarily applied to a fault to cause rupture. In other words, a fault needs to be close to earthquake failure in order to be triggered by another earthquake. Also, that these triggered earthquakes are limited in time because the change in fault stress is short lived. The 2010 Rollins and Stein paper (downloadable here) discusses some coulomb stress modeling they did following the 2010 M 6.5 earthquake in the Gorda plate. Here is a paper that discusses how a Cascadia subduction zone earthquake could trigger an earthquake on the San Andreas fault.
I used the USGS website to download the epicenters in this region. One of the options is to export the epicenters as a google kml file. These files display in google earth.
Click on the maps to open/download the video in a new window.
Here is an animation of the region offshore northern California for the time range 2014/1/16 through 2014/3/23. (~23 MB avi)

Here is an animation zoomed into offshore of Humboldt County. The USGS fault and fold database show the faults. There are also plate boundary faults plotted (they are less certain and less precise). (~28 MB avi)

Here is an animation of the earthquake swarm itself. Note that there are some epicenters that strike at the same instance as the mainshock. These are probably all ruptures on the same fault. There are many other aftershocks that are not on the same fault, but synthetic (trend in a parallel or subparallel direction as the main fault) or antithetic faults (trend in a conjugate direction). In some cases there are also aftershocks that occur at the same instance and apparently align along another fault (they line up). For faults close to the mainshock fault, these aftershocks may actually be on the mainshock fault but are plotted incorrectly due to the assumptions made in the location inversions (i.e. velocity models). People like Mark Williams or Anne Trehu (among others) may want to do some double differencing to these data to get better locations for these earthquake hypocenters.

Here I have slowed down the animation to better visualize the temporal relations between bursts in seismic energy.
Finally, here is an animation of the western USA that reveals something about the random nature of background seismicity. There are a few locations that show patterns that suggest faults ruptured. The recent Gorda plate earthquake swarm is one example. There were also a series of epicenters that plot in a northeast strike/trend just west of the mouth of the Mattole River. There also appears to be a swarm of earthquakes in the Yellowstone region, the Geysers (CA), and Salinas, CA.

9 thoughts on “Gorda plate earthquake animations”