It was a busy week (usual, right?). The previous week I was working on getting a house remodel done so someone could move in (they have been sleeping on couches for 6 months, so want to get them in asap). This week I spent lots of time putting final touches on a USGS National Earthquake Hazards Reduction Program external grant proposal together, proposing to conduct a paleoseismic investigation for a fault I discovered in late 2018 (see AGU poster here). So, I am catching up on my earthquake reporting for this earthquake offshore northern California.
On 18 May 2020 there was a magnitude M 5.5 extensional earthquake located near the Gorda Rise, an oceanic spreading ridge where oceanic crust is formed to create (love using the word create in science) the Gorda and Pacific plates.
https://earthquake.usgs.gov/earthquakes/eventpage/us70009jgy/executive
There are three types of plate boundaries and three types of earthquake faults (this is not a coincidence because plate boundaries are generally in the form of earthquake faults).
- Some plates move side-by-side to form transform plate boundaries (in the form of strike-slip faults, like the San Andreas fault).
- Some plates move towards each other to form convergent plate boundaries (in the form of subduction zone megathrust faults (like the Cascadia subduction zone), or collision zones(like the fault system that forms the uplift that created the Himalayas).
- Some plates move away from each other to form divergent plate boundaries (in the form of oceanic spreading ridges, or spreading centers, like the Mid Atlantic Ridge or the Gorda Rise; in these locations “normal” faults are formed).
More about different types of faults can be found here.
The northeast Pacific (aka Pacific Northwest as viewed by land lubbers) is dominated by the plate boundary formed between the Pacific (PP) and North America plates (NAP). In much of California, this plate boundary is realized in the form of the San Andreas fault (SAF), where the PP moves north relative to the NAP. Both plates are moving to the northwest, but the PP is moving faster, so it appears that the NAP is moving south. This southerly motion is relative not absolute. I present a background of the SAF in my review of the 1906 San Francisco earthquake here.
Near Cape Mendocino, in Humboldt County, California, the plate boundary gets more complicated and involves all three types of fault systems.
It appears that the San Andreas fault terminates in the King Range, causing some of the highest tectonic uplift rates in North America. There are sibling faults to the east of the San Andreas that continue further north (e.g. the Maacama fault turns into the Garberville fault and the Bartlett Springs fault (eventually) turns into the Bald Mountain/Big Lagoon fault. So, it looks like these San Andreas related faults extend offshore, possibly to at least the Oregon border. Geodetic evidence supports this, as first published by Williams et al. (2002).
The San Andreas ends near the beginning of the Cascadia subduction zone (CSZ), formed where the Gorda/Juan de Fuca/Explorer plates dive eastwards beneath the North America plate. More about the CSZ can be found here, where I describe the basis of our knowledge about prehistoric earthquakes and tsunami along the CSZ.
Far offshore of the CSZ are oceanic spreading ridges, the Gorda Rise and the Juan de Fuca Ridge. Because the plates are moving away from each other here (we think this is due to processes called slab pull and ridge push; slab pull describes the process that in the subduction zone, the downgoing oceanic plate is going deep into the mantle and pulling down the crust; ridge push is not really pushing from the ridge, but that there is additional mass added to the crust and this pushes down and then out, pushing the plate away from the ridge, towards the subduction zone). As these plates diverge, there is lowered pressure beneath this divergent zone. These lowered pressures cause the mantle to melt, leading to eruptions of mafic lava. When the lava cools, it becomes new oceanic crust.
Connecting the CSZ with these spreading ridges, and spreading ridges with other spreading ridges, are transform plate boundaries in the form of strike-slip faults. For example, the Mendocino fault and the Blanco fault. Here is a report that includes background information about the Mendocino fault. Here is a report with some background information about the Blamco fault.
The 18 May 2020 M 5.5 earthquake happened near the Gorda Rise and was an extensional earthquake. As the Gorda plate moves away from the spreading ridge, the normal faults formed at the ridge don’t disappear. The Gorda plate is a strange plate as it gets internally deformed, so as the plate moves towards the subduction zone, these normal faults get reactivated as strike-slip faults. These strike-slip faults have been responsible for some of the most damaging earthquakes to impact coastal northern California. More about these left-lateral strike-slip Gorda plate earthquakes can be found in a report here.
The M 5.5 earthquake happened along one of these normal faults, before that fault turns into a strike-slip fault. There is a good history of earthquakes just like this one. Here is a report for a similar event further to the north, also slightly east of the Gorda Rise.
One of the most common questions people have is, “does this earthquake change our chances for a CSZ earthquake?” The answer is no. The reason is because the stress changes from earthquakes extends for a limited distance from those earthquakes. I spend more time discussing this limitation for the Blanco fault here. Basically, this M 5.5 event was too small and too far away from the CSZ to change the chance that the CSZ will slip. Today is not different from a couple weeks ago: we always need to be ready for an earthquake when we live in earthquake country.
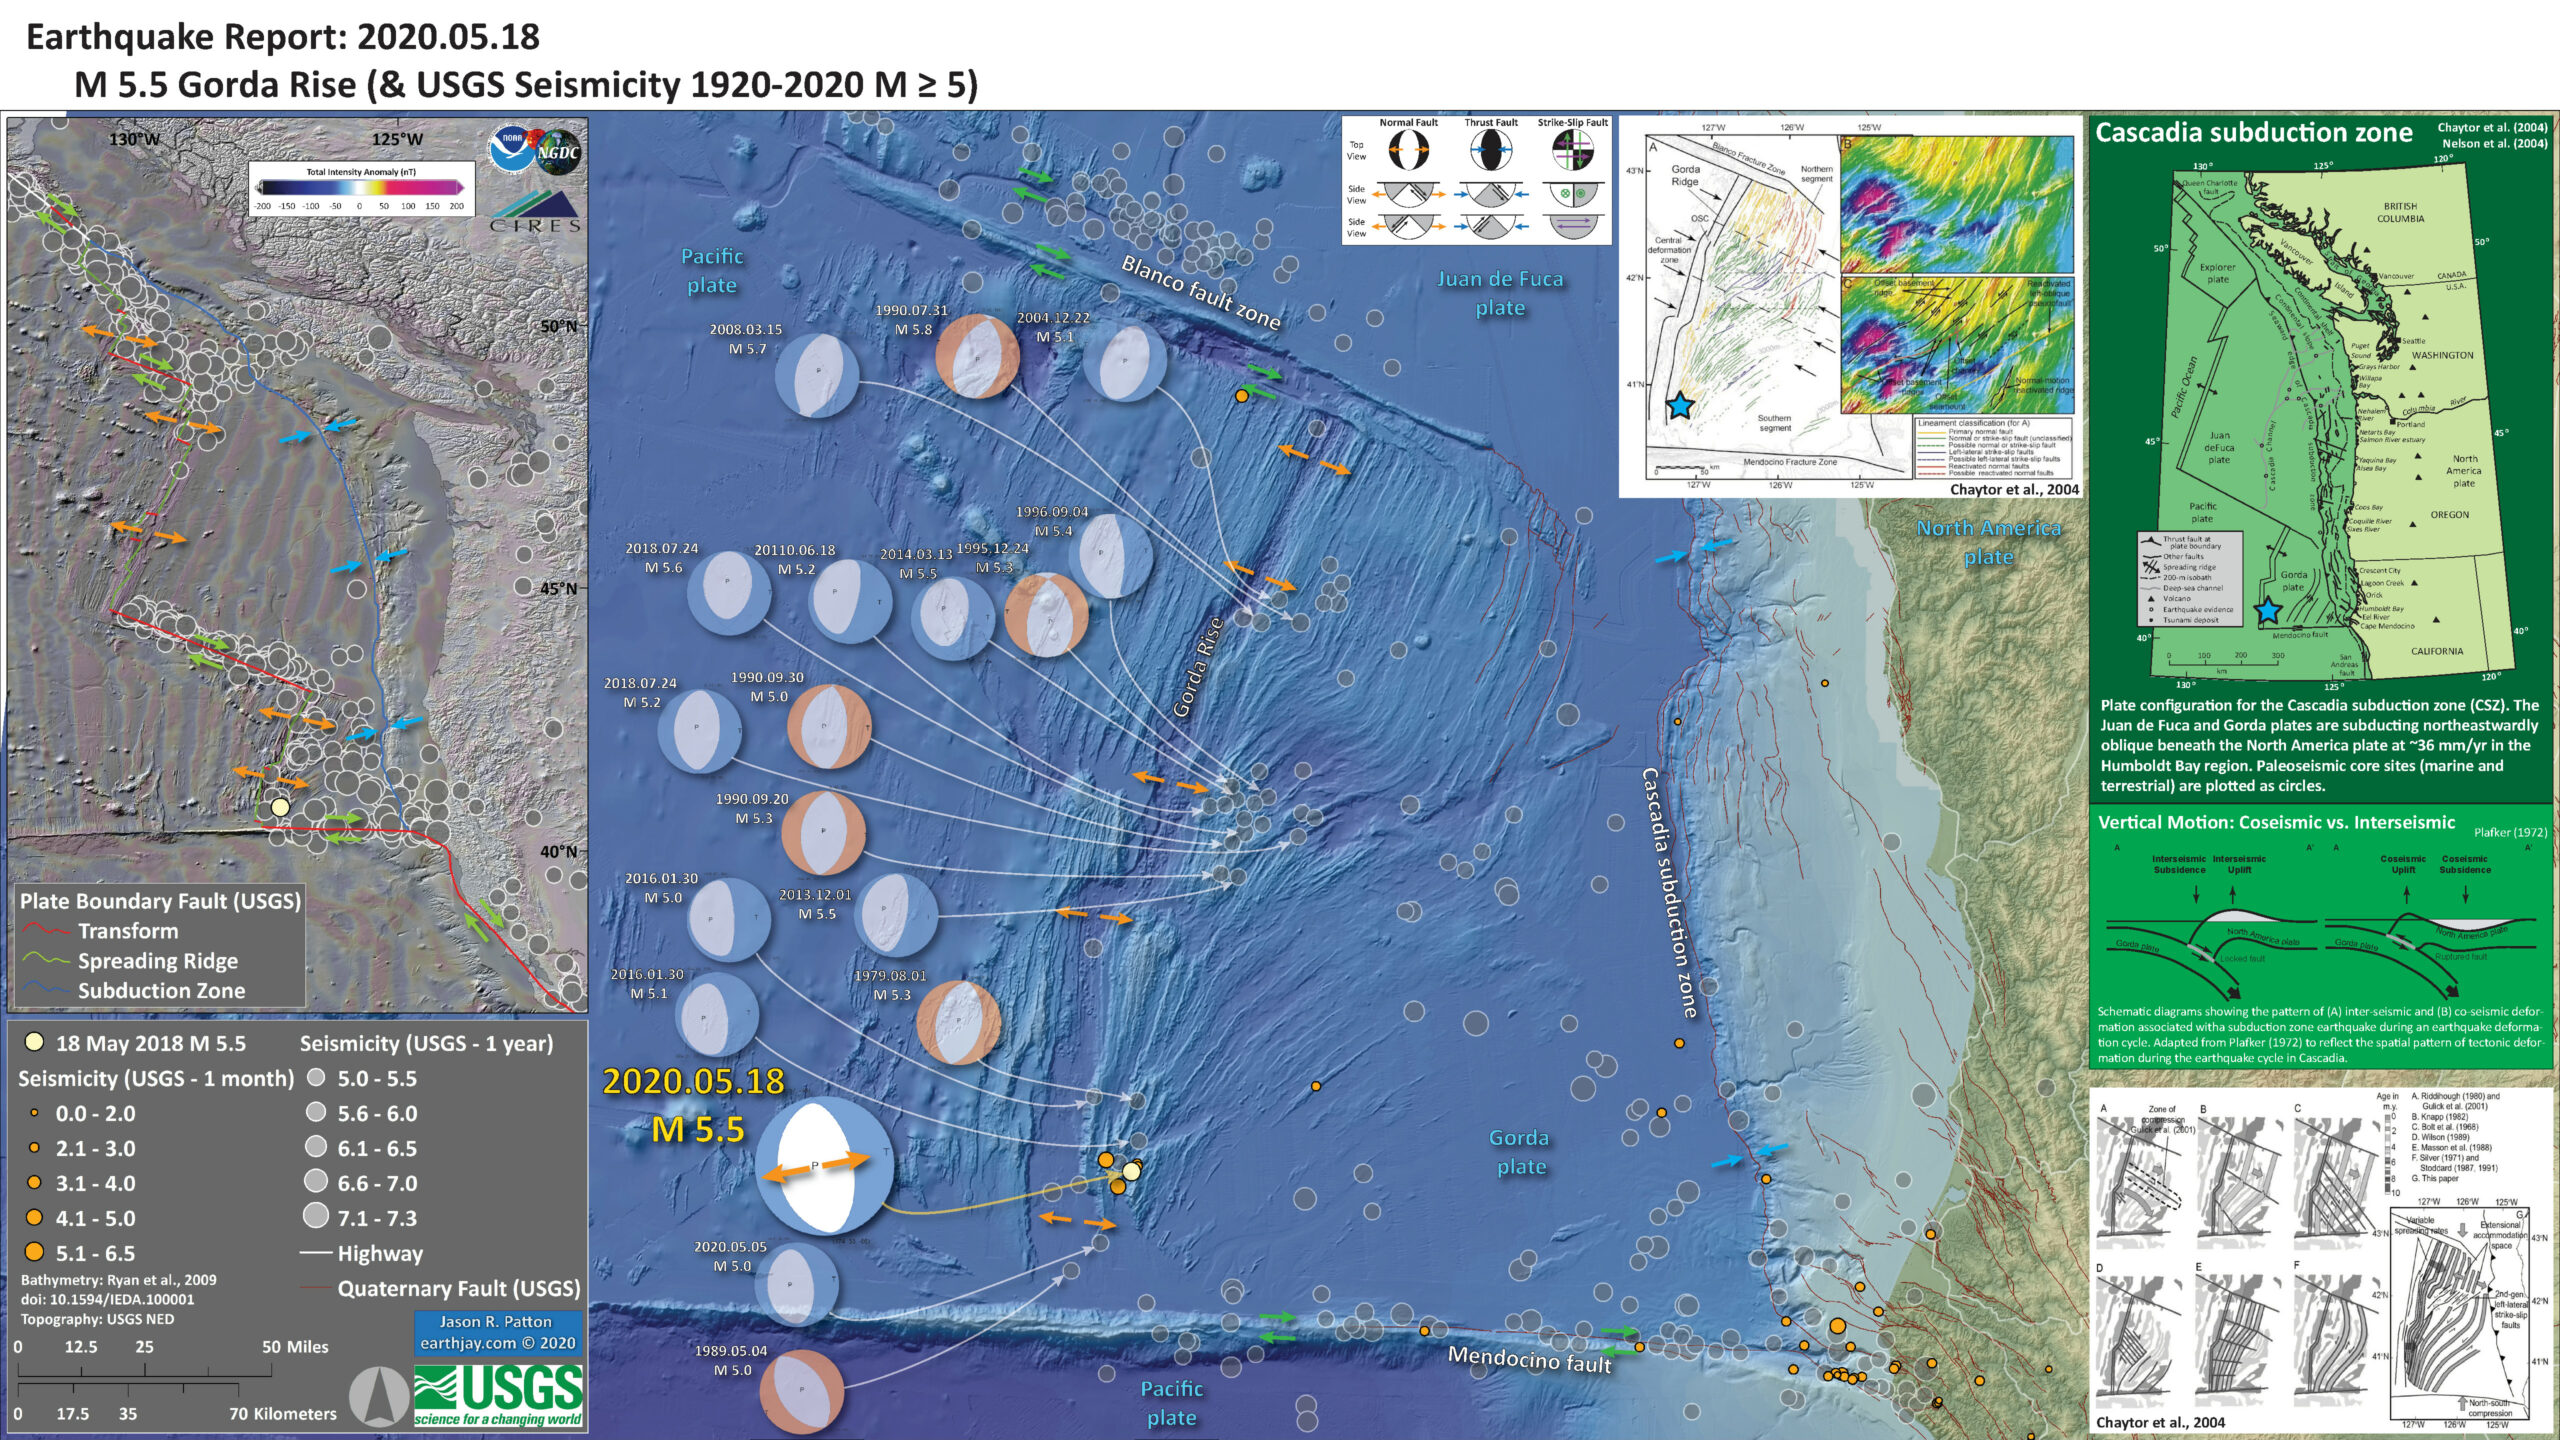
Below is my interpretive poster for this earthquake
- I plot the seismicity from the past month, with diameter representing magnitude (see legend). I include earthquake epicenters from 1920-2020 with magnitudes M ≥ 5.0 in one version.
- I plot the USGS fault plane solutions (moment tensors in blue and focal mechanisms in orange), possibly in addition to some relevant historic earthquakes.
- A review of the basic base map variations and data that I use for the interpretive posters can be found on the Earthquake Reports page.
- Some basic fundamentals of earthquake geology and plate tectonics can be found on the Earthquake Plate Tectonic Fundamentals page.
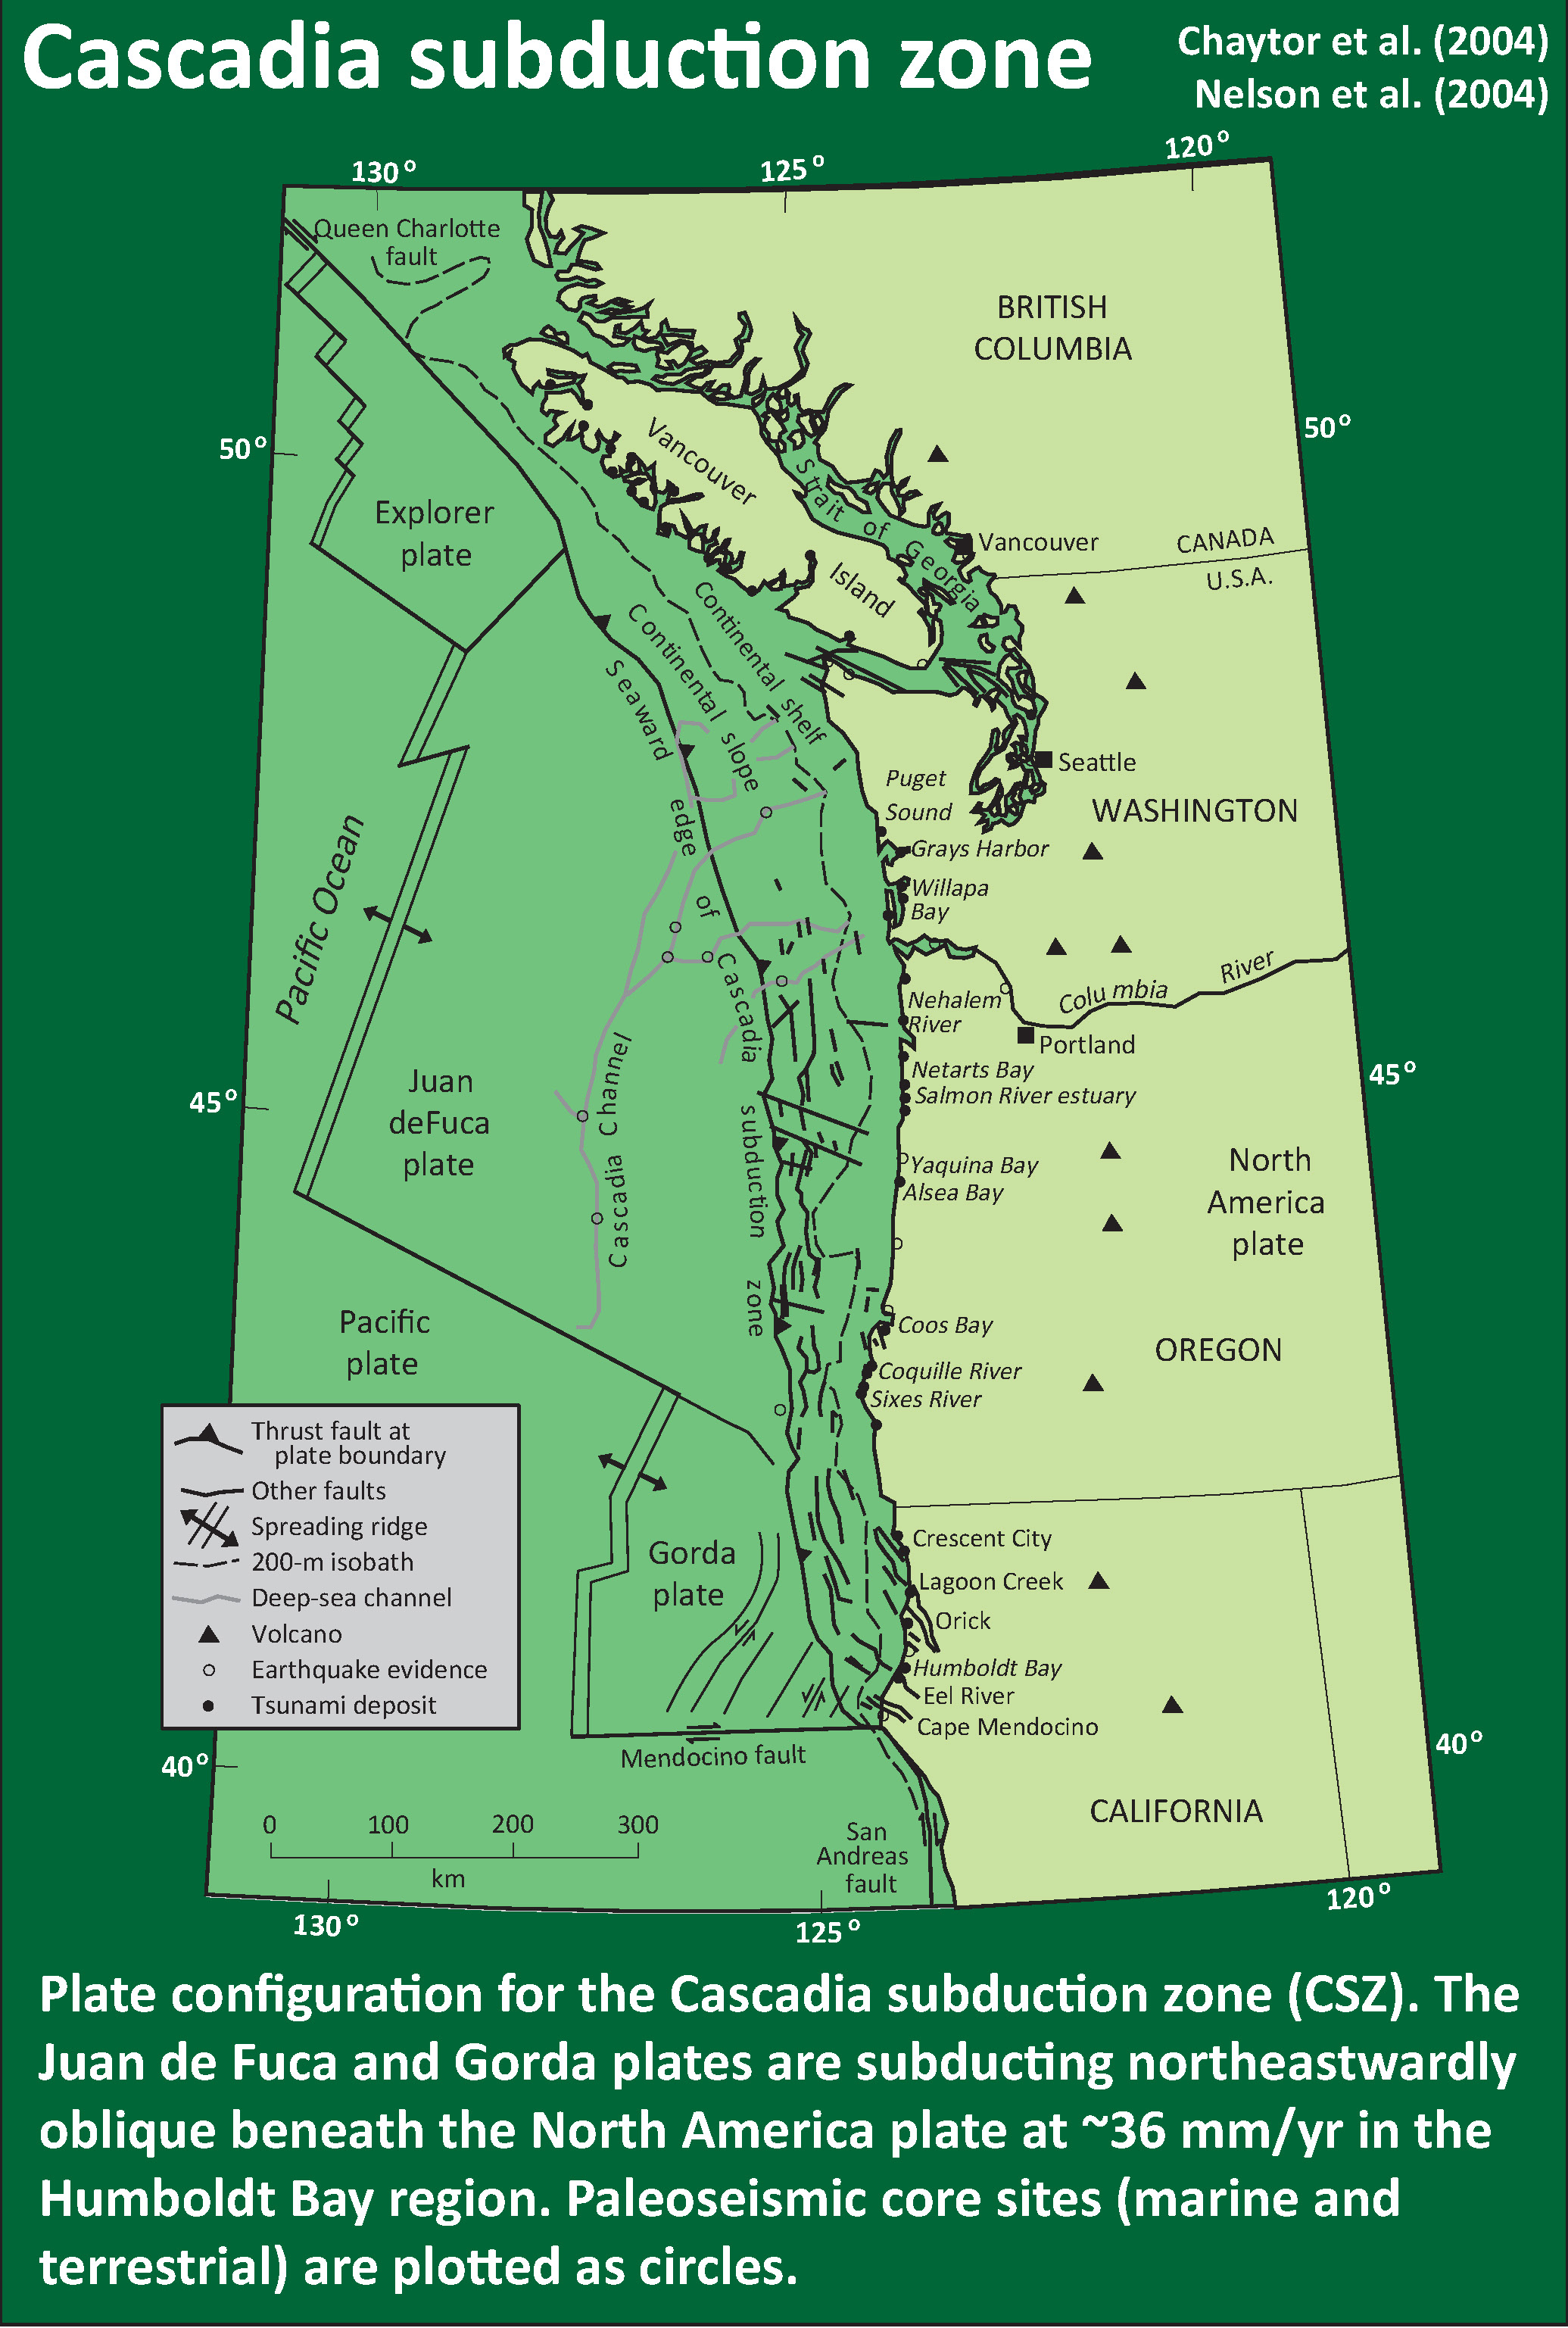
- In the upper right corner is a map and cross section for the Cascadia subduction zone. I spend more time describing these figures below.
- In the upper left corner is a map showing this entire region with historic seismicity plotted. I also include the plate boundaries (USGS) and include the magnetic anomalies too. Read more about magnetic anomalies here. Notice how the magnetic anomaly bands are parallel to the spreading ridges. Why do you think this might be?
- Yes, you are correct! The magnetic anomalies are parallel to the spreading ridges because they are formed when the crust cools along these spreading ridges.
- The Gorda plate is being crushed between all the other plates in the area. This causes the plate to deform internally. The figure in the lower right corner (Chaytor et al., 2004) shows some different models to explain the faults formed from this internal deformation. The map in the upper right center, also from Chaytor et al. (2004) shows how they interpret some of these normal faults to be reactivated as strike-slip faults.
I include some inset figures. Some of the same figures are located in different places on the larger scale map below.
- Here is the map with a month’s seismicity plotted.

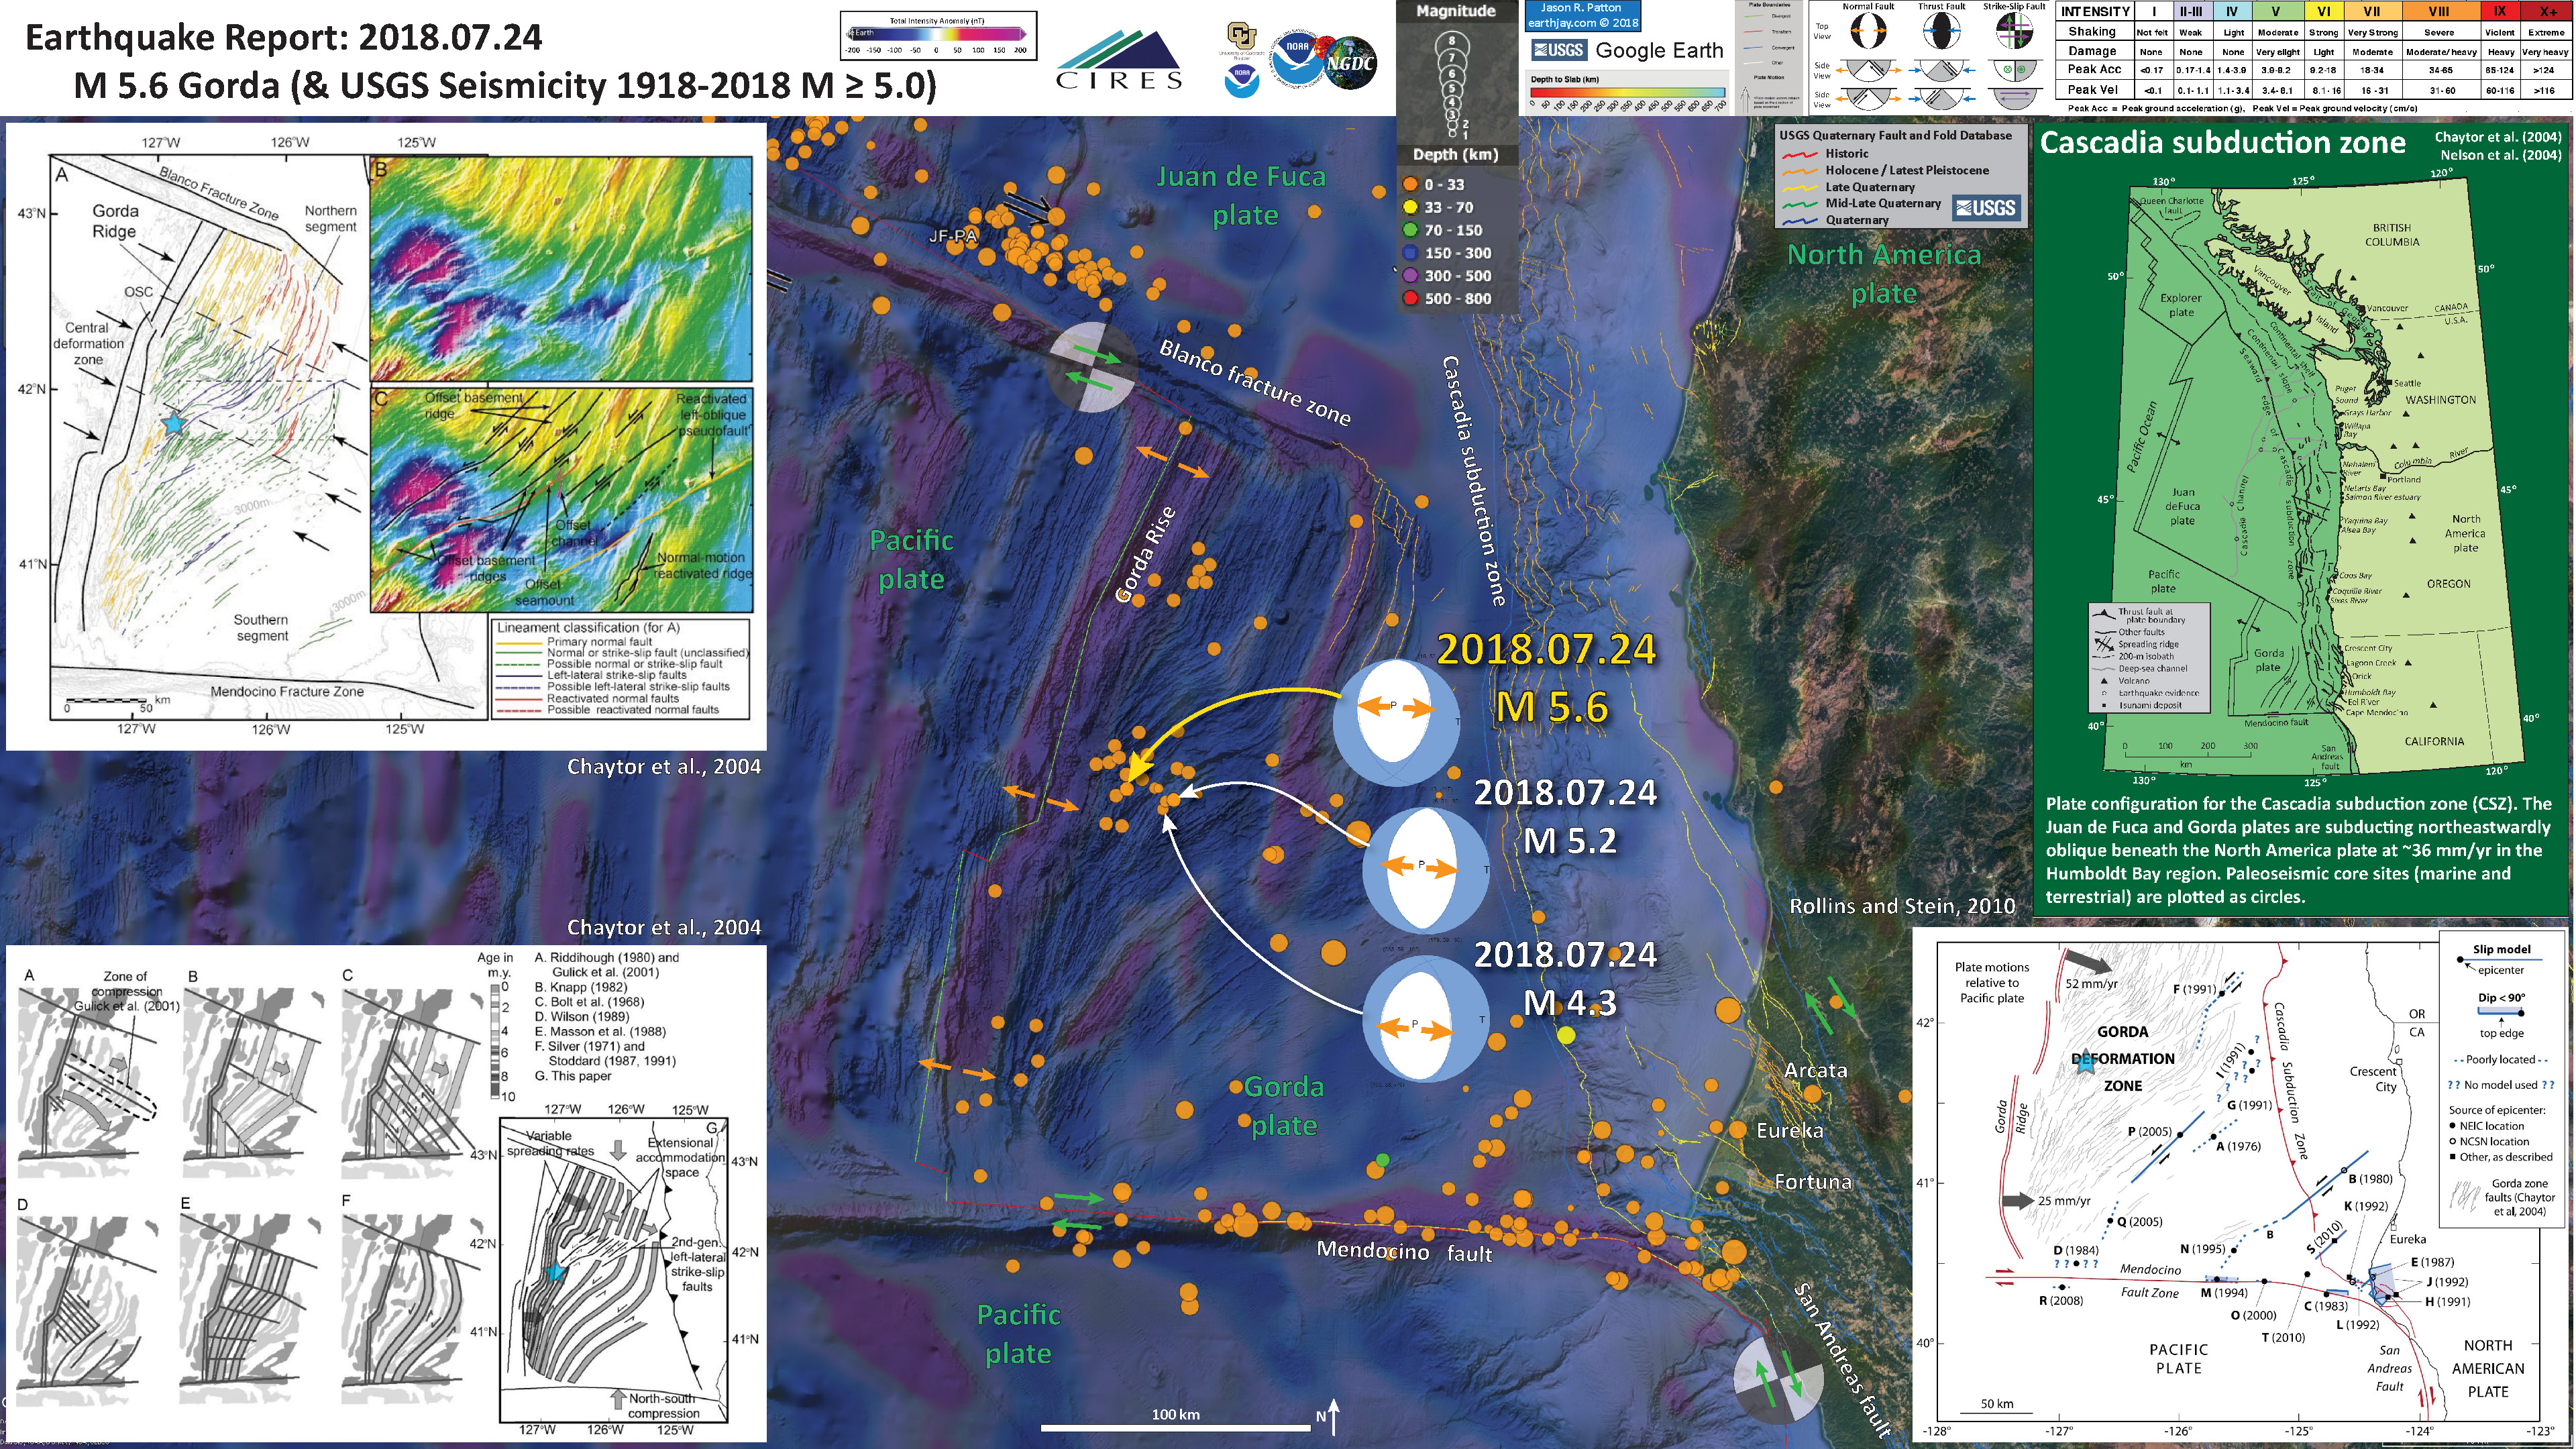
- Here are two posters from the 2018 Gorda Rise earthquakes.
- This version includes earthquakes M ≥ 5.0 from the USGS. Note how the region where today’s earthquakes happened is a region of higher levels of seismicity. Perhaps this is because this region is the locus of the deformation within the Mendocino deformation zone?

Other Report Pages
Some Relevant Discussion and Figures
- Here is a map of the Cascadia subduction zone, modified from Nelson et al. (2006). The Juan de Fuca and Gorda plates subduct norteastwardly beneath the North America plate at rates ranging from 29- to 45-mm/yr. Sites where evidence of past earthquakes (paleoseismology) are denoted by white dots. Where there is also evidence for past CSZ tsunami, there are black dots. These paleoseismology sites are labeled (e.g. Humboldt Bay). Some submarine paleoseismology core sites are also shown as grey dots. The two main spreading ridges are not labeled, but the northern one is the Juan de Fuca ridge (where oceanic crust is formed for the Juan de Fuca plate) and the southern one is the Gorda rise (where the oceanic crust is formed for the Gorda plate).
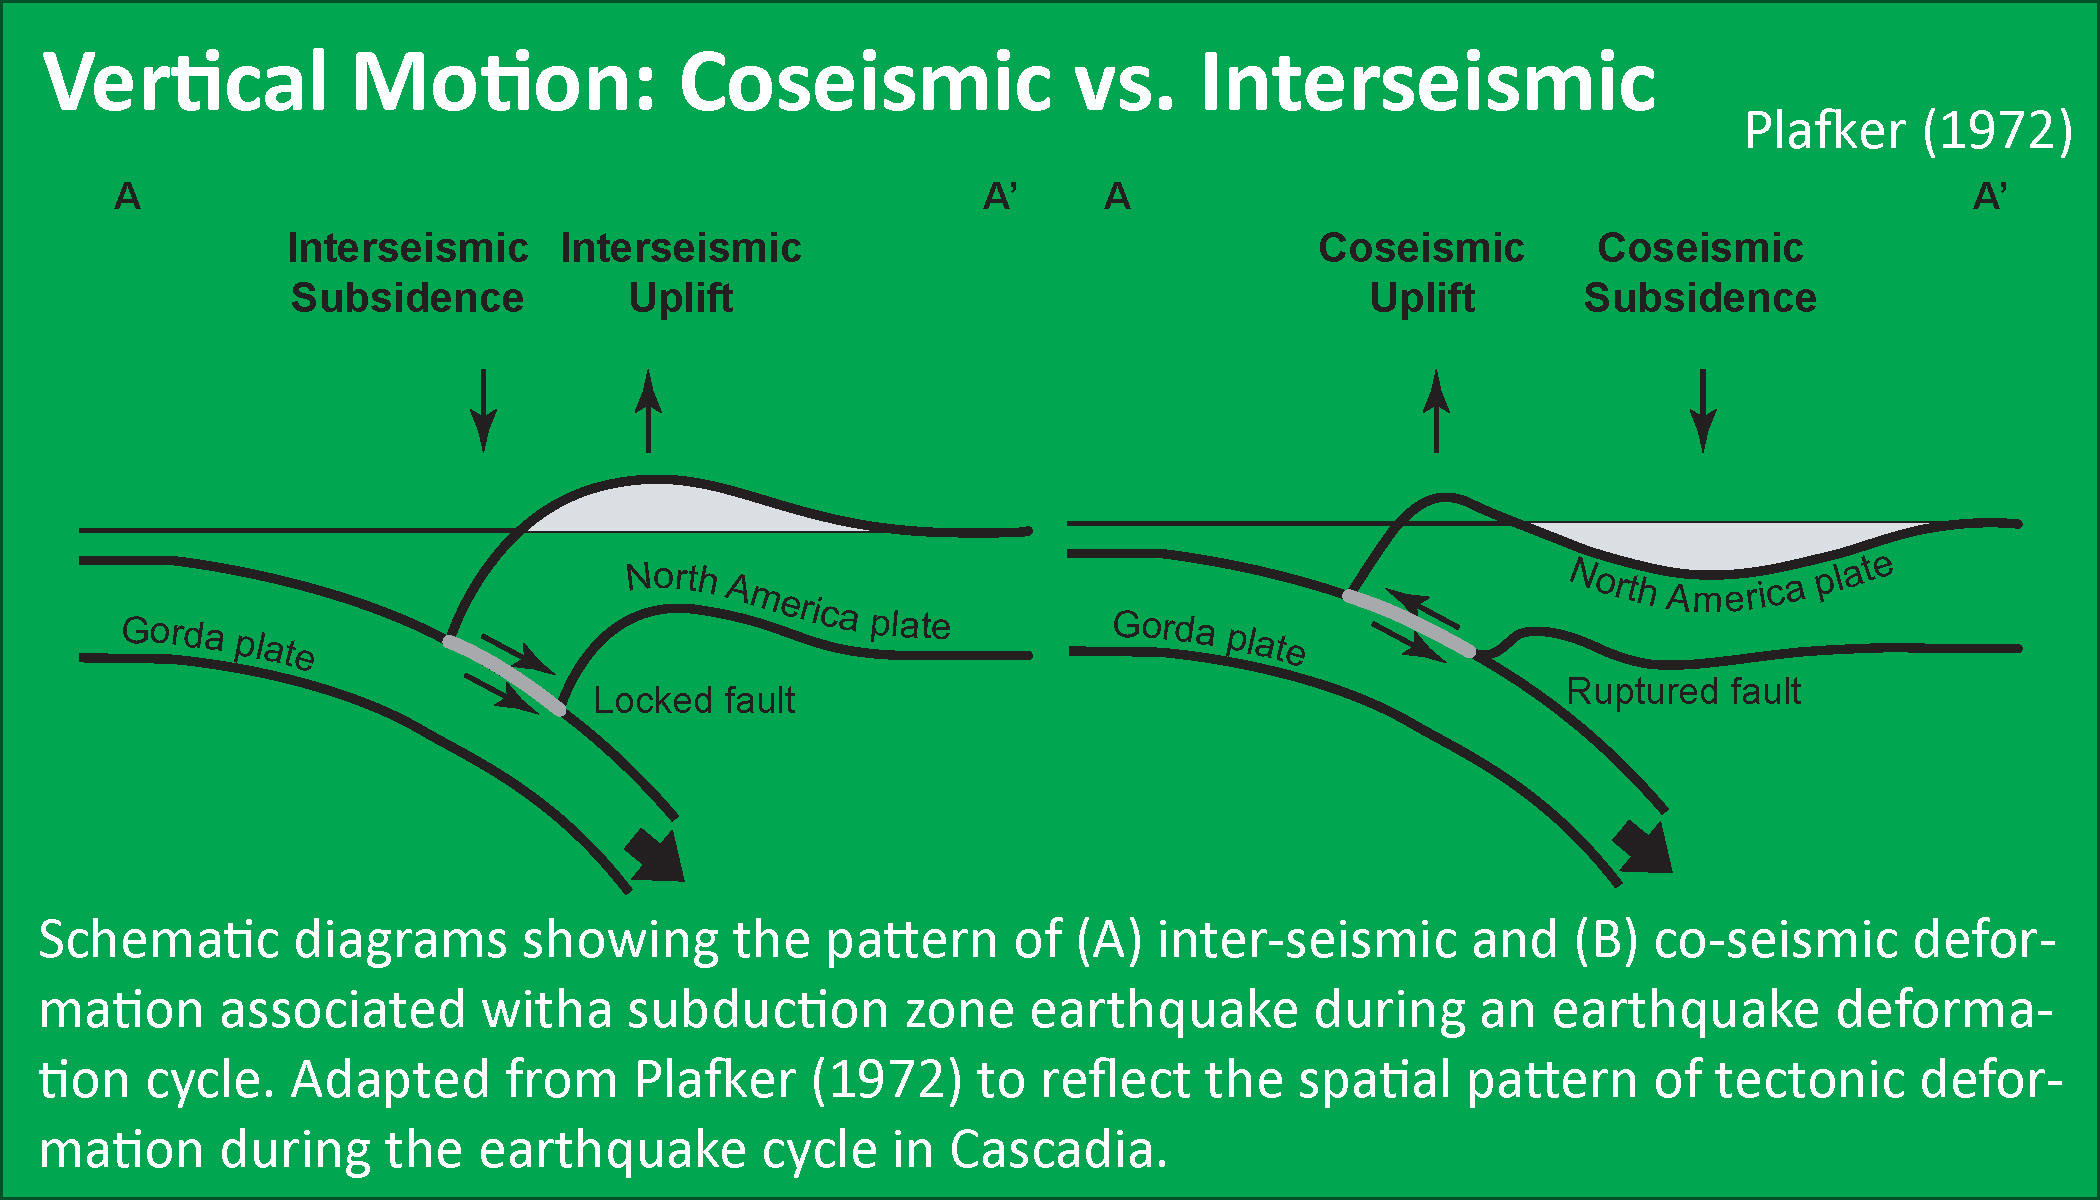
- Here is a version of the CSZ cross section alone (Plafker, 1972). This shows two parts of the earthquake cycle: the interseismic part (between earthquakes) and the coseismic part (during earthquakes). Regions that experience uplift during the interseismic period tend to experience subsidence during the coseismic period.
- Hemphill-Haley, E., 1995. Diatom evidence for earthquake-induced subsidence and tsunami 300 yr ago in southern coastal Washington in GSA Bulletin, v. 107, p. 367-378.
- Nelson, A.R., Shennan, I., and Long, A.J., 1996. Identifying coseismic subsidence in tidal-wetland stratigraphic sequences at the Cascadia subduction zone of western North America in Journal of Geophysical Research, v. 101, p. 6115-6135.
- Atwater, B.F. and Hemphill-Haley, E., 1997. Recurrence Intervals for Great Earthquakes of the Past 3,500 Years at Northeastern Willapa Bay, Washington in U.S. Geological Survey Professional Paper 1576, Washington D.C., 119 pp.
I have compiled some literature about the CSZ earthquake and tsunami. Here is a short list that might help us learn about what is contained within the core that I collected.
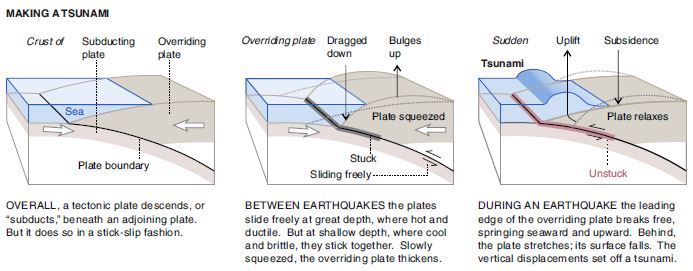
- This figure shows how a subduction zone deforms between (interseismic) and during (coseismic) earthquakes. We also can see how a subduction zone generates a tsunami. Atwater et al., 2005.
- Here is an animation produced by the folks at Cal Tech following the 2004 Sumatra-Andaman subduction zone earthquake. I have several posts about that earthquake here and here. One may learn more about this animation, as well as download this animation here.
- Here is a map from Chaytor et al. (2004) that shows some details of the faulting in the region. The moment tensor (at the moment i write this) shows a north-south striking fault with a reverse or thrust faulting mechanism. While this region of faulting is dominated by strike slip faults (and most all prior earthquake moment tensors showed strike slip earthquakes), when strike slip faults bend, they can create compression (transpression) and extension (transtension). This transpressive or transtentional deformation may produce thrust/reverse earthquakes or normal fault earthquakes, respectively. The transverse ranges north of Los Angeles are an example of uplift/transpression due to the bend in the San Andreas fault in that region.
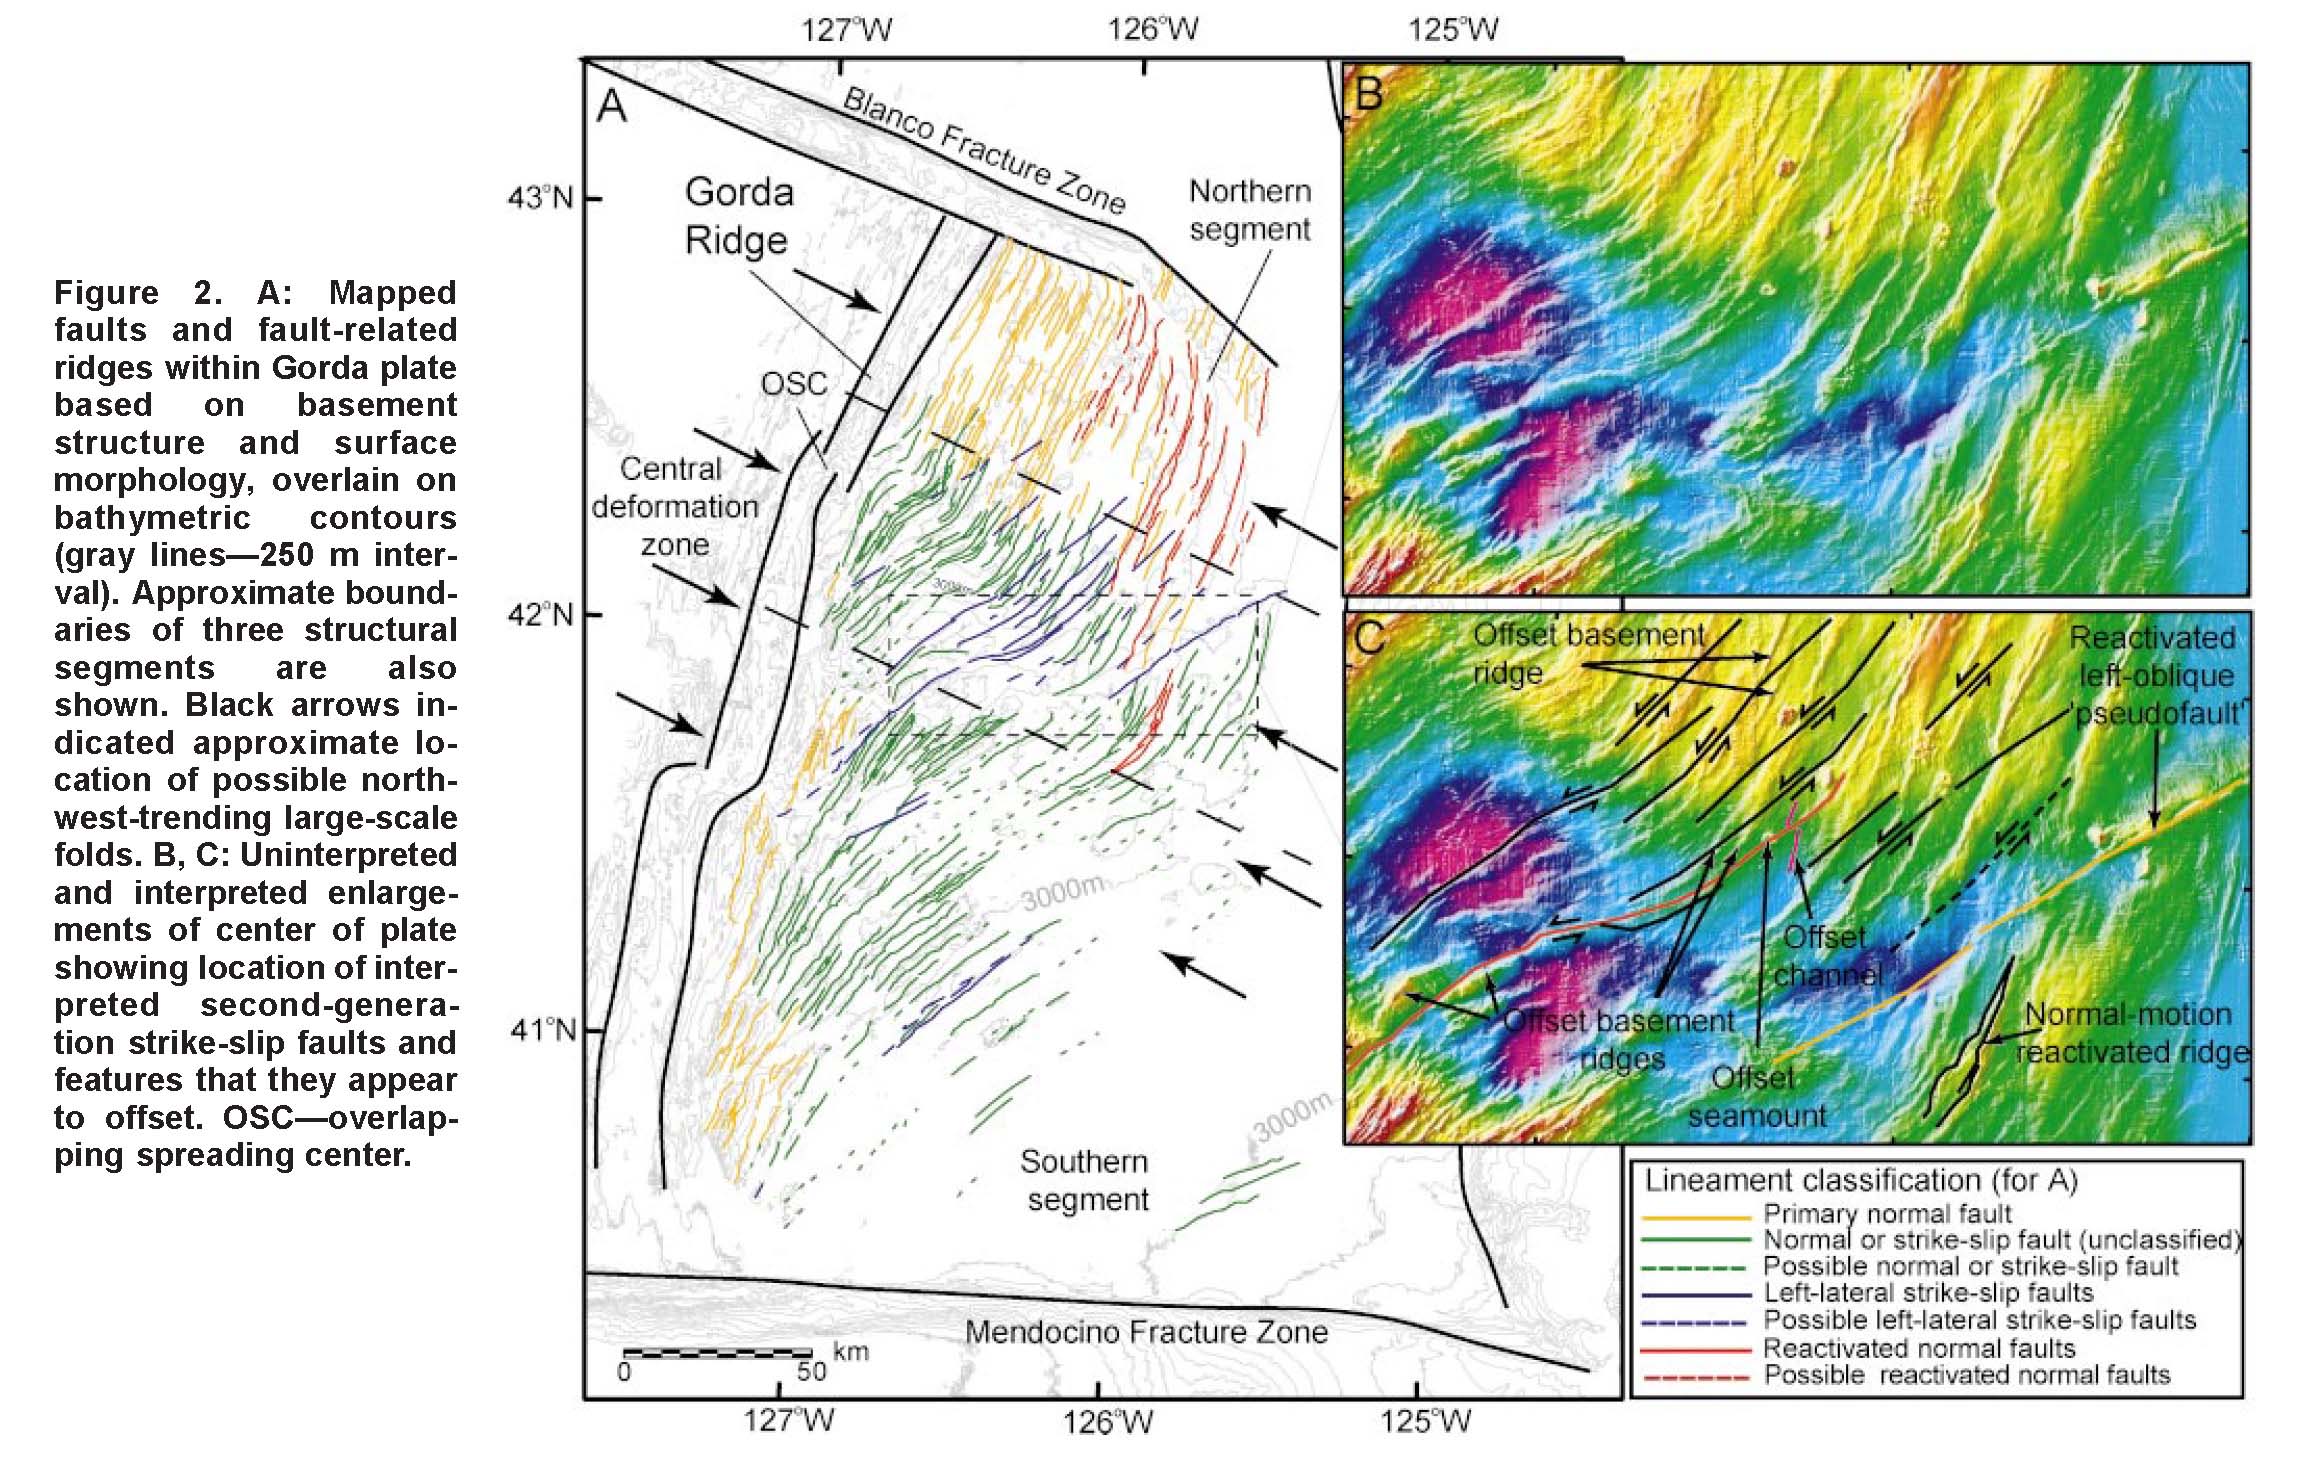
A: Mapped faults and fault-related ridges within Gorda plate based on basement structure and surface morphology, overlain on bathymetric contours (gray lines—250 m interval). Approximate boundaries of three structural segments are also shown. Black arrows indicated approximate location of possible northwest- trending large-scale folds. B, C: uninterpreted and interpreted enlargements of center of plate showing location of interpreted second-generation strike-slip faults and features that they appear to offset. OSC—overlapping spreading center.
- These are the models for tectonic deformation within the Gorda plate as presented by Jason Chaytor in 2004.
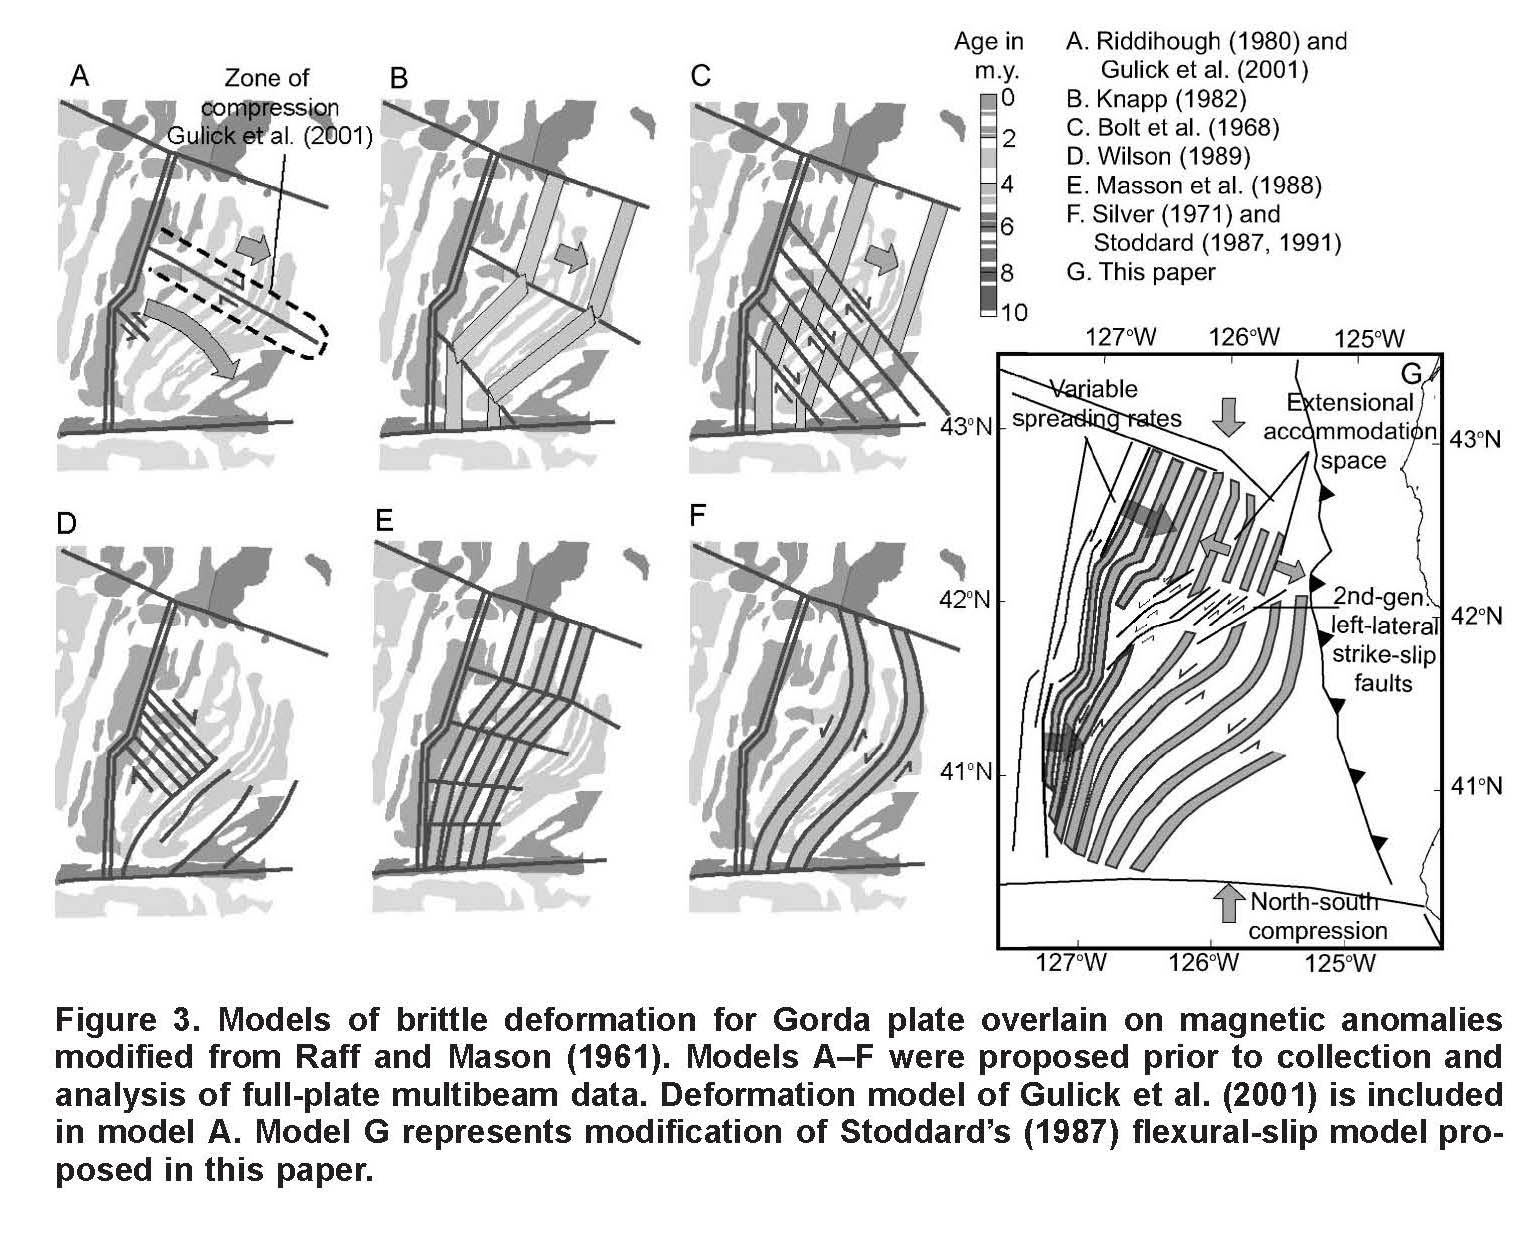
Models of brittle deformation for Gorda plate overlain on magnetic anomalies modified from Raff and Mason (1961). Models A–F were proposed prior to collection and analysis of full-plate multibeam data. Deformation model of Gulick et al. (2001) is included in model A. Model G represents modification of Stoddard’s (1987) flexural-slip model proposed in this paper.
- Here is a map from Rollins and Stein, showing their interpretations of different historic earthquakes in the region. This was published in response to the Januray 2010 Gorda plate earthquake. The faults are from Chaytor et al. (2004).
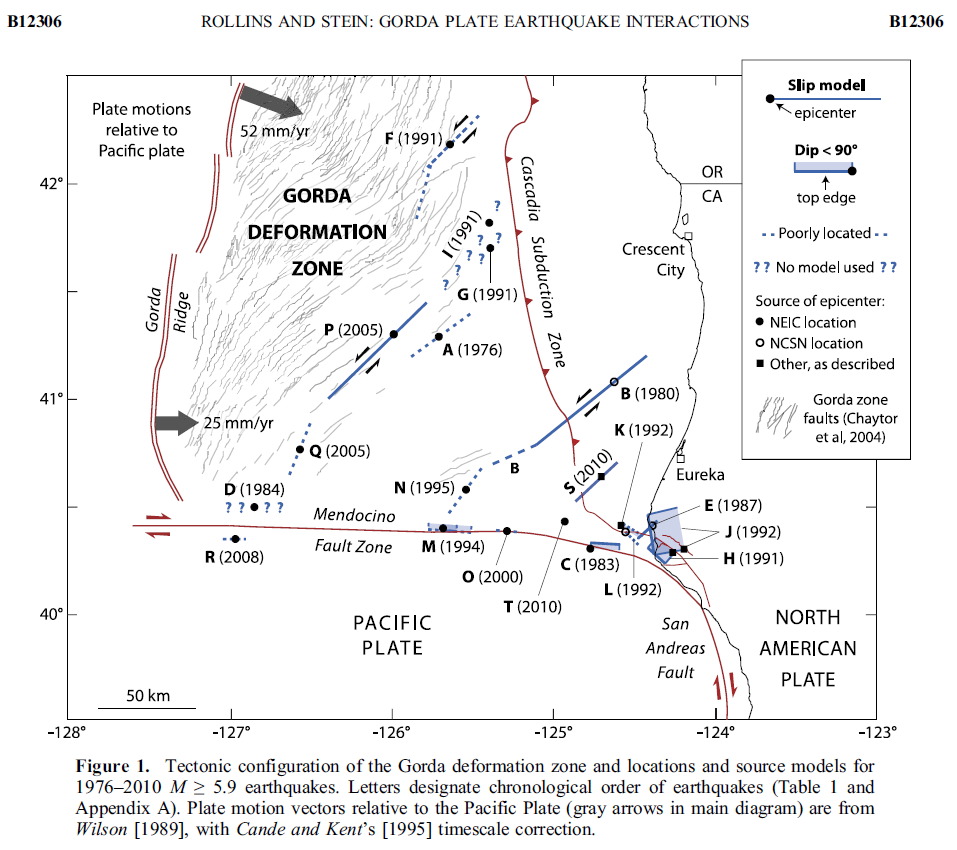
Tectonic configuration of the Gorda deformation zone and locations and source models for 1976–2010 M ≥ 5.9 earthquakes. Letters designate chronological order of earthquakes (Table 1 and Appendix A). Plate motion vectors relative to the Pacific Plate (gray arrows in main diagram) are from Wilson [1989], with Cande and Kent’s [1995] timescale correction.
- In this map below, I label a number of other significant earthquakes in this Mendocino triple junction region. Another historic right-lateral earthquake on the Mendocino fault system was in 1994. There was a series of earthquakes possibly along the easternmost section of the Mendocino fault system in late January 2015, here is my post about that earthquake series.
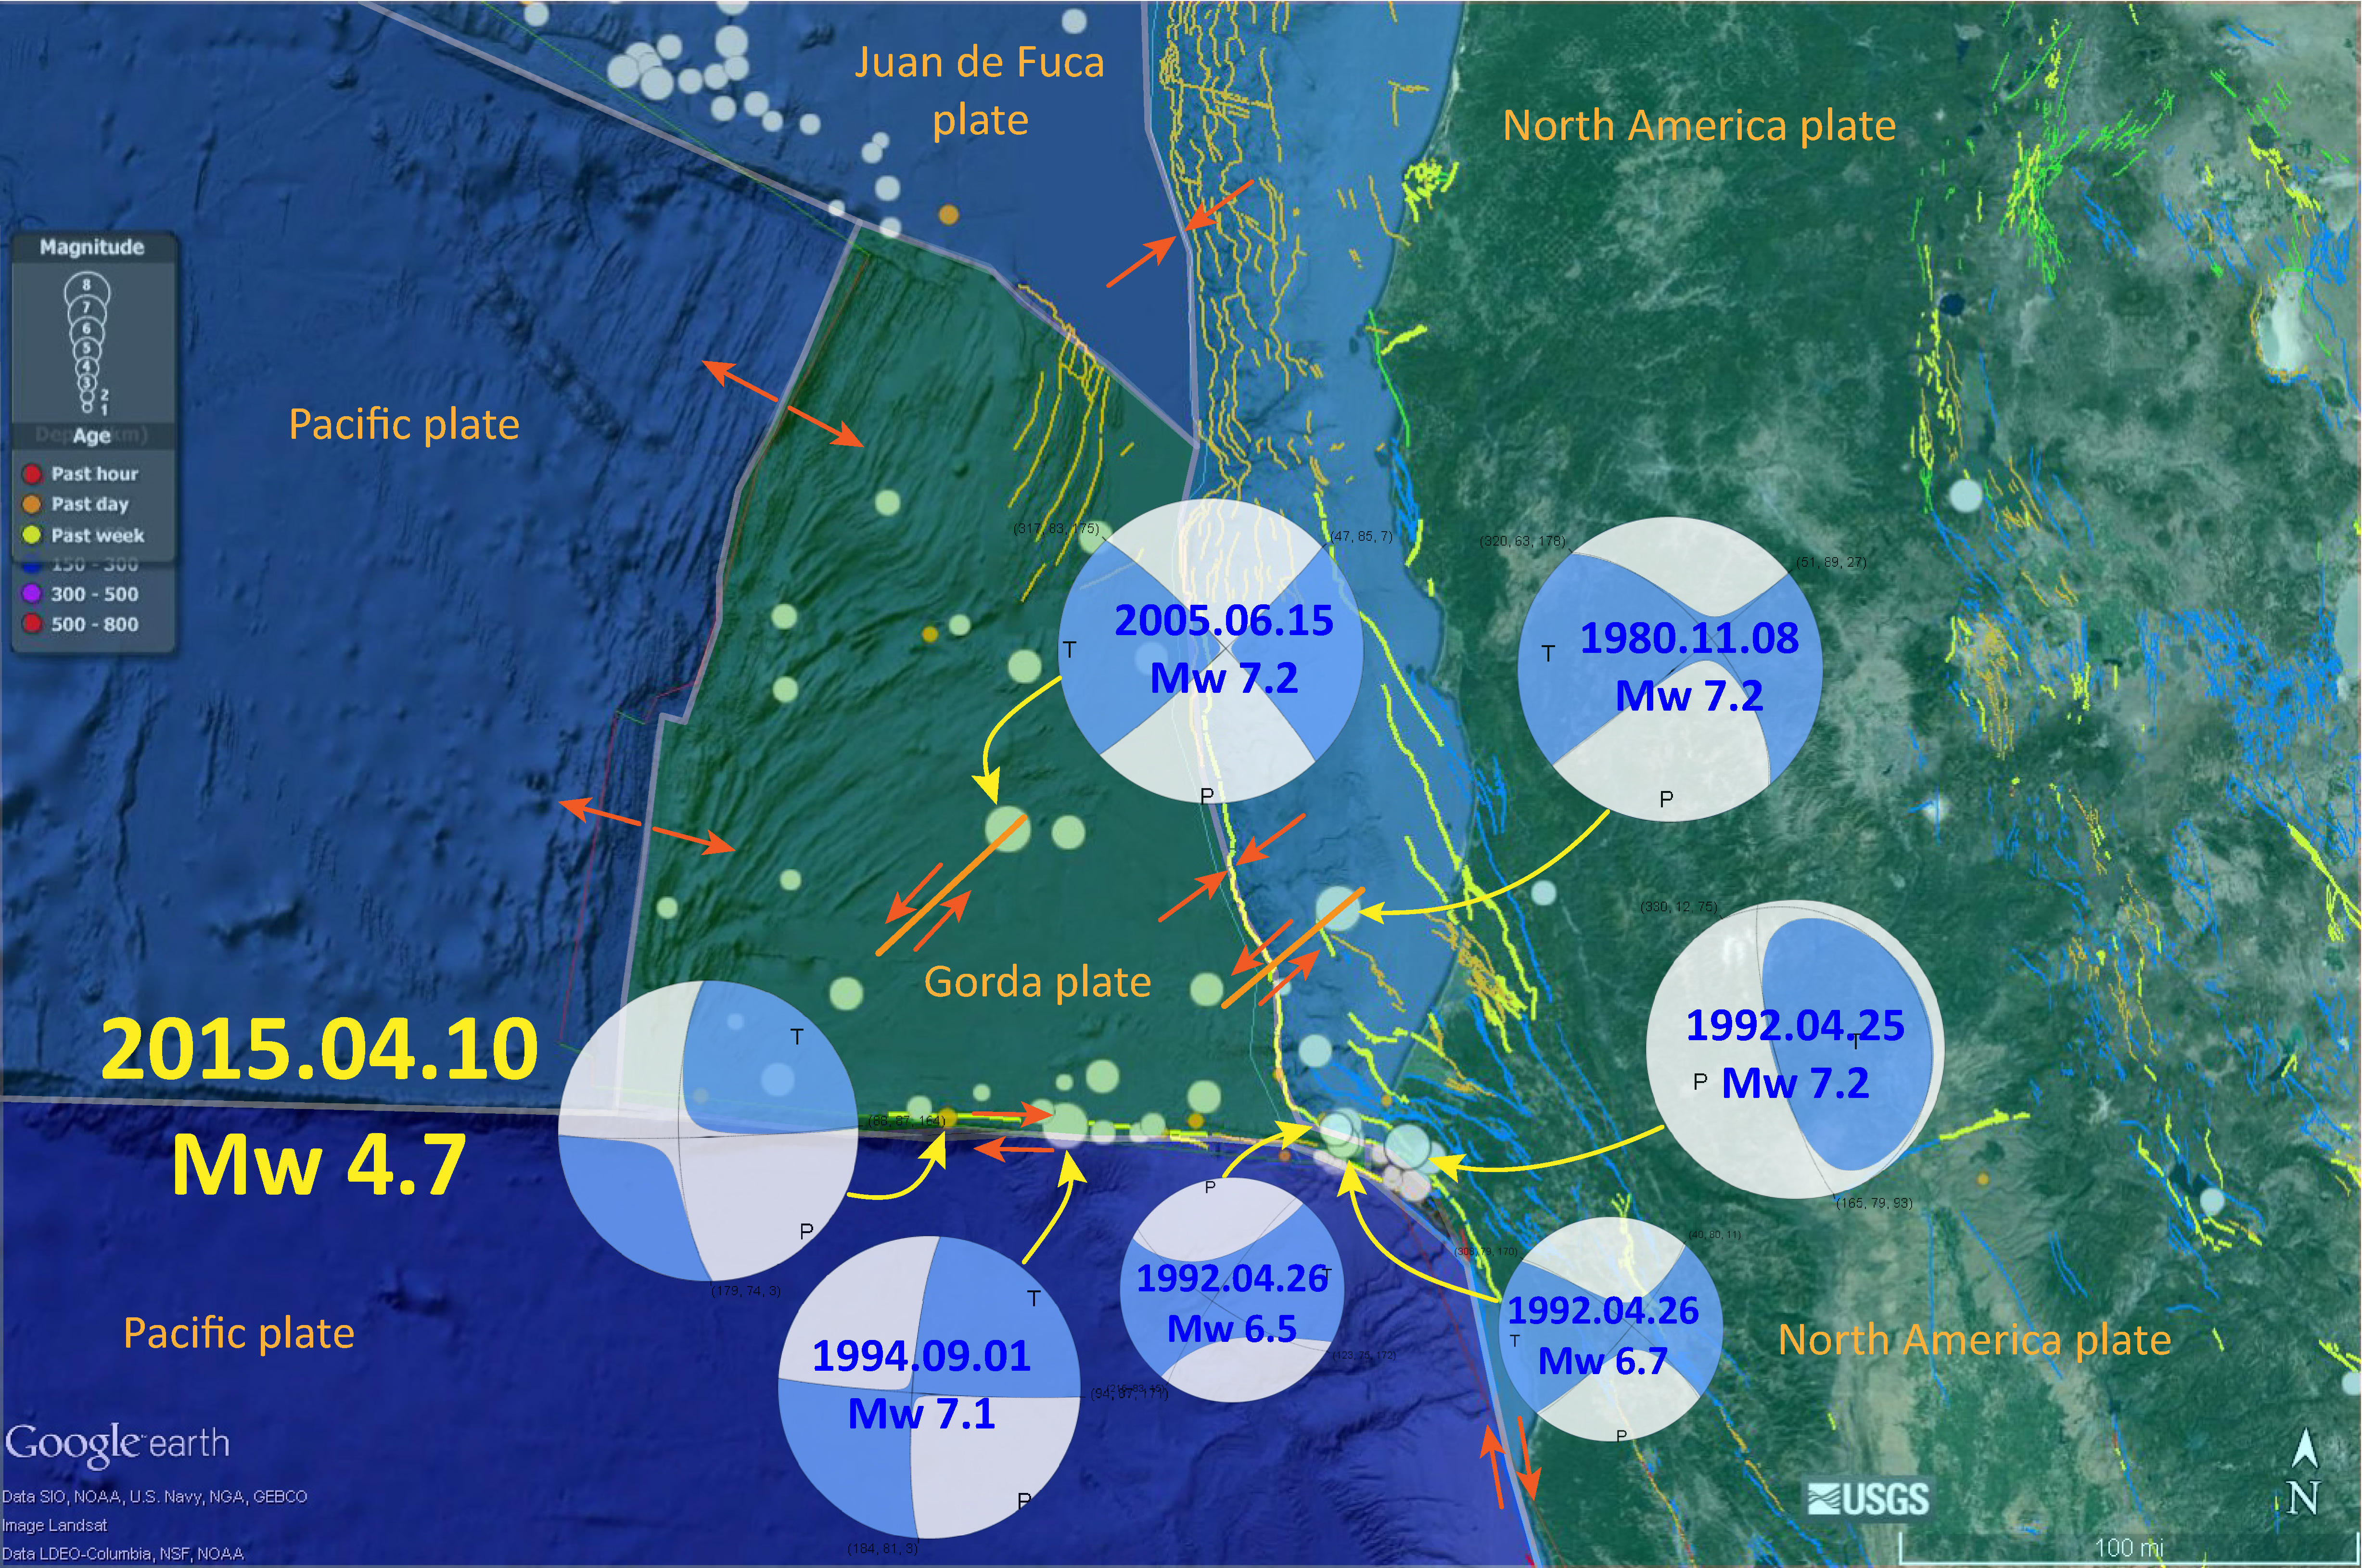
The Gorda and Juan de Fuca plates subduct beneath the North America plate to form the Cascadia subduction zone fault system. In 1992 there was a swarm of earthquakes with the magnitude Mw 7.2 Mainshock on 4/25. Initially this earthquake was interpreted to have been on the Cascadia subduction zone (CSZ). The moment tensor shows a compressional mechanism. However the two largest aftershocks on 4/26/1992 (Mw 6.5 and Mw 6.7), had strike-slip moment tensors. These two aftershocks align on what may be the eastern extension of the Mendocino fault.
There have been several series of intra-plate earthquakes in the Gorda plate. Two main shocks that I plot of this type of earthquake are the 1980 (Mw 7.2) and 2005 (Mw 7.2) earthquakes. I place orange lines approximately where the faults are that ruptured in 1980 and 2005. These are also plotted in the Rollins and Stein (2010) figure above. The Gorda plate is being deformed due to compression between the Pacific plate to the south and the Juan de Fuca plate to the north. Due to this north-south compression, the plate is deforming internally so that normal faults that formed at the spreading center (the Gorda Rise) are reactivated as left-lateral strike-slip faults. In 2014, there was another swarm of left-lateral earthquakes in the Gorda plate. I posted some material about the Gorda plate setting on this page.
- Here is a link to the embedded video below, showing the week-long seismicity in April 1992.
- This is the map used in the animation below. Earthquake epicenters are plotted (some with USGS moment tensors) for this region from 1917-2017 with M ≥ 6.5. I labeled the plates and shaded their general location in different colors.
- I include some inset maps.
- In the upper right corner is a map of the Cascadia subduction zone (Chaytor et al., 2004; Nelson et al., 2004).
- In the upper left corner is a map from Rollins and Stein (2010). They plot epicenters and fault lines involved in earthquakes between 1976 and 2010.

- Here is a link to the embedded video below, showing these earthquakes.
- 1700.09.26 M 9.0 Cascadia’s 315th Anniversary 2015.01.26
- 1700.09.26 M 9.0 Cascadia’s 316th Anniversary 2016.01.26 updated in 2017 and 2018
- 1992.04.25 M 7.1 Cape Mendocino 25 year remembrance
- 1992.04.25 M 7.1 Cape Mendocino 25 Year Remembrance Event Page
- Earthquake Information about the CSZ 2015.10.08
- 2020.05.18 M 5.5 Gorda Rise
- 2018.07.24 M 5.6 Gorda plate
- 2018.03.22 M 4.6/4.7 Gorda plate
- 2017.07.28 M 5.1 Gorda plate
- 2016.09.25 M 5.0 Gorda plate
- 2016.09.25 M 5.0 Gorda plate
- 2016.01.30 M 5.0 Gorda plate
- 2015.12.29 M 4.9 Gorda plate
- 2015.11.18 M 3.2 Gorda plate
- 2014.03.13 M 5.2 Gorda Rise
- 2014.03.09 M 6.8 Gorda plate p-1
- 2014.03.23 M 6.8 Gorda plate p-2
- 2010.01.10 M 6.5 Gorda plate
- 2019.08.29 M 6.3 Blanco transform fault
- 2018.08.22 M 6.2 Blanco transform fault
- 2018.07.29 M 5.3 Blanco transform fault
- 2015.06.01 M 5.8 Blanco transform fault p-1
- 2015.06.01 M 5.8 Blanco transform fault p-2 (animations)
- 2020.03.09 M 5.8 Mendocino fault
- 2018.01.25 M 5.8 Mendocino fault
- 2017.09.22 M 5.7 Mendocino fault
- 2016.12.08 M 6.5 Mendocino fault, CA
- 2016.12.08 M 6.5 Mendocino fault, CA Update #1
- 2016.12.05 M 4.3 Petrolia CA
- 2016.10.27 M 4.1 Mendocino fault
- 2016.09.03 M 5.6 Mendocino
- 2016.01.02 M 4.5 Mendocino fault
- 2015.11.01 M 4.3 Mendocino fault
- 2015.01.28 M 5.7 Mendocino fault
- 2020.03.18 M 5.2 Petrolia
- 2019.06.23 M 5.6 Petrolia
- 2017.03.06 M 4.0 Cape Mendocino
- 2016.11.02 M 3.6 Oregon
- 2016.01.07 M 4.2 NAP(?)
- 2015.10.29 M 3.4 Bayside
- 2018.10.22 M 6.8 Explorer plate
- 2017.01.07 M 5.7 Explorer plate
- 2016.03.19 M 5.2 Explorer plate
- 2017.06.11 M 3.5 Gorda or NAP?
- 2016.07.21 M 4.7 Gorda or NAP? p-1
- 2016.07.21 M 4.7 Gorda or NAP? p-2
Cascadia subduction zone
General Overview
Earthquake Reports
Gorda plate
Blanco transform fault
Mendocino fault
Mendocino triple junction
North America plate
Explorer plate
Uncertain
Social Media
- Frisch, W., Meschede, M., Blakey, R., 2011. Plate Tectonics, Springer-Verlag, London, 213 pp.
- Hayes, G., 2018, Slab2 – A Comprehensive Subduction Zone Geometry Model: U.S. Geological Survey data release, https://doi.org/10.5066/F7PV6JNV.
- Holt, W. E., C. Kreemer, A. J. Haines, L. Estey, C. Meertens, G. Blewitt, and D. Lavallee (2005), Project helps constrain continental dynamics and seismic hazards, Eos Trans. AGU, 86(41), 383–387, , https://doi.org/10.1029/2005EO410002. /li>
- Jessee, M.A.N., Hamburger, M. W., Allstadt, K., Wald, D. J., Robeson, S. M., Tanyas, H., et al. (2018). A global empirical model for near-real-time assessment of seismically induced landslides. Journal of Geophysical Research: Earth Surface, 123, 1835–1859. https://doi.org/10.1029/2017JF004494
- Kreemer, C., J. Haines, W. Holt, G. Blewitt, and D. Lavallee (2000), On the determination of a global strain rate model, Geophys. J. Int., 52(10), 765–770.
- Kreemer, C., W. E. Holt, and A. J. Haines (2003), An integrated global model of present-day plate motions and plate boundary deformation, Geophys. J. Int., 154(1), 8–34, , https://doi.org/10.1046/j.1365-246X.2003.01917.x.
- Kreemer, C., G. Blewitt, E.C. Klein, 2014. A geodetic plate motion and Global Strain Rate Model in Geochemistry, Geophysics, Geosystems, v. 15, p. 3849-3889, https://doi.org/10.1002/2014GC005407.
- Meyer, B., Saltus, R., Chulliat, a., 2017. EMAG2: Earth Magnetic Anomaly Grid (2-arc-minute resolution) Version 3. National Centers for Environmental Information, NOAA. Model. https://doi.org/10.7289/V5H70CVX
- Müller, R.D., Sdrolias, M., Gaina, C. and Roest, W.R., 2008, Age spreading rates and spreading asymmetry of the world’s ocean crust in Geochemistry, Geophysics, Geosystems, 9, Q04006, https://doi.org/10.1029/2007GC001743
- Pagani,M. , J. Garcia-Pelaez, R. Gee, K. Johnson, V. Poggi, R. Styron, G. Weatherill, M. Simionato, D. Viganò, L. Danciu, D. Monelli (2018). Global Earthquake Model (GEM) Seismic Hazard Map (version 2018.1 – December 2018), DOI: 10.13117/GEM-GLOBAL-SEISMIC-HAZARD-MAP-2018.1
- Silva, V ., D Amo-Oduro, A Calderon, J Dabbeek, V Despotaki, L Martins, A Rao, M Simionato, D Viganò, C Yepes, A Acevedo, N Horspool, H Crowley, K Jaiswal, M Journeay, M Pittore, 2018. Global Earthquake Model (GEM) Seismic Risk Map (version 2018.1). https://doi.org/10.13117/GEM-GLOBAL-SEISMIC-RISK-MAP-2018.1
- Zhu, J., Baise, L. G., Thompson, E. M., 2017, An Updated Geospatial Liquefaction Model for Global Application, Bulletin of the Seismological Society of America, 107, p 1365-1385, https://doi.org/0.1785/0120160198
References:
Basic & General References
Specific References
Return to the Earthquake Reports page.
- Sorted by Magnitude
- Sorted by Year
- Sorted by Day of the Year
- Sorted By Region