Busy day today. This is my second earthquake report today.
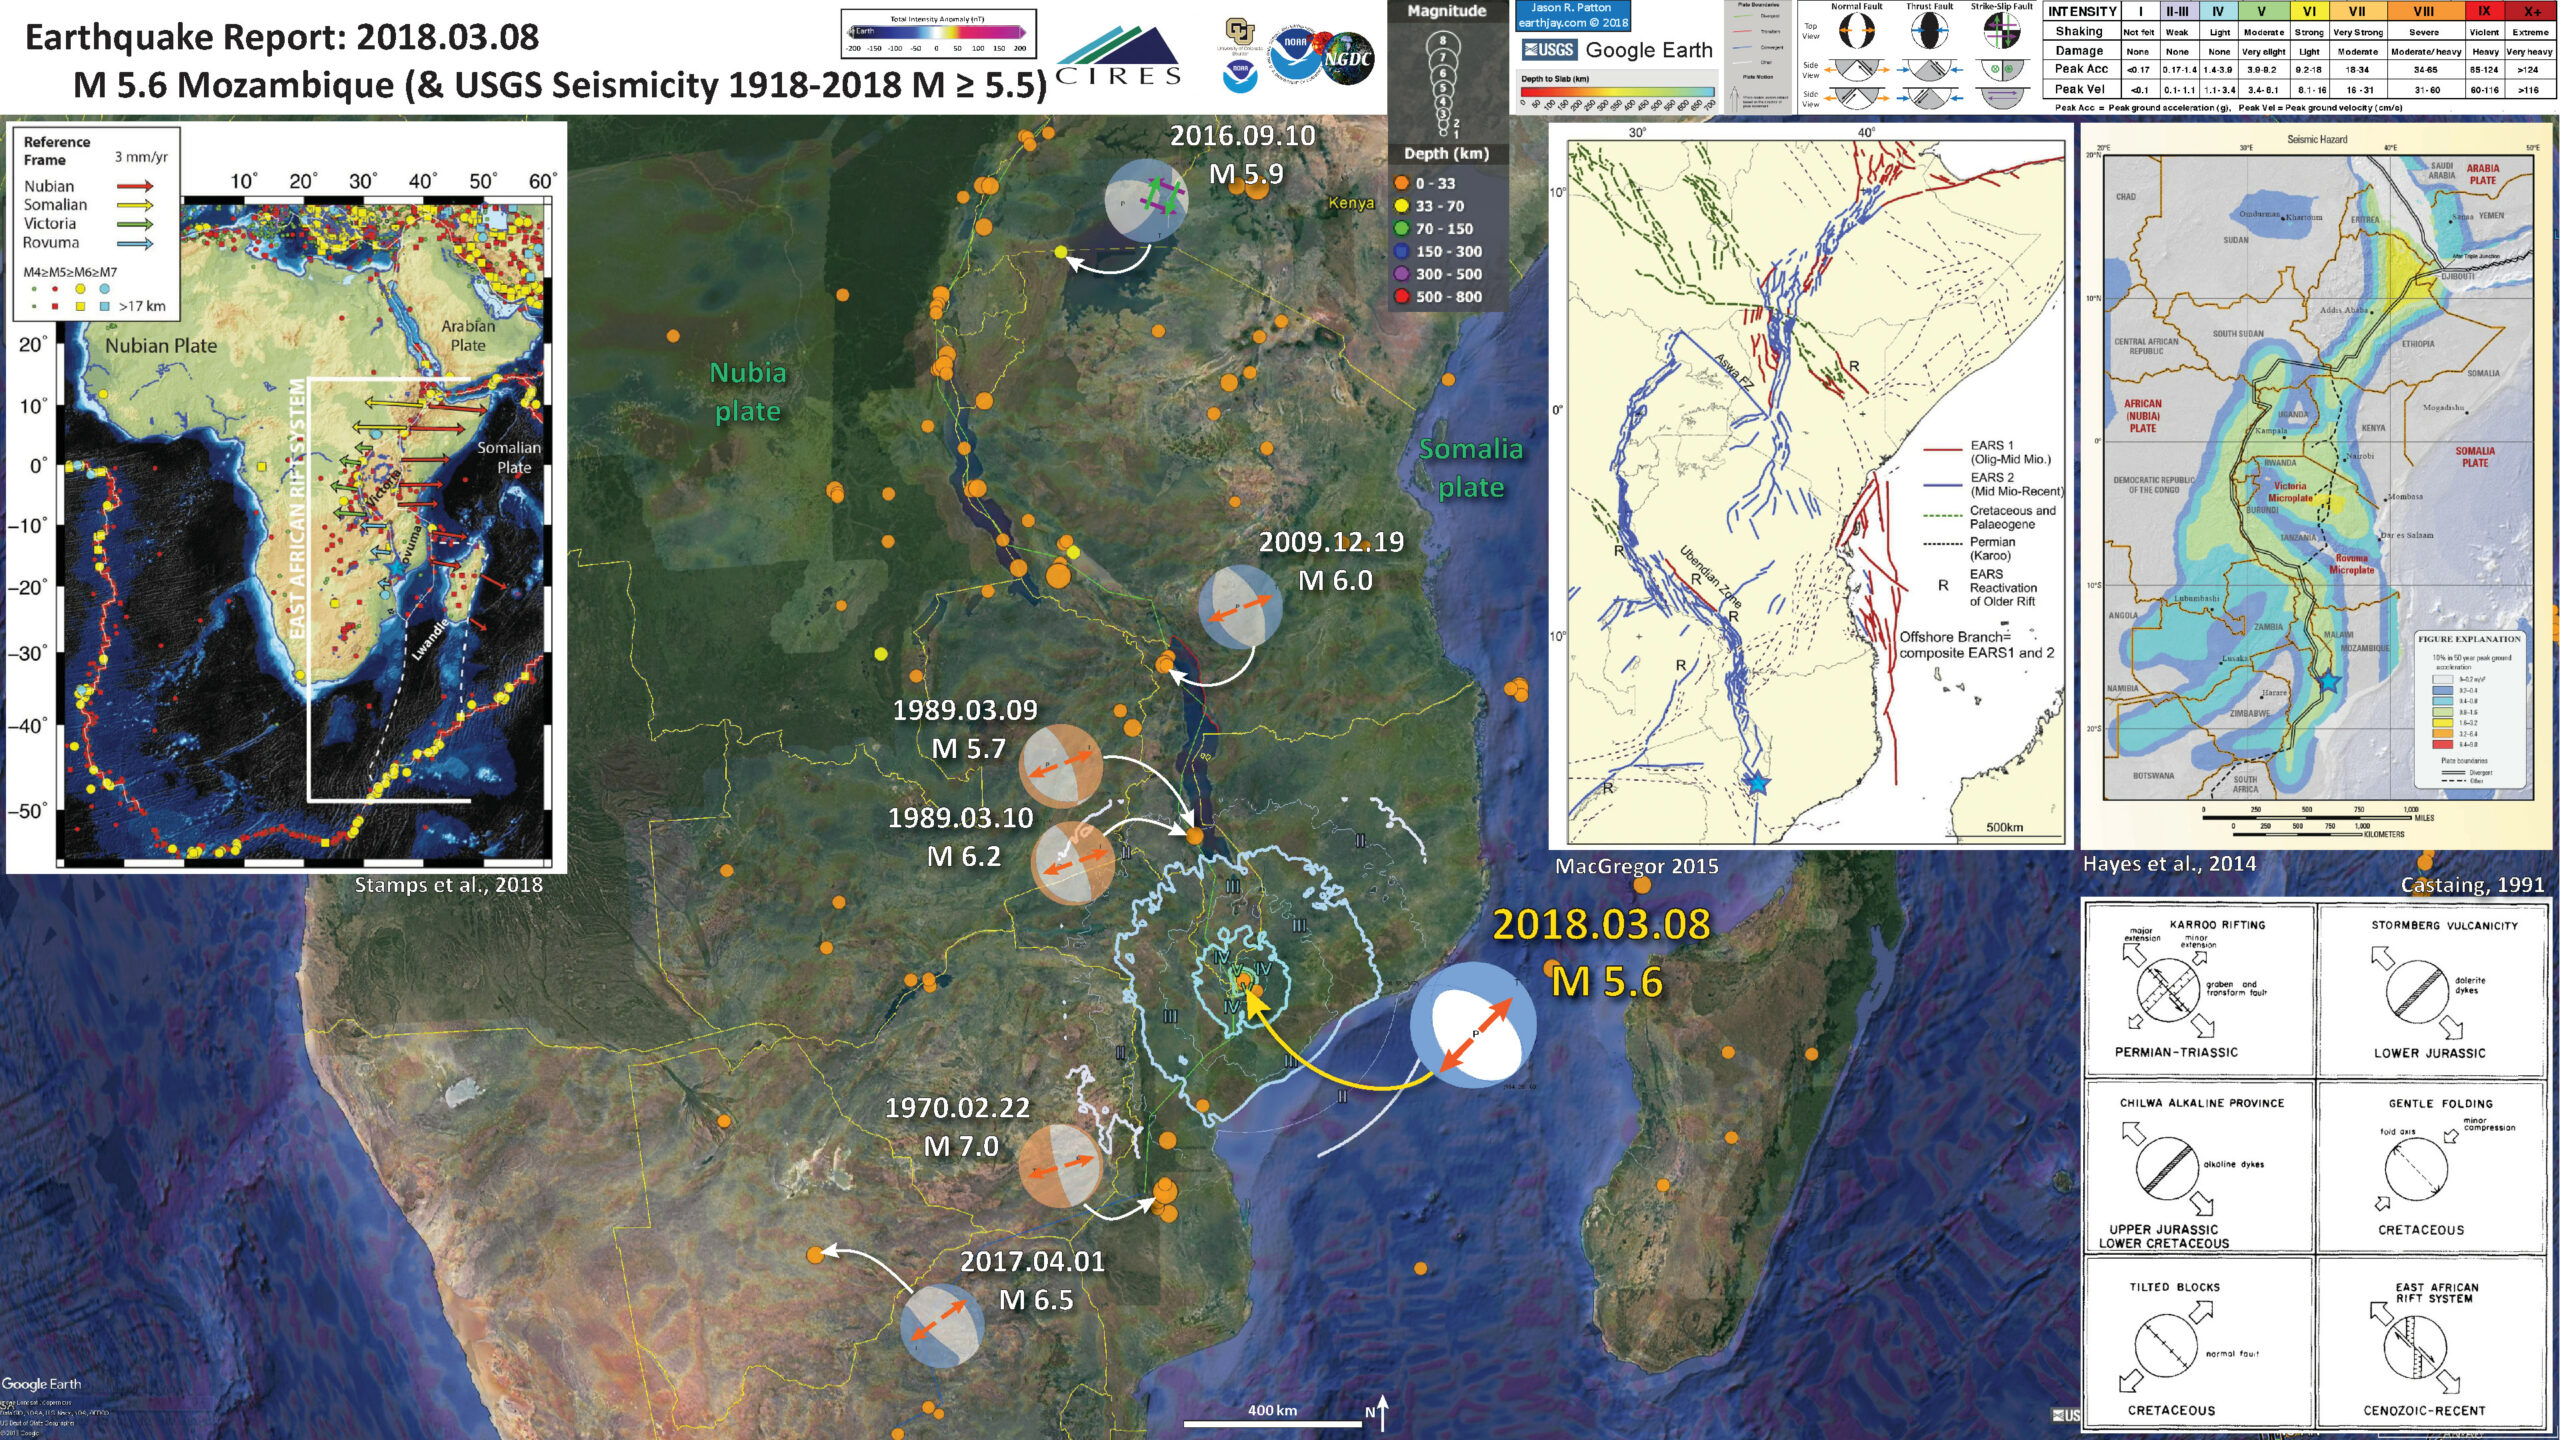
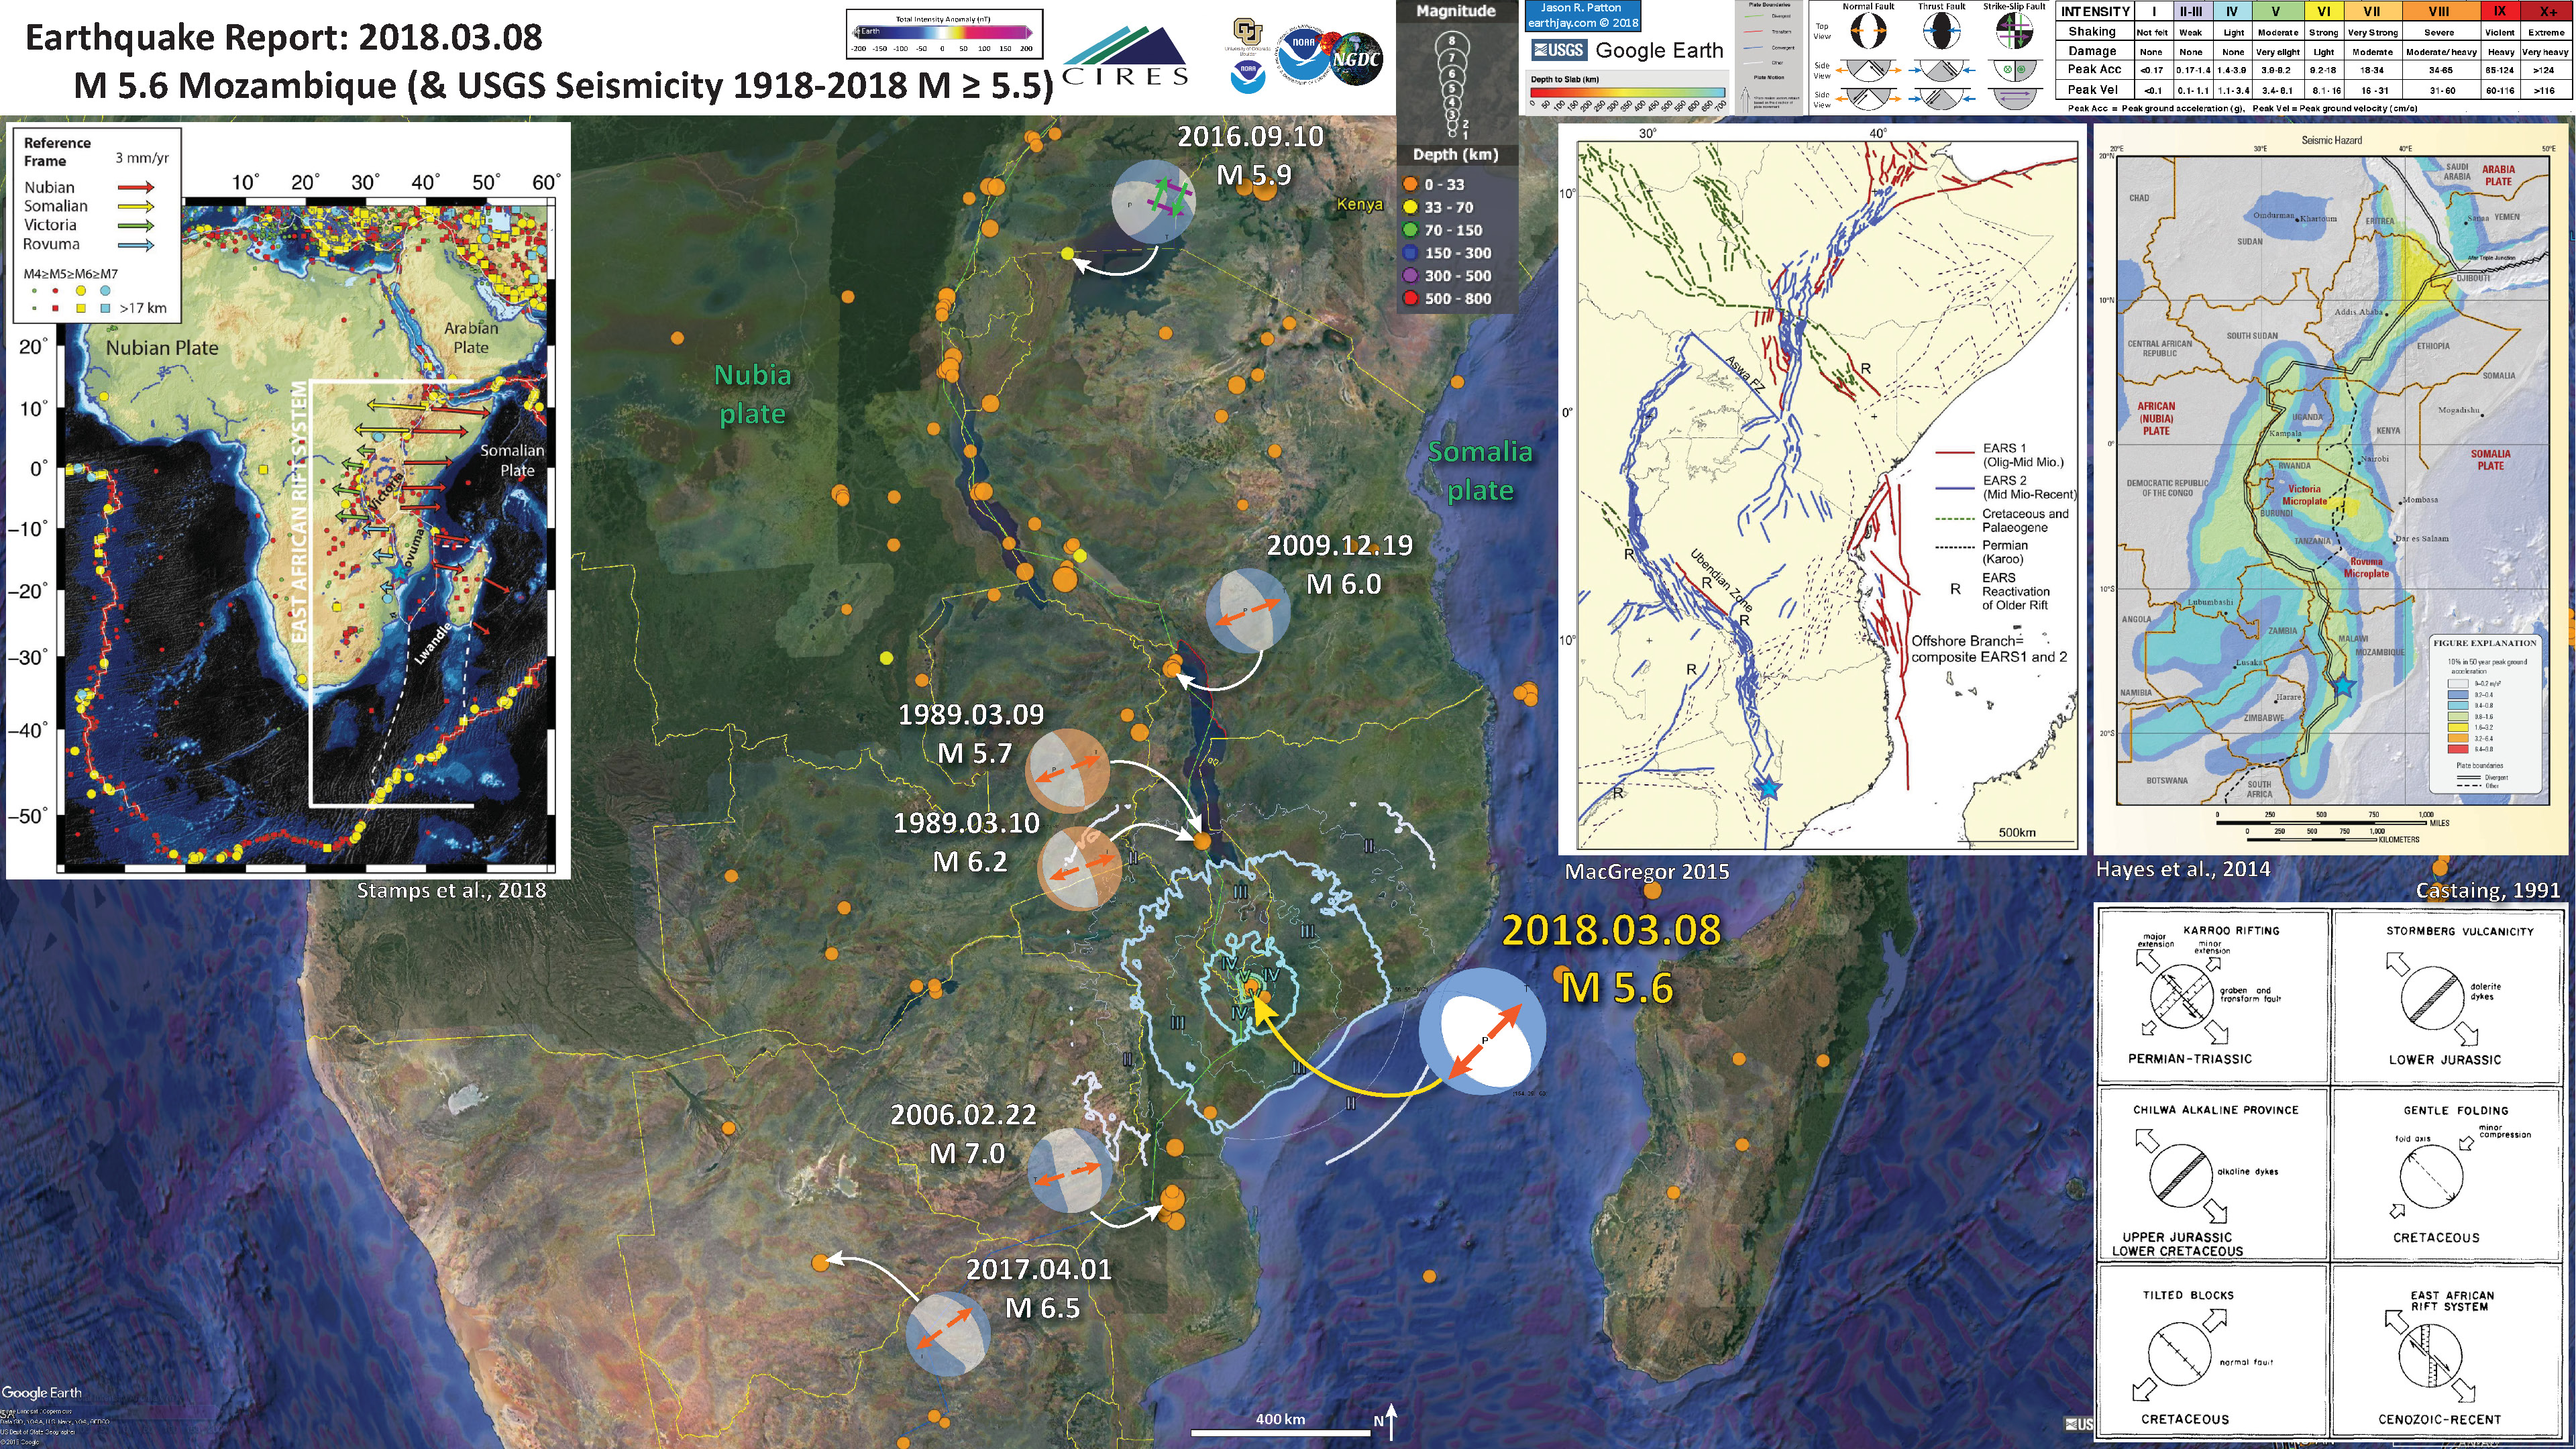
This report is about a M 5.6 earthquake along the Malawi Rift (MR) system, part of the larger East Africa Rift (EAR) extensional plate boundary. The EAR is currently the locus of extension between the Nubia and Somalia plates. The orientation of extension in this region has changed over time (for more on this, see Castaing, 1991). There are many normal faults that accommodate this extension (forming the rift valleys where so much paleoanthropologic evidence has been archived by rift volcanic deposits, and later exposed due to the extension). As the faults change strike (compass orientation), the type of faulting also changes (there are lots of strike-slip faults that have formed to accommodate the mismatch between fault strike and extension direction).
Today’s M 5.6 earthquake is extensional, showing extension in the northeast-southwest direction. At first, we might think that this is strange, since the predominant direction of extension is east-west. However, upon further investigation, we learn that the normal faults in the region of today’s earthquake have northwest strike (they are oriented northwest-southeast). So, northeast extension makes sense here.
There have been a number of earthquakes along the EAR and I include these in the poster. Links to the USGS websites are listed below.
Below is my interpretive poster for this earthquake
I plot the seismicity from the past month, with color representing depth and diameter representing magnitude (see legend). I include USGS earthquake epicenters from 1918-2018 with magnitudes M ≥ 5.5.
I plot the USGS fault plane solutions (moment tensors in blue and focal mechanisms in orange) for the M 5.6 earthquakes, in addition to some relevant historic earthquakes.
I include the magnetic anomaly data (emag 2).
- I placed a moment tensor / focal mechanism legend on the poster. There is more material from the USGS web sites about moment tensors and focal mechanisms (the beach ball symbols). Both moment tensors and focal mechanisms are solutions to seismologic data that reveal two possible interpretations for fault orientation and sense of motion. One must use other information, like the regional tectonics, to interpret which of the two possibilities is more likely.
- I also include the shaking intensity contours on the map. These use the Modified Mercalli Intensity Scale (MMI; see the legend on the map). This is based upon a computer model estimate of ground motions, different from the “Did You Feel It?” estimate of ground motions that is actually based on real observations. The MMI is a qualitative measure of shaking intensity. More on the MMI scale can be found here and here. This is based upon a computer model estimate of ground motions, different from the “Did You Feel It?” estimate of ground motions that is actually based on real observations.
-
I include some inset figures.
- In the upper left corner is a map from Stamps et al. (2018) that shows the relative plate motion across the plate boundaries. The length of these vectors represents relative velocity between the plate systems (designated by color). The EAR has been propagating to the south, and the GPS rates reflect this (faster in then north and slower in the south). I place a blue star in the general location of today’s earthquake (as in other inset maps).
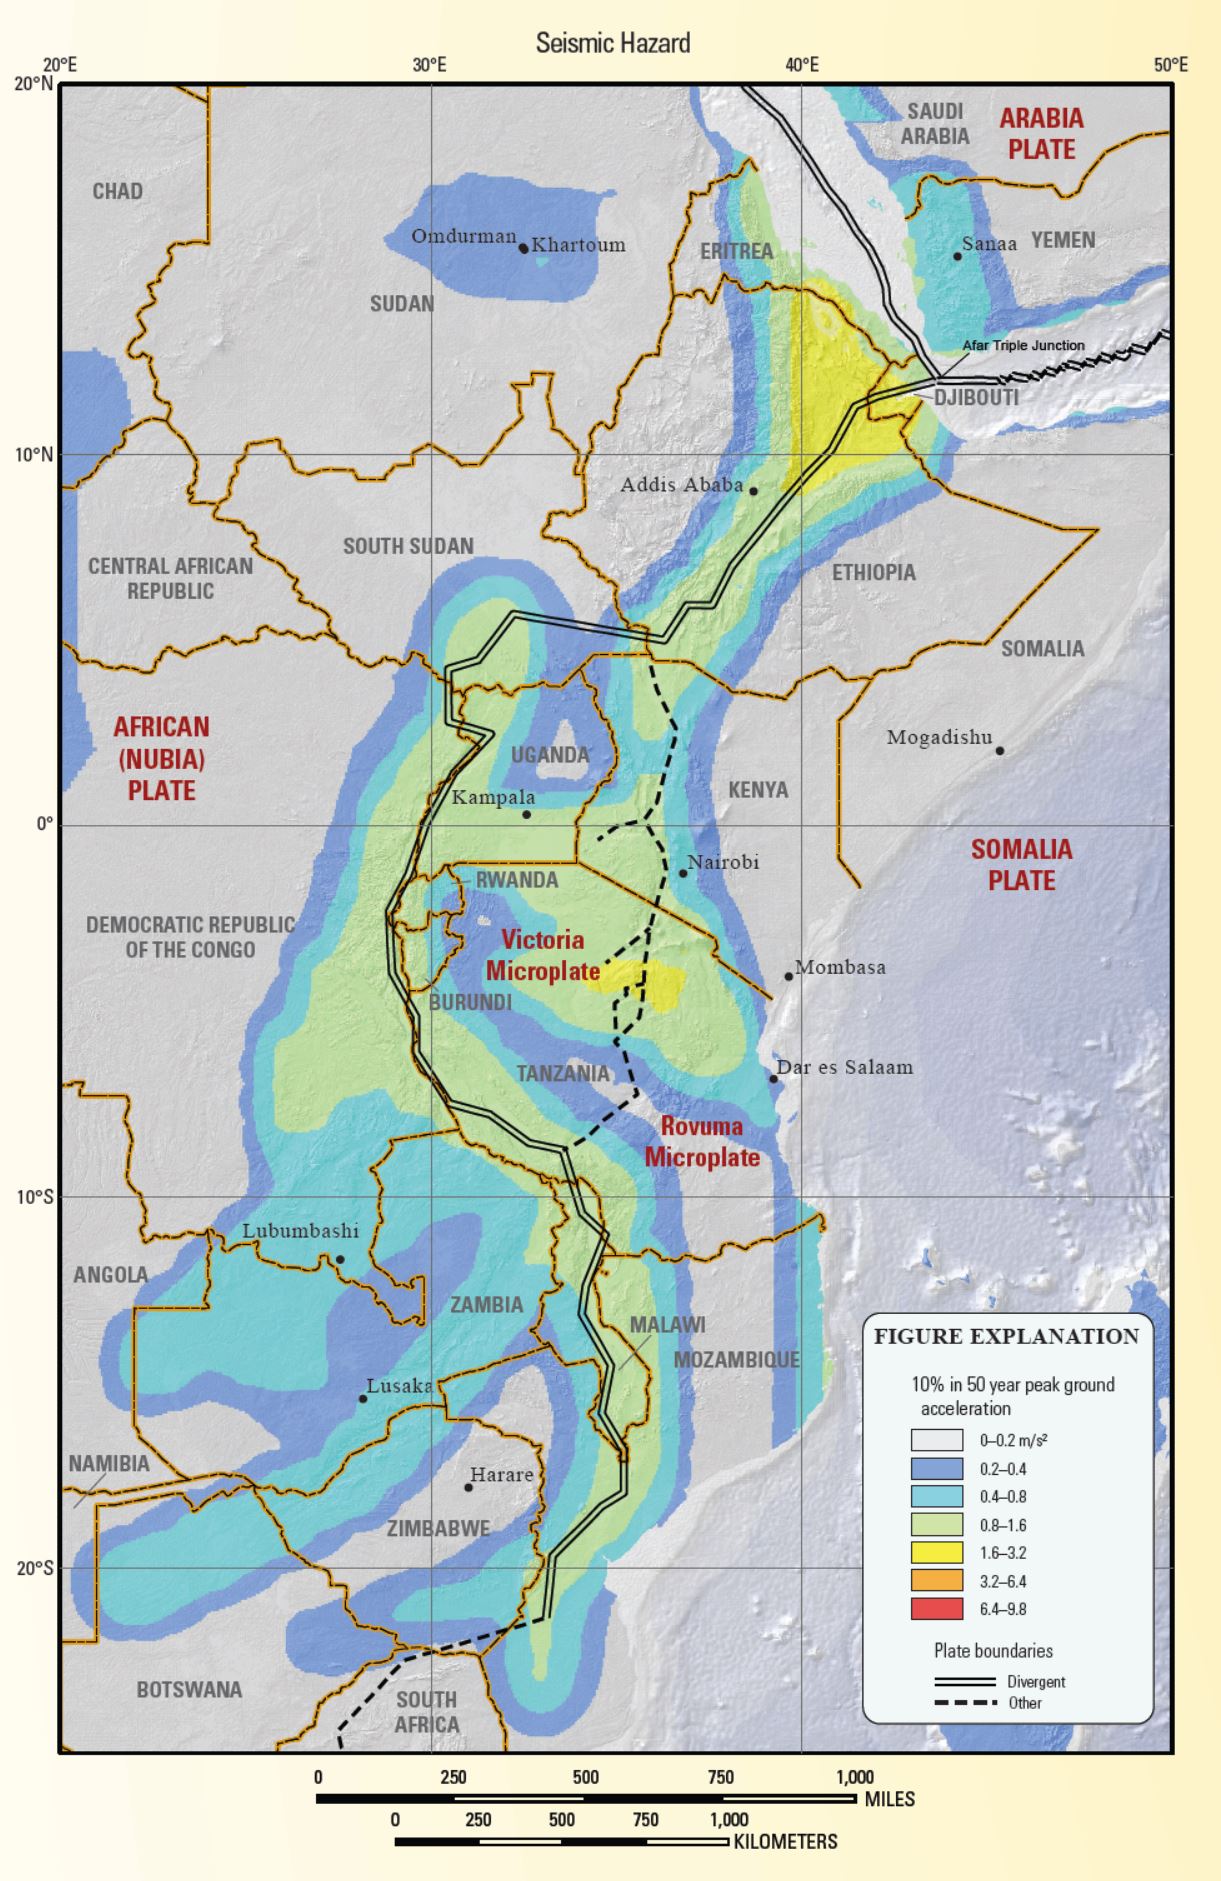
- In the upper right corner is a map from Hayes et al. (2014) that shows the heightened seismic hazard associated with the EAR.
- To the left of the seismic hazard map is a map showing faults colored relative to when they formed. This also shows how the EAR is propagating to the south.
- In the lower right corner is a graphic that illustrates how Castaing (1991) has interpreted the tectonic strain to have evolved through time. Note the lower right panel as this represents the Cenozoic to Recent tectonic setting.
USGS Earthquake Pages
- 2018.03.08 M 5.6 Malawi
These are from this current sequence
- 1989.03.09 M 5.7 Malawi
- 1989.03.10 M 6.2 Malawi
- 2006.02.22 M 7.0 Mozambiuque
- 2009.12.19 M 6.0 Malawi COMET page on this earthquake.
- 2016.09.10 M 5.9 Tanzania Earthquake Report Here.
- 2017.04.01 M 6.5 Botswana Earthquake Report Here. Dr. Stephen Hicks page on this earthquake.
These are from earlier
Some Relevant Discussion and Figures
- Here is the Stamps et al. (2018) figure. These authors describe their efforts to create the “Sub-Saharan Africa Geodetic Strain Rate Model v.1.0 (SSA-GSRM v.1.0).” They used GPS data to estimate strain rates for the EAR system.
- This map shows their interpretation of how much of the EAR is experiencing either extension or compression and their comparison with the GSRM existing model. The Stamps et al. (2018) model is on the left. The upper panel shows how their new model is sensitive to additional strain not observed in the GSRM model. The lower panel shows extension in warm colors and compression in cool colors.

Tectonic setting of Africa and the East African Rift System. OR = Okavangu Rift, LR = Luangua Rift, MR = Mweru Rift, EB = Eastern Branch, KP = Kivu Volcanic Province, CVL = Cameroon Volcanic Line. Earthquakes >M4 from the International Seismological Catalog29 are shown in different colors as well as relative plate motions from Saria et al.3, which are used to constrain long-term tectonic rigid plate motions. Figure was created by DSS using the open source software Generic Mapping Tools v5.2.1 supported by the National Science Foundation.
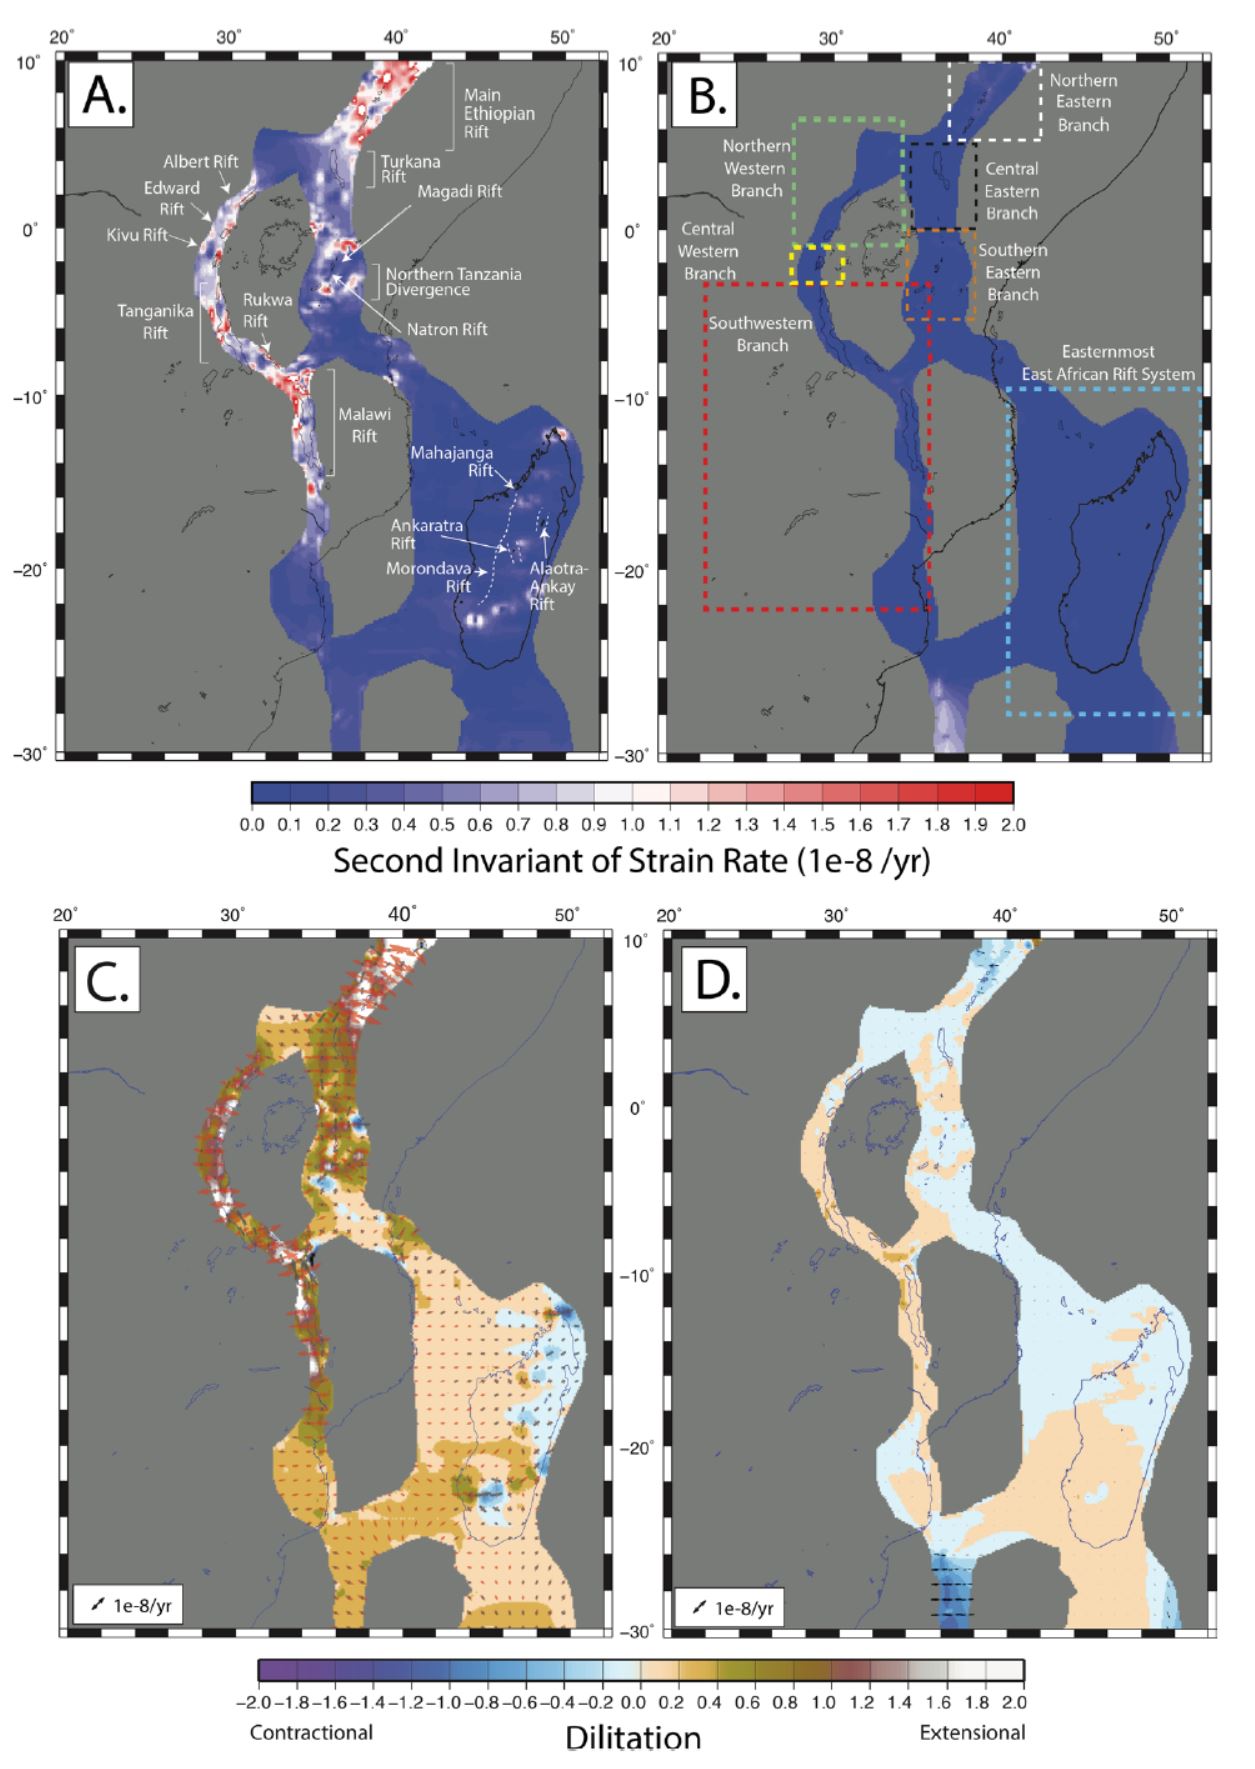
Geodetic strain rate second invariant and dilatation and comparison with GSRM v.2.1. (A) The second invariant of strain rate for the new long-term tectonic deformation model indicating magnitude. (B) Residual strain rate magnitudes relative to GSRM v2.1. (C) Dilatation indicating the dominantly compressional and extensional regimes. Tensor orientations are overlaid. Red = extension and black = compression. (C,D) Same as (C), but for residual strain rate tensors and dilatation.
- Here is the Hayes et al. (2014) seismic hazard map.
- Here is the Castaing (1991) figure that shows how the tectonics of the EAR has changed through time.
- This map shows some of the fault mapping in the region of todays earthquake (Castaing, 1991). Today’s earthquake happened due south of Lake Chilwa, possibly associated with the Cholo fault (tho they do not map the Cholo fault to the location of the USGS epicenter).
- This map shows the more recent faulting in the region (Castaing, 1991).
Stereograms showing successive stress fields in South Malawi
Reactivation of the Shire Valley area by the Recent East African Rift System (modified after Habgood, 1963; Pinna et al., 1987). I = Malawi-Mozambique border; 2 = ante-Cenozoic formations; S = Cenozoic to Recent deposits; 4 = dextral strike-slip faults; 5 = normal faults; 6 = strike-slip fault with normal component.

Recent East African Rift System {modified after Chorowicz, 1989; Chorowicz and Mukonki. 1980; Chorowicz et al., 1983, 1987; Daly et al., 1989; Ebinger et al., 1987; Katz, 1987; Kazrnin, 1980; McConnel, 1972; Rach and Rosendahl, 1989; Rosendahl, 1987; Villeneuve, 1983; Wheeler and Karson, 1989). I = Rift boundary normal faults; 2 = pre-transform faults; = Cenozoic and Recent volcanics; 4 = Cenozoic granites; 5 = direction of extension (a = Lengwe and Mwabvi basins-present study and focal mechanism solution of 6 May 1966 earthquake from Shudofsky (1985), b-h = microtectonic observations between Lake Edward and Lake Malawi from Chorowicz (1989) and Chorowicz and Mukonki (1980)); 6 = general extension.
- Regions of extension (Saemundsson, 2010). I include the original figure captions below them as blockquotes.
- Fault segments along the EAR, Chorowicz (2005).
- Faults characterized vs. their major sense of motion, Chorowicz (2005).
- Regional tectonic strain, Chorowicz (2005).
- This is an illustration showing how the extension in this region may be accommodated by dextral (right-lateral) strike-slip faults, Chorowicz (2005).

The Afro-Arabian rift system (continental graben and depressions are shaded) (From: Baker et al., 1972)

Hypsographic DEM of the East African rift system. Black lines: main faults; E–W dotted lines: locations of cross-sections of Fig. 3; white surfaces: lakes; grey levels from dark (low elevations) to light (high elevations). The East African rift system is a series of several thousand kilometers long aligned successions of adjacent individual tectonic basins (rift valleys), separated from each other by relative shoals and generally bordered by uplifted shoulders. It can be regarded as an intra-continental ridge system comprising an axial rift.

Western branch and part of eastern branch of the East African rift system, on shadowed DEM.

On-going individualization of the Somalian plate in Eastern Africa. Asthenospheric intrusions (black polygons) show already open lithosphere. White arrows show direction of relative divergent movement.

Fault and fold zone of the Tanganyika–Rukwa–Malawi segment of the EARS. Folds are developed in stripes between left-stepping en echelon dextral strike-slip faults. This pattern of folds explains why some segment border areas of the Tanganyika rift form low plains instead of the usual high shoulders.
- Here is the USGS “Seismicity of the Earth” poster for this region (Hayes et al., 2014).
- This is the latest geologic maps of Africa (Thieblemont, D., 2016). Click on the map for a 67 MB pdf version.
Geologic Fundamentals
- For more on the graphical representation of moment tensors and focal mechnisms, check this IRIS video out:
- Here is a fantastic infographic from Frisch et al. (2011). This figure shows some examples of earthquakes in different plate tectonic settings, and what their fault plane solutions are. There is a cross section showing these focal mechanisms for a thrust or reverse earthquake. The upper right corner includes my favorite figure of all time. This shows the first motion (up or down) for each of the four quadrants. This figure also shows how the amplitude of the seismic waves are greatest (generally) in the middle of the quadrant and decrease to zero at the nodal planes (the boundary of each quadrant).

- There are three types of earthquakes, strike-slip, compressional (reverse or thrust, depending upon the dip of the fault), and extensional (normal). Here is are some animations of these three types of earthquake faults. The following three animations are from IRIS.
Strike Slip:
Compressional:
Extensional:
Social Media
This morning's #MalawiEarthquake seems to have occurred on a southeastern segment of the Thyolo Fault within the Shire Graben, southern Malawi Rift. Map is from Castaing (1991). Yellow line represents fault interpretation from google earth pic.twitter.com/SAJ5jPeUNm
— Folarin Kolawole (@fracturedfola) March 8, 2018
Another accepted journal article from my MSc research, & 1 more still under prep. They really are never ending!This one is on the multiscale structure of a buried fault that ruptured a M6 eq, revealed by the integration of electrical & aeromagnetic imaging https://t.co/gUnq6alsDo pic.twitter.com/aTBNQP1Clr
— Folarin Kolawole (@fracturedfola) February 26, 2018
The US Geological Survey @USGSted has these maps showing details of the earthquake felt in Malawi a few minutes ago.
It was centred just north east of #Nsanje (therefore over the border in Mozambique).
Felt in #Blantyre #Mulanje #Zomba #Nchalo pic.twitter.com/5P9OyvW7cD
— Malawi Places (@esafrican) March 8, 2018
Earthquake hits southern Malawi pic.twitter.com/fDIPTHB88B
— Simba Bonomali (@BonomaliSimba) March 8, 2018
PRESS RELEASE
Earthquake Occurrence in Nsanje District pic.twitter.com/SnoimZz3WC
— Malawi Government (@MalawiGovt) March 8, 2018
Nsanje earthquake "measured 5.4 on the Richter scale, has damaged a house belonging to Mr. and Mrs Kamfumbi of Lambwe Village, T/A Malemia" via Dpt of Disaster Mgt Affairs on Facebook #Malawi pic.twitter.com/qVVhWpCPGx
— Agnes Mizere (@amizere) March 8, 2018
Evacuation during the first of today's (mini) earthquakes.#earthquake #malawi https://t.co/HfQvKsdSFP pic.twitter.com/22xCP6XJhc
— Ben Turner (@AdventuresofBT) March 8, 2018
- 2018.03.08 M 5.6 Mozambique and Malawi
- 2017.04.03 M 6.5 Botswana
- 2016.9.10 M 5.7 Tanzania
Africa
Earthquake Reports
- Baker, B.H., Mohr P.A., and Williams, L.A.J., 1972: Geology of the Eastern Rift System of Africa in The Geol. Soc. of America. Special Paper, 136, 67 pp.
- Castaing, C., 1991. lost-Pan-African tectonic evolution of South Malawi in relation to the Karroo and Recent East African Rift Systems in Tectonophysics, v. 191, p. 55-73
- Chorowicz, J., 2005. The East African rift system in Journal of African Earth Sciences, v. 43., p. 379-410.
- Hayes, G.P., Jones, E.S., Stadler, T.J., Barnhart, W.D., McNamara, D.E., Benz, H.M., Furlong, K.P., and Villaseñor, Antonio, 2014. Seismicity of the Earth 1900–2013 East African Rift: U.S. Geological Survey Open-File Report 2010–1083-P, 1 sheet, scale 1:8,500,000 http://dx.doi.org/10.3133/of20101083P
- Leseane, K., Atekwana, E.A., Mickus, K.L., Abdelsalam, M.G., Shemanq, E.M., and Atekwana, E.A., 2015. Thermal perturbations beneath the incipient Okavango Rift Zone, northwest Botswana in JGR: Solid Earth, v. 120, doi:10.1002/2014JB011029.
- Saemundsson, K., 2010. East African Rift System – an Overview presented at Short Course V on Exploration for Geothermal Resources, organized by UNU-GTP, GDC and KenGen, at Lake Bogoria and Lake Naivasha, Kenya, Oct. 29 – Nov. 19, 2010, 10 pp.
- Stamps, D.S., Saria, E., and Kreemer, C., 2018. A Geodetic Strain Rate Model for the East African Rift System in Scientific Reports, v. 8, DOI:10.1038/s41598-017-19097-w
- Thieblemont, D. (ed.), 2016. Geological Map of Africa et 1:10M scale, CGMW-BRGM 2016