
Updated map below. See additional more updated information about Gorda plate earthquakes in the Earthquake Report for the 10 January 2010 M 6.5 earthquake here.
That was exciting. I counted over 40 seconds of motion in Manila. This is a wake up call for all of us, including me.
Check back here for updates. I am posting some basic material to begin with. We had another earthquake in this region last year. Here is a page i put together for that earthquake.
Don’t forget to get to the USGS online to fill out the “Did You Feel It?” form. The information provided helps geologists and seismologists learn about the ground shaking response for earthquakes in this region. They also can apply this information elsewhere (in some ways).
https://earthquake.usgs.gov/earthquakes/eventpage/nc72182046/executive
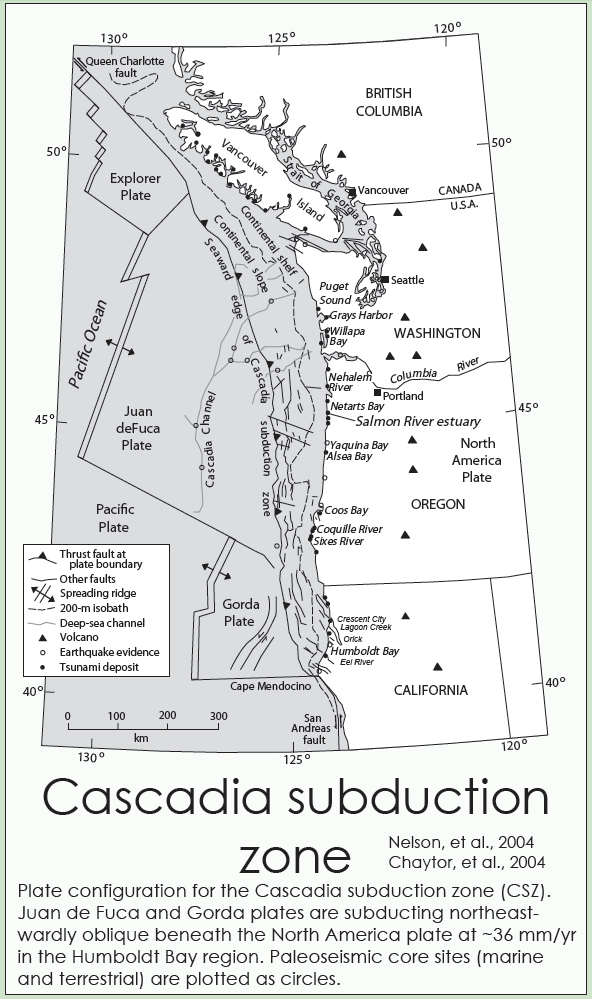
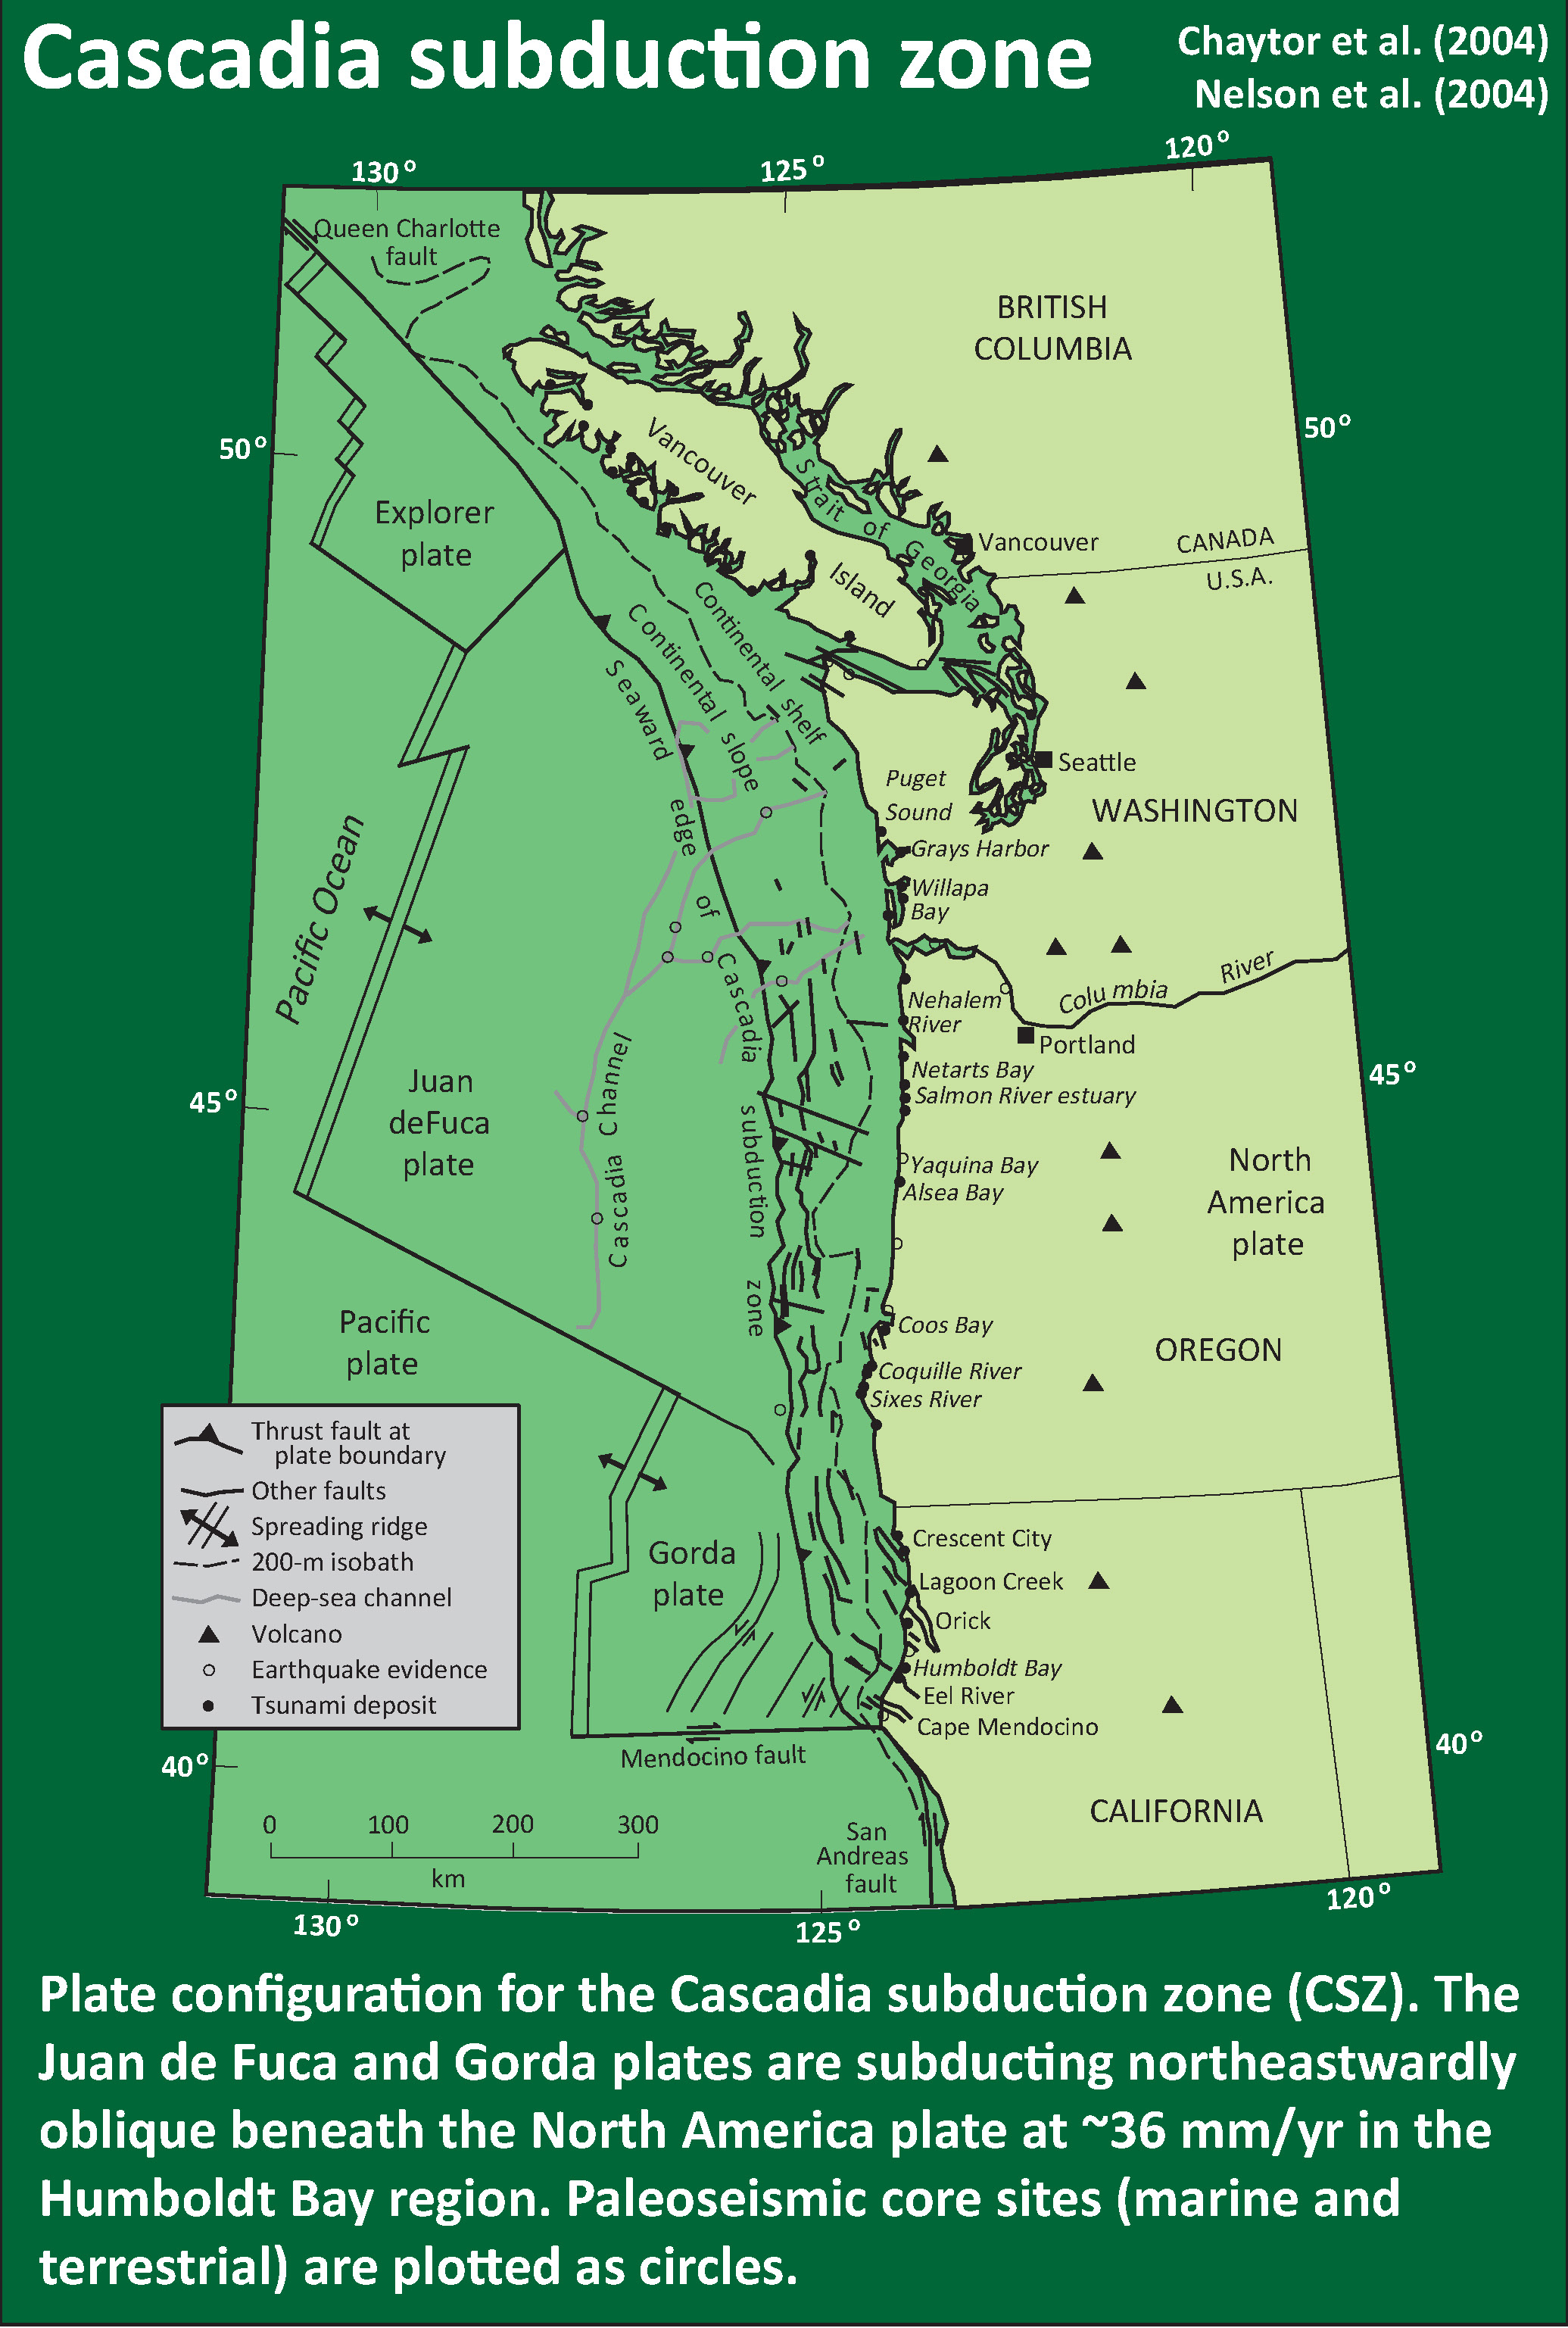
The Cascadia subduction zone is formed where the Gorda and Juan de Fuca plates subduct northeastward beneath the North America plate. Here is a figure that Alan Nelson put together. I have updated it with material from Jason Chaytor’s 2004 paper.
This is most likely an earthquake in the underlying Gorda plate. The Gorda is losing the battle between the JdF plate to the north and the Pacific plate to the south, both of which are colder, older, and more dense (basically, they form a vise that is squeezing Gorda so much that it deforms internally). This internal deformation results in the formation of left lateral strike slip faults in the southern GP that form on preexisting faults (originally formed at the Gorda rise, where the Gorda plate crust is created).
Here is a map of the epicenter, about 70 km west of eureka: 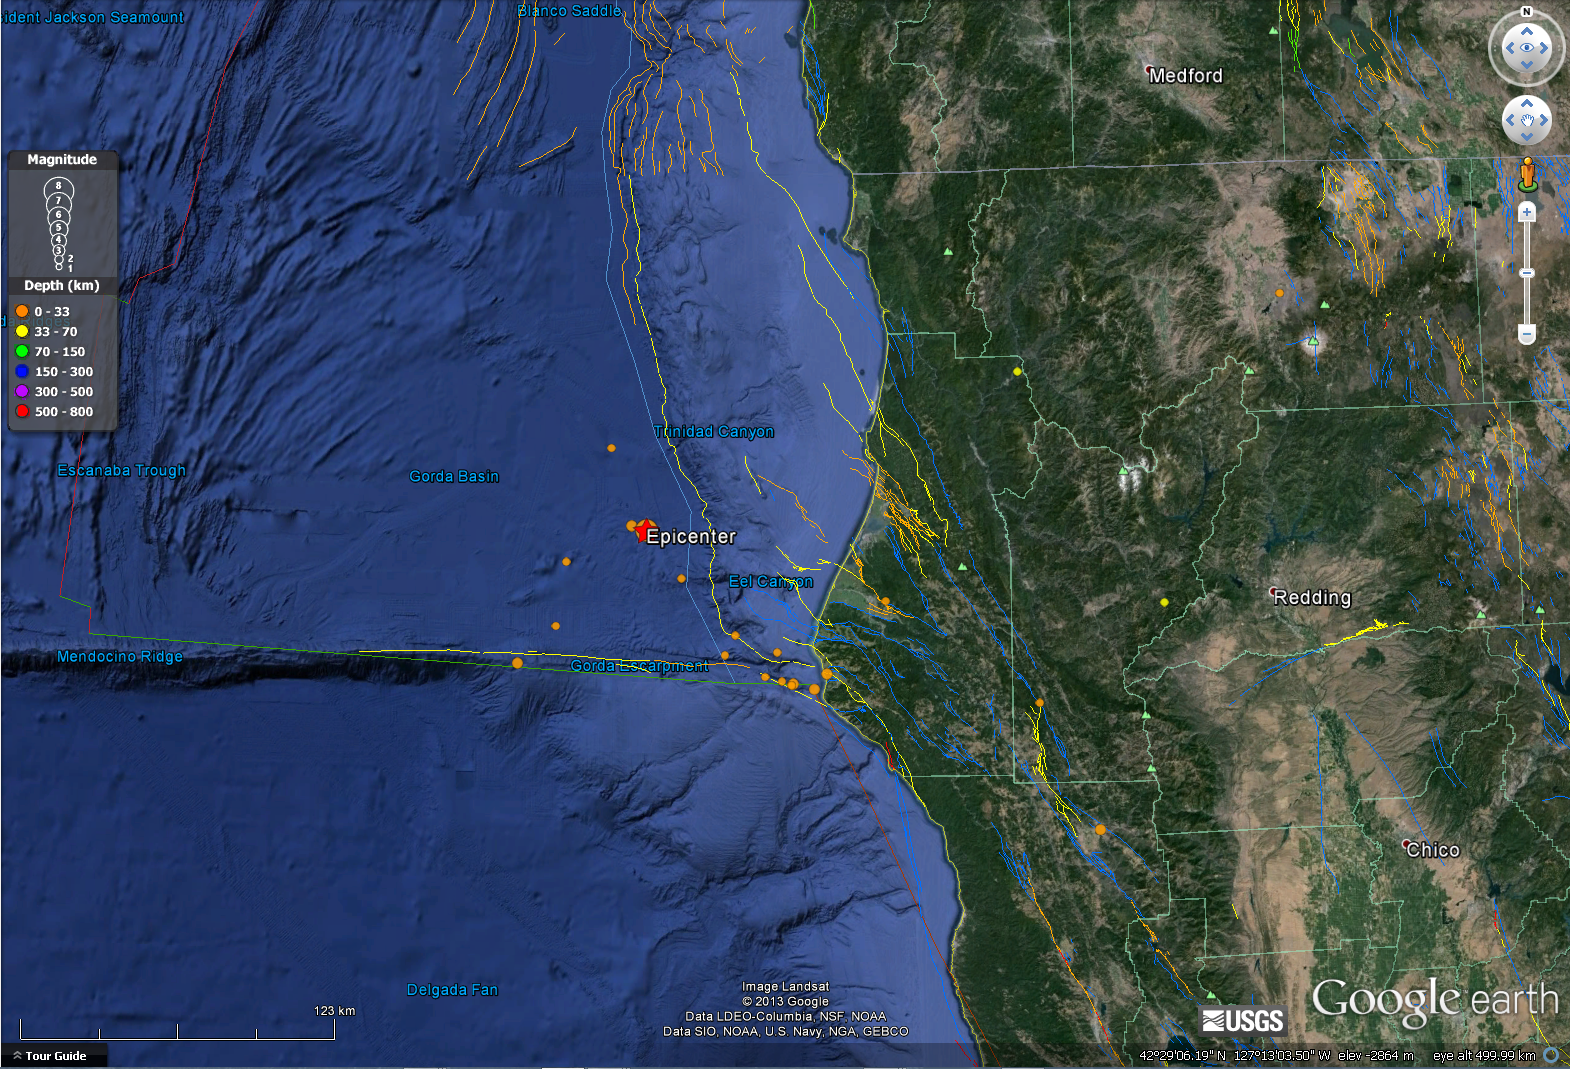
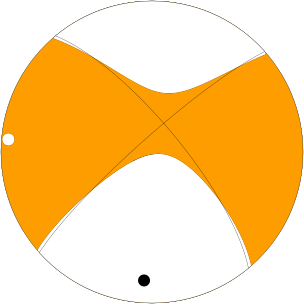
This is the moment tensor, which shows it is either a northeast striking left-lateral strike slip earthquake or a southeast striking right lateral strike slip earthquake. Given what we know about the regional tectonics, I would interpret this to be a left lateral earthquake. It plots just southwest of the 1980 M 7.2 Trinidad earthquake. There was a focal mechanism earlier that matched this moment tensor and then a later focal mechanism that was incorrect. I have removed both of them as the moment tensor is a more reliable measure of the sense of motion on the fault.
Here is a map showing historic seismicity. The largest circle to the northeast of the epicenter in orange is the 1980 Trinidad earthquake. 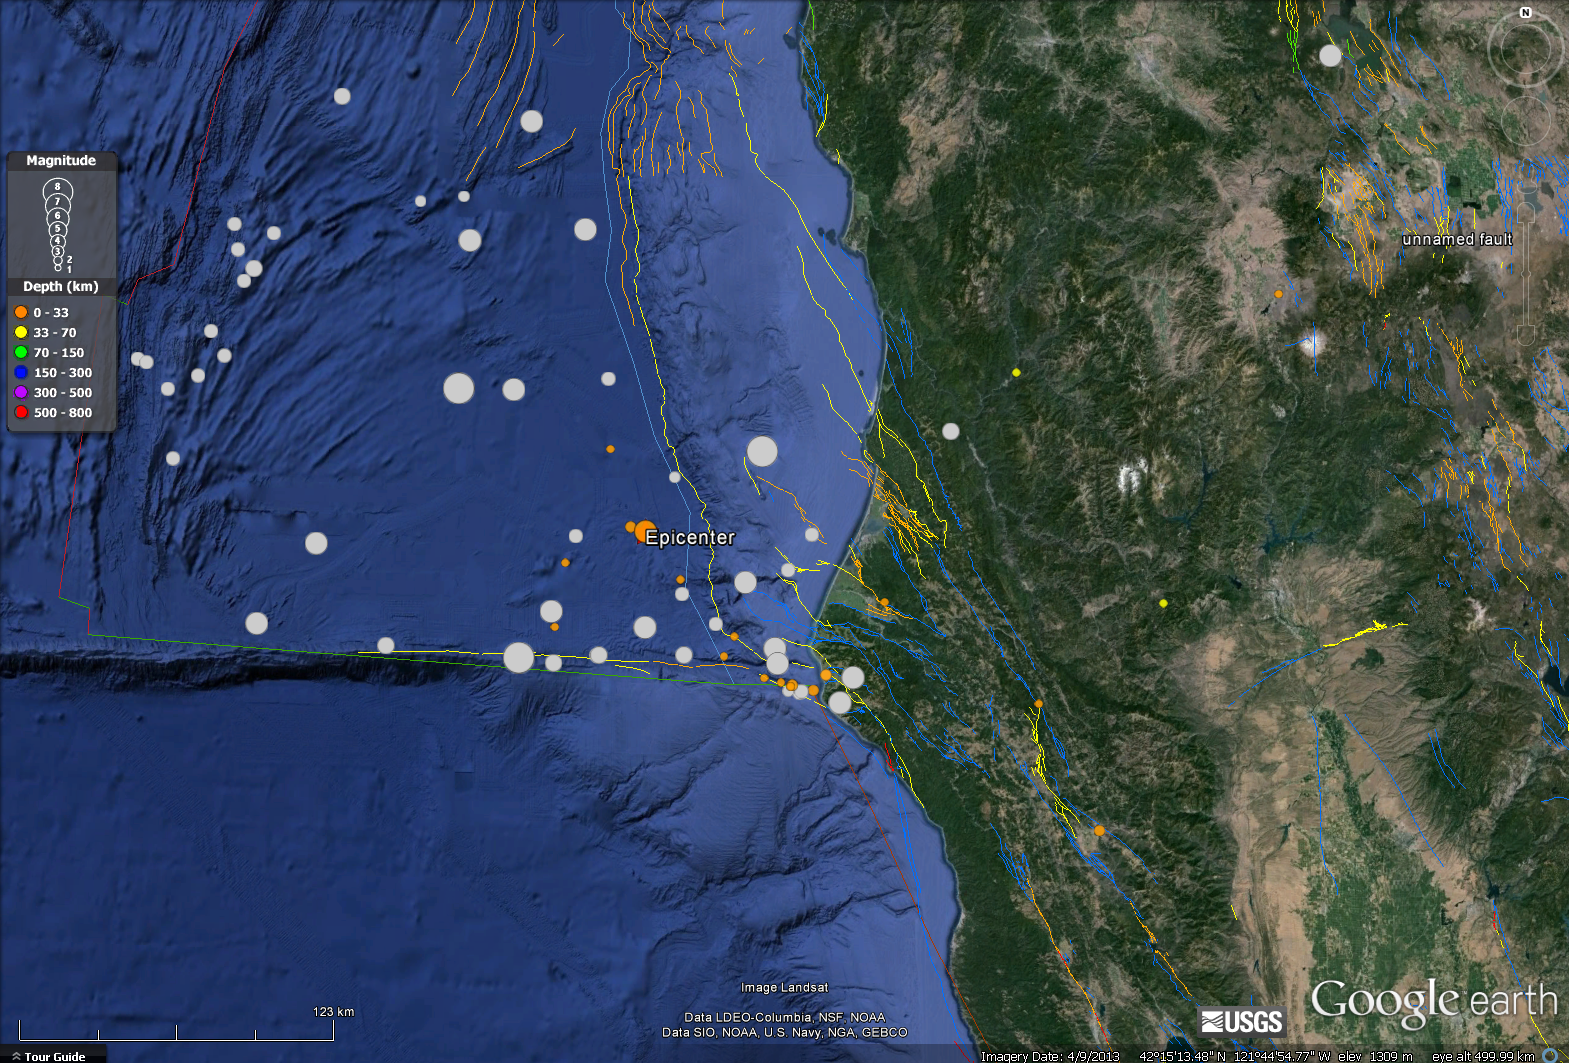
Here is a map from Rollins and Stein (2010) showing the faults and tectonics of the Gorda plate. Today’s M 6.9 is probably somewhere in the right step of the dashed fault labeled “B.” 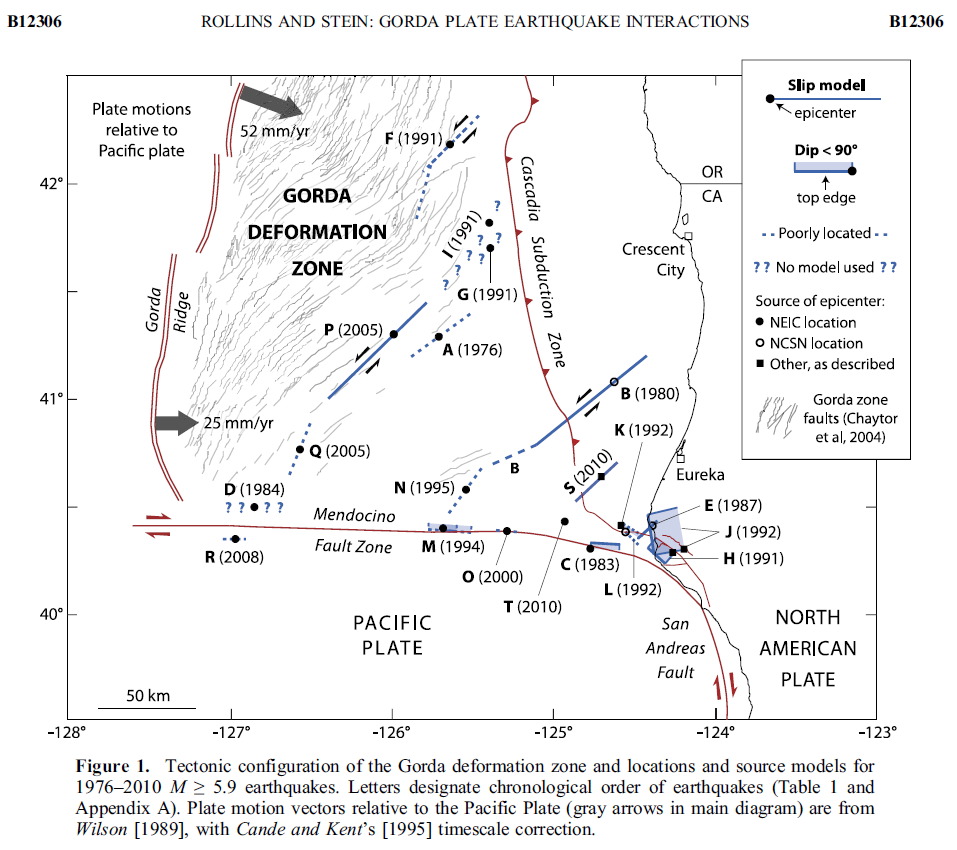
Here is the seismograph from Jamie Shuttmutt (downloaded from here) 
Here is the seismograph from HSU dept. of Geology as taken by Jamie Shuttmutt 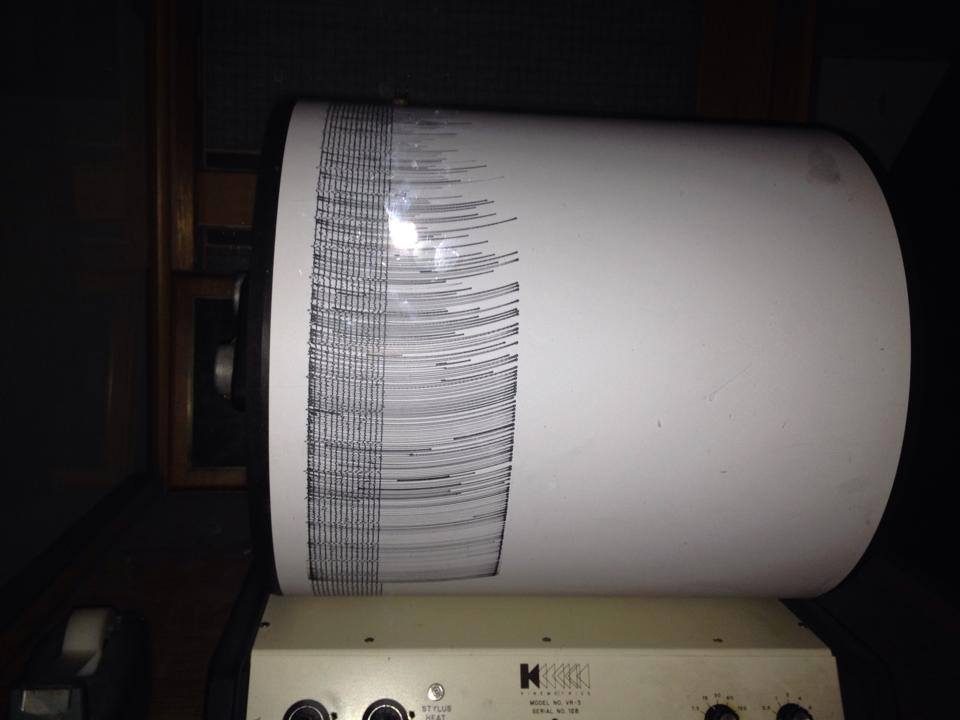
Here is the seismograph from the UC Berkeley Jacoby Creek seismometer, posted by Lori Dengler: 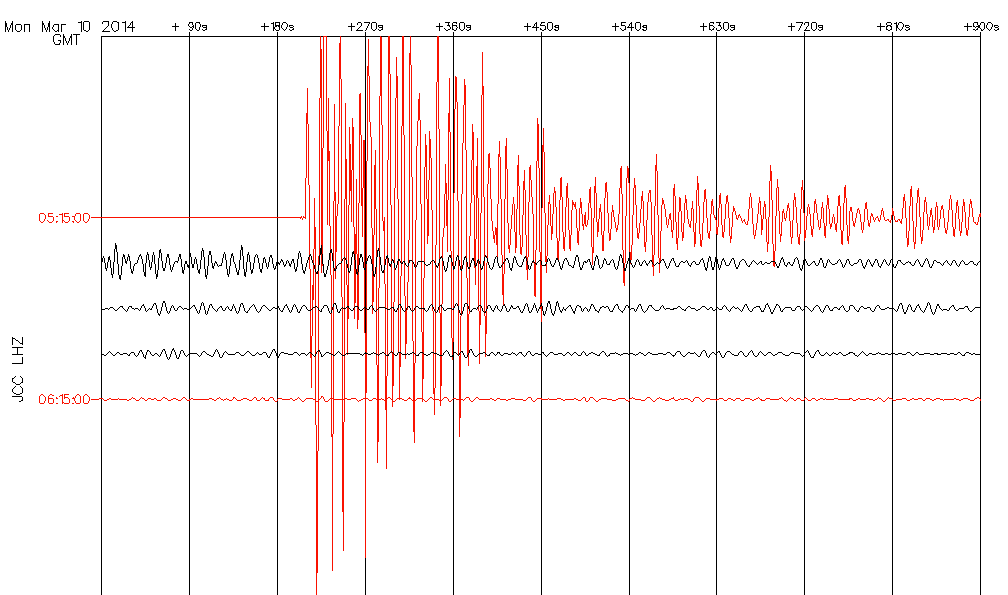
Here is a map showing the Modified Mercalli Shaking Intensity for the region. The contours and color over land have the same color scale. Note the increased shaking in the Humboldt Bay region. This is probably the result of the underlying material here (sediments vs bedrock). 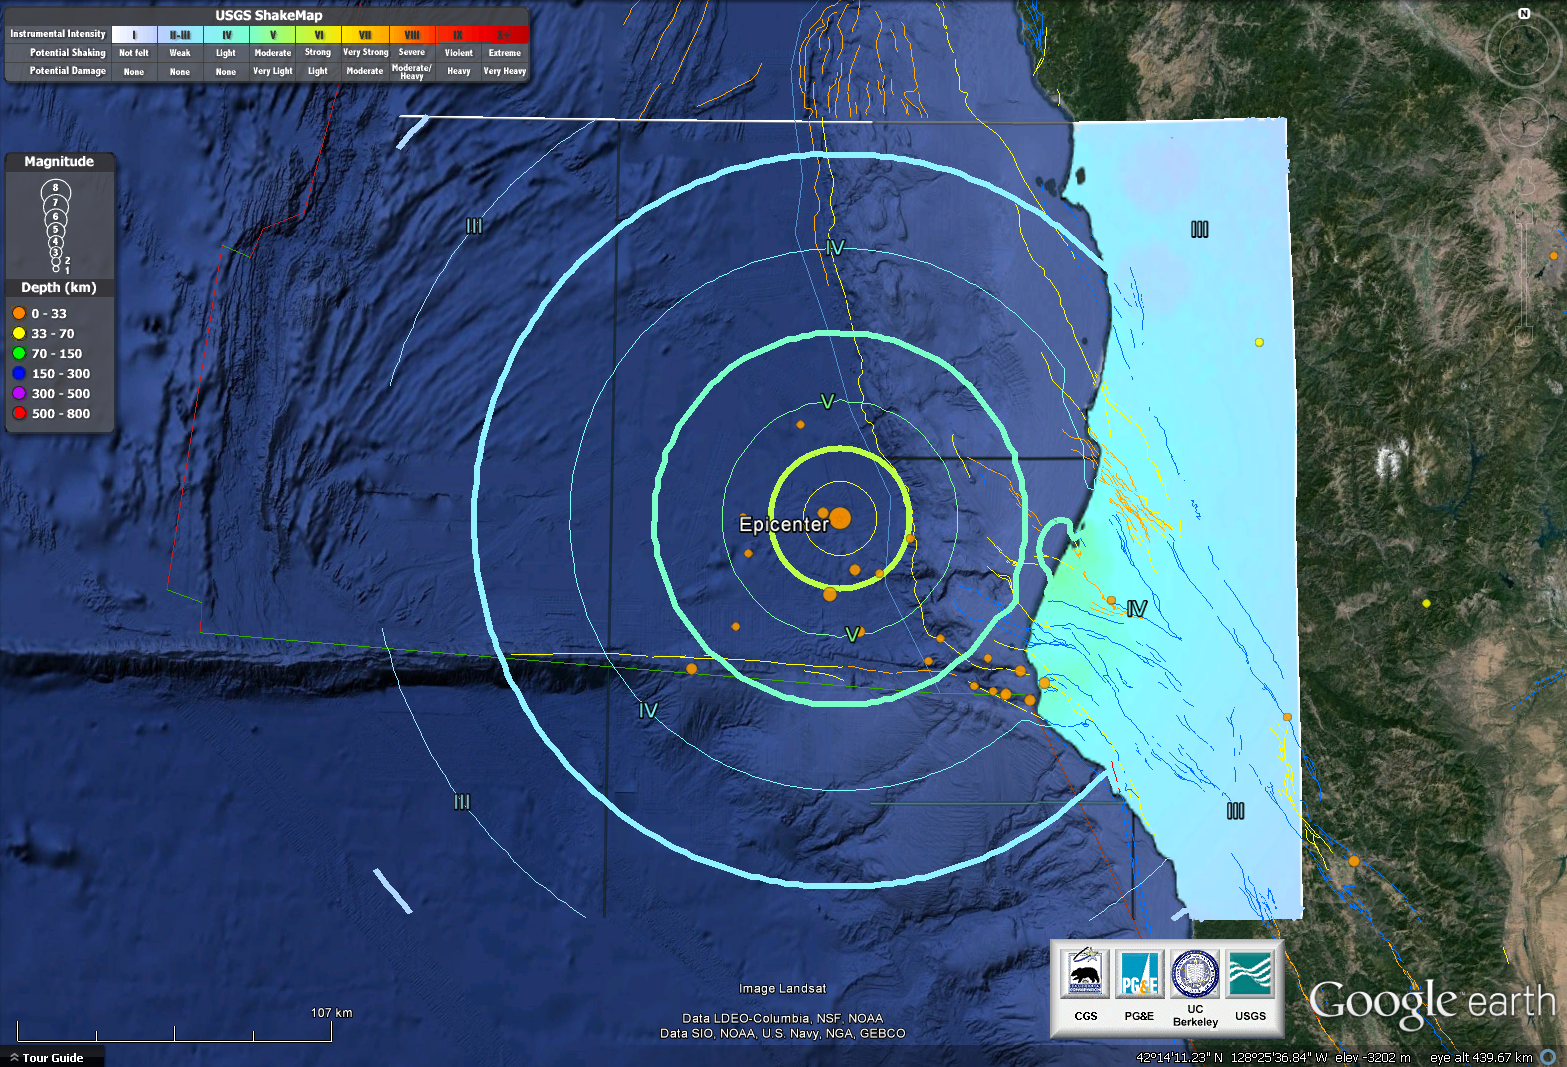
Here is the shakemap, with colors designating the Modified Mercalli Shaking Intensity (scale bar in the legend): 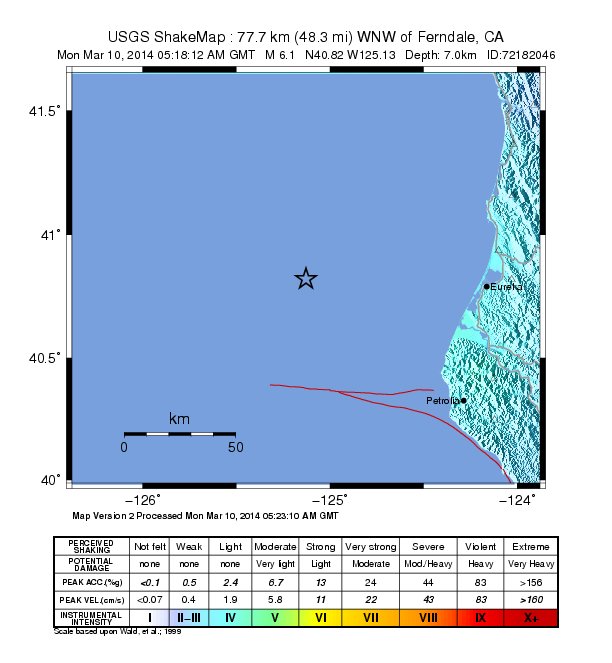
This is the map of shaking intensity which changes as more people fill out their “Did You Feel It” (link above): 
Here is the map from the Southern California Earthquake Center (SCEC). There are several aftershocks in red. There was a M3.3 foreshock. The aftershocks appear to align with the northeast striking faults in this region of the Gorda plate. These are likely triggered earthquakes on different faults than the mainshock (so may not be considered aftershocks, but triggered seismicity). 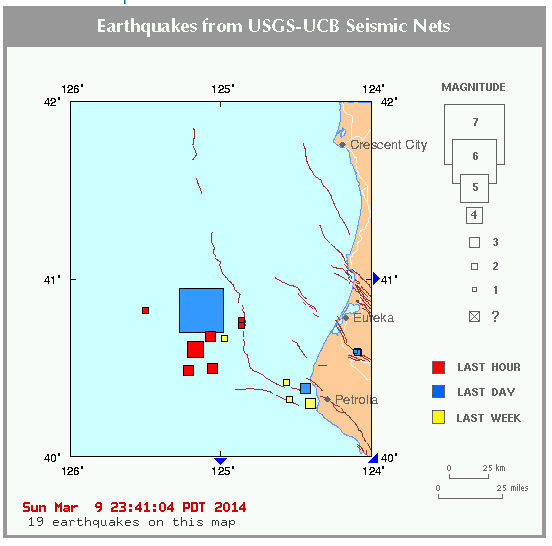
Here is a primer for the different types of earthquake faults: 
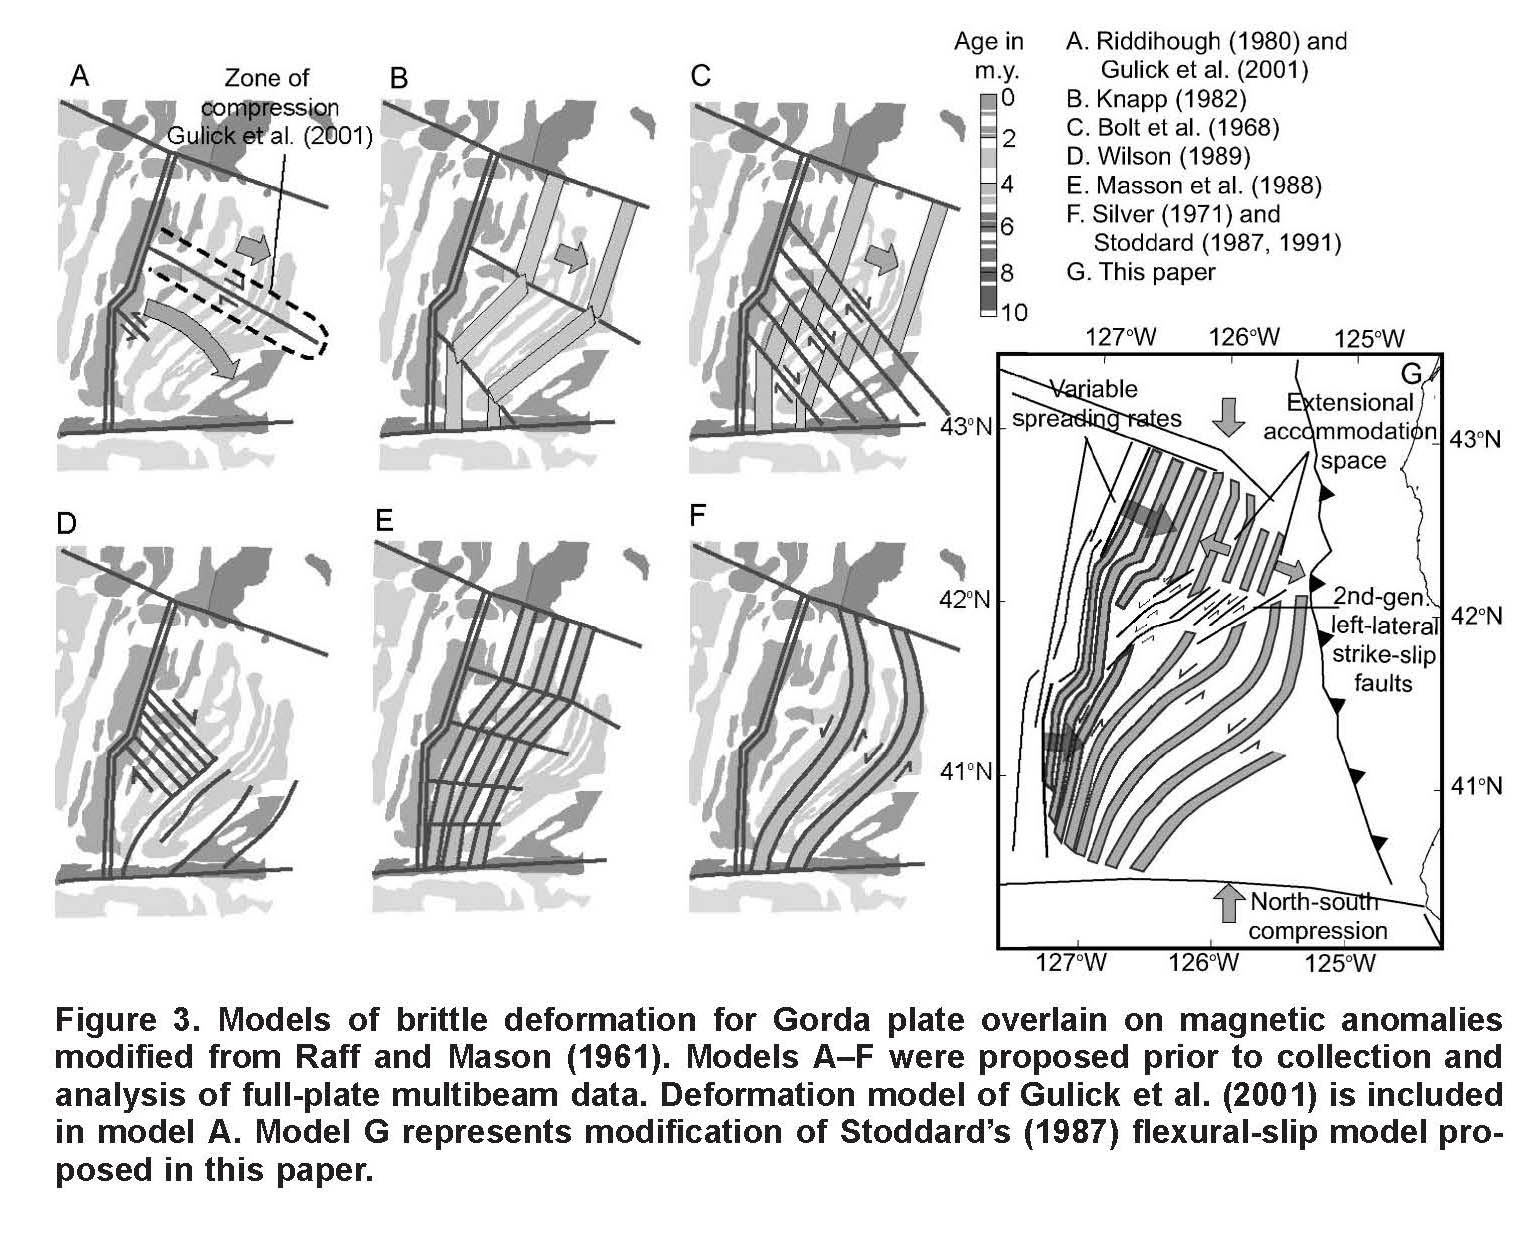
These are the models for tectonic deformation within the Gorda plate as presented by Jason Chaytor in 2004.
Here is the pager information (shows the potential exposure, economic or human, to the ground shaking). 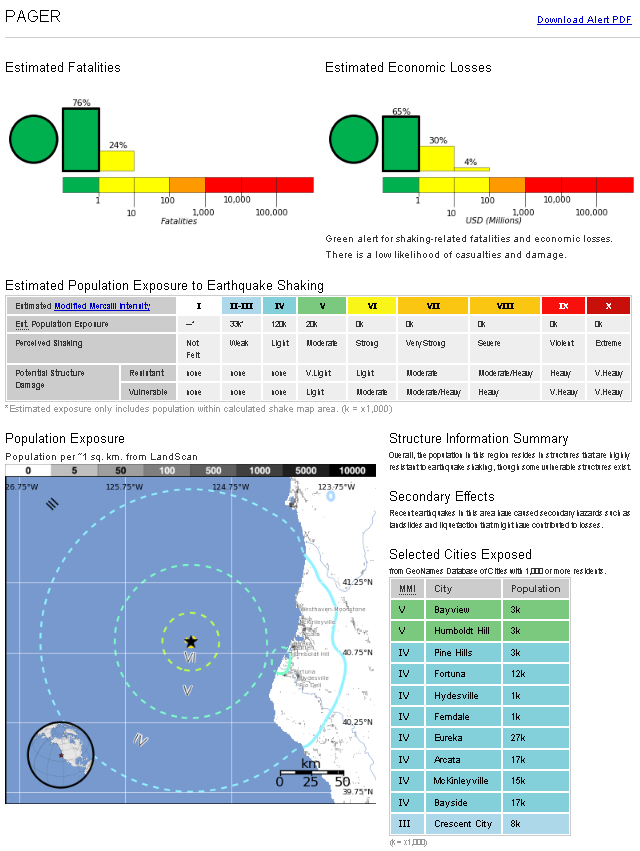
UPDATE 2023.03.09
The Updated Earthquake Report
This earthquake is in a tectonically complicated region of the western United States, the Mendocino triple junction. Here, three plate boundary fault systems meet (the definition of a triple junction): the San Andreas fault from the south, the Cascadia subduction zone from the north, and the Mendocino fault from the west. These plate boundary fault systems all overlap like fingers do when we fold our hands together.
The Cascadia subduction zone is a convergent (moving together) plate boundary where the Gorda and Juan de Fuca plates dive into the Earth beneath the North America plate. The fault formed here is called the megathrust subduction zone fault. Earthquakes on subduction zone faults generate the largest magnitude earthquakes of all fault types and also generate tsunami that can impact the local area and also travel across the ocean to impact places elsewhere. The most recent known Cascadia megathrust subduction zone fault earthquake was in January 1700.
The San Andreas and Mendocino fault systems are strike-slip (plates move side by side) fault systems. Many are familiar with the 1906 San Francisco Earthquake.
While the largest source of annual seismicity are intraplate Gorda plate earthquakes, the two largest contributors to seismic hazards in California are the Cascadia subduction zone (CSZ) and the San Andreas fault (SAF) systems. These sources overlap in the region of the Mendocino triple junction (MTJ) and may interact in ways we are only beginning to understand as evidenced by the 2016 M7.8 Kaikōura earthquake in New Zealand (Clark et al., 2017 Litchfield et al., 2018), which occurred along a similar subduction/transform boundary, and included co-seismic rupture of more than 20 faults.
The M 6.8 earthquake was a left-lateral strike-slip earthquake within the Gorda plate (an intra plate earthquake).
One thing people almost always ask is about whether or not there is a higher chance that there will be a Cascadia subduction zone earthquake. This is currently impossible to tell. However, we can make some estimates of how forces within the Earth might have changed after a given earthquake. There was a Gorda plate earthquake sequence in 2018 that allowed us to consider these changes in the crust to see if the megathrust was brought more close to rupture. Here is the report from that Gorda plate earthquake sequence.
I plot aftershocks and triggered earthquakes from both the 2014 (in green) and the 2010 (in blue) earthquake sequences. Each sequence includes primary rupture on northeast striking strike-slip faults within the Gorda plate. I place dashed lines roughly where these faults are.
I also interpret additional faults that appear to have slipped during these sequences. There is one fault for the 2010 sequence and two faults for the 2014 sequence. Those of you who are familiar with the 2012 Wharton Basin earthquakes would have these examples in your mind when you look at the interpretive poster below.
I never noticed these before but after working on similar seismicity trends following the 1992 Cape Mendocino and 2022 False Cape (Ferndale) earthquake sequences. We are learning more and more with each earthquake sequence. Stay tuned for more on these fault interactions.
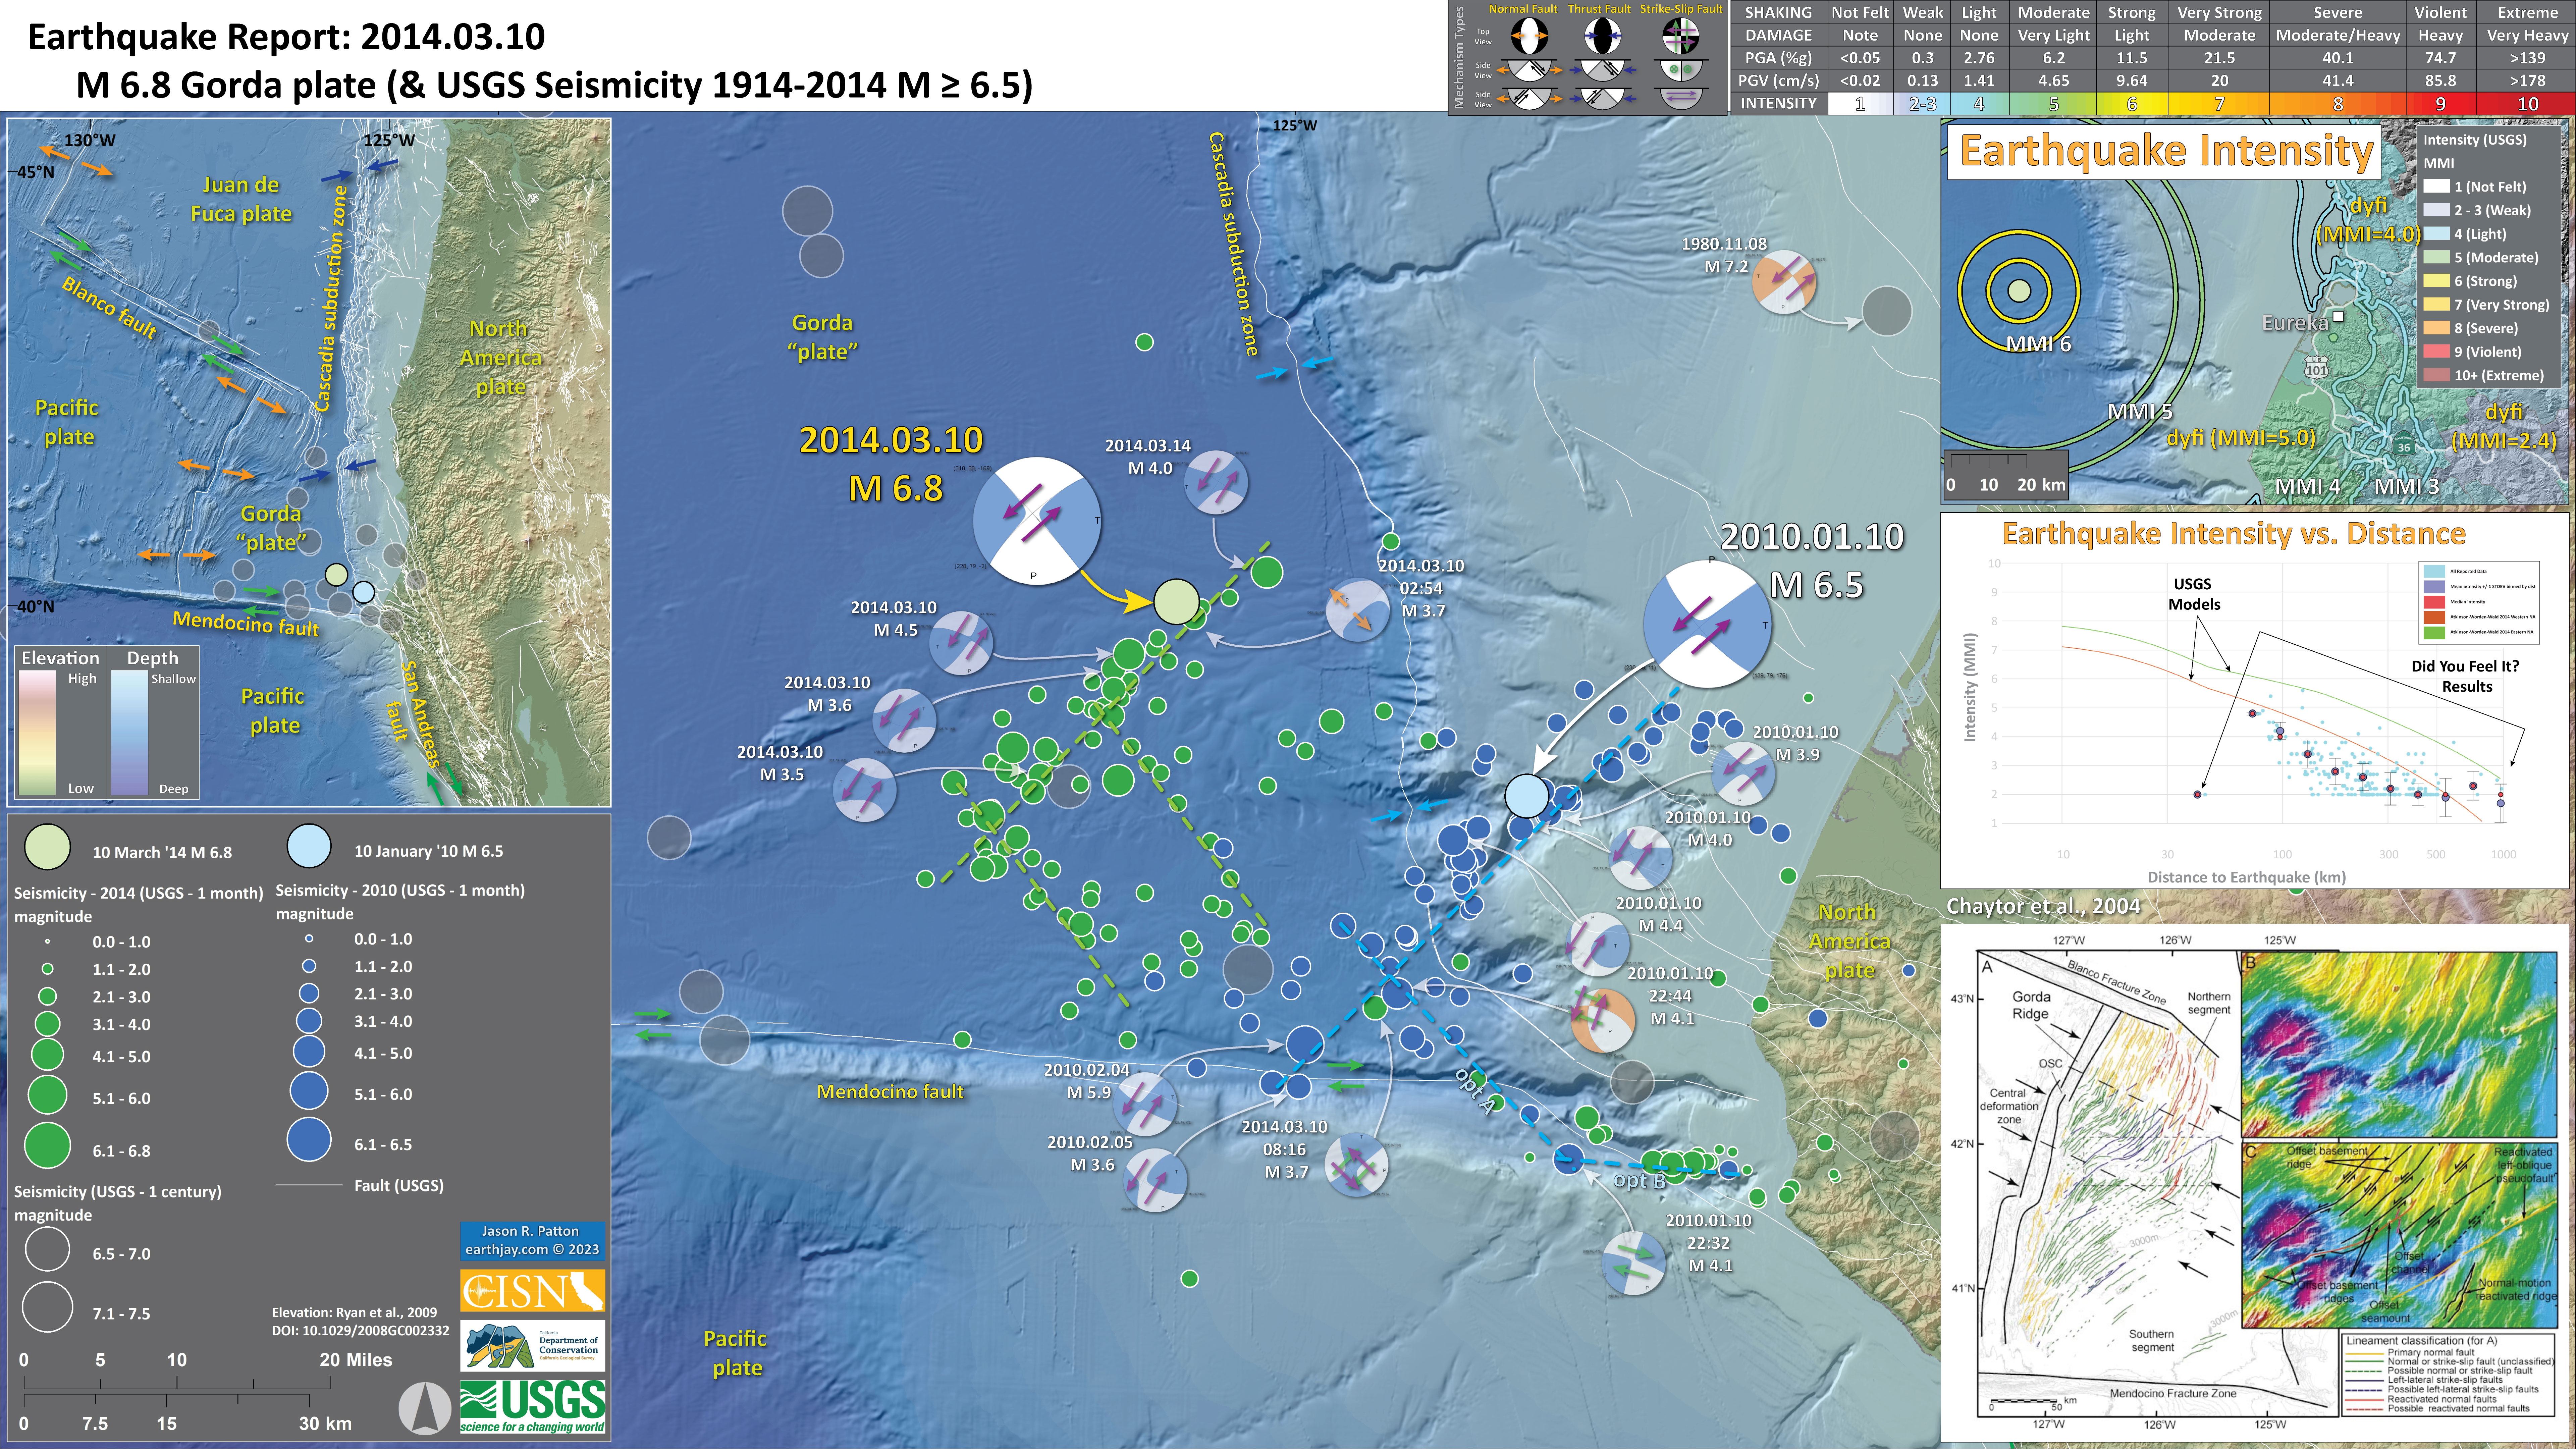
Below is my interpretive poster for this earthquake
- I plot the seismicity from the month following the earthquake, with diameter representing magnitude (see legend). I include earthquake epicenters from 1914-2014 with magnitudes M ≥ 6.5 in one version. I also include the 2010 earthquake sequence in blue.
- I plot the USGS fault plane solutions (moment tensors in blue and focal mechanisms in orange), possibly in addition to some relevant historic earthquakes.
- A review of the basic base map variations and data that I use for the interpretive posters can be found on the Earthquake Reports page. I have improved these posters over time and some of this background information applies to the older posters.
- Some basic fundamentals of earthquake geology and plate tectonics can be found on the Earthquake Plate Tectonic Fundamentals page.
- In the upper left corner is a map showing the tectonic plate boundaries and a century of seismicity.
- In the upper right corner is a map that displays a variety of earthquake intensity information. I plot the USGS modeled intensity, the USGS Did You Feel It? observations of intensity, and the shaking magnitude using the Peak Ground Acceleration scale in units of g (gravitational acceleration). I describe this map later in the report.
- Below the intensity map is a plot that shows how earthquake intensity diminishes with distance from the earthquake. The green and orange lines are the USGS modeled relations between intensity and distance. The blue and orange circles are Did You Feel It? reports of intensity made by real people. This plot and the above map are based on the same data.
- In the lower right corner I include a map from Chaytor et al. (2004) that shows the faulting within the Gorda plate. Read more about their interpretations below.
I include some inset figures. Some of the same figures are located in different places on the larger scale map below.
- Here is the map with 1 month’s seismicity plotted.
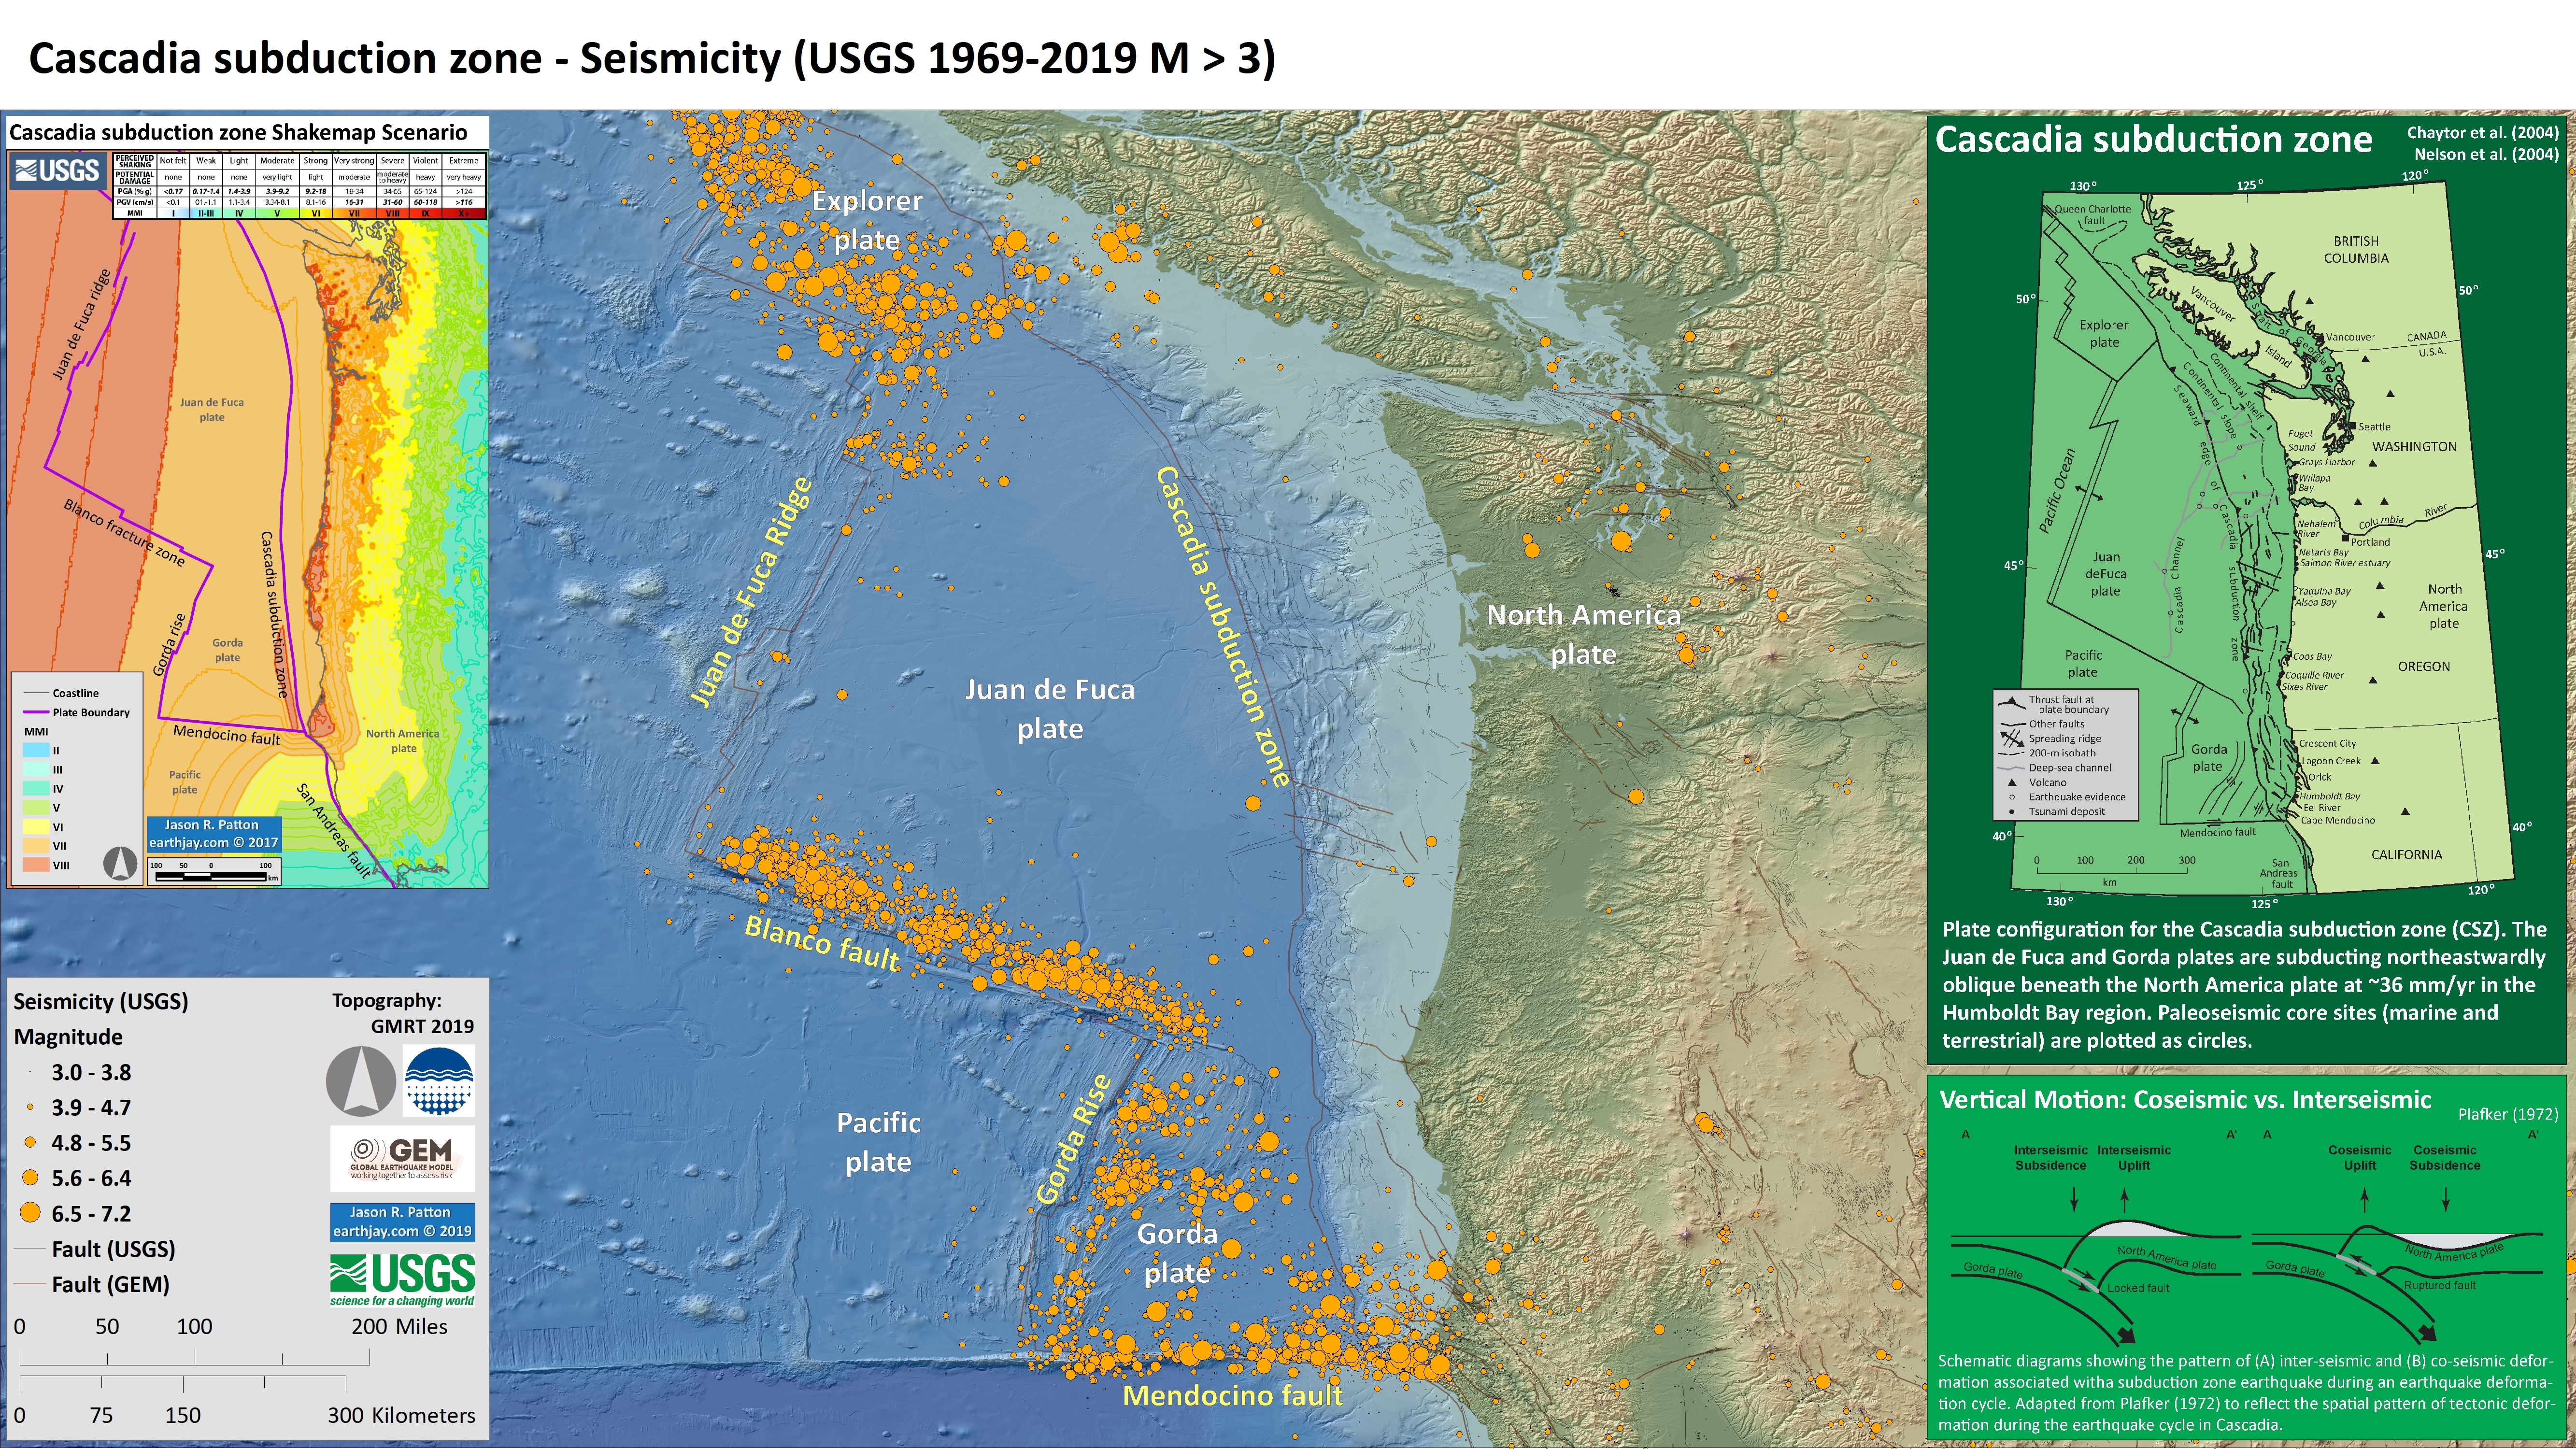
- Here is a map of the Cascadia subduction zone, modified from Nelson et al. (2006). The Juan de Fuca and Gorda plates subduct norteastwardly beneath the North America plate at rates ranging from 29- to 45-mm/yr. Sites where evidence of past earthquakes (paleoseismology) are denoted by white dots. Where there is also evidence for past CSZ tsunami, there are black dots. These paleoseismology sites are labeled (e.g. Humboldt Bay). Some submarine paleoseismology core sites are also shown as grey dots. The two main spreading ridges are not labeled, but the northern one is the Juan de Fuca ridge (where oceanic crust is formed for the Juan de Fuca plate) and the southern one is the Gorda rise (where the oceanic crust is formed for the Gorda plate).
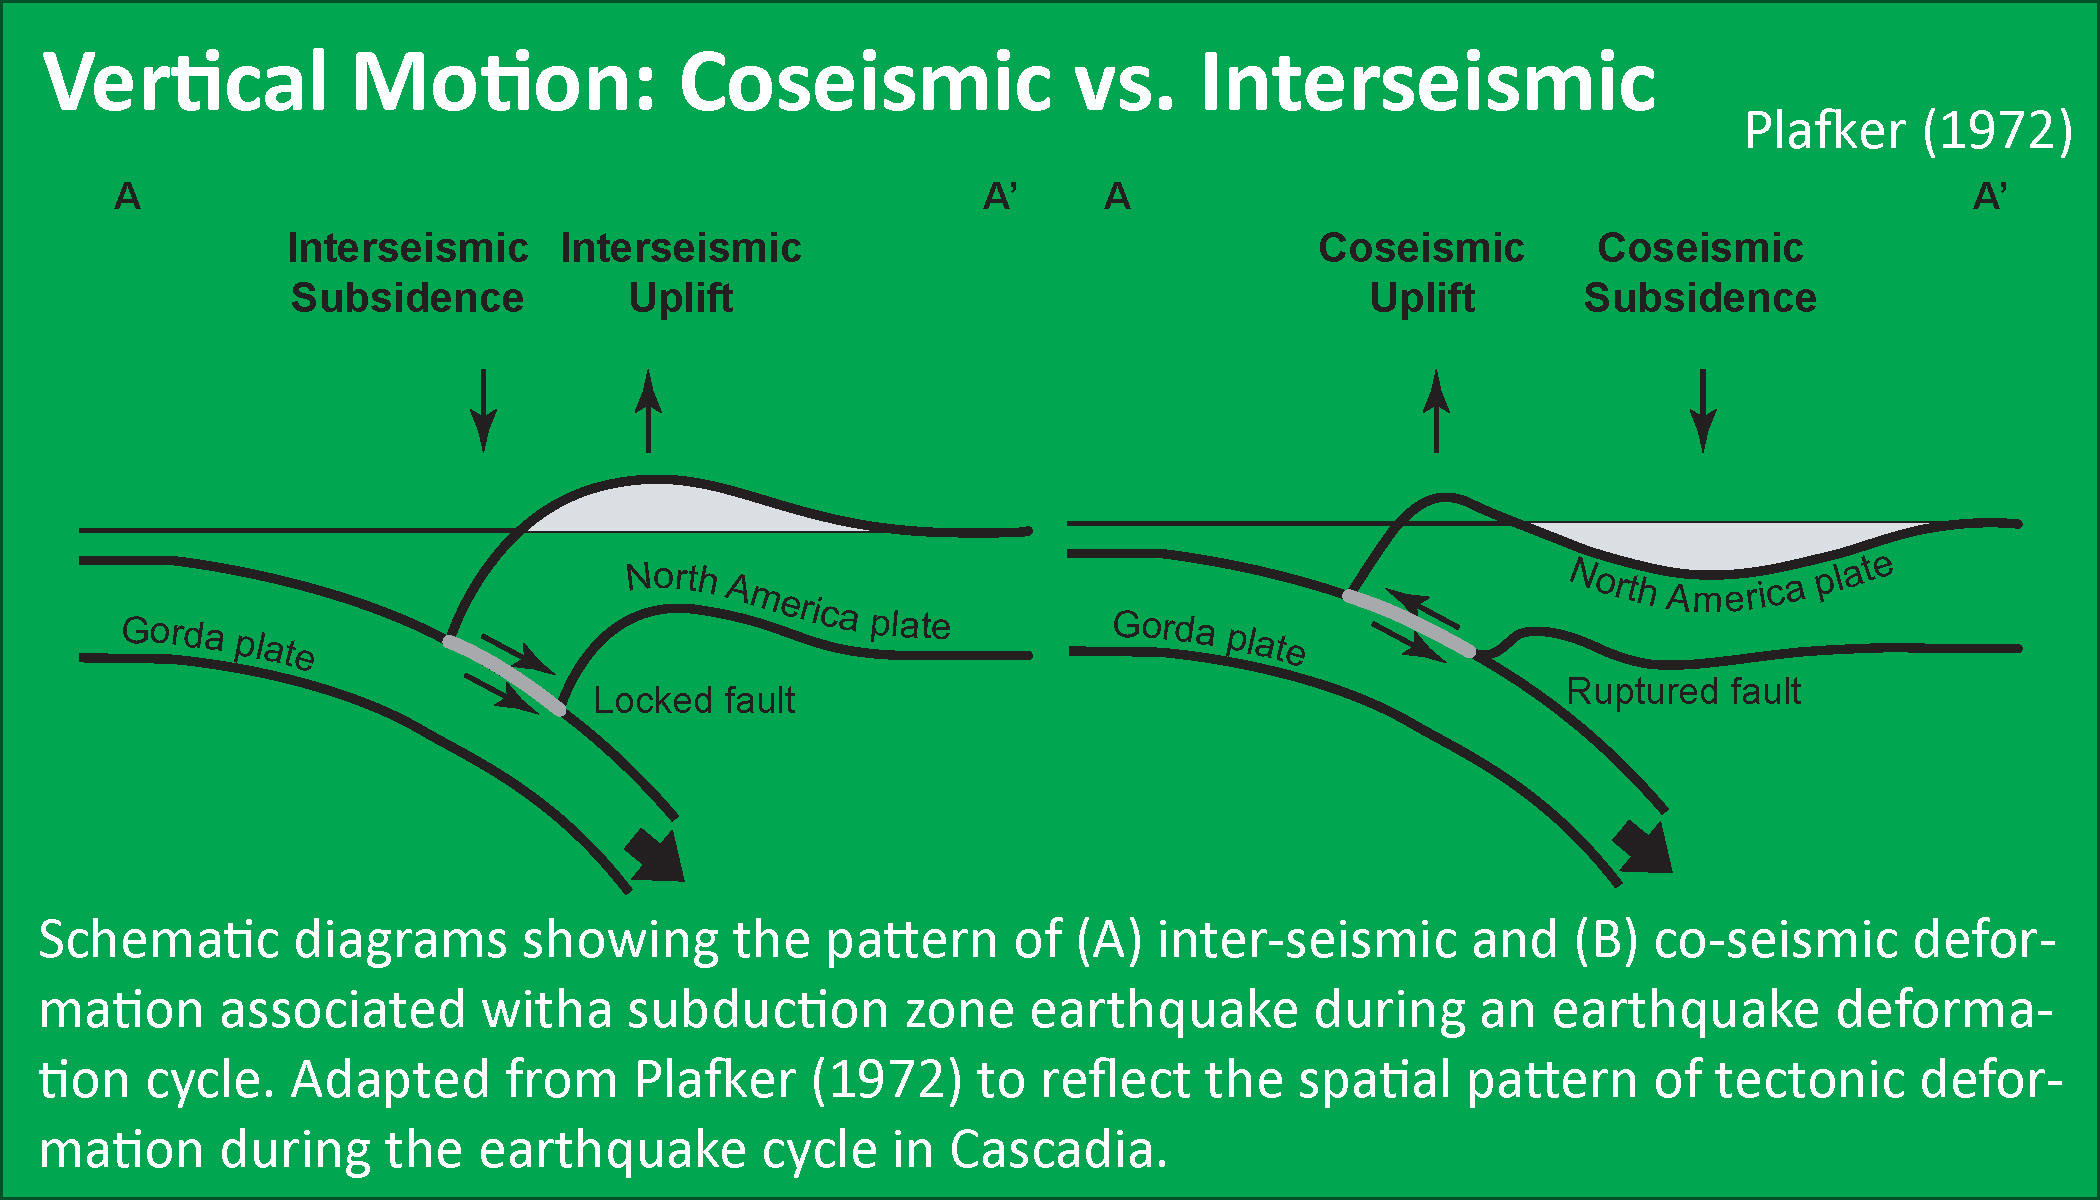
- Here is a version of the CSZ cross section alone (Plafker, 1972). This shows two parts of the earthquake cycle: the interseismic part (between earthquakes) and the coseismic part (during earthquakes). Regions that experience uplift during the interseismic period tend to experience subsidence during the coseismic period.
- This poster includes seismicity from the past ~5 decades, for temblors M > 3.0. I also include the map and cross section as explained above. On the left is a map that shows the possible shaking intensity from a future CSZ earthquake.
- More about the materials on this poster can be found on this page.
- Hemphill-Haley, E., 1995. Diatom evidence for earthquake-induced subsidence and tsunami 300 yr ago in southern coastal Washington in GSA Bulletin, v. 107, p. 367-378.
- Nelson, A.R., Shennan, I., and Long, A.J., 1996. Identifying coseismic subsidence in tidal-wetland stratigraphic sequences at the Cascadia subduction zone of western North America in Journal of Geophysical Research, v. 101, p. 6115-6135.
- Atwater, B.F. and Hemphill-Haley, E., 1997. Recurrence Intervals for Great Earthquakes of the Past 3,500 Years at Northeastern Willapa Bay, Washington in U.S. Geological Survey Professional Paper 1576, Washington D.C., 119 pp.
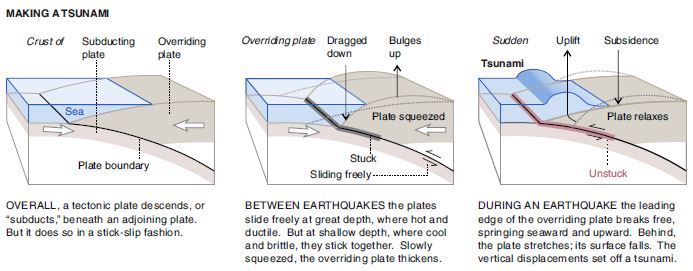
- This figure shows how a subduction zone deforms between (interseismic) and during (coseismic) earthquakes. We also can see how a subduction zone generates a tsunami. Atwater et al., 2005.
- Here is an animation produced by the folks at Cal Tech following the 2004 Sumatra-Andaman subduction zone earthquake. I have several posts about that earthquake here and here. One may learn more about this animation, as well as download this animation here.
- Here is a link to the embedded video below, showing the week-long seismicity in April 1992.
- This is the map used in the animation below. Earthquake epicenters are plotted (some with USGS moment tensors) for this region from 1917-2017 with M ≥ 6.5. I labeled the plates and shaded their general location in different colors.
- I include some inset maps.
- In the upper right corner is a map of the Cascadia subduction zone (Chaytor et al., 2004; Nelson et al., 2004).
- In the upper left corner is a map from Rollins and Stein (2010). They plot epicenters and fault lines involved in earthquakes between 1976 and 2010.
- Here is a map from Rollins and Stein, showing their interpretations of different historic earthquakes in the region. This was published in response to the Januray 2010 Gorda plate earthquake. The faults are from Chaytor et al. (2004).
- Here is a large scale map of the 1994 earthquake swarm. The mainshock epicenter is a black star and epicenters are denoted as white circles.
- Here is a plot of focal mechanisms from the Dengler et al. (1995) paper in California Geology.
Some Relevant Discussion and Figures
I have compiled some literature about the CSZ earthquake and tsunami. Here is a short list that might help us learn about what is contained within the core that I collected.
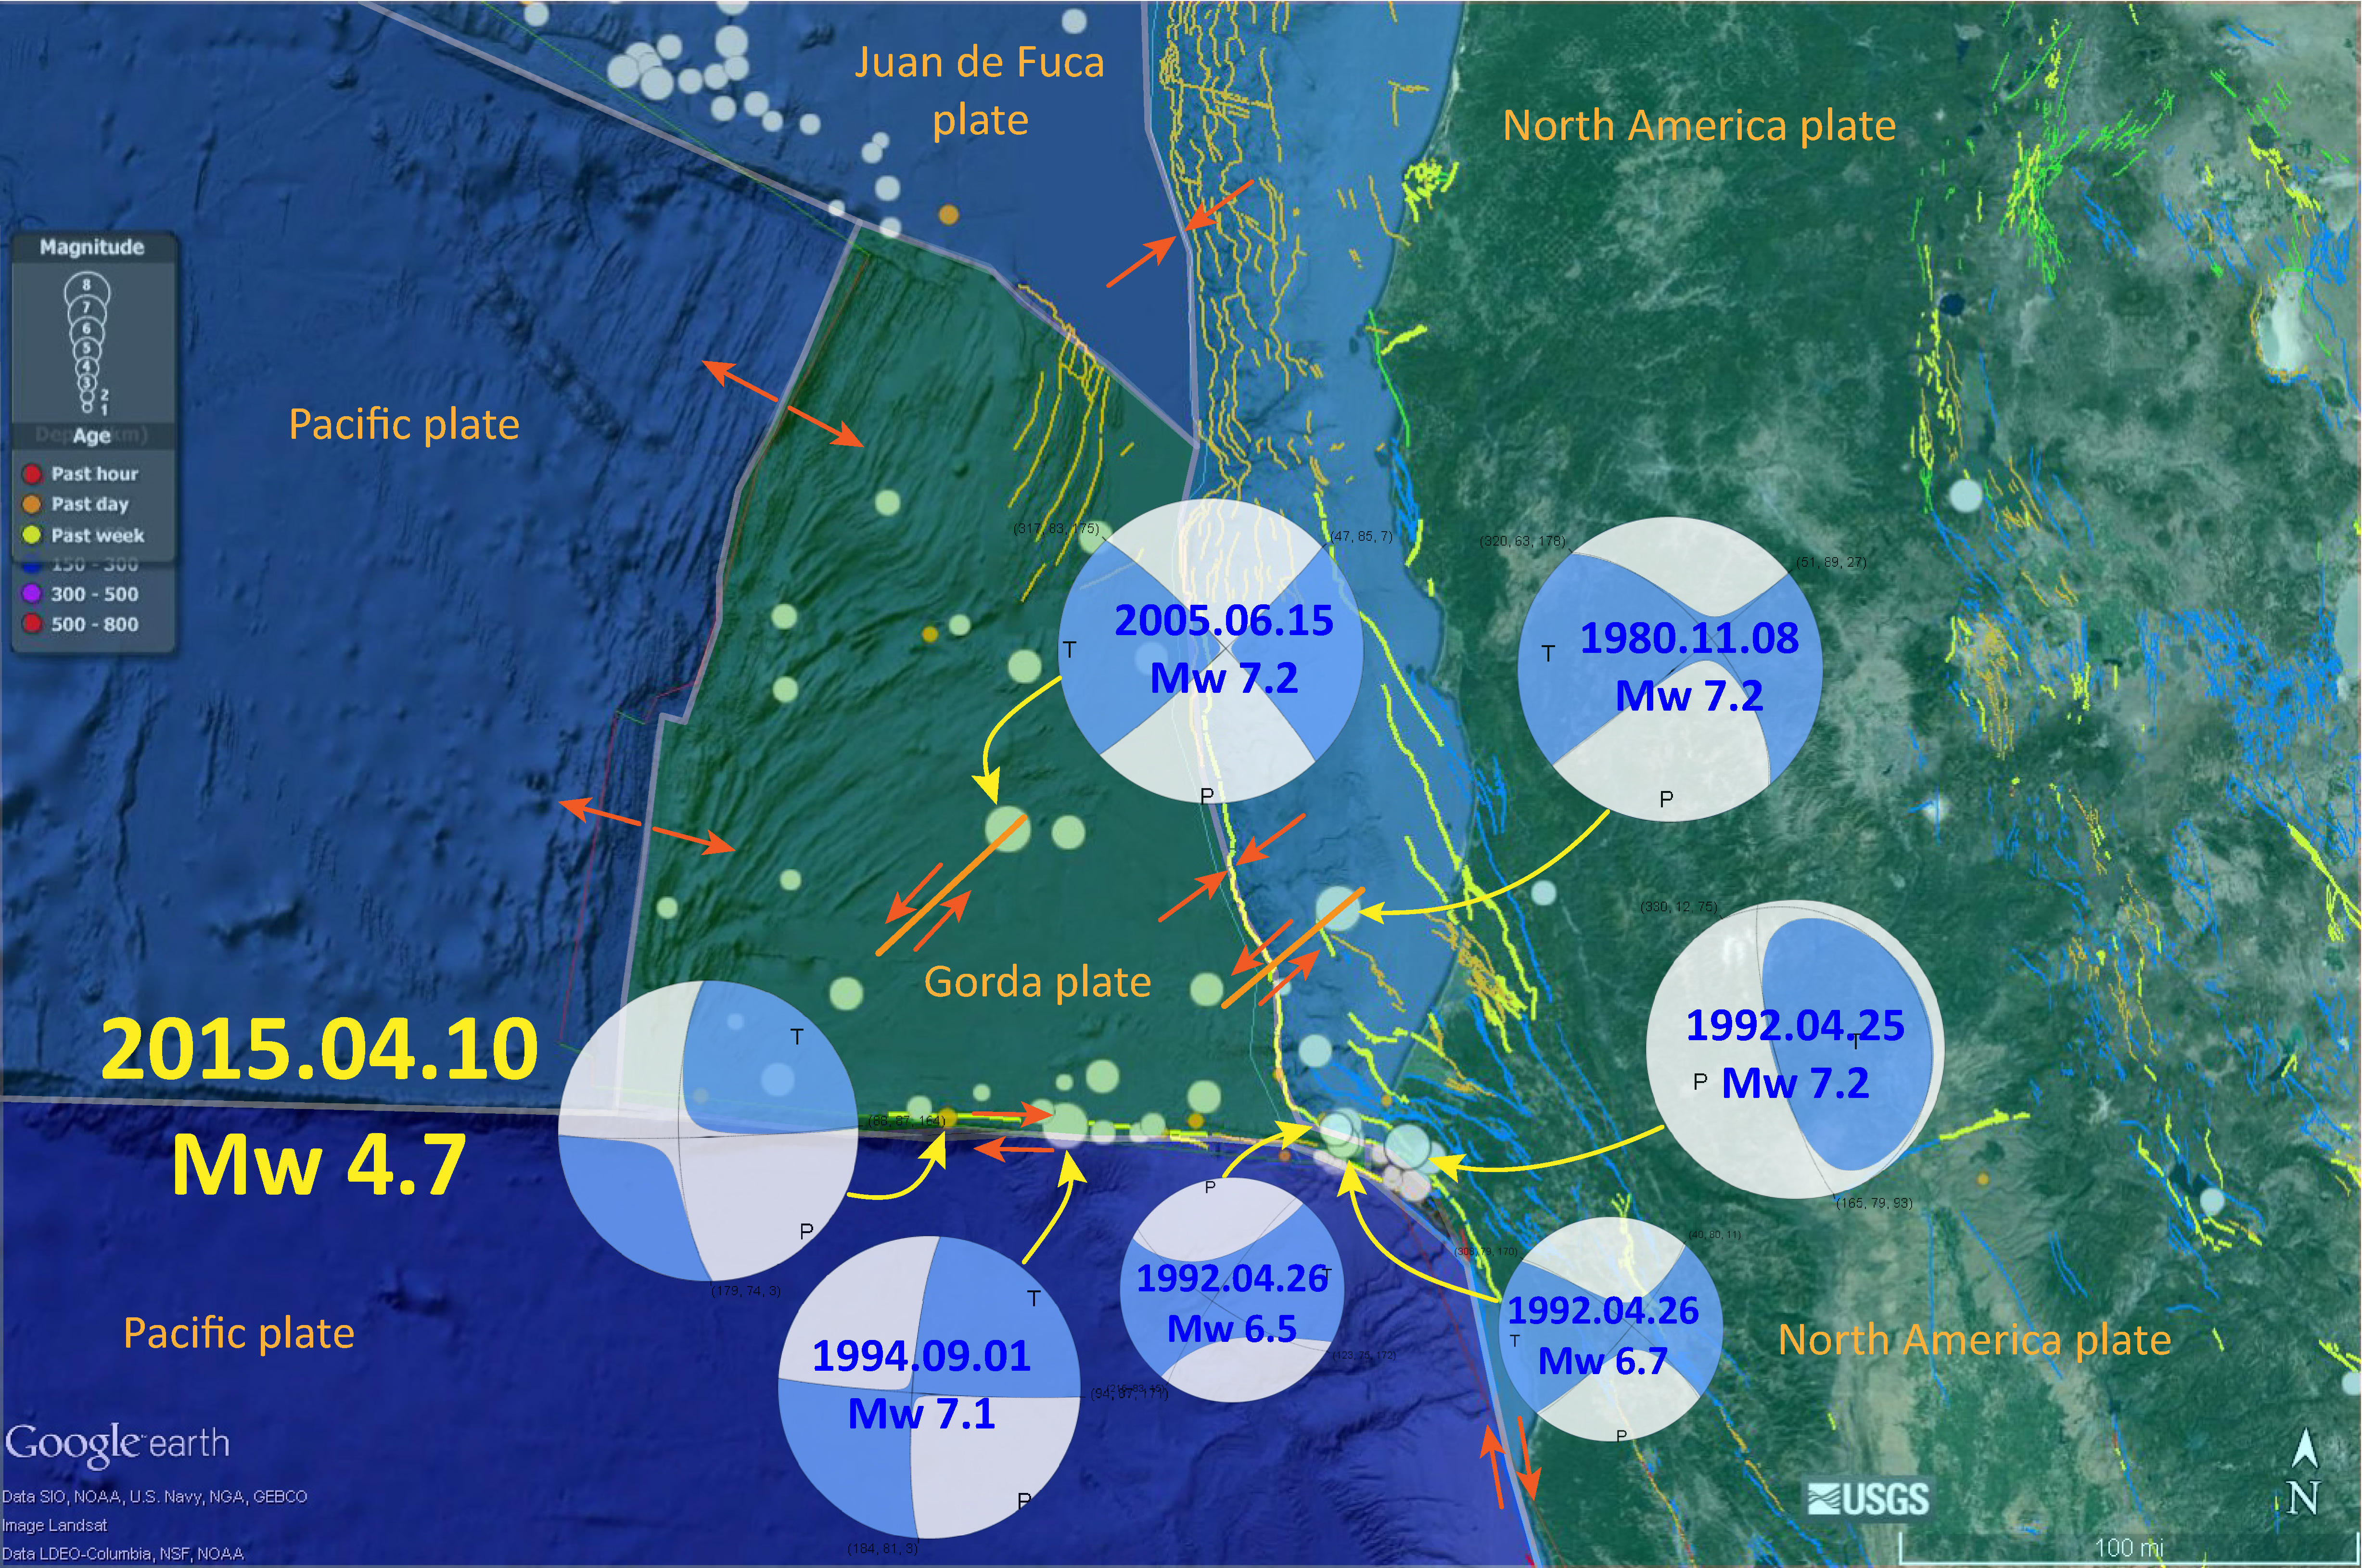
The Gorda and Juan de Fuca plates subduct beneath the North America plate to form the Cascadia subduction zone fault system. In 1992 there was a swarm of earthquakes with the magnitude Mw 7.2 Mainshock on 4/25. Initially this earthquake was interpreted to have been on the Cascadia subduction zone (CSZ). The moment tensor shows a compressional mechanism. However the two largest aftershocks on 4/26/1992 (Mw 6.5 and Mw 6.7), had strike-slip moment tensors. In my mind, these two aftershocks aligned on what may be the eastern extension of the Mendocino fault. However, looking at their locations, my mind was incorrect. These two earthquakes were not aftershocks, but were either left-lateral or right-lateral strike-slip Gorda plate earthquakes triggered by the M 7.1 thrust event.
These two quakes appear to be aligned with the two northwest trends in seismicity and the 18 March 2020 M 5.2. The orientation of the mechanisms are not as perfectly well aligned, but there are lots of reasons for this (perhaps the faults were formed in a slightly different orientation, but have rotated slightly).
There have been several series of intra-plate earthquakes in the Gorda plate. Two main shocks that I plot of this type of earthquake are the 1980 (Mw 7.2) and 2005 (Mw 7.2) earthquakes. I place orange lines approximately where the faults are that ruptured in 1980 and 2005. These are also plotted in the Rollins and Stein (2010) figure above. The Gorda plate is being deformed due to compression between the Pacific plate to the south and the Juan de Fuca plate to the north. Due to this north-south compression, the plate is deforming internally so that normal faults that formed at the spreading center (the Gorda Rise) are reactivated as left-lateral strike-slip faults. In 2014, there was another swarm of left-lateral earthquakes in the Gorda plate. I posted some material about the Gorda plate setting on this page.

Tectonic configuration of the Gorda deformation zone and locations and source models for 1976–2010 M ≥ 5.9 earthquakes. Letters designate chronological order of earthquakes (Table 1 and Appendix A). Plate motion vectors relative to the Pacific Plate (gray arrows in main diagram) are from Wilson [1989], with Cande and Kent’s [1995] timescale correction.


- In this map below, I label a number of other significant earthquakes in this Mendocino triple junction region. Another historic right-lateral earthquake on the Mendocino fault system was in 1994. There was a series of earthquakes possibly along the easternmost section of the Mendocino fault system in late January 2015, here is my post about that earthquake series.
- Here is a map from Chaytor et al. (2004) that shows some details of the faulting in the region. The moment tensor (at the moment i write this) shows a north-south striking fault with a reverse or thrust faulting mechanism. While this region of faulting is dominated by strike slip faults (and most all prior earthquake moment tensors showed strike slip earthquakes), when strike slip faults bend, they can create compression (transpression) and extension (transtension). This transpressive or transtentional deformation may produce thrust/reverse earthquakes or normal fault earthquakes, respectively. The transverse ranges north of Los Angeles are an example of uplift/transpression due to the bend in the San Andreas fault in that region.
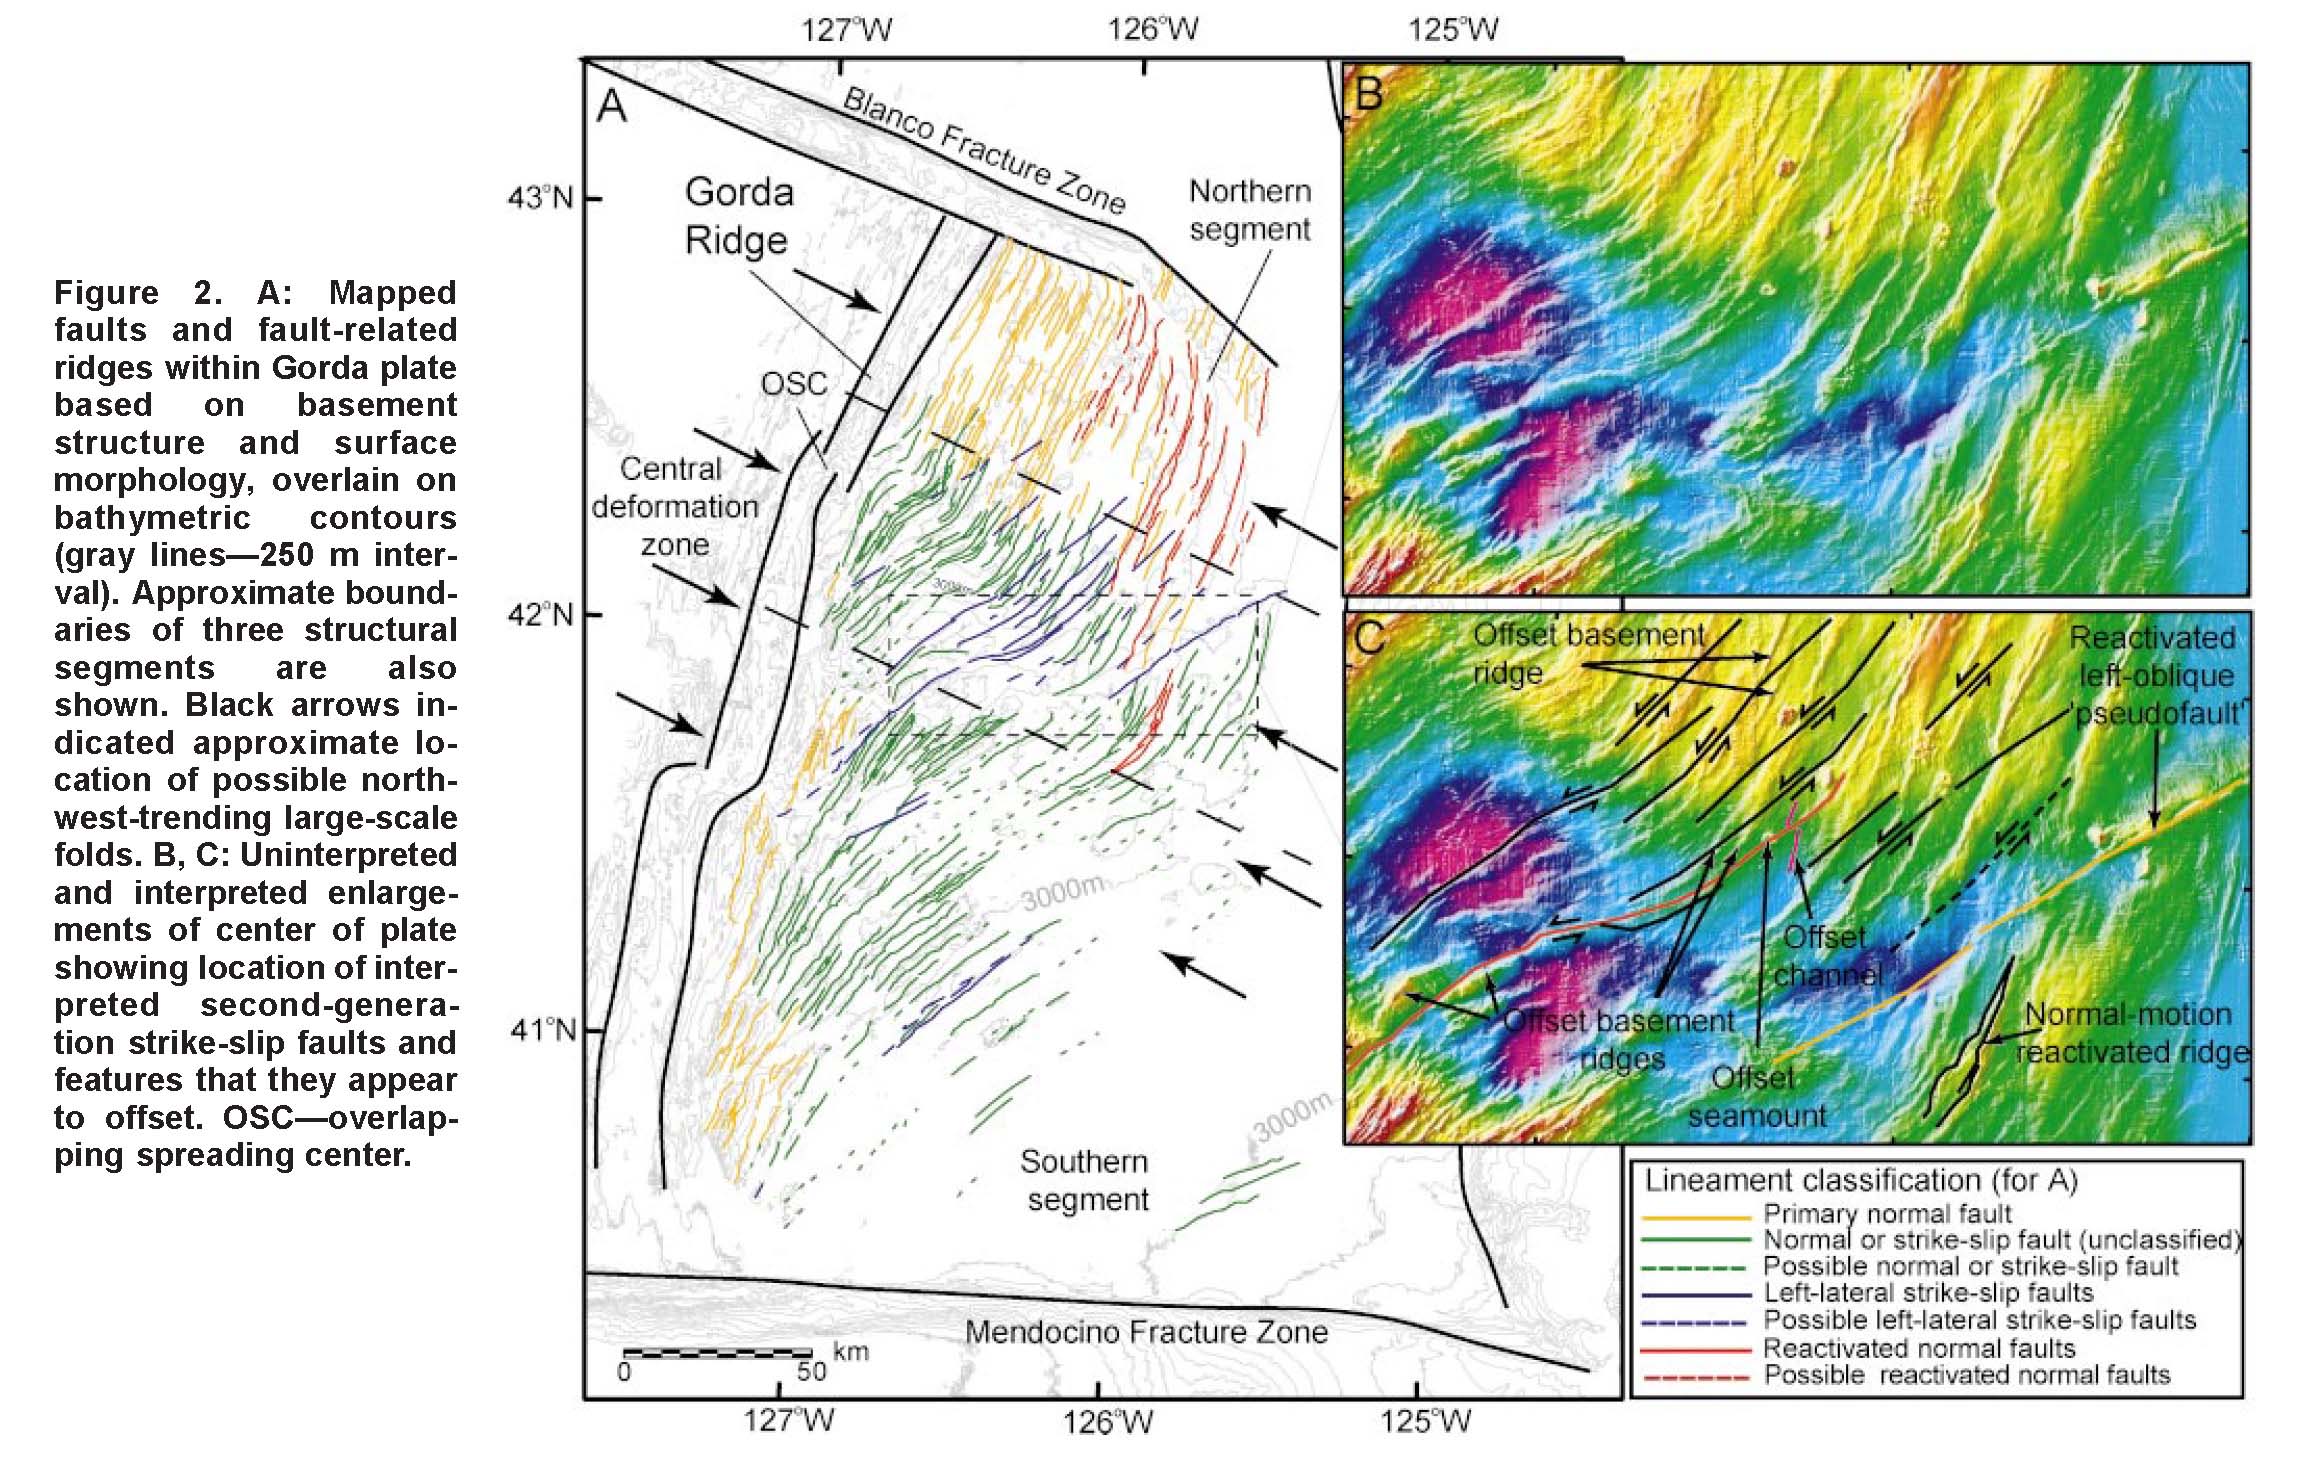
A: Mapped faults and fault-related ridges within Gorda plate based on basement structure and surface morphology, overlain on bathymetric contours (gray lines—250 m interval). Approximate boundaries of three structural segments are also shown. Black arrows indicated approximate location of possible northwest- trending large-scale folds. B, C: uninterpreted and interpreted enlargements of center of plate showing location of interpreted second-generation strike-slip faults and features that they appear to offset. OSC—overlapping spreading center.
- These are the models for tectonic deformation within the Gorda plate as presented by Jason Chaytor in 2004.
Models of brittle deformation for Gorda plate overlain on magnetic anomalies modified from Raff and Mason (1961). Models A–F were proposed prior to collection and analysis of full-plate multibeam data. Deformation model of Gulick et al. (2001) is included in model A. Model G represents modification of Stoddard’s (1987) flexural-slip model proposed in this paper.
Mendocino triple junction video
- 1700.09.26 M 9.0 Cascadia’s 315th Anniversary 2015.01.26
- 1700.09.26 M 9.0 Cascadia’s 316th Anniversary 2016.01.26 updated in 2017 and 2018
- 1992.04.25 M 7.1 Cape Mendocino 25 year remembrance
- 1992.04.25 M 7.1 Cape Mendocino 25 Year Remembrance Event Page
- Earthquake Information about the CSZ 2015.10.08
- 2022.12.20 M 6.4 Gorda plate
- 2020.05.18 M 5.5 Gorda Rise
- 2018.07.24 M 5.6 Gorda plate
- 2018.03.22 M 4.6/4.7 Gorda plate
- 2017.07.28 M 5.1 Gorda plate
- 2016.09.25 M 5.0 Gorda plate
- 2016.09.25 M 5.0 Gorda plate
- 2016.01.30 M 5.0 Gorda plate
- 2015.12.29 M 4.9 Gorda plate
- 2015.11.18 M 3.2 Gorda plate
- 2014.03.13 M 5.2 Gorda Rise
- 2014.03.09 M 6.8 Gorda plate p-1
- 2014.03.23 M 6.8 Gorda plate p-2
- 2010.01.10 M 6.5 Gorda plate
- 2019.08.29 M 6.3 Blanco transform fault
- 2018.08.22 M 6.2 Blanco transform fault
- 2018.07.29 M 5.3 Blanco transform fault
- 2015.06.01 M 5.8 Blanco transform fault p-1
- 2015.06.01 M 5.8 Blanco transform fault p-2 (animations)
- 2021.12.20 M 5.7 & 6.2 Mendocino fault
- 2020.03.09 M 5.8 Mendocino fault
- 2018.01.25 M 5.8 Mendocino fault
- 2017.09.22 M 5.7 Mendocino fault
- 2016.12.08 M 6.5 Mendocino fault, CA
- 2016.12.08 M 6.5 Mendocino fault, CA Update #1
- 2016.12.05 M 4.3 Petrolia CA
- 2016.10.27 M 4.1 Mendocino fault
- 2016.09.03 M 5.6 Mendocino
- 2016.01.02 M 4.5 Mendocino fault
- 2015.11.01 M 4.3 Mendocino fault
- 2015.01.28 M 5.7 Mendocino fault
- 2015.11.01 M 4.3 Mendocino fault
- 2015.01.28 M 5.7 Mendocino fault
- 2020.03.18 M 5.2 Petrolia
- 2019.06.23 M 5.6 Petrolia
- 2017.03.06 M 4.0 Cape Mendocino
- 2016.11.02 M 3.6 Oregon
- 2016.01.07 M 4.2 NAP(?)
- 2015.10.29 M 3.4 Bayside
- 2018.10.22 M 6.8 Explorer plate
- 2017.01.07 M 5.7 Explorer plate
- 2016.03.19 M 5.2 Explorer plate
- 2017.06.11 M 3.5 Gorda or NAP?
- 2016.07.21 M 4.7 Gorda or NAP? p-1
- 2016.07.21 M 4.7 Gorda or NAP? p-2
Cascadia subduction zone
General Overview
Earthquake Reports
Gorda plate
Blanco transform fault
Mendocino fault
Mendocino triple junction
North America plate
Explorer plate
Uncertain
- Frisch, W., Meschede, M., Blakey, R., 2011. Plate Tectonics, Springer-Verlag, London, 213 pp.
- Hayes, G., 2018, Slab2 – A Comprehensive Subduction Zone Geometry Model: U.S. Geological Survey data release, https://doi.org/10.5066/F7PV6JNV.
- Holt, W. E., C. Kreemer, A. J. Haines, L. Estey, C. Meertens, G. Blewitt, and D. Lavallee (2005), Project helps constrain continental dynamics and seismic hazards, Eos Trans. AGU, 86(41), 383–387, , https://doi.org/10.1029/2005EO410002. /li>
- Jessee, M.A.N., Hamburger, M. W., Allstadt, K., Wald, D. J., Robeson, S. M., Tanyas, H., et al. (2018). A global empirical model for near-real-time assessment of seismically induced landslides. Journal of Geophysical Research: Earth Surface, 123, 1835–1859. https://doi.org/10.1029/2017JF004494
- Kreemer, C., J. Haines, W. Holt, G. Blewitt, and D. Lavallee (2000), On the determination of a global strain rate model, Geophys. J. Int., 52(10), 765–770.
- Kreemer, C., W. E. Holt, and A. J. Haines (2003), An integrated global model of present-day plate motions and plate boundary deformation, Geophys. J. Int., 154(1), 8–34, , https://doi.org/10.1046/j.1365-246X.2003.01917.x.
- Kreemer, C., G. Blewitt, E.C. Klein, 2014. A geodetic plate motion and Global Strain Rate Model in Geochemistry, Geophysics, Geosystems, v. 15, p. 3849-3889, https://doi.org/10.1002/2014GC005407.
- Meyer, B., Saltus, R., Chulliat, a., 2017. EMAG2: Earth Magnetic Anomaly Grid (2-arc-minute resolution) Version 3. National Centers for Environmental Information, NOAA. Model. https://doi.org/10.7289/V5H70CVX
- Müller, R.D., Sdrolias, M., Gaina, C. and Roest, W.R., 2008, Age spreading rates and spreading asymmetry of the world’s ocean crust in Geochemistry, Geophysics, Geosystems, 9, Q04006, https://doi.org/10.1029/2007GC001743
- Pagani, M., J. Garcia-Pelaez, R. Gee, K. Johnson, V. Poggi, R. Styron, G. Weatherill, M. Simionato, D. Viganò, L. Danciu, D. Monelli (2018). Global Earthquake Model (GEM) Seismic Hazard Map (version 2018.1 – December 2018), DOI: 10.13117/GEM-GLOBAL-SEISMIC-HAZARD-MAP-2018.1
- Silva, V ., D Amo-Oduro, A Calderon, J Dabbeek, V Despotaki, L Martins, A Rao, M Simionato, D Viganò, C Yepes, A Acevedo, N Horspool, H Crowley, K Jaiswal, M Journeay, M Pittore, 2018. Global Earthquake Model (GEM) Seismic Risk Map (version 2018.1). https://doi.org/10.13117/GEM-GLOBAL-SEISMIC-RISK-MAP-2018.1
- Zhu, J., Baise, L. G., Thompson, E. M., 2017, An Updated Geospatial Liquefaction Model for Global Application, Bulletin of the Seismological Society of America, 107, p 1365-1385, https://doi.org/0.1785/0120160198
- Atwater, B.F., Musumi-Rokkaku, S., Satake, K., Tsuju, Y., Eueda, K., and Yamaguchi, D.K., 2005. The Orphan Tsunami of 1700—Japanese Clues to a Parent Earthquake in North America, USGS Professional Paper 1707, USGS, Reston, VA, 144 pp.
- Chaytor, J.D., Goldfinger, C., Dziak, R.P., and Fox, C.G., 2004. Active deformation of the Gorda plate: Constraining deformation models with new geophysical data: Geology v. 32, p. 353-356.
- Dengler, L.A., Moley, K.M., McPherson, R.C., Pasyanos, M., Dewey, J.W., and Murray, M., 1995. The September 1, 1994 Mendocino Fault Earthquake, California Geology, Marc/April 1995, p. 43-53.
- Geist, E.L. and Andrews D.J., 2000. Slip rates on San Francisco Bay area faults from anelastic deformation of the continental lithosphere, Journal of Geophysical Research, v. 105, no. B11, p. 25,543-25,552.
- Guo, H., McGuire, J., and Zhang, H., 2021. Correlation of porosity variations and rheological transitions on the southern Cascadia megathrust in Nature Geoscience, https://doi.org/10.1038/s41561-021-00740-1
- Irwin, W.P., 1990. Quaternary deformation, in Wallace, R.E. (ed.), 1990, The San Andreas Fault system, California: U.S. Geological Survey Professional Paper 1515, online at: http://pubs.usgs.gov/pp/1990/1515/
- McCrory, P.A.,. Blair, J.L., Waldhauser, F., kand Oppenheimer, D.H., 2012. Juan de Fuca slab geometry and its relation to Wadati-Benioff zone seismicity in JGR, v. 117, B09306, doi:10.1029/2012JB009407.
- McLaughlin, R.J., Ellen, S.D., Blake, M.C. Jr., Jayko, A.S., Irwin, W.P., Aalto, F.R., Carver, G.A., and Clarke, S.H. Jr., 2000. Geology of the Cape Mendocino, Eureka, Garberville, and Southwestern Part of the Hayfork 30 x 60 Minute Quadrangles and Adjacent Offshore Area, Northern California, USGS Miscellaneous Field Studies Map MF-2336, http://pubs.usgs.gov/mf/2000/2336/
- McLaughlin, R.J., Sarna-Wojcicki, A.M., Wagner, D.L., Fleck, R.J., Langenheim, V.E., Jachens, R.C., Clahan, K., and Allen, J.R., 2012. Evolution of the Rodgers Creek–Maacama right-lateral fault system and associated basins east of the northward-migrating Mendocino Triple Junction, northern California in Geosphere, v. 8, no. 2., p. 342-373.
- Nelson, A.R., Asquith, A.C., and Grant, W.C., 2004. Great Earthquakes and Tsunamis of the Past 2000 Years at the Salmon River Estuary, Central Oregon Coast, USA: Bulletin of the Seismological Society of America, Vol. 94, No. 4, pp. 1276–1292
- Rollins, J.C. and Stein, R.S., 2010. Coulomb stress interactions among M ≥ 5.9 earthquakes in the Gorda deformation zone and on the Mendocino Fault Zone, Cascadia subduction zone, and northern San Andreas Fault: Journal of Geophysical Research, v. 115, B12306, doi:10.1029/2009JB007117, 2010.
- Stoffer, P.W., 2006, Where’s the San Andreas Fault? A guidebook to tracing the fault on public lands in the San Francisco Bay region: U.S. Geological Survey General Interest Publication 16, 123 p., online at http://pubs.usgs.gov/gip/2006/16/
- Wallace, Robert E., ed., 1990, The San Andreas fault system, California: U.S. Geological Survey Professional Paper 1515, 283 p. [http://pubs.usgs.gov/pp/1988/1434/].
- Wells, D.L., and Coopersmith, K.J., 1994. New empirical relationships among magnitude, rupture length, rupture width, rupture area, and surface displacement in BSSA, v. 84, no. 4, p. 974-1002
- Wells, R.E., Blakely, R.J., Wech, A.G., McCrory, P.A., Michael, A., 2017. Cascadia subduction tremor muted by crustal faults in Geology, v. 45, no. 6, p. 515–518, https://doi.org/10.1130/G38835.1
- Williams, T.B. and McPherson, R.C., (2006). Gorda Plate Deformation Contributes to Shortening Between the Klamath Block and the On-land Portion of the Accretionary Prism to the S. Cascadia Subduction Zone. In Hemphill-Haley, M., McPherson, R., Patton, J. R., Stallman, J., Leroy, T.H., Sutherland, D., and Williams, T.B., eds. (2006) Pacific Cell Friends of the Pleistocene Field Trip Guidebook, The Triangle of Doom: Signatures of Quaternary Crustal Deformation in the Mendocino Deformation Zone (MDZ) Arcata, CA.
References:
Basic & General References
Specific References
Return to the Earthquake Reports page.
- Sorted by Magnitude
- Sorted by Year
- Sorted by Day of the Year
- Sorted By Region
Very clear description J thanks for this!
Nice summary, Jay!
thanks stephani and ann!
… this was very informative, and timely too!
Thanks! Lots of people were interested and I felt it important to get it out asap. I’m glad i was able to do that.
Yeah way to network! Information has been relayed to KMUD and broadcast on the air! 91.1, 88.1, 90.3, 99.5 FM
Thanks Jay! I knew right where to go to get info on the quake. We felt it in Fort Bragg and I just filled out the form.
that’s awesome karen! i hope it was exciting! (you are only a few miles away from the san andreas)
that’s awesome karen! i hope it was exciting! (you are only a few miles away from the san andreas)
Nicely done, Jay. will use some of this for discussion in Phys Geog come Tuesday’s presentation. Encouraging those students who are excited by such information to sign up for your “Hazards” course.
thanks dan, i hope it helps!
Kevin shared this site with me! Great info, especially as I was out of town for this one!! Thanks for the good update!
Thanks very much for posting this! It helps a lot to know. If you would, would you mind explaining why the depth of the aftershocks ranged from 0.1 km to around 22.8 km? Why, why, why Mister Patton Science Guy?
(Thanks!)
it is interesting that there are these deep aftershocks. the depths may have significant error since they are offshore… but i am not a seismologist and cannot place numbers on this uncertainty. 0.1 km seems suspicious. maybe that was on a small eq and was not really evaluated much.
the main shock was rather deep, for the gorda crust in this location. possibly rupturing into the upper mantle. the water depth is 3 km at the epicenter. the crust is probably 5-7 km thick there… the usgs depth is set at 16.6 km. that is pretty deep, so it makes sense that some of the aftershocks would also be deep. in recent years we have been observing earthquakes with increasing deeper hypcenters. there was one offshore the Okhotsk peninsula that was ~600 km deep http://earthjay.com/?p=627 . we have also seen large subduction zone (tohoku-oki 2011 and sumatra-andaman 2004) and strike slip (sumatra outer rise 2012 http://earthjay.com/?p=301 ) earthquakes that appear to have ruptured into the mantle. this was unexpected…
Thanks for being there with the info, Jay!!
thanks eileen!