
There was just a pair of earthquakes near the Gorda rise. There was first an earthquake of magnitude M = 5.0, followed by a M = 4.9. The 5.0 appears to be within the GP, but the 4.9 seems to be at the eastern boundary of the ridge. These two earthquakes do not pose a tsunami risk for northern California (or elsewhere). Nor do they likely have an affect upon the likelihood of a Cascadia subduction zone earthquake.
**UPDATE: 2016.01.29 20:00 PST
The USGS has prepared a moment tensor for the M 5.0 earthquake. I have updated the map. It is clear now that this is an extensional (normal) earthquake. I include an updated map below the original map.
/end update
**UPDATE: 2023.01.29
The two events on this updated poster show how the faults near the spreading ridge are normal faults.
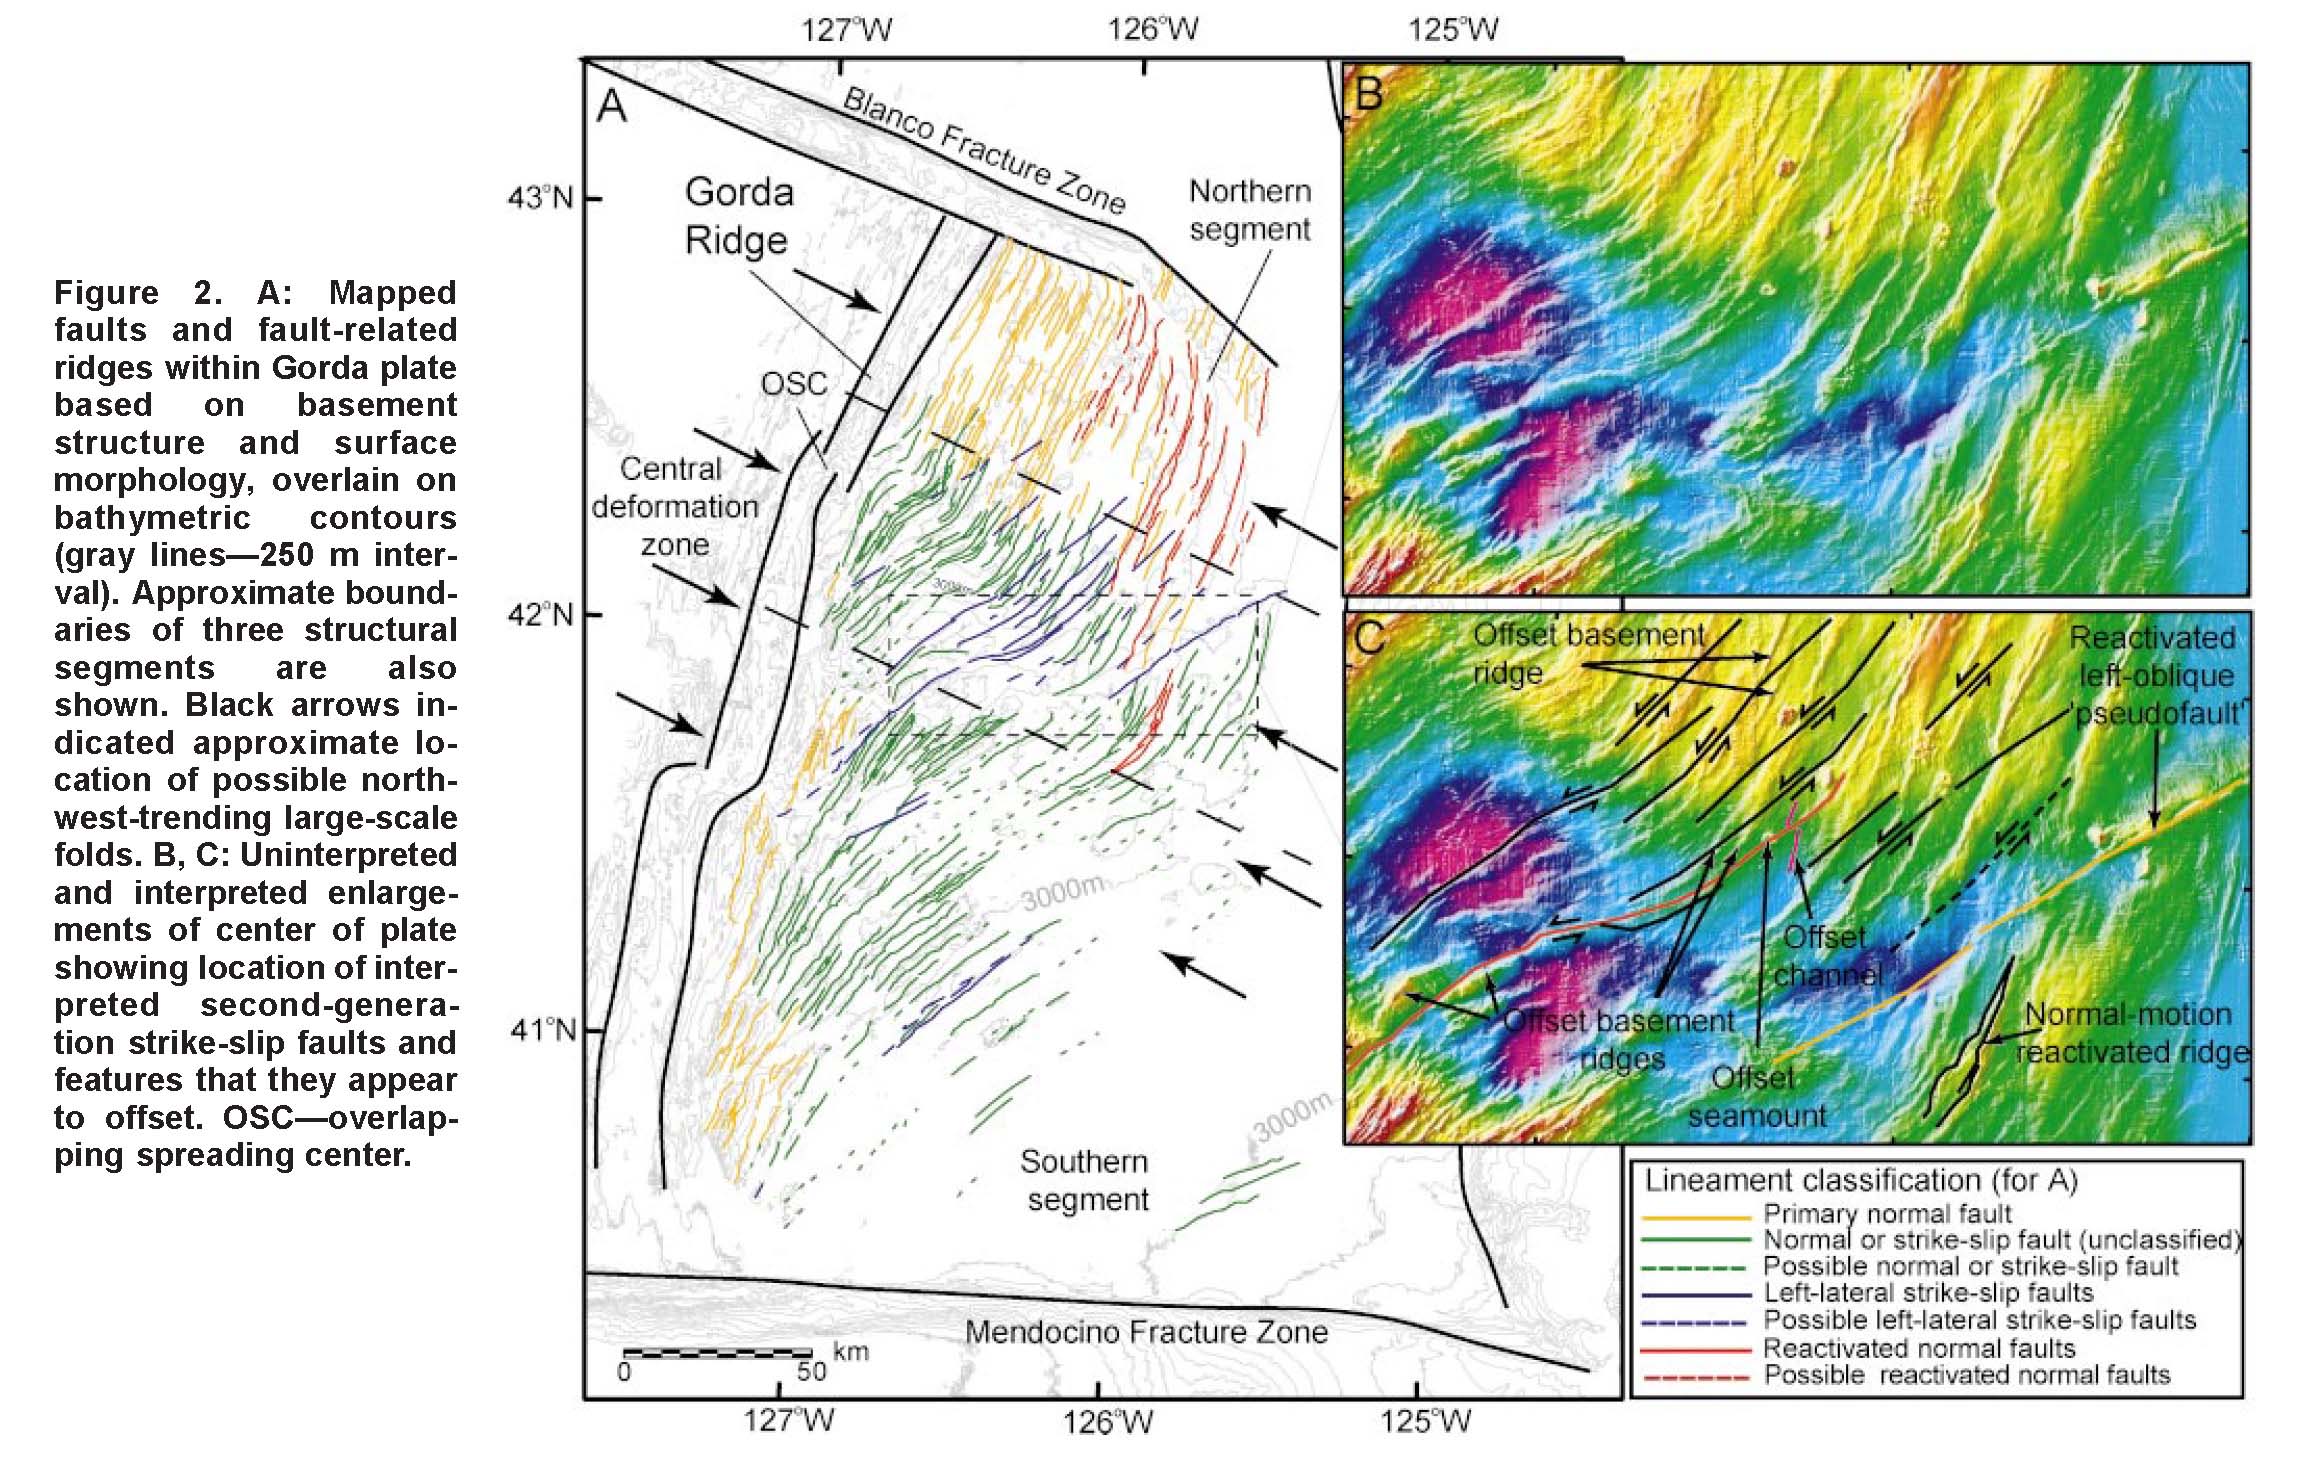
Below we see some maps showing how these normal faults, as the plate rotates in a clockwise fashion, also rotate. During this process, they are reactivated as left-lateral strike-slip faults.
Check out some of the earthquake reports for these strike-slip Gorda plate earthquakes listed at the bottom of this page. The 2014 M 6.8 event is a great example.
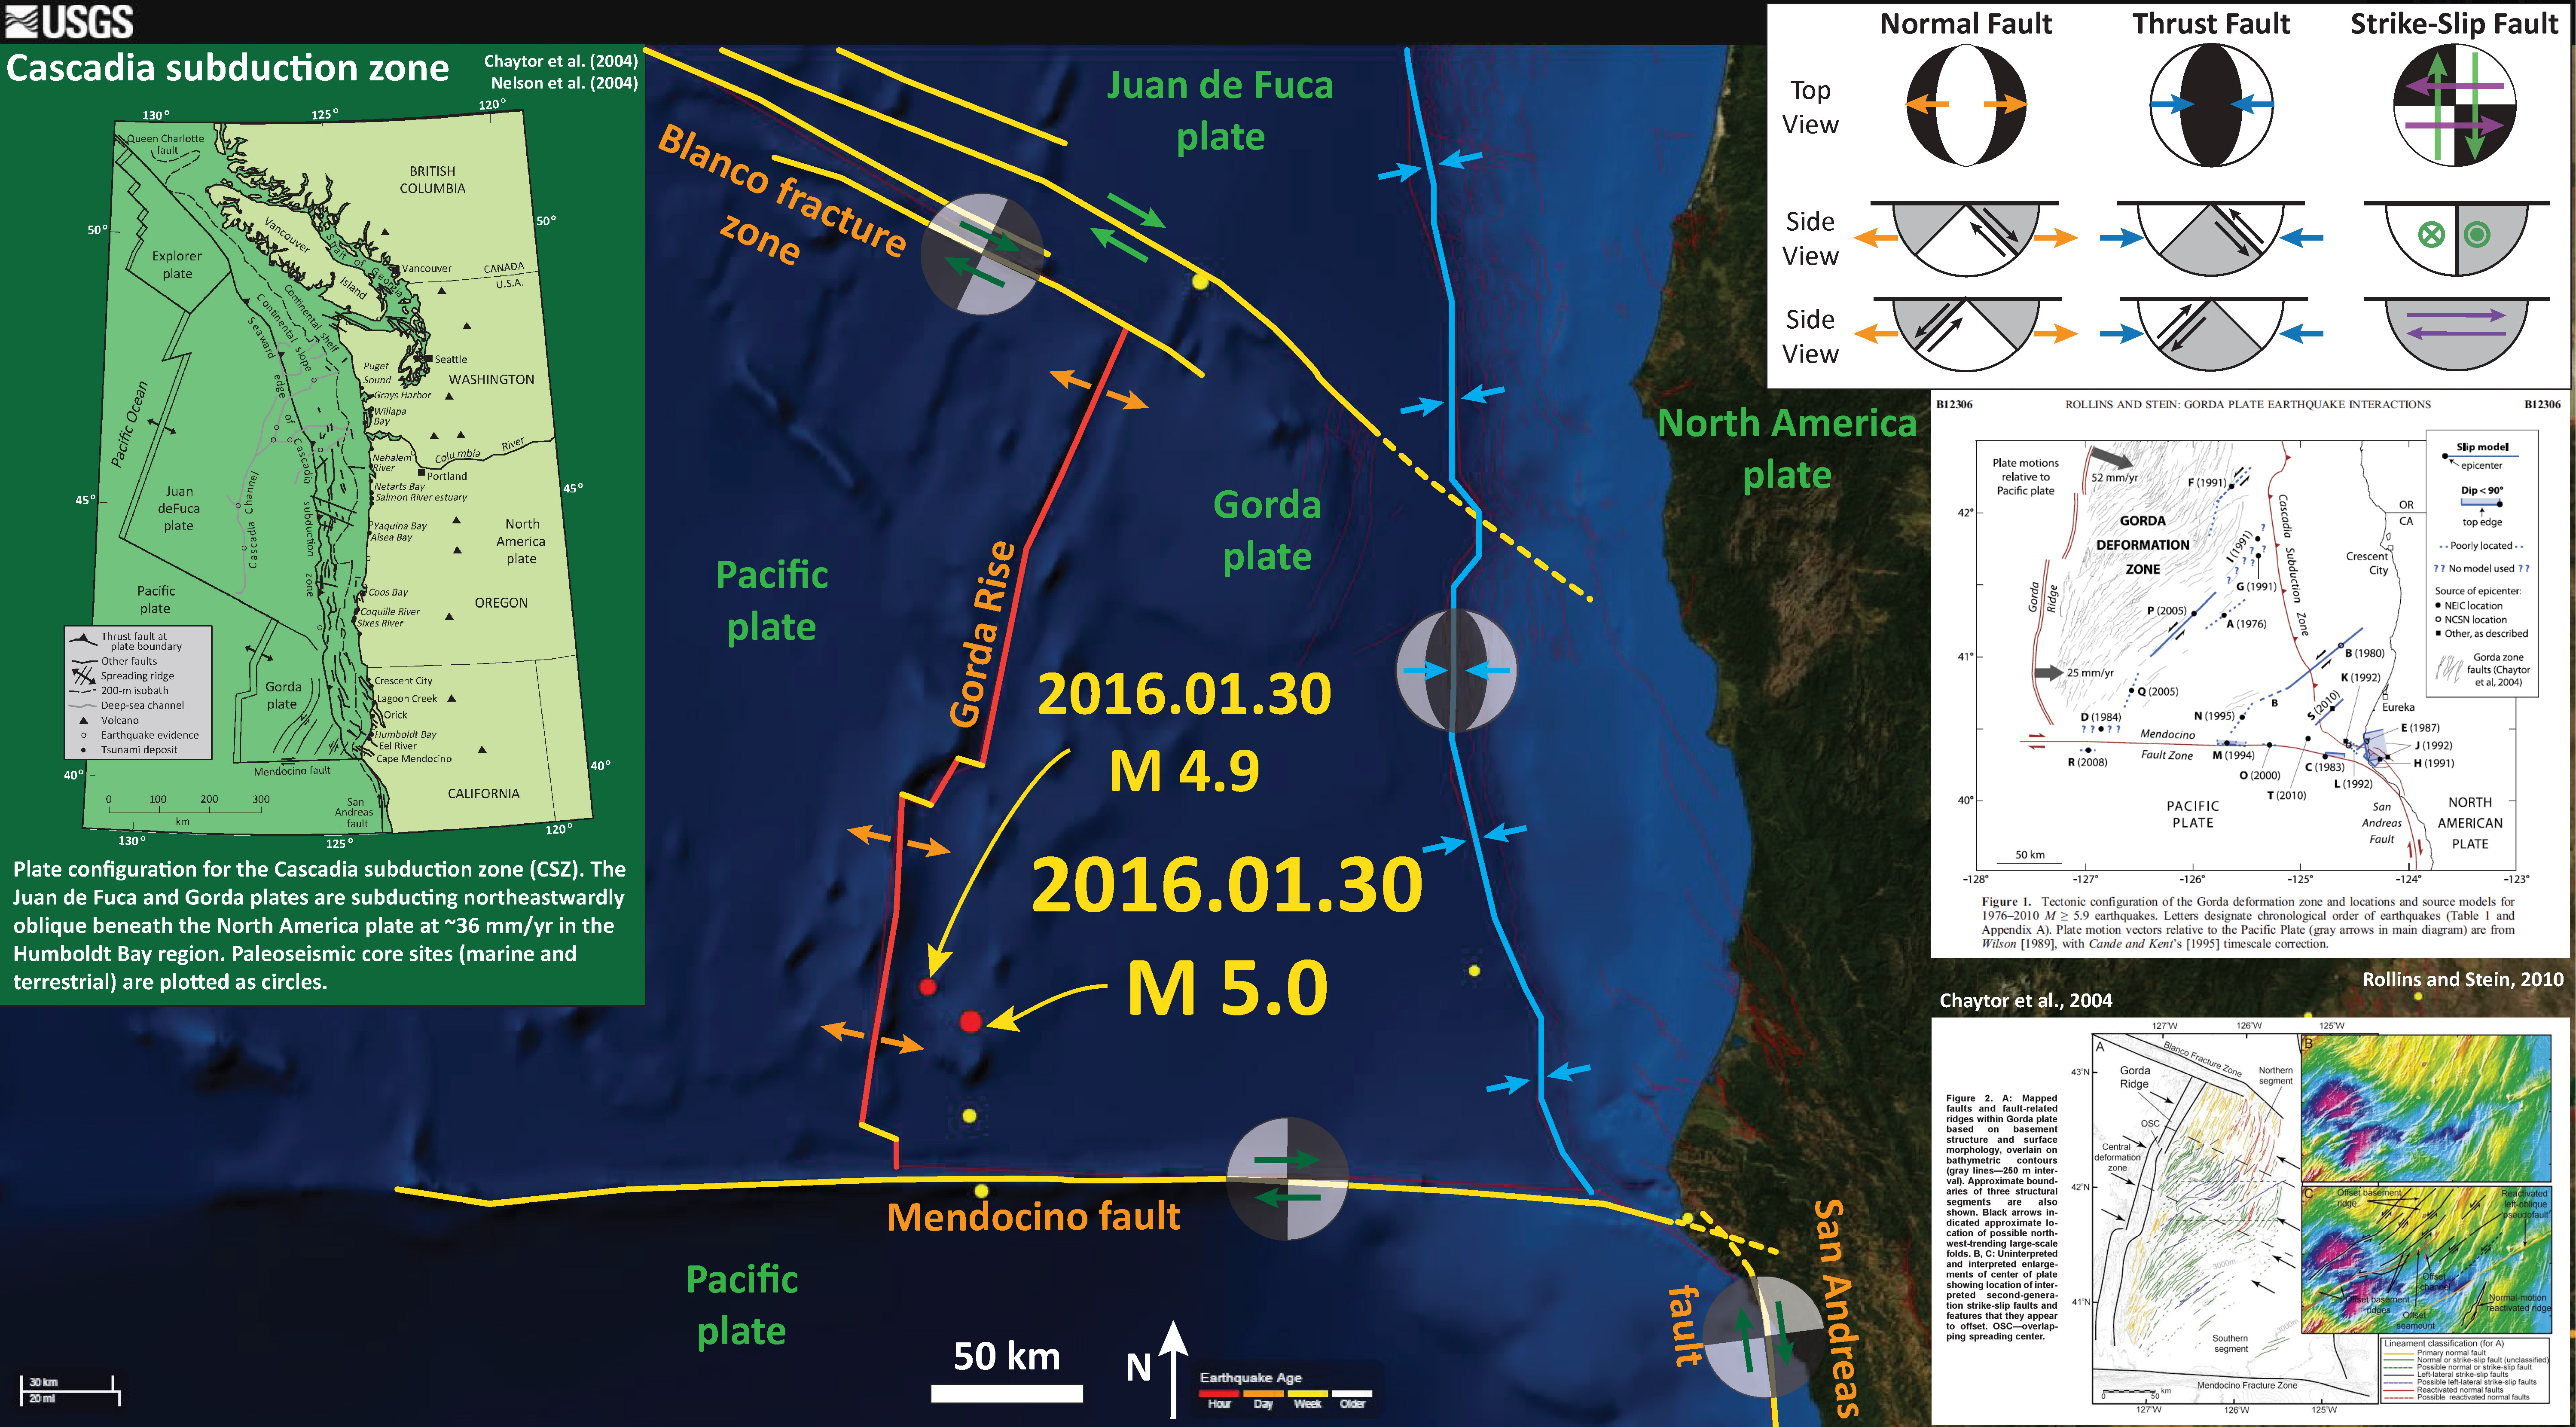
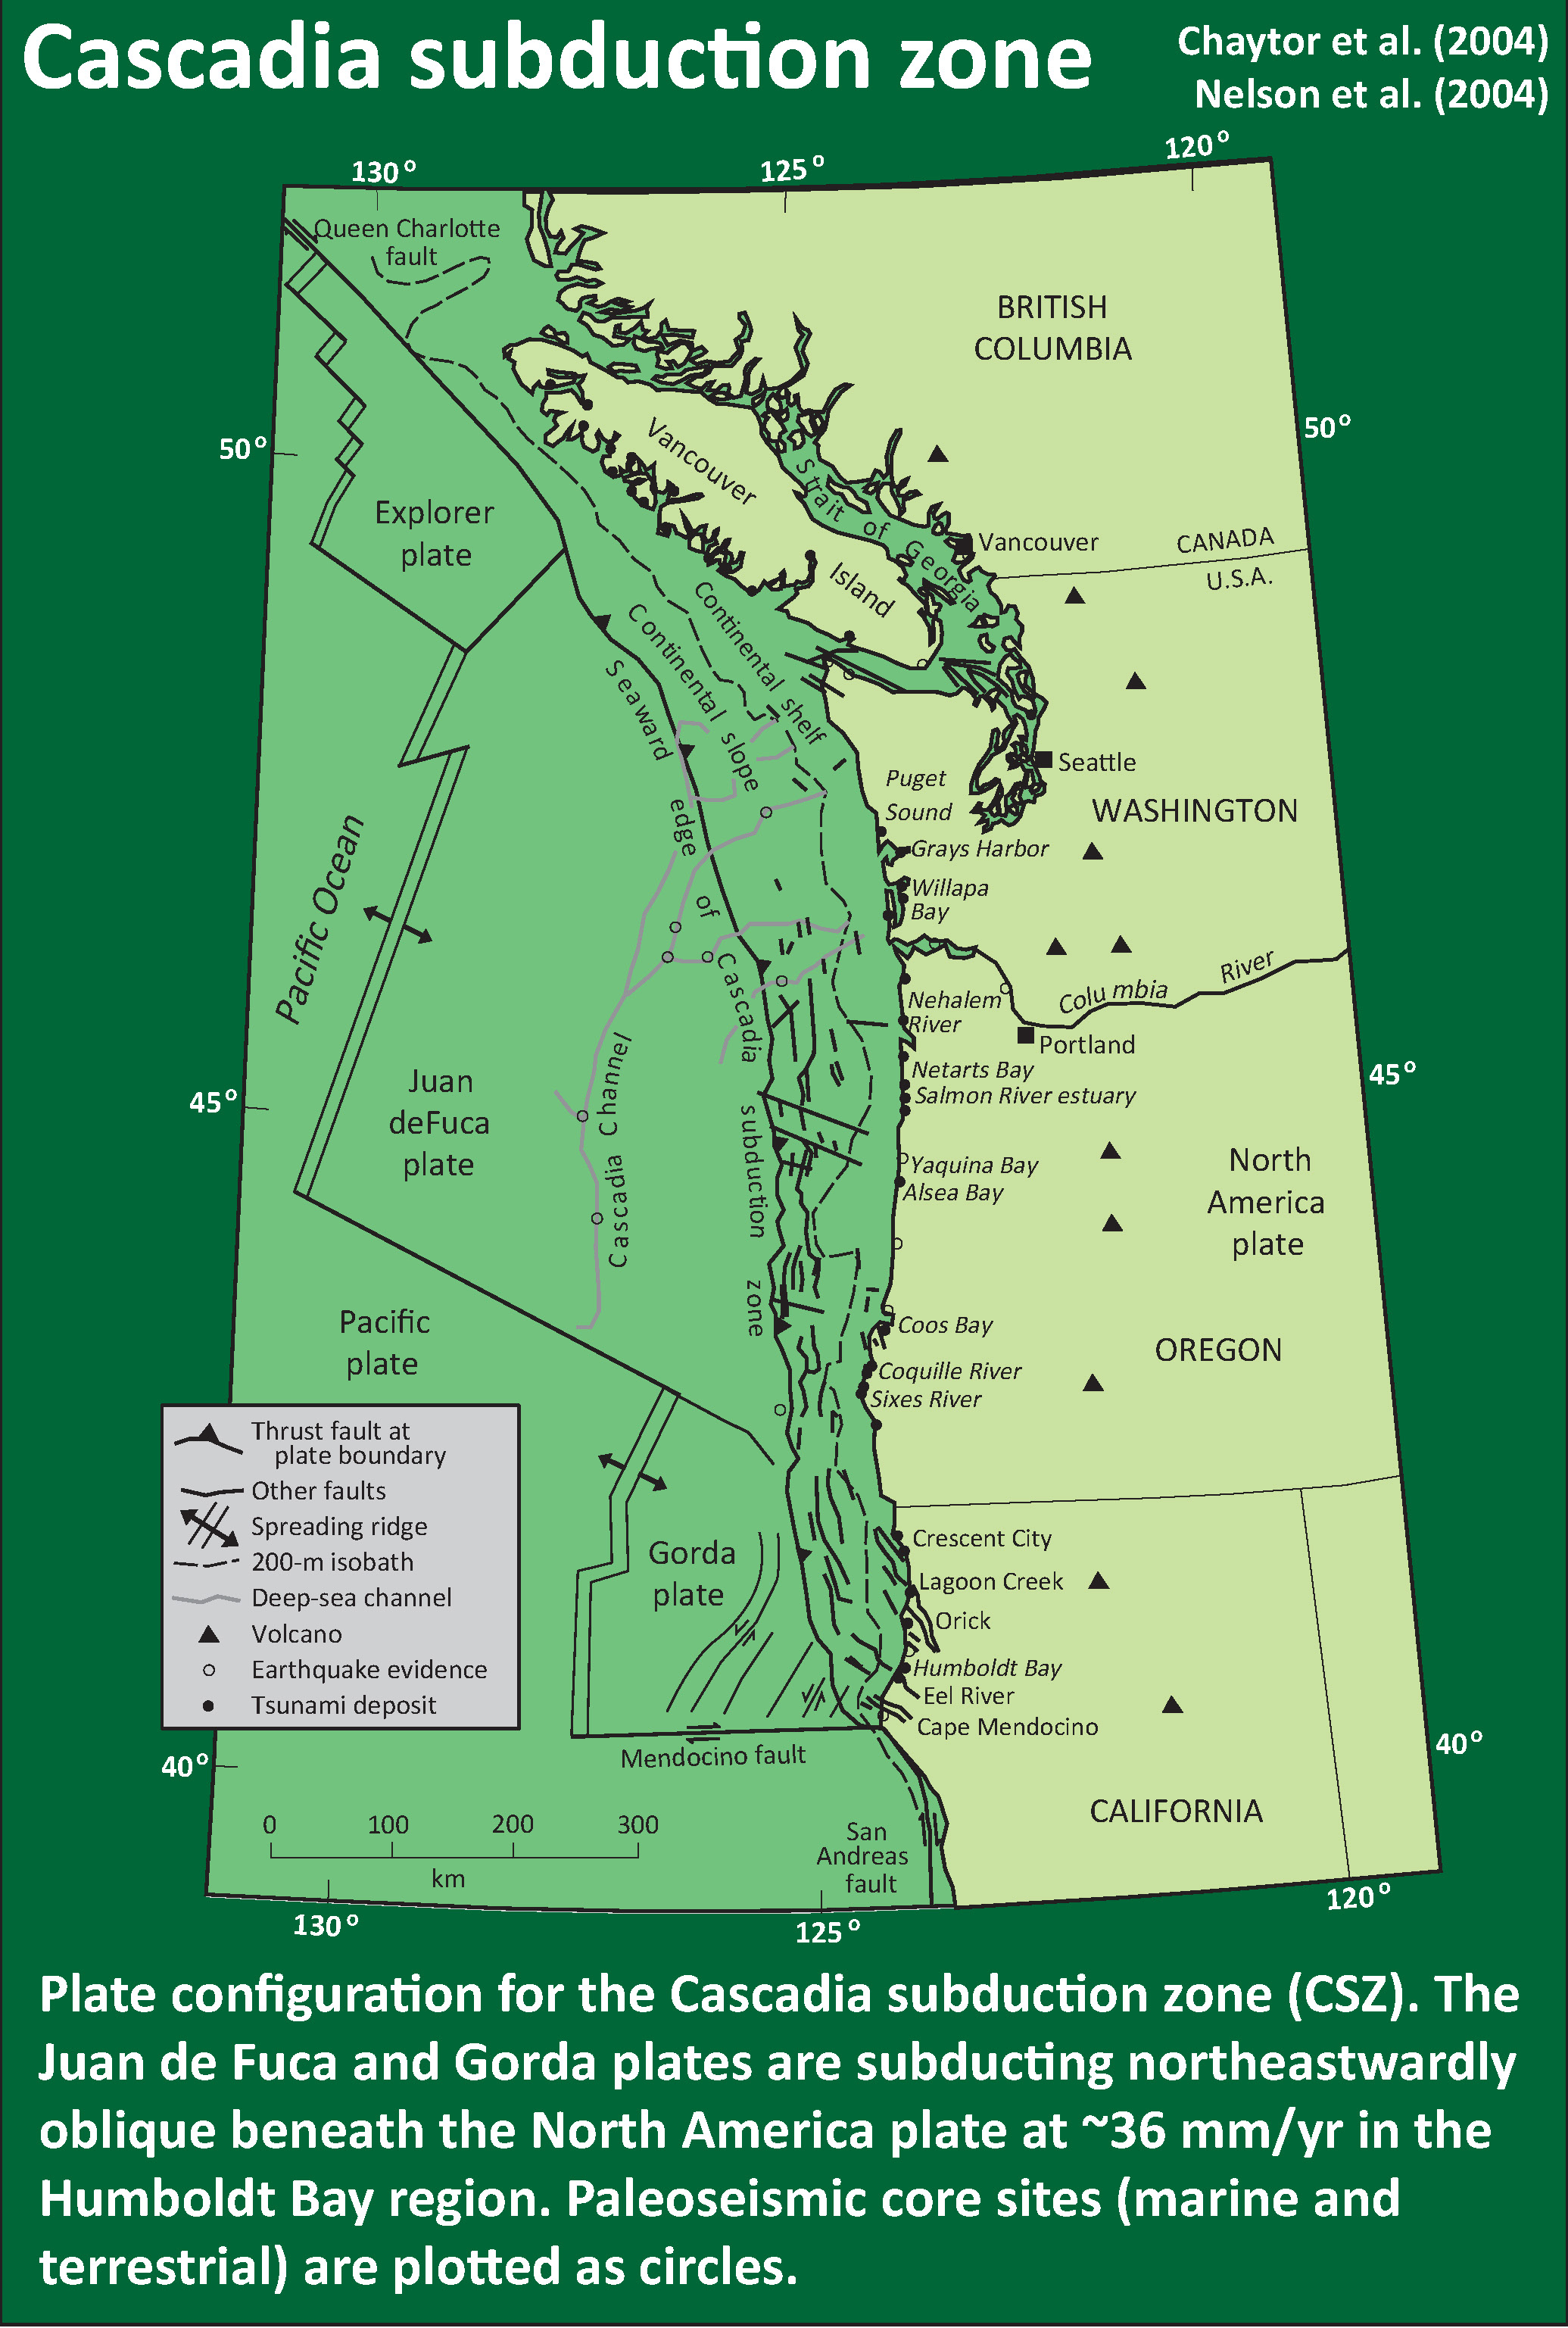
Below is an interpretive map showing these two earthquakes as red circles, as well as other seismicity for the past week. I include an inset map of the Cascadia subduction zone (after Chaytor et al., 2004; Nelson et al., 2004), an inset map from Chaytor et al. (2004), and from Rollins and Stein (2010). I explain these inset maps below.
I include labels for the plate boundary fault systems in the region and include generic focal mechanisms for these fault systems. There is a legend that shows how moment tensors can be interpreted. Moment tensors are graphical solutions of seismic data that show two possible fault plane solutions. One must use local tectonics, along with other data, to be able to interpret which of the two possible solutions is correct. The legend shows how these two solutions are oriented for each example (Normal/Extensional, Thrust/Compressional, and Strike-Slip/Shear). There is more about moment tensors and focal mechanisms at the USGS.
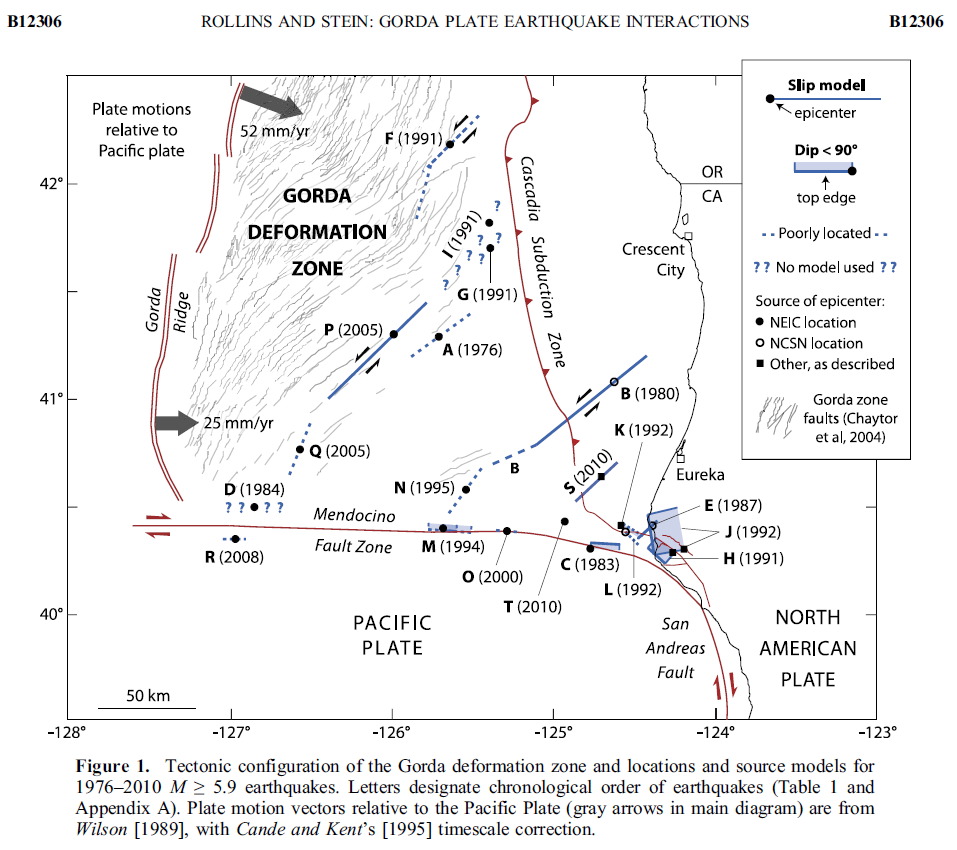
Based on the locations of these earthquakes, along with our knowledge of the local tectonics, I interpret the M 5.0 to possibly be a northeast striking left-lateral strike-slip fault earthquake. The M 4.9 could either be like that, or be an extensional earthquake (like the 2014.03.13 earthquake listed below). I summarized the regional tectonics of the Cascadia subduction zone recently here. The M 5.0 earthquake is similar to the earthquake “P” on the Rollins and Stein (2010) map.
**UPDATE: 2016.01.29 20:00 PST
Here is the updated map. Note the extensional moment tensor. This is aligned nicely with the ridges from the Gorda rise (which are visible in the large scale map at the bottom of this page.
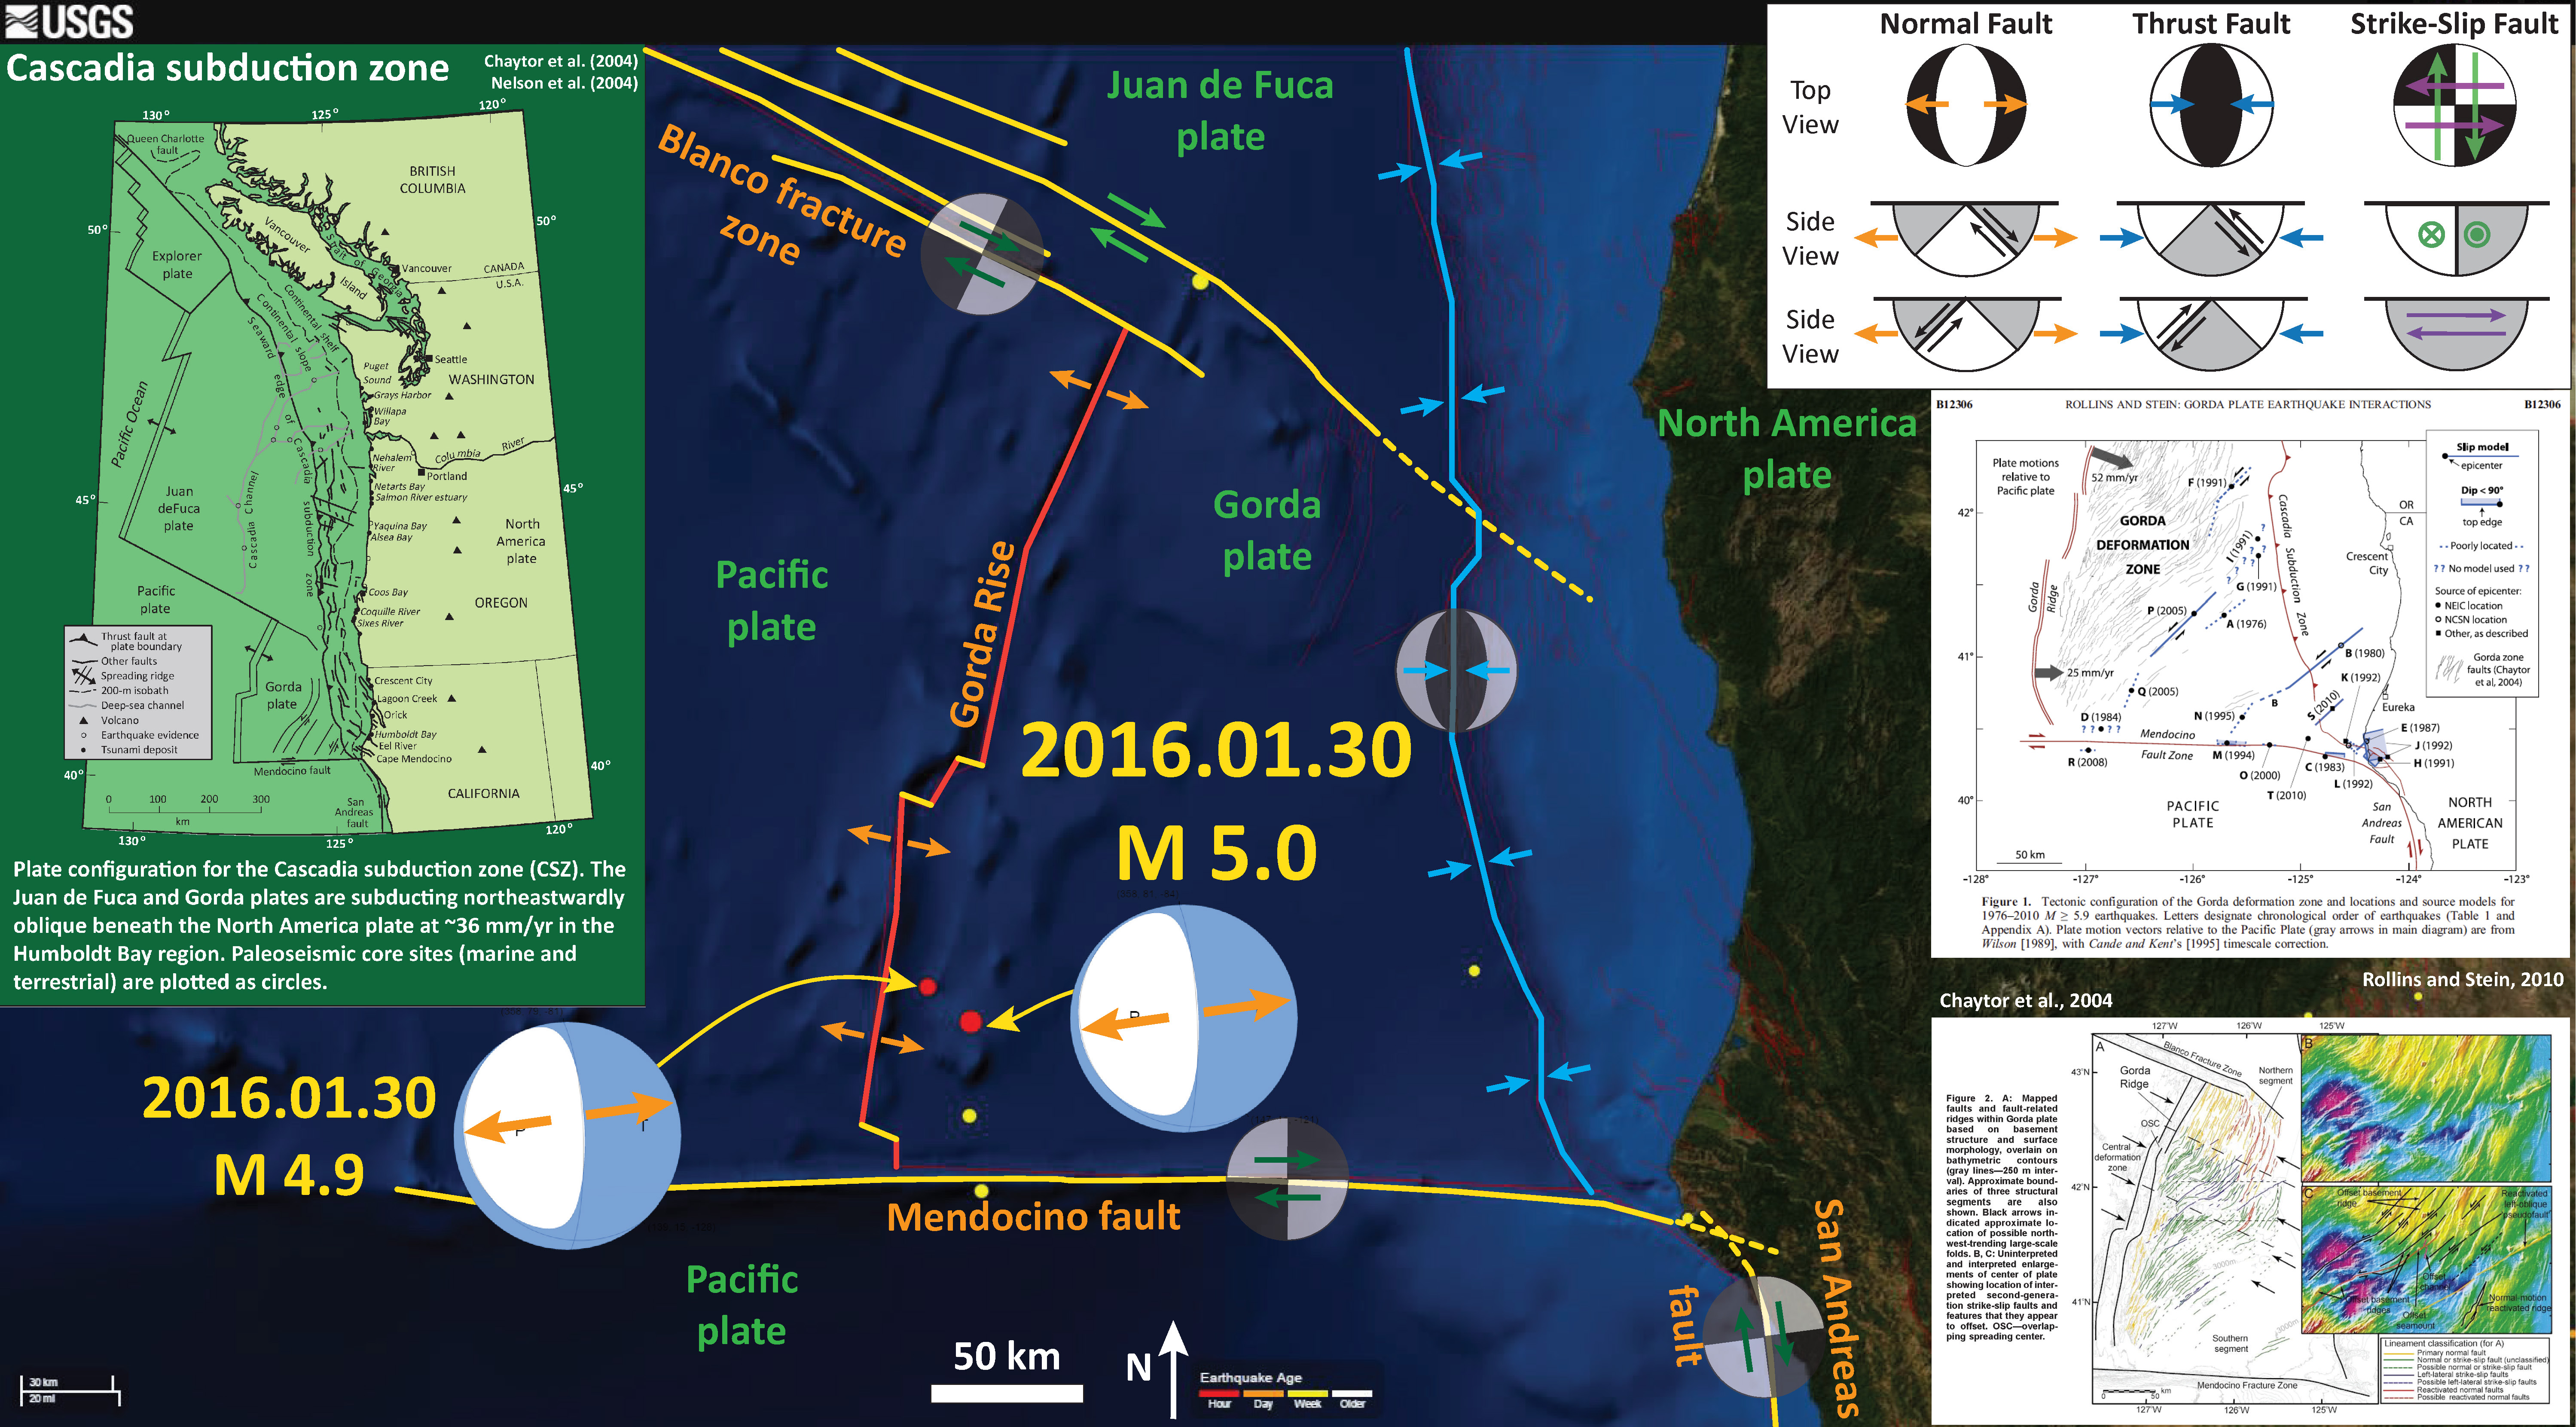
/end update
There was an earthquake along the Gorda rise in 2014, much to the north of these two earthquakes. Here is my earthquake report for that 2014.03.13 M 5.2 earthquake.
Here is a map of the Cascadia subduction zone, modified from Nelson et al. (2006). The Juan de Fuca and Gorda plates subduct norteastwardly beneath the North America plate at rates ranging from 29- to 45-mm/yr. Sites where evidence of past earthquakes (paleoseismology) are denoted by white dots. Where there is also evidence for past CSZ tsunami, there are black dots. These paleoseismology sites are labeled (e.g. Humboldt Bay). Some submarine paleoseismology core sites are also shown as grey dots. The two main spreading ridges are not labeled, but the northern one is the Juan de Fuca ridge (where oceanic crust is formed for the Juan de Fuca plate) and the southern one is the Gorda rise (where the oceanic crust is formed for the Gorda plate).
Here is a map from Chaytor et al. (2004) that shows some details of the faulting in the region. The moment tensor (at the moment i write this) shows a north-south striking fault with a reverse or thrust faulting mechanism. While this region of faulting is dominated by strike slip faults (and most all prior earthquake moment tensors showed strike slip earthquakes), when strike slip faults bend, they can create compression (transpression) and extension (transtension). This transpressive or transtentional deformation may produce thrust/reverse earthquakes or normal fault earthquakes, respectively. The transverse ranges north of Los Angeles are an example of uplift/transpression due to the bend in the San Andreas fault in that region.
Here is a map from Rollins and Stein, showing their interpretations of different historic earthquakes in the region. This was published in response to the Januray 2010 Gorda plate earthquake. The faults are from Chaytor et al. (2004).
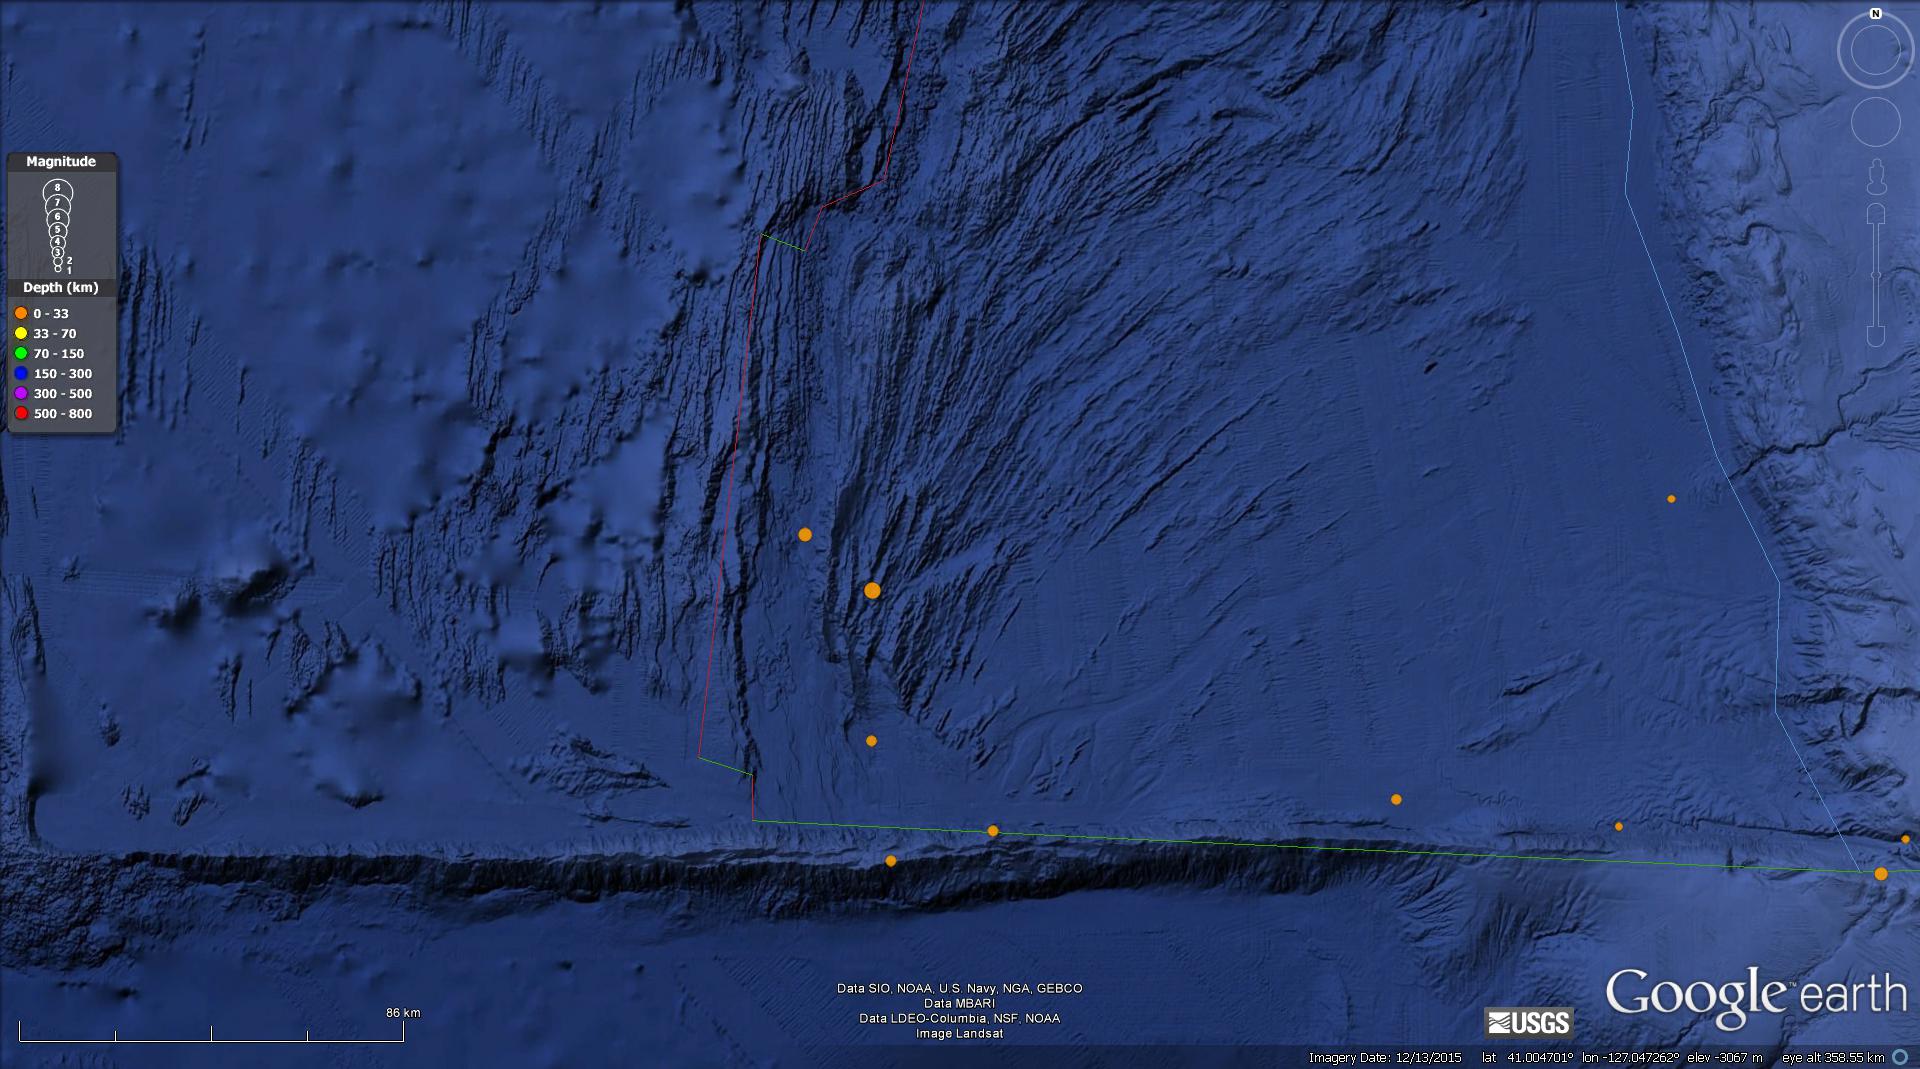
Here is a large scale map of the region for these two earthquakes. This is taken from Google Earth. The two largest orange circles (color represents depth < 33 km) are the M 5.0 and M 4.9, with diameter representing magnitude. The M 5.0 is clearly in the region where there are north-northeast striking faults.
I have Earthquake Reports for other CSZ related earthquakes here:
- 1700.09.26 M 9.0 Cascadia’s 315th Anniversary 2015.01.26
- 1700.09.26 M 9.0 Cascadia’s 316th Anniversary 2016.01.26 updated in 2017 and 2018
- 1992.04.25 M 7.1 Cape Mendocino 25 year remembrance
- 1992.04.25 M 7.1 Cape Mendocino 25 Year Remembrance Event Page
- Earthquake Information about the CSZ 2015.10.08
- 2022.12.20 M 6.4 Gorda plate
- 2020.05.18 M 5.5 Gorda Rise
- 2018.07.24 M 5.6 Gorda plate
- 2018.03.22 M 4.6/4.7 Gorda plate
- 2017.07.28 M 5.1 Gorda plate
- 2016.09.25 M 5.0 Gorda plate
- 2016.09.25 M 5.0 Gorda plate
- 2016.01.30 M 5.0 Gorda plate
- 2015.12.29 M 4.9 Gorda plate
- 2015.11.18 M 3.2 Gorda plate
- 2014.03.13 M 5.2 Gorda Rise
- 2014.03.09 M 6.8 Gorda plate p-1
- 2014.03.23 M 6.8 Gorda plate p-2
- 2010.01.10 M 6.5 Gorda plate
- 2019.08.29 M 6.3 Blanco transform fault
- 2018.08.22 M 6.2 Blanco transform fault
- 2018.07.29 M 5.3 Blanco transform fault
- 2015.06.01 M 5.8 Blanco transform fault p-1
- 2015.06.01 M 5.8 Blanco transform fault p-2 (animations)
- 2021.12.20 M 5.7 & 6.2 Mendocino fault
- 2020.03.09 M 5.8 Mendocino fault
- 2018.01.25 M 5.8 Mendocino fault
- 2017.09.22 M 5.7 Mendocino fault
- 2016.12.08 M 6.5 Mendocino fault, CA
- 2016.12.08 M 6.5 Mendocino fault, CA Update #1
- 2016.12.05 M 4.3 Petrolia CA
- 2016.10.27 M 4.1 Mendocino fault
- 2016.09.03 M 5.6 Mendocino
- 2016.01.02 M 4.5 Mendocino fault
- 2015.11.01 M 4.3 Mendocino fault
- 2015.01.28 M 5.7 Mendocino fault
- 2015.11.01 M 4.3 Mendocino fault
- 2015.01.28 M 5.7 Mendocino fault
- 2020.03.18 M 5.2 Petrolia
- 2019.06.23 M 5.6 Petrolia
- 2017.03.06 M 4.0 Cape Mendocino
- 2016.11.02 M 3.6 Oregon
- 2016.01.07 M 4.2 NAP(?)
- 2015.10.29 M 3.4 Bayside
- 2018.10.22 M 6.8 Explorer plate
- 2017.01.07 M 5.7 Explorer plate
- 2016.03.19 M 5.2 Explorer plate
- 2017.06.11 M 3.5 Gorda or NAP?
- 2016.07.21 M 4.7 Gorda or NAP? p-1
- 2016.07.21 M 4.7 Gorda or NAP? p-2
Cascadia subduction zone
General Overview
Earthquake Reports
Gorda plate
Blanco transform fault
Mendocino fault
Mendocino triple junction
North America plate
Explorer plate
Uncertain
References:
- Chaytor, J.D., Goldfinger, C., Dziak, R.P., Fox, C.G., 2004. Active deformation of the Gorda plate: Constraining deformation models with new geophysical data. Geology 32, 353-356.
- Nelson, A.R., Kelsey, H.M., Witter, R.C., 2006. Great earthquakes of variable magnitude at the Cascadia subduction zone. Quaternary Research 65, 354-365.
- Rollins, J.C., Stein, R.S., 2010. Coulomb Stress Interactions Among M ≥ 5.9 Earthquakes in the Gorda Deformation Zone and on the Mendocino Fault Zone, Cascadia Subduction Zone, and Northern San Andreas Fault. Journal of Geophysical Research 115, 19 pp.
6 thoughts on “Earthquake Report: Gorda!”