
This morning (my time) I received a notification from the National Tsunami Warning Center, the organization responsible for generating notifications for my locality (California).
There was a magnitude M 7.0 earthquake in Papua New Guinea.
https://earthquake.usgs.gov/earthquakes/eventpage/at00rsi26z/executive
This earthquake was almost intermediate depth (about 63 km), not on a tsunamigenic fault, and far inland (so likely no tsunami).
There was an event last September just to the east. Here is the earthquake report for that event.
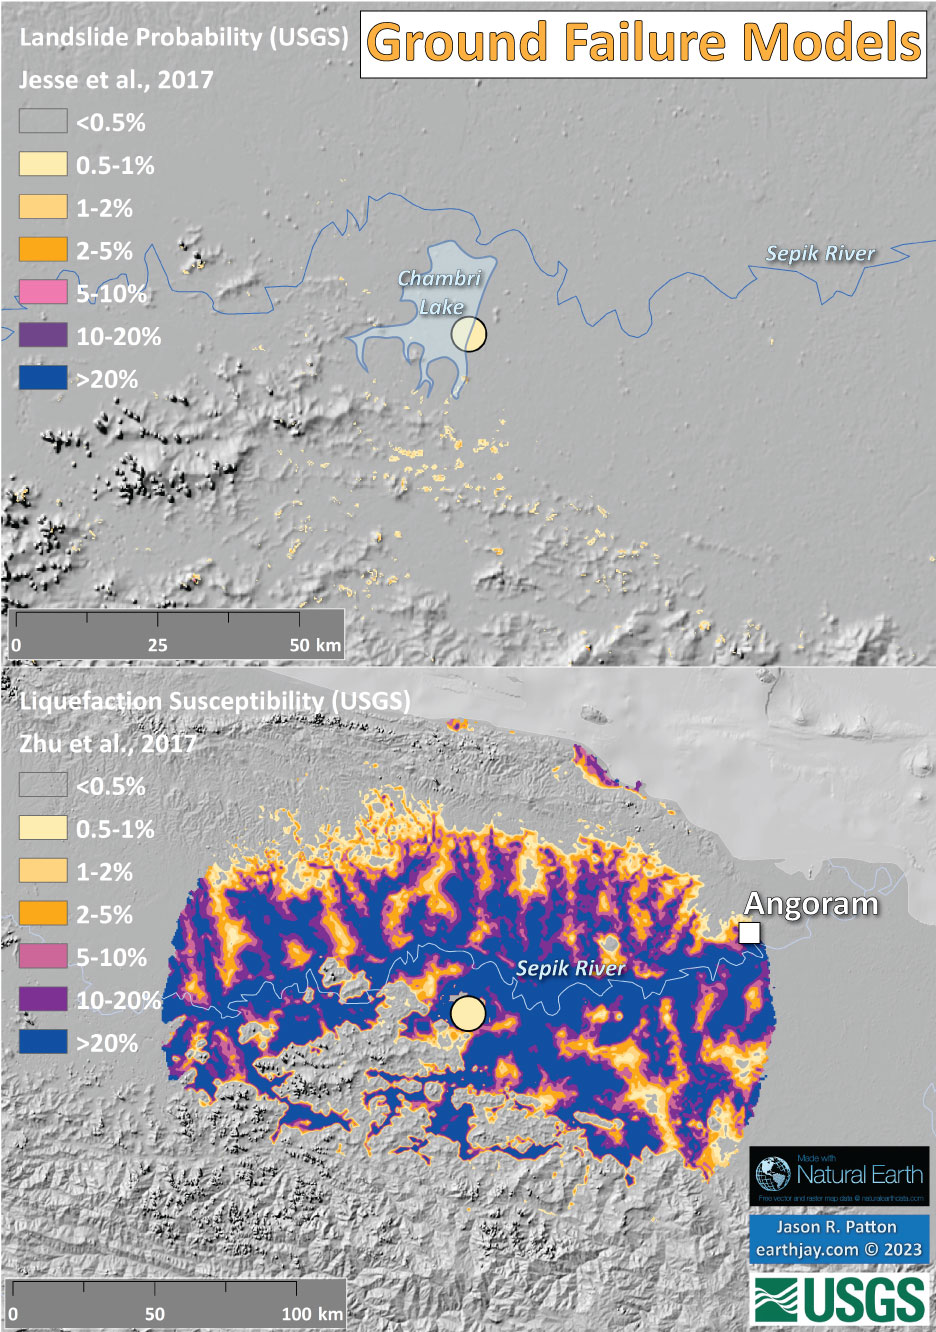
The USGS includes many products on their earthquake pages. We can see from their ground failure products that this earthquake likely generated significant liquefaction. I show this on the interpretive poster and include a write up about ground failure generated by earthquakes below.
Something that influences the liquefaction and landslide modeling is the topography. The M 7.0 earthquake happened in an area that is mostly low lying Earth adjacent to the Sepik River system. The ground is probably highly saturated with water.
Also, there is little steep topography in the area, which probably contributes to the low chance for landslides in the USGS model for earthquake triggered landslides.
As always, we hope that there was not much suffering from this earthquake. The shaking intensity was high, so it must have been quite terrifying. The region does not have a high population density, so the USGS PAGER alert estimate reflects this. There were about 133,000 people who may have been exposed to intensity MMI 7 and 333,000 exposed to MMI 6.
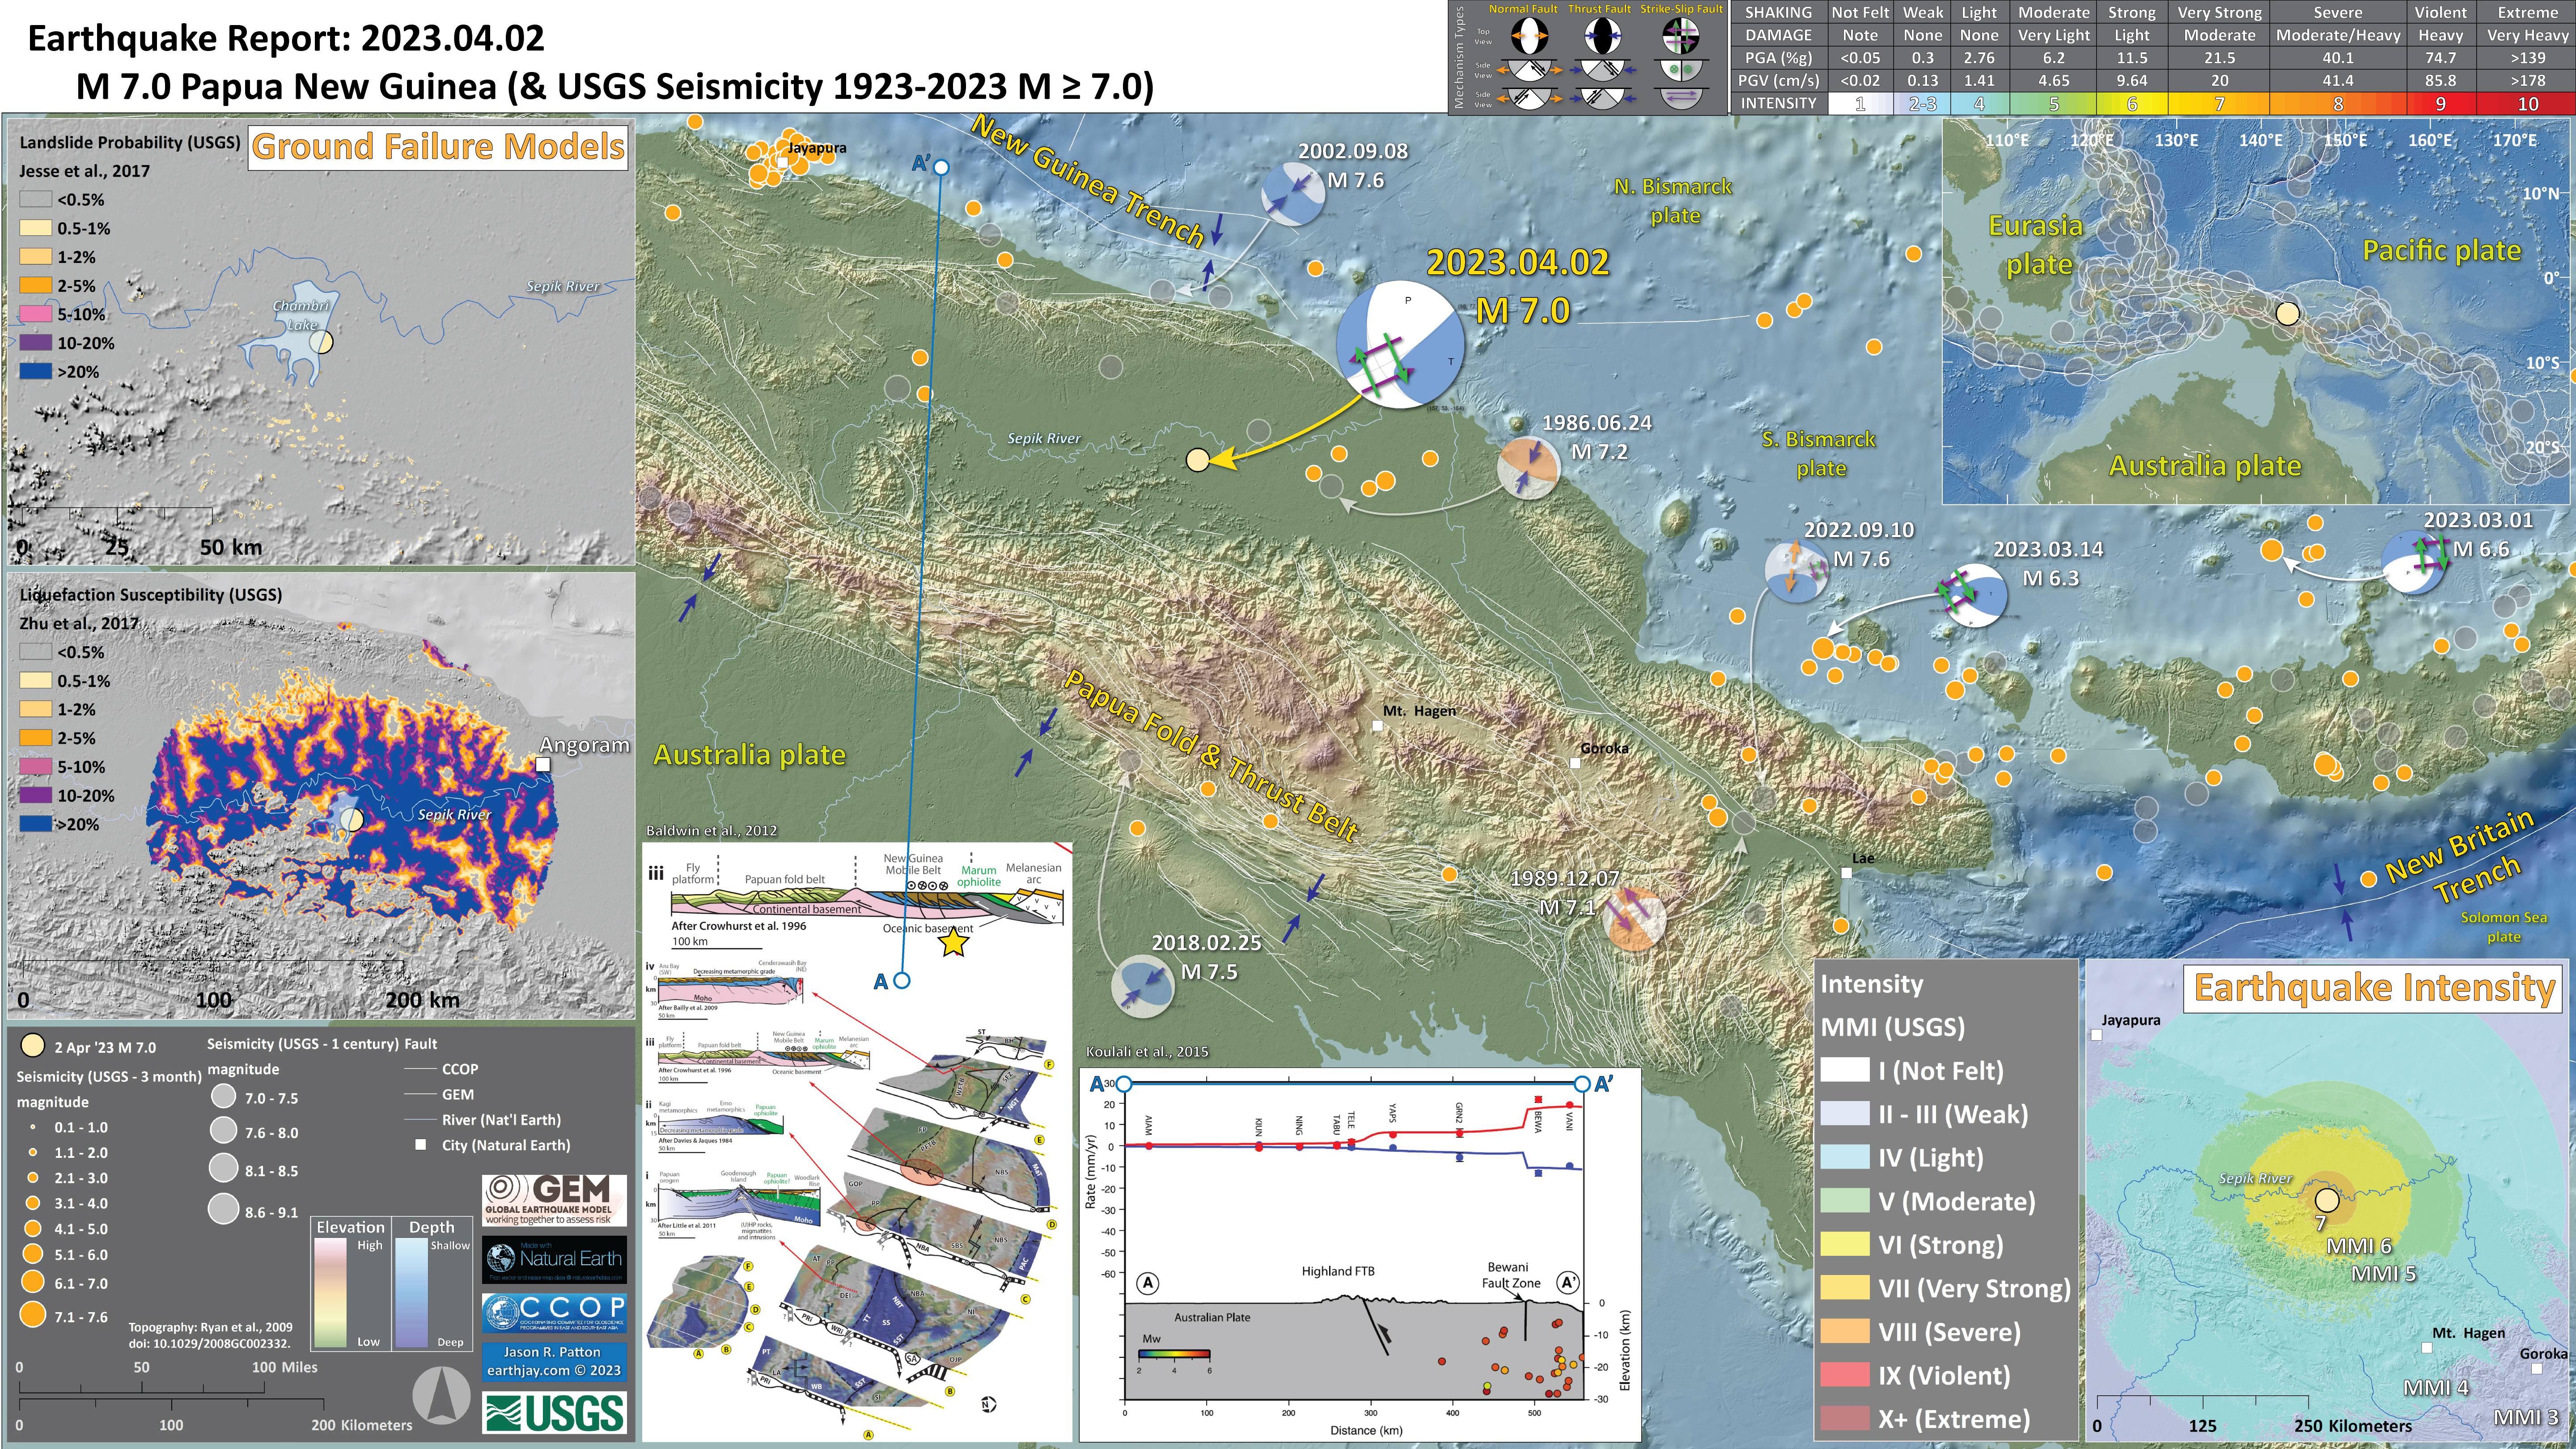
Below is my interpretive poster for this earthquake
- I plot the seismicity from the past 3 months, with diameter representing magnitude (see legend). I include earthquake epicenters from 1923-2023 with magnitudes M ≥ 0.0 in one version.
- I plot the USGS fault plane solutions (moment tensors in blue and focal mechanisms in orange), possibly in addition to some relevant historic earthquakes.
- A review of the basic base map variations and data that I use for the interpretive posters can be found on the Earthquake Reports page. I have improved these posters over time and some of this background information applies to the older posters.
- Some basic fundamentals of earthquake geology and plate tectonics can be found on the Earthquake Plate Tectonic Fundamentals page.
- In the upper right corner is a map showing the plate tectonic boundaries (from the GEM) and seismicity from the past century (from the USGS).
- In the lower right corner is a map that shows the earthquake intensity using the modified Mercalli intensity scale. Earthquake intensity is a measure of how strongly the Earth shakes during an earthquake, so gets smaller the further away one is from the earthquake epicenter. The map colors represent a model of what the intensity may be. The USGS has a system called “Did You Feel It?” (DYFI) where people enter their observations from the earthquake and the USGS calculates what the intensity was for that person. The dots with yellow labels show what people actually felt in those different locations.
- In the upper left corner are two maps showing the probability of earthquake triggered landslides and possibility of earthquake induced liquefaction. I will describe these phenomena below.
- In the lower left center is a figure from Baldwin et al. (2012). This figure shows a series of cross sections along this convergent plate boundary from the Solomon Islands in the east to Papua New Guinea in the west. Cross section ‘D’ is the most representative for the earthquakes today. I present the map and this figure again below, with their original captions. Above the map is cross section D-D’ that shows the PFTB to the south of today’s earthquake. I placed the yellow star marking today’s M 7.0 below the cross section. The faults are actually quite complex, so this schematic illustration may not be a perfect representation of the faults here.
- In the bottom center is a profile showing the GPS velocities across the two main fault systems that profile A-A’ crosses (also shown on map). The M 7.0 is somewhere between these two fault systems (possibly along a fault that leads up to the Fold and Thrust Belt(?).
I include some inset figures. Some of the same figures are located in different places on the larger scale map below.
- Here is the map with 3 month’s seismicity plotted.
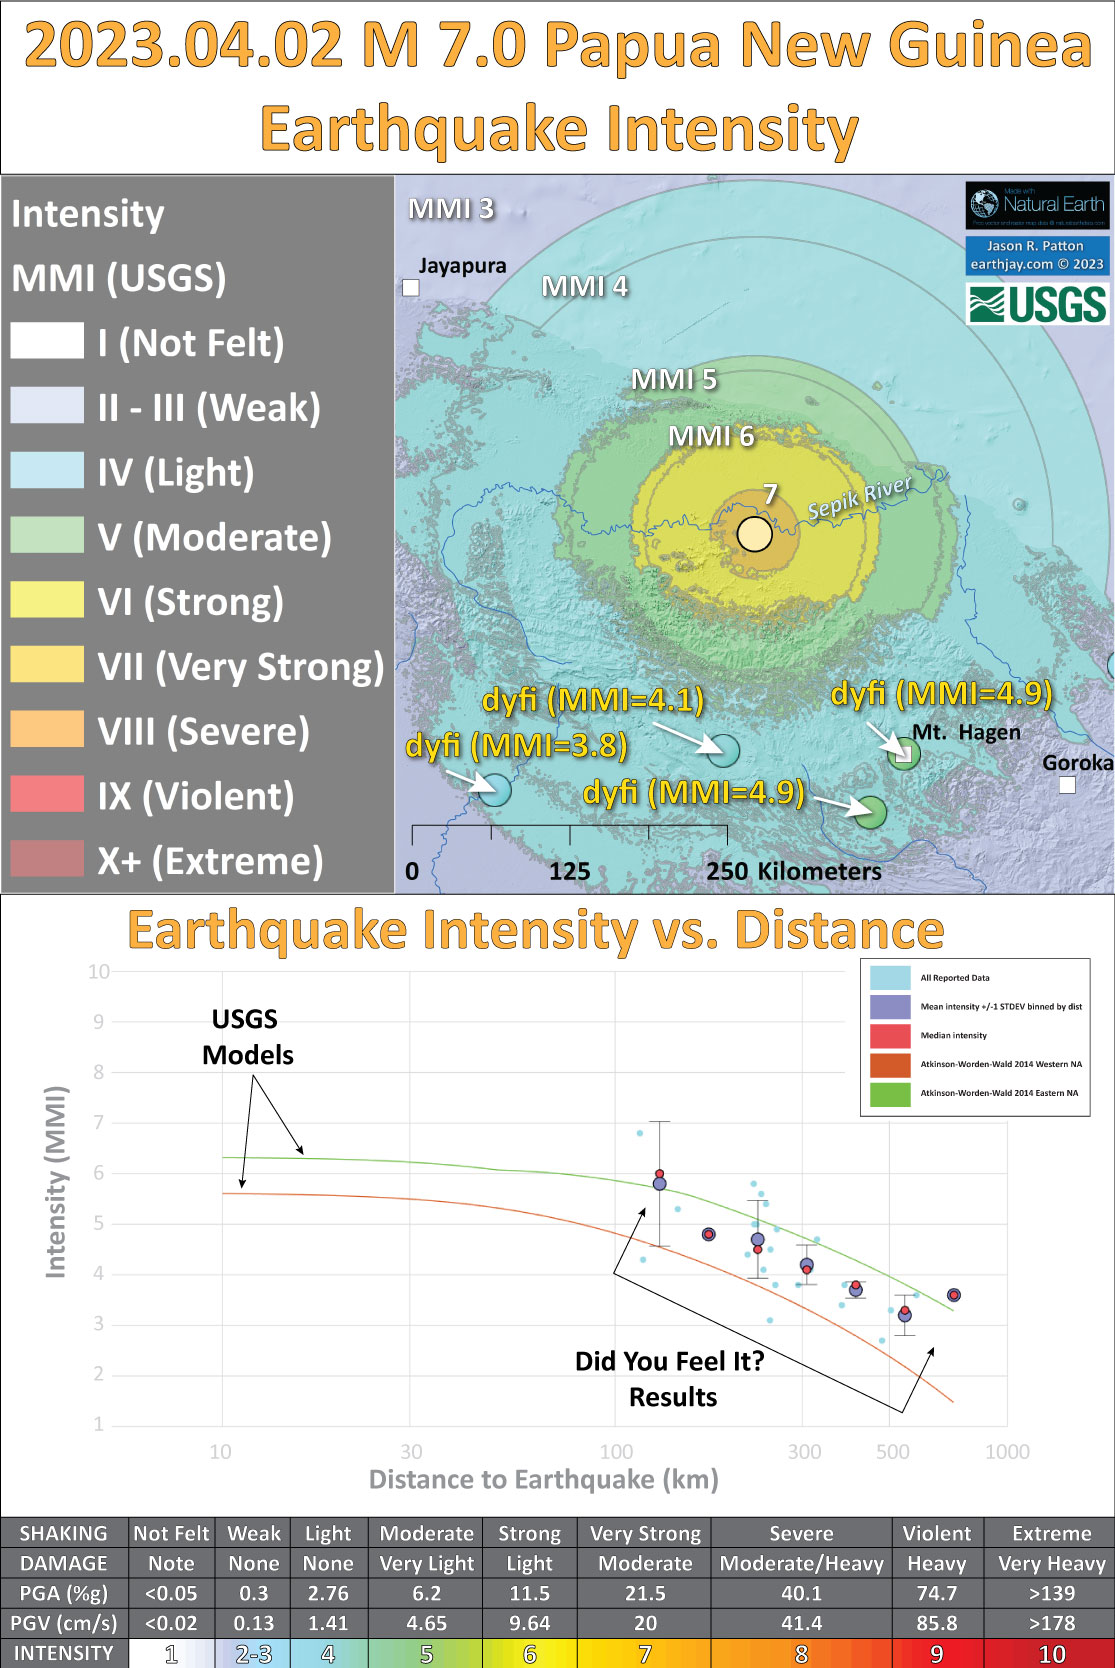
Shaking Intensity
- Here is a figure that shows a more detailed comparison between the modeled intensity and the reported intensity. Both data use the same color scale, the Modified Mercalli Intensity Scale (MMI). More about this can be found here. The colors and contours on the map are results from the USGS modeled intensity. The DYFI data are plotted as colored dots (color = MMI, diameter = number of reports).
- In the upper panel is the USGS Did You Feel It reports map, showing reports as colored dots using the MMI color scale. Underlain on this map are colored areas showing the USGS modeled estimate for shaking intensity (MMI scale).
- In the lower panel is a plot showing MMI intensity (vertical axis) relative to distance from the earthquake (horizontal axis). The models are represented by the green and orange lines. The DYFI data are plotted as light blue dots. The mean and median (different types of “average”) are plotted as orange and purple dots. Note how well the reports fit the green line (the model that represents how MMI works based on quakes in California).
- Below the lower plot is the USGS MMI Intensity scale, which lists the level of damage for each level of intensity, along with approximate measures of how strongly the ground shakes at these intensities, showing levels in acceleration (Peak Ground Acceleration, PGA) and velocity (Peak Ground Velocity, PGV).
- Here is the Holm et al. (2016) figure.
- These maps from Holm et al. (2016) show the tectonic plate boundaries and plates/microplates.
- The lower panel includes symbology for the magmatic centers associated with the different arcs analyzed in their study.
- The this map and cross section pair shows the Holm et al. (2016) interpretation of the oceanic crust in this region in the current position.
- Koulali et al (2015) use GPS data to resolve the kinematics of the central-eastern Papua New Guinea region. The first figure below is a map that shows the GPS velocities in this region There are two cross section profiles labeled on the map (the M 7.0 earthquake happened to the east of A-A’). Note the complicated and detailed fault mapping (the balck lines). The convergence is generally perpendicular to the PFTB in the east and more oblique to the PFTB on the western portion of this map.
- Here are the two profiles. The red and blue lines plot vertical land motion (VLM) rates in mm/yr and show strain accumulates across the region. Today’s earthquake happened in the region labeled ‘Highland FTB.’ The plot shows that ~5 mm/yr of strain accumulates in this fault system.
- This is the Cloos et al. (2005) map from the poster.
- Something that came up this week during a tsunami workshop/meeting was about the activity for each plate boundary that has a potential to generate trans-Pacific tsunami impacting the U.S. and U.S. territories.
- Over long periods of time, the plate boundaries around the world change shape. At some times, the relative plate motion between plates is localized one fault system. At other times, the active plate boundary fault is along a different fault system.
- The map below includes information about the activity of the plate boundary faults. The active convergent zones are the New Britain subduction zone, the Ramu-Markham fault zone (RMFZ), the Seram subduction zone, part of the Papuan Fold and Thrust Belt, and parts of the New Guinea subduction zone. The strike-slip zones are the Bewani-Torricelli fault zone, the Mamberamo deformation zone, the Yapen fault zone, the Sorong fault zone, and the Tarera-Aiduna fault zone.
- This map shows evidence for several different paleo-plate boundaries. Imagine how each subduction zone once had a pair of plates and those plates are still there. Even while inactive, earthquakes can occur on these faults.
- This is the Cloos et al. (2005) cross section, showing a different interpretation of the delaminated slab.
- Here is the tectonic map figure from Sappie and Cloos (2004). Their work was focused on western PNG, so their interpretations are more detailed there (and perhaps less relevant for us for these eastern PNG earthquakes).
- This is the two panel figure from Holm and Richards (2013) that shows how the New Britain trench megathrust splays into three thrust faults as this fault system heads onto PNG. They plot active thrust faults as black triangles (with the triangles on the hanging wall side of the fault) and inactive thrust faults as open triangles. So, either the NG trench subduction zone extends further east than is presented in earlier work or the Bundi Fault Zone is the fault associated with this deep seismicity.
- This map shows plate velocities and euler poles for different blocks. I include the figure caption below as a blockquote.
- This figure incorporates cross sections and map views of various parts of the regional tectonics (Baldwin et al., 2012). These deep earthquakes are nearest the cross section D (though are much deeper than these shallow cross sections). I include the figure caption below as a blockquote.
- Here is the relevant cross section from Baldwin et al. (2012).
- Here is map that shows the tectonics in and to the east of Papua New Guinea from Ott and Mann (2015).
- These authors use seismic reflection data and onshore geologic and GPS studies to look at the formation of the Aure-Moresby and Papuan fold and thrust belts.
Some Relevant Discussion and Figures

Topography, bathymetry and regional tectonic setting of New Guinea and Solomon Islands. Arrows indicate rate and direction of plate motion of the Australian and Pacific plates (MORVEL, DeMets et al., 2010); Mamberamo thrust belt, Indonesia (MTB); North Fiji Basin (NFB)
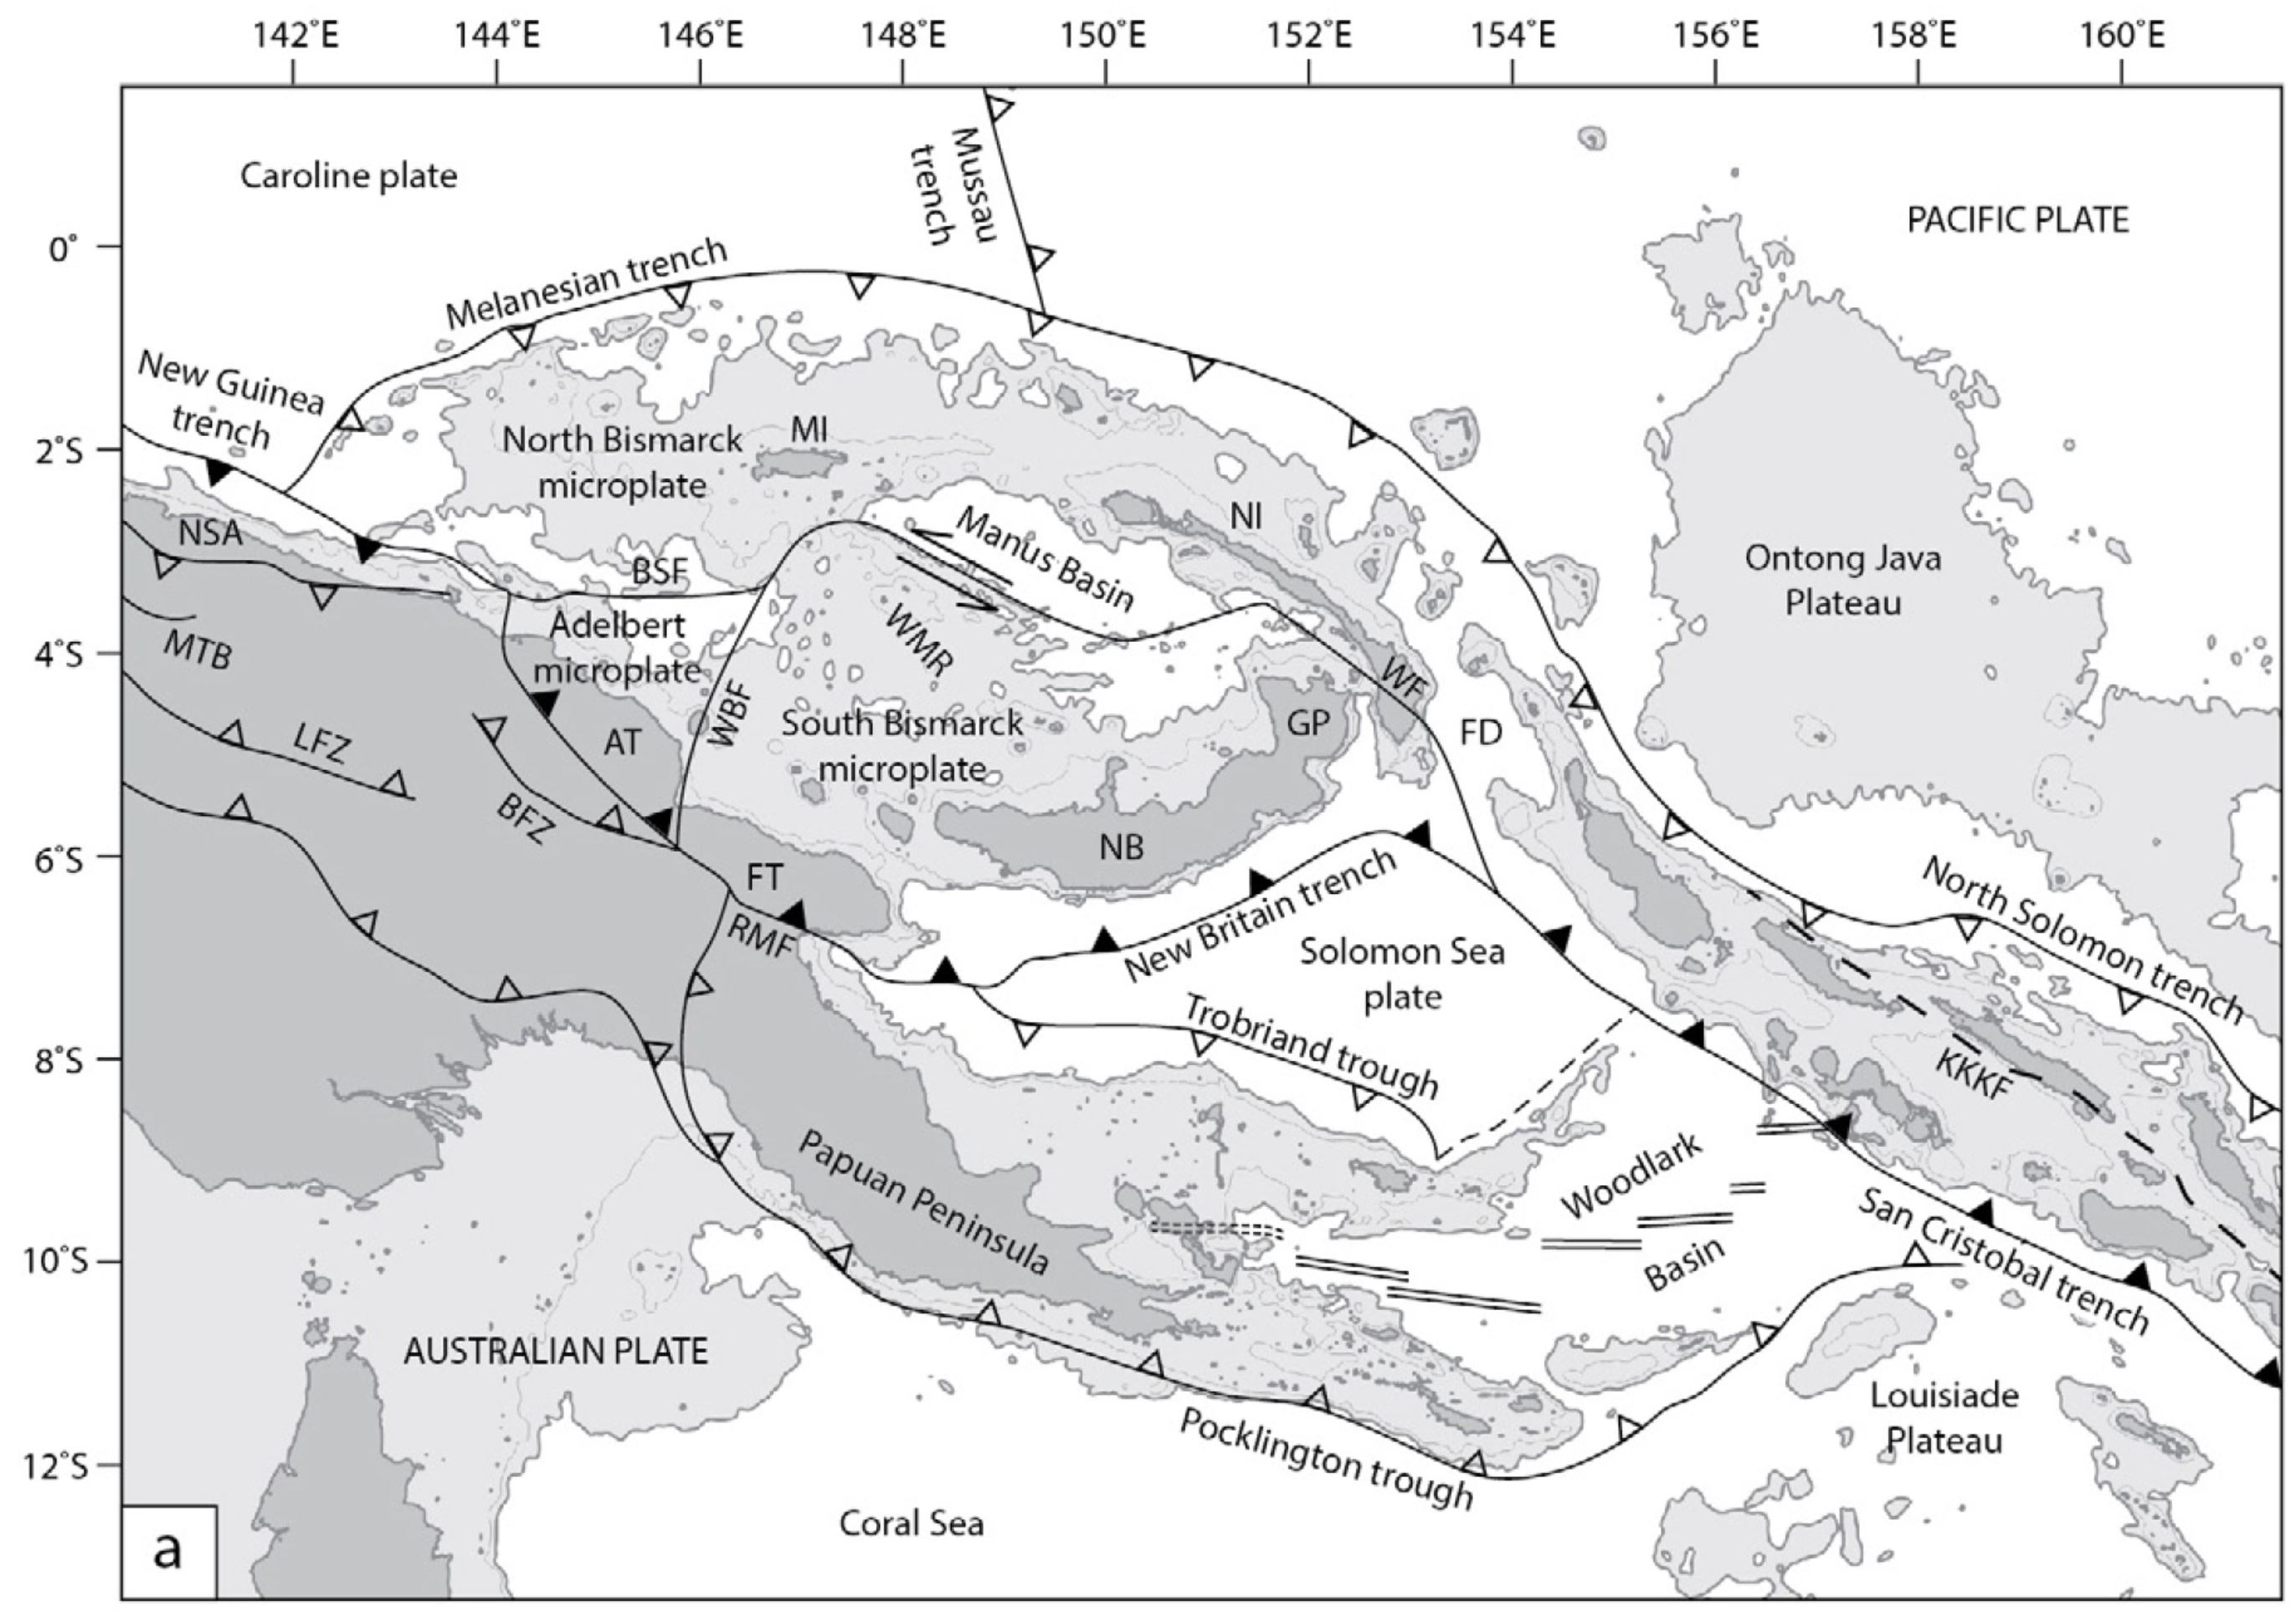
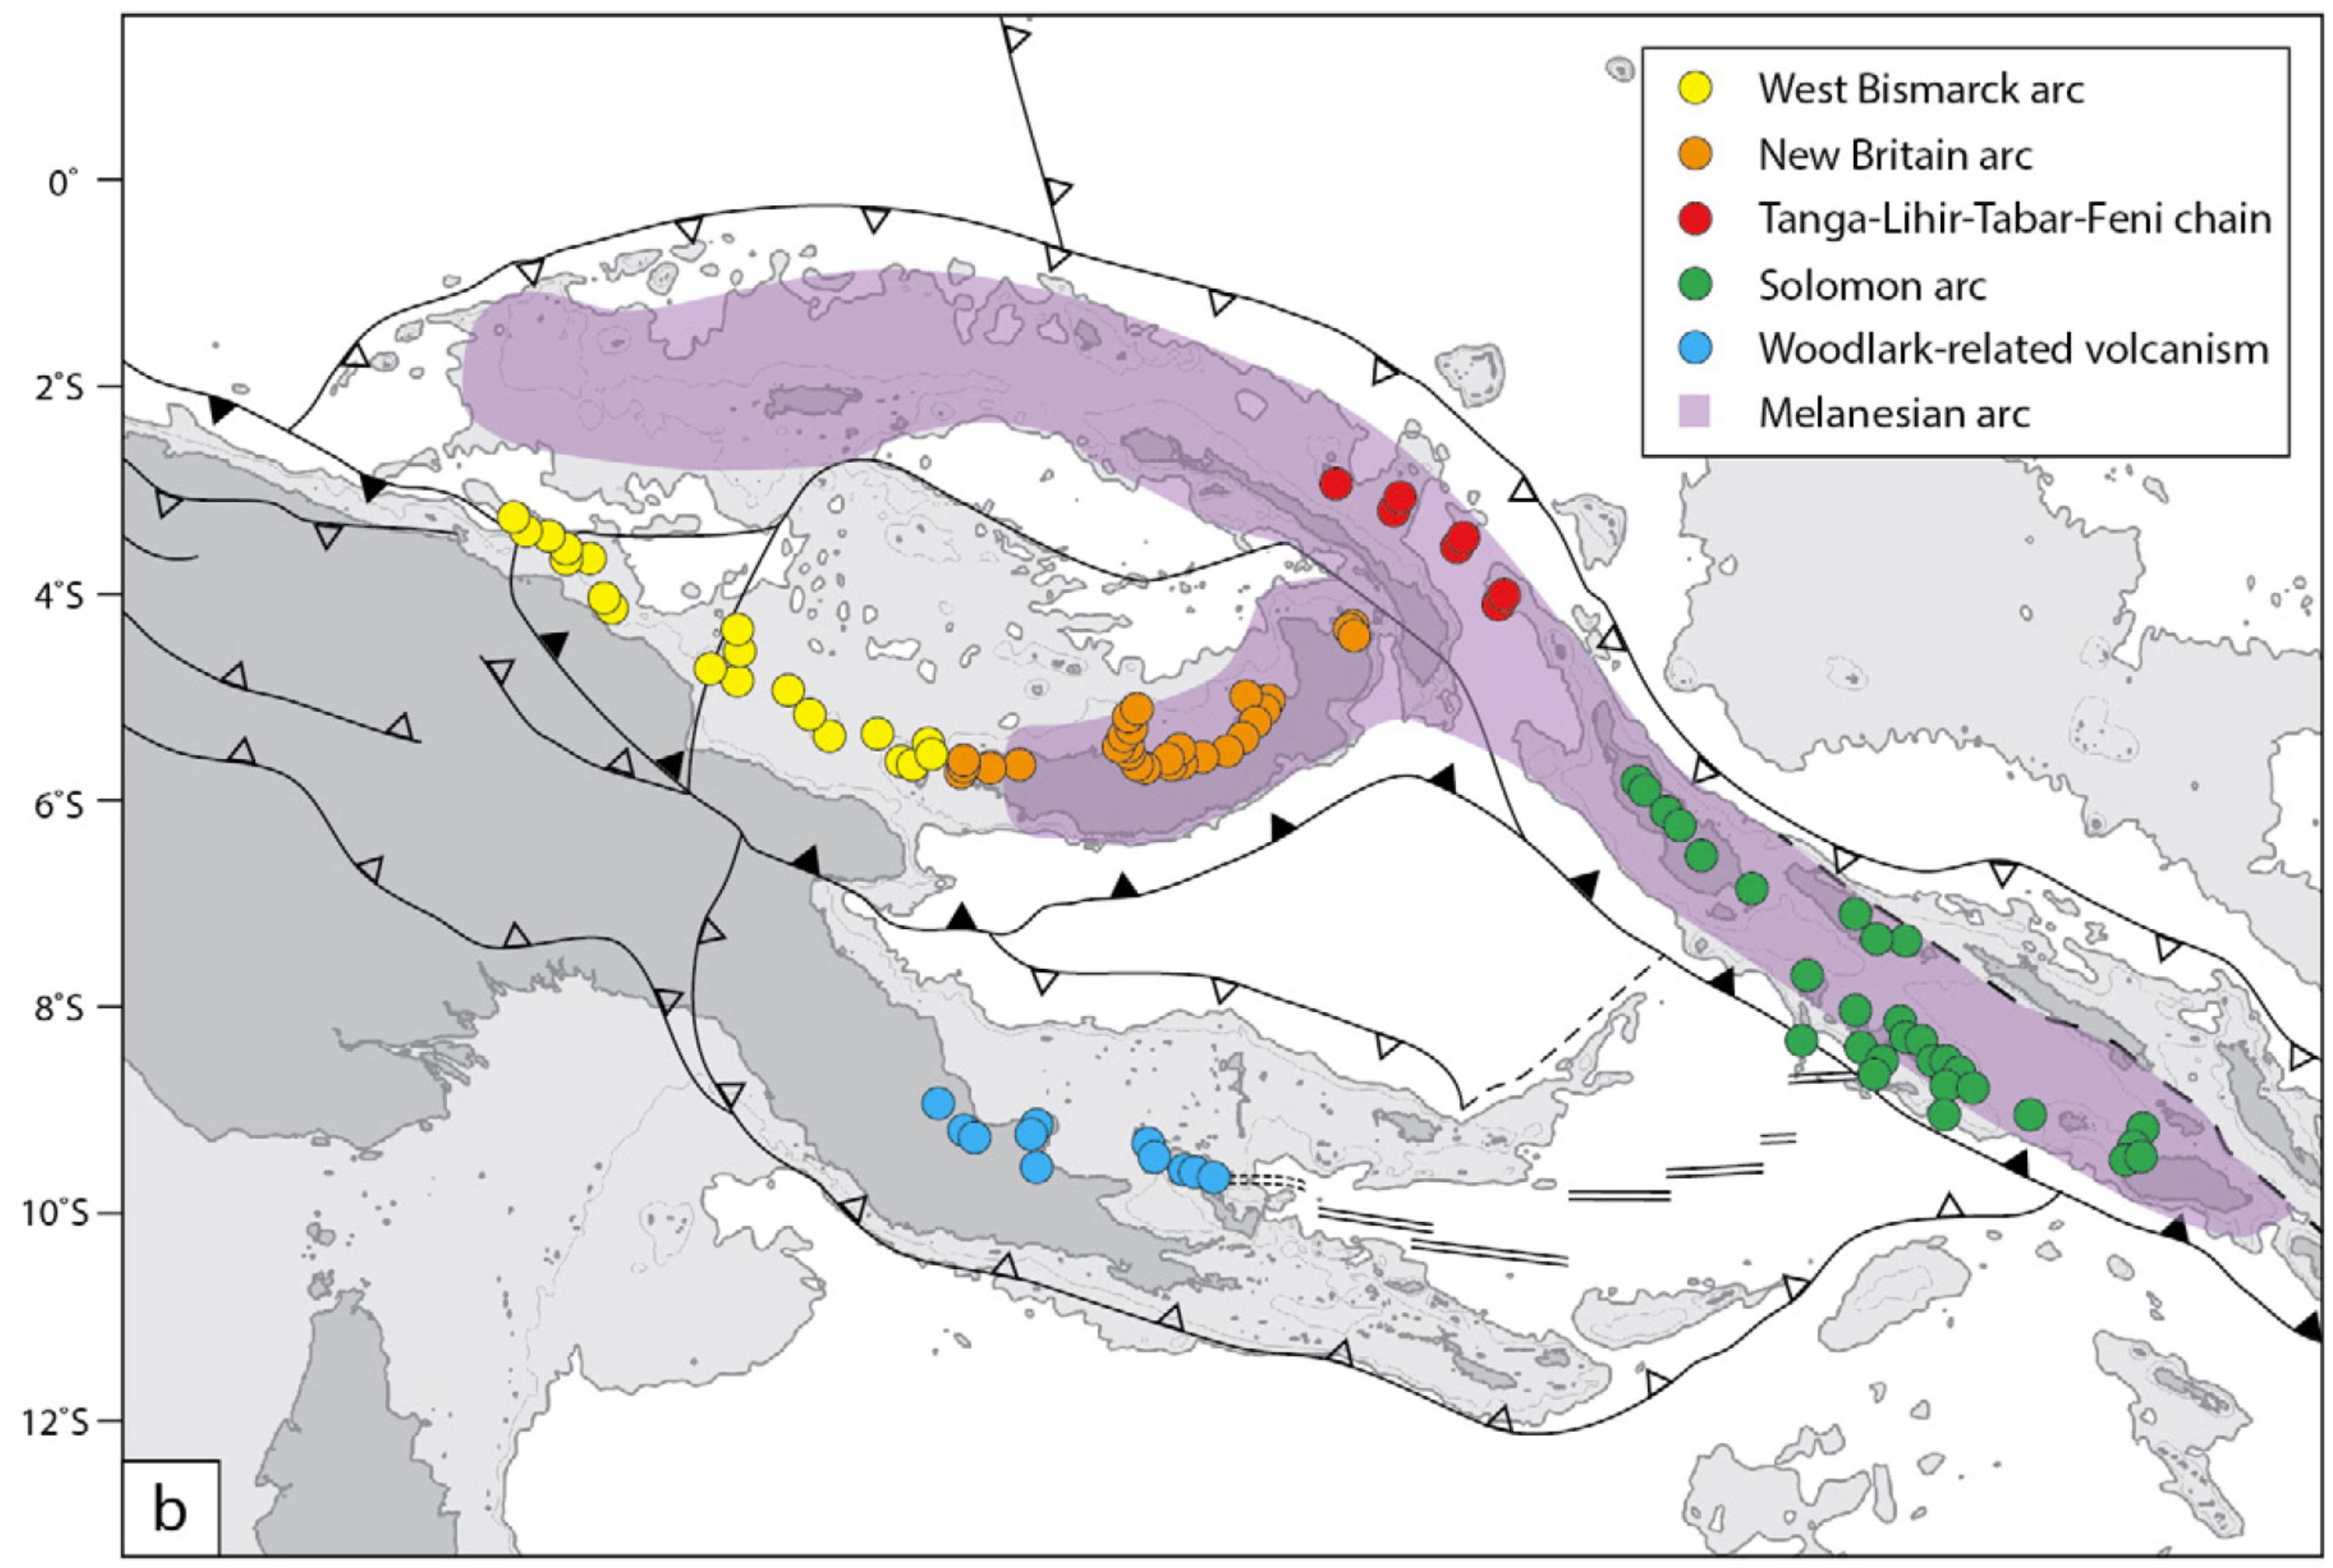
Tectonic setting of Papua New Guinea and Solomon Islands. a) Regional plate boundaries and tectonic elements. Light grey shading illustrates bathymetry b2000mbelow sea level indicative of continental or arc crust, and oceanic plateaus; 1000mdepth contour is also shown. Adelbert Terrane (AT); Bismarck Sea fault (BSF); Bundi fault zone (BFZ); Feni Deep (FD); Finisterre Terrane (FT); Gazelle Peninsula (GP); Kia-Kaipito-Korigole fault zone (KKKF); Lagaip fault zone (LFZ); Mamberamo thrust belt (MTB); Manus Island (MI); New Britain (NB); New Ireland (NI); North Sepik arc (NSA); Ramu-Markham fault (RMF); Weitin Fault (WF);West Bismarck fault (WBF); Willaumez-Manus Rise (WMR). b) Magmatic arcs and volcanic centers related to this study.
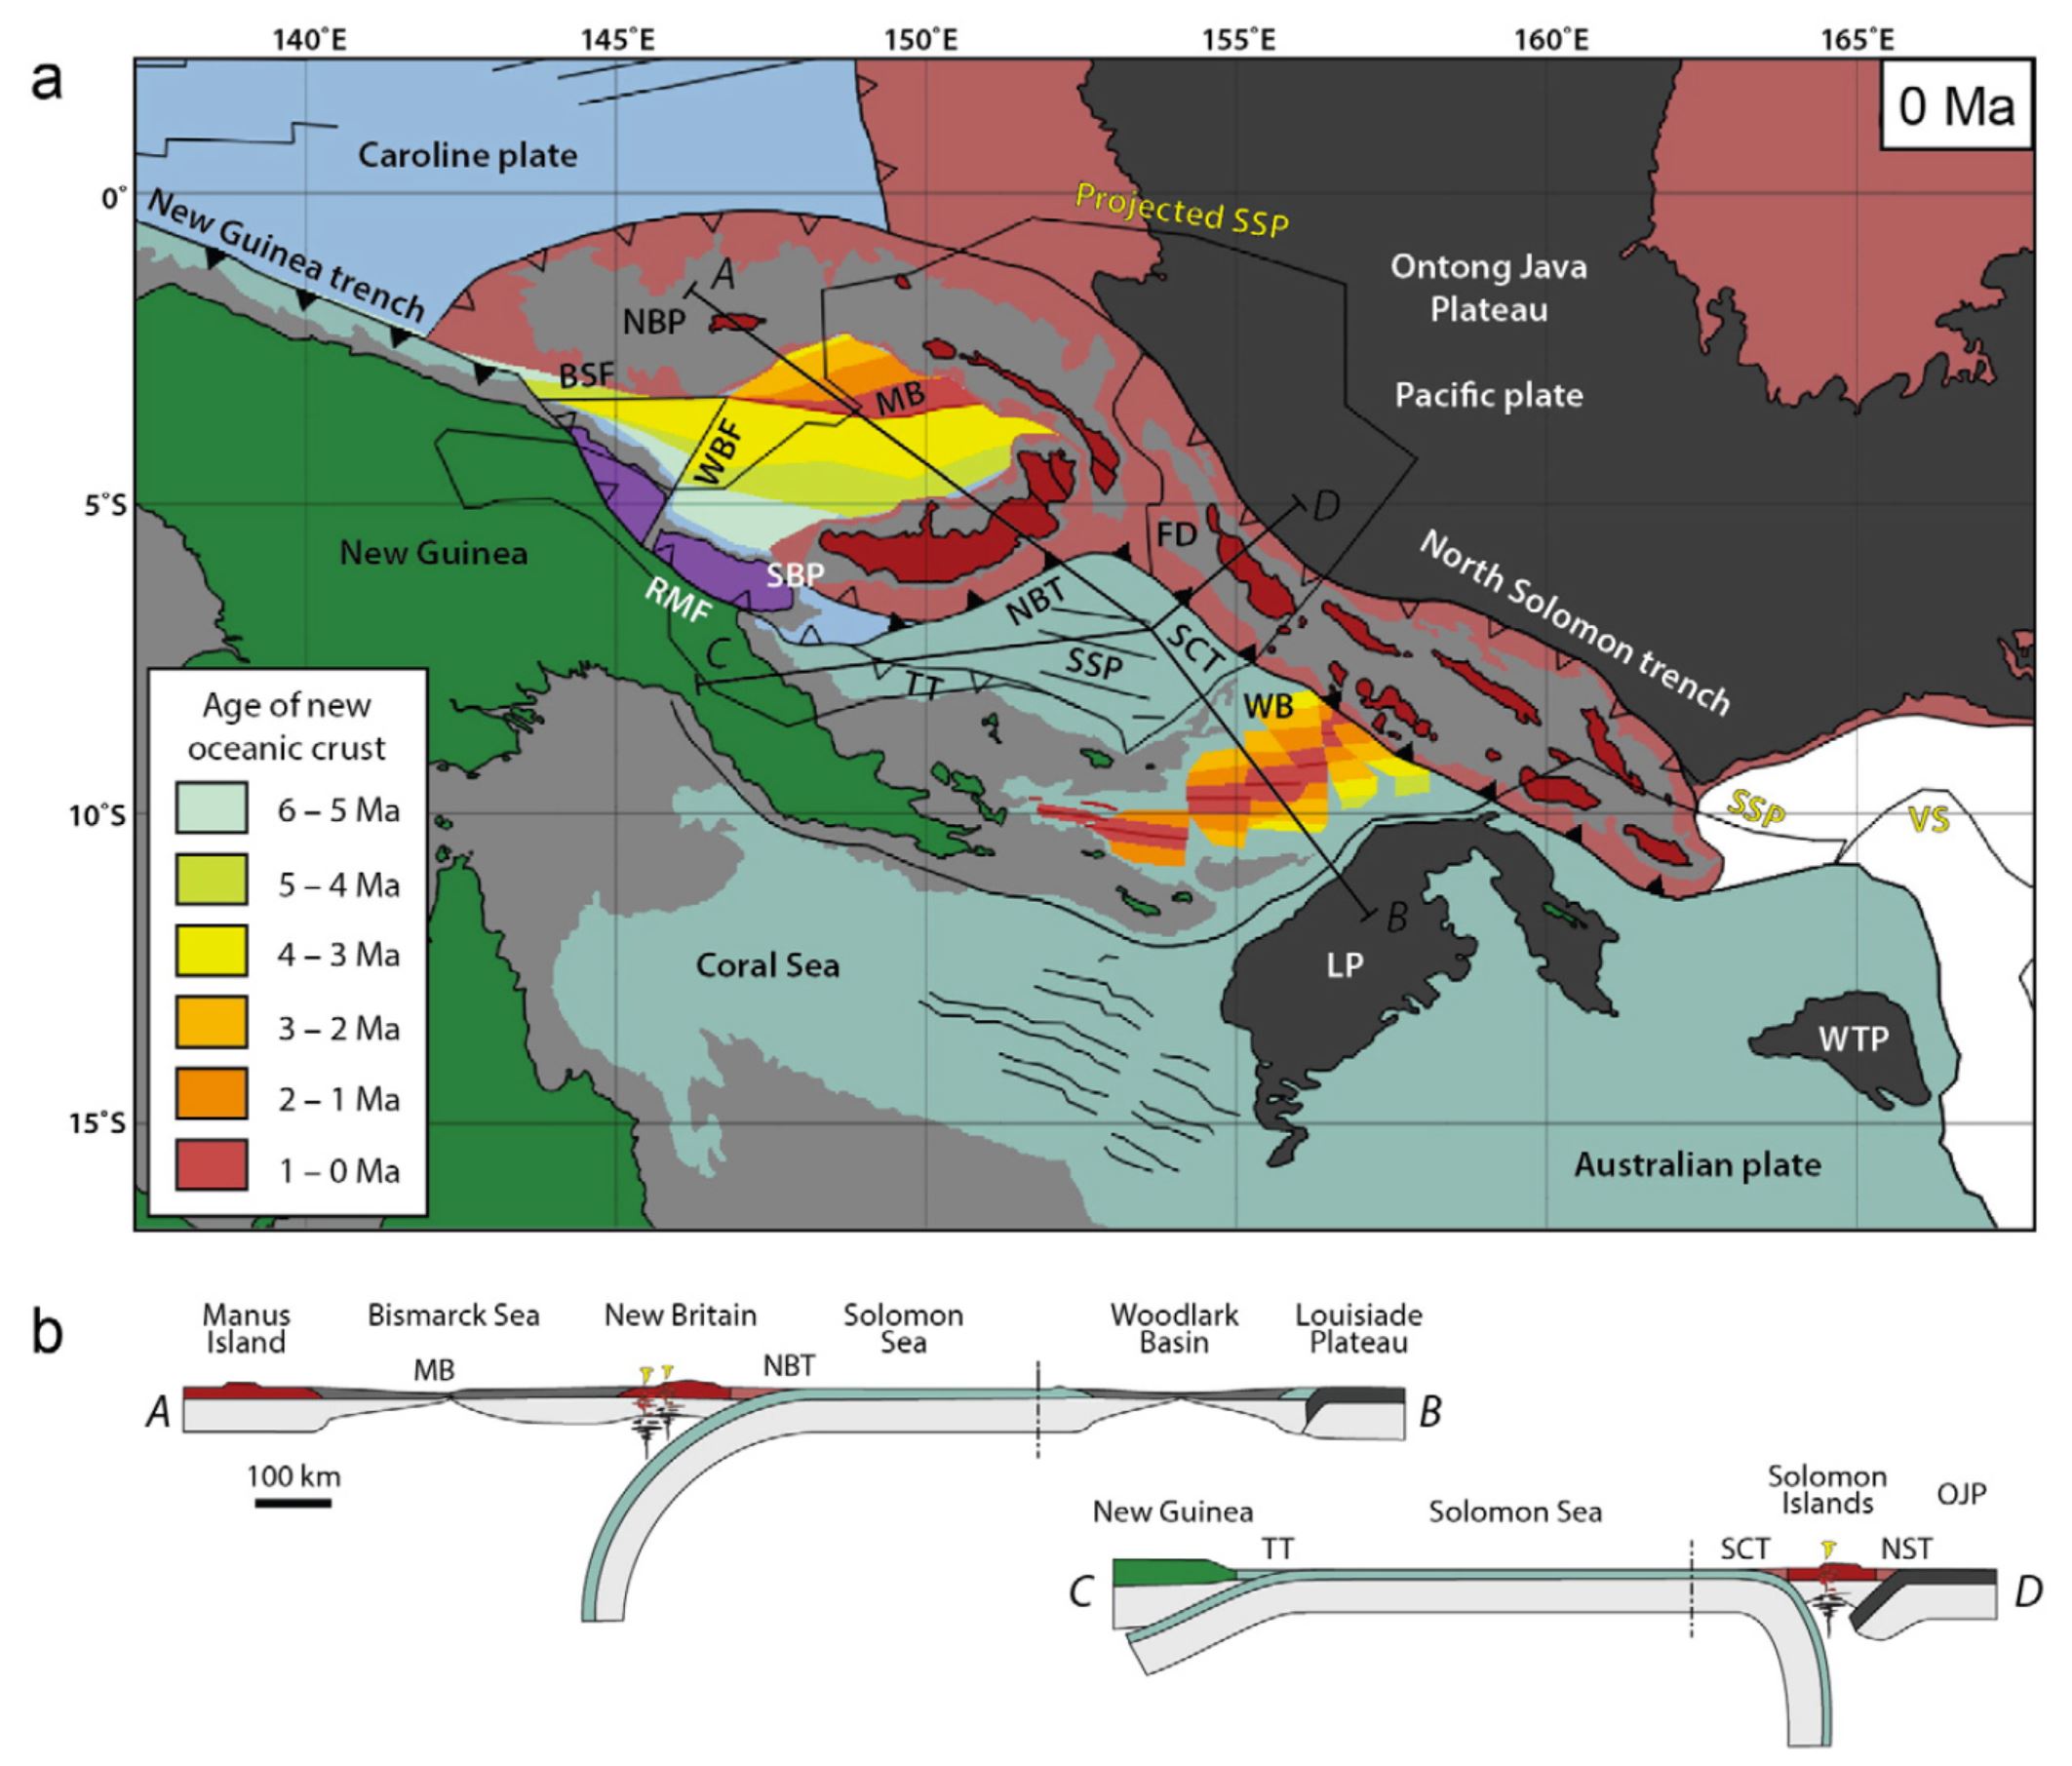
a) Present day tectonic features of the Papua New Guinea and Solomon Islands region as shown in plate reconstructions. Sea floor magnetic anomalies are shown for the Caroline plate (Gaina and Müller, 2007), Solomon Sea plate (Gaina and Müller, 2007) and Coral Sea (Weissel and Watts, 1979). Outline of the reconstructed Solomon Sea slab (SSP) and Vanuatu slab (VS)models are as indicated. b) Cross-sections related to the present day tectonic setting. Section locations are as indicated. Bismarck Sea fault (BSF); Feni Deep (FD); Louisiade Plateau (LP); Manus Basin (MB); New Britain trench (NBT); North Bismarck microplate (NBP); North Solomon trench (NST); Ontong Java Plateau (OJP); Ramu-Markham fault (RMF); San Cristobal trench (SCT); Solomon Sea plate (SSP); South Bismarck microplate (SBP); Trobriand trough (TT); projected Vanuatu slab (VS); West Bismarck fault (WBF); West Torres Plateau (WTP); Woodlark Basin (WB).

The GPS velocity field and 95 per cent confidence interval ellipses with respect to the Australian Plate. Red and blue vectors are the new calculated field and black vectors are from Wallace et al. (2004). The dashed rectangle shows the area of Fig. 3. The blue dashed lines correspond to the location of profiles shown in Fig. 4. Note that the velocity scales for the red and blue vectors are different (see the lower right corner for scales). The black velocities are plotted at the same scale as the red vectors.
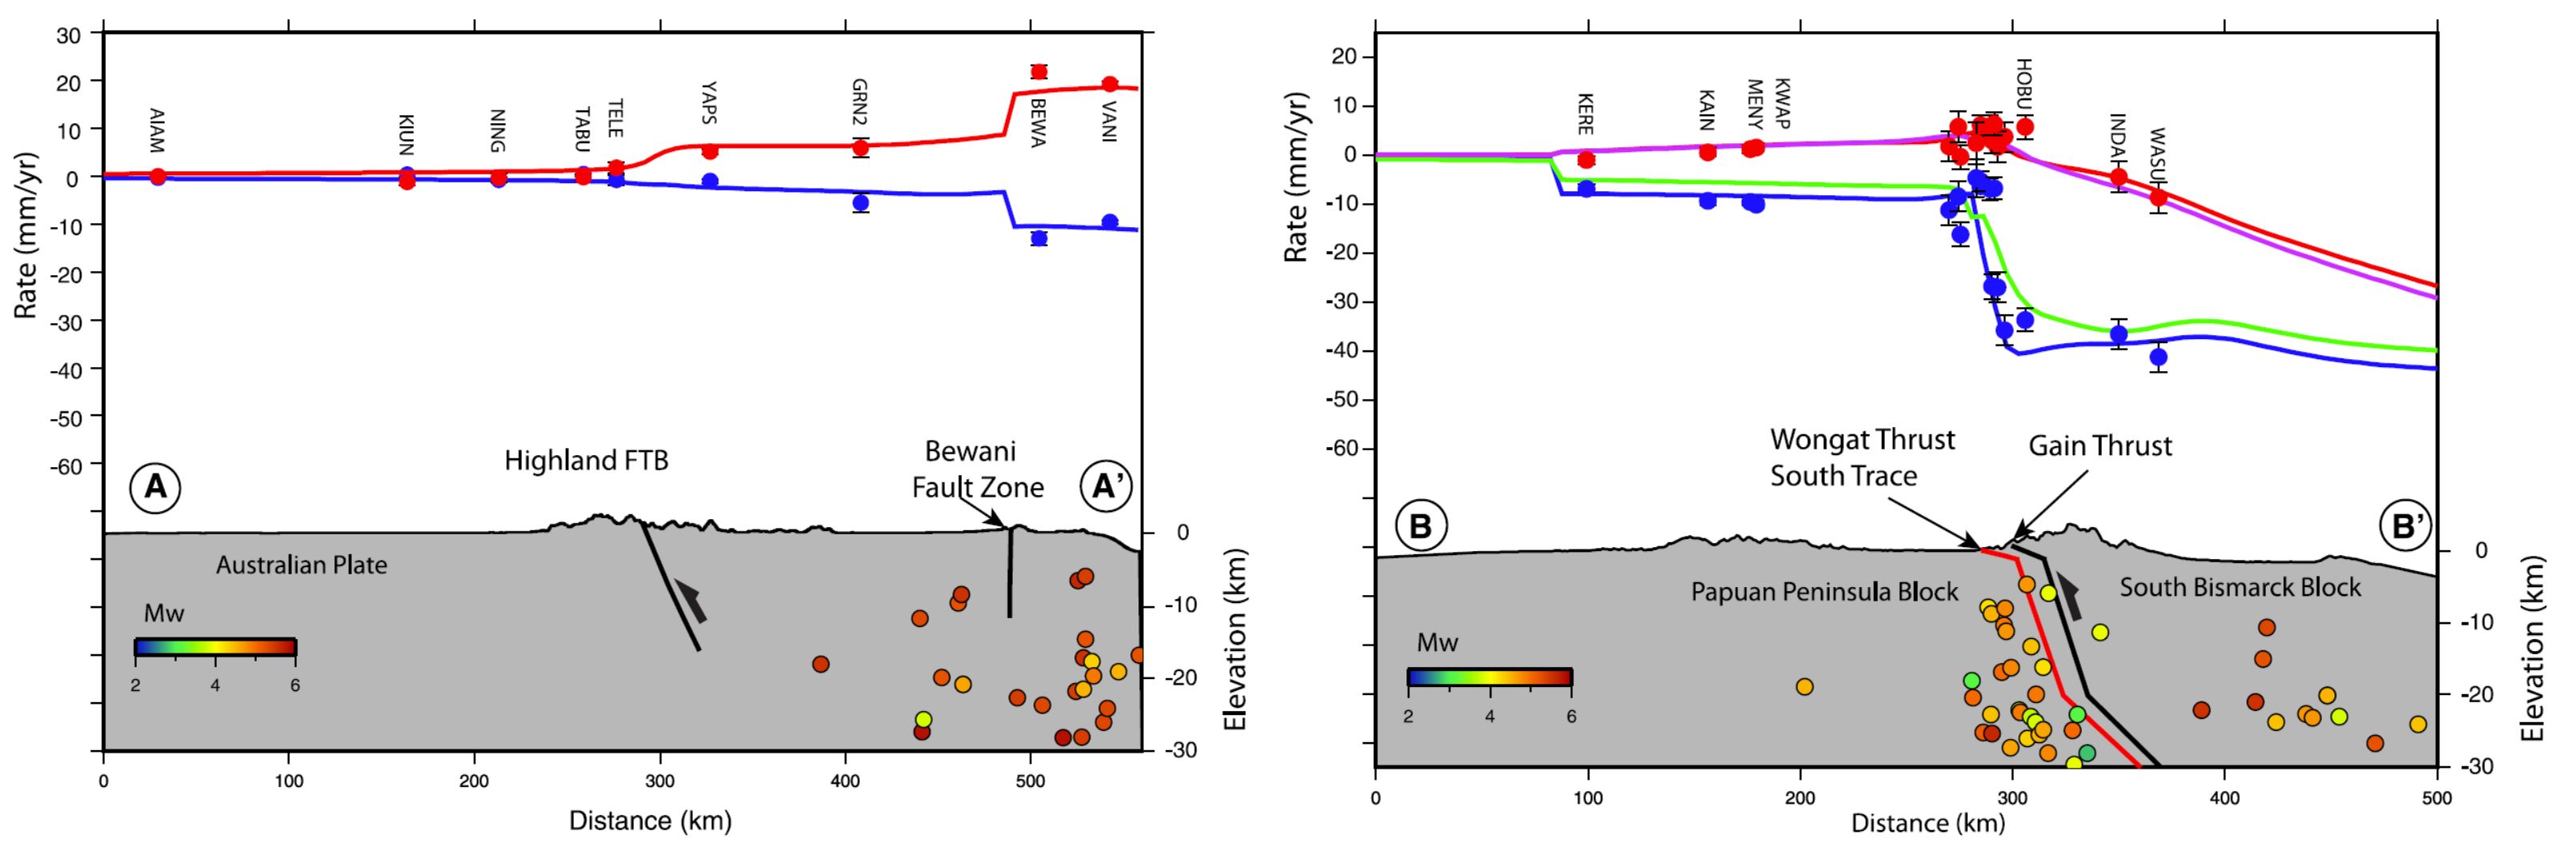
Profiles A–A& and B–B& from Fig. 2 showing model fit to GPS observations. Red symbols and lines are the GPS observed and modelled velocities, respectively, for the profile-normal component. Blue symbols and lines correspond to the profile-parallel component. The green and pink lines corresponds to the model using the Ramu-Markham fault geometry from Wallace et al. (2004), south of Lae. Grey profiles show the projected topography. The seismicity is from the ISC catalogue for events > Mw 3.5 (1960–2011).

Tectonic map of New Guinea, adapted from Hamilton (1979), Cooper and Taylor (1987), Dow et al. (1988), and Sapiie et al. (1999). AFTB—Aure fold and thrust belt, FTB—fold-and-thrust belt, IOB—Irian Ophiolite Belt, TFB—thrust-and-fold belt, POB—Papuan Ophiolite Belt, BTFZ—Bewani-Torricelli fault zone, MDZ—Mamberamo deformation zone, YFZ—Yapen fault zone, SFZ—Sorong fault zone, WO—Weyland overthrust. Continental basement exposures are concentrated along the southern fl ank of the Central Range: BD—Baupo Dome, MA—Mapenduma anticline, DM—Digul monocline, IDI—Idenberg Inlier, MUA—Mueller anticline, KA—Kubor anticline, LFTB—Legguru fold-and-thrust belt, RMFZ—Ramu-Markham fault zone, TAFZ—Tarera-Aiduna fault zone. The Tasman line separates continental crust that is Paleozoic and younger to the east from Precambrian to the west.

Lithospheric-scale cross section at 2 Ma. Plate motion is now focused along the Yapen fault zone in the center of the recently extinct arc. This probably occurred because this zone of weakness had a trend that could accommodate the imposed movements as the corner of the Caroline microplate ruptured, forming the Bismarck plate, and the corner of the Australian plate ruptured, forming the Solomon microplate. The collisional delamination-generated magmatic event ends in the highlands as the lower crustal magma chamber solidifies. Upwelled asthenosphere cools and transforms into lithospheric mantle. This drives a slow regional subsidence of the highlands that will continue for tens of millions of years or until other plate-tectonic movements are initiated. Deep erosion is still concentrated on the fl anks of the mountain belt. RMB—Ruffaer Metamorphic Belt, AUS—Australian plate, PAC—Pacific plate.

Seismotectonic interpretation of New Guinea. Tectonic features: PTFB—Papuan thrust-and-fold belt; RMFZ—Ramu-Markham fault zone; BTFZ—Bewani-Torricelli fault zone; MTFB—Mamberamo thrust-and-fold belt; SFZ—Sorong fault zone; YFZ—Yapen fault zone; RFZ—Ransiki fault zone; TAFZ—Tarera-Aiduna fault zone; WT—Waipona Trough. After Sapiie et al. (1999).
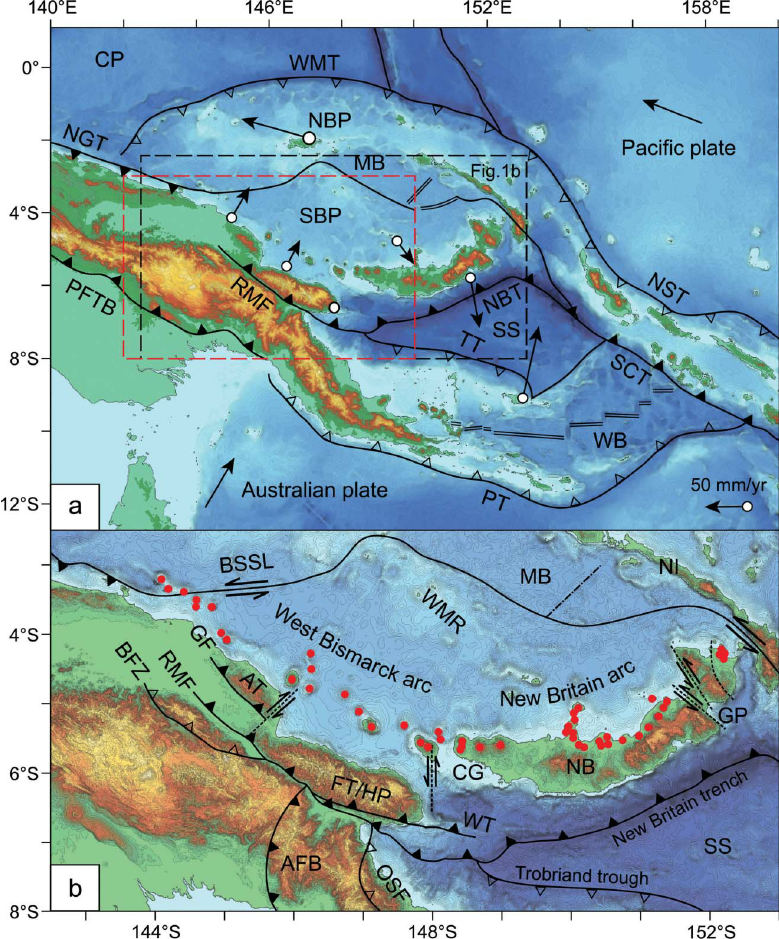
Topography, bathymetry and major tectonic elements of the study area. (a) Major tectonic boundaries of Papua New Guinea and the western Solomon Islands; CP, Caroline plate; MB, Manus Basin; NBP, North Bismarck plate; NBT, New Britain trench; NGT, New Guinea trench; NST, North Solomon trench; PFTB, Papuan Fold and Thrust Belt; PT, Pocklington trough; RMF, Ramu-Markham Fault; SBP, South Bismarck plate; SCT, San Cristobal trench; SS, Solomon Sea plate; TT, Trobriand trough; WB,Woodlark Basin; WMT,West Melanesian trench. Study area is indicated by rectangle labelled Figure 1b; the other inset rectangle highlights location for subsequent figures. Present day GPS motions of plates are indicated relative to the Australian plate (from Tregoning et al. 1998, 1999; Tregoning 2002; Wallace et al. 2004). (b) Detailed topography, bathymetry and structural elements significant to the South Bismarck region (terms not in common use are referenced); AFB, Aure Fold Belt (Davies 2012); AT, Adelbert Terrane (e.g. Wallace et al. 2004); BFZ, Bundi Fault Zone (Abbott 1995); BSSL, Bismarck Sea Seismic Lineation; CG, Cape Gloucester; FT, Finisterre Terrane; GF, Gogol Fault (Abbott 1995); GP, Gazelle Peninsula; HP, Huon Peninsula; MB, Manus Basin; NB, New Britain; NI, New Ireland; OSF, Owen Stanley Fault; RMF, Ramu-Markham Fault; SS, Solomon Sea; WMR, Willaumez-Manus Rise (Johnson et al. 1979); WT, Wonga Thrust (Abbott et al. 1994); minor strike-slip faults are shown adjacent to Huon Peninsula (Abers & McCaffrey 1994) and in east New Britain, the Gazelle Peninsula (e.g. Madsen & Lindley 1994). Circles indicate centres of Quaternary volcanism of the Bismarck arc. Filled triangles indicate active thrusting or subduction, empty triangles indicate extinct or negligible thrusting or subduction.

Tectonic maps of the New Guinea region. (a) Seismicity, volcanoes, and plate motion vectors. Plate motion vectors relative to the Australian plate are surface velocity models based on GPS data, fault slip rates, and earthquake focal mechanisms (UNAVCO, http://jules.unavco.org/Voyager/Earth). Earthquake data are sourced from the International Seismological Center EHB Bulletin (http://www.isc.ac.uk); data represent events from January 1994 through January 2009 with constrained focal depths. Background image is generated from http://www.geomapapp.org. Abbreviations: AB, Arafura Basin; AT, Aure Trough; AyT, Ayu Trough; BA, Banda arc; BSSL, Bismarck Sea seismic lineation; BH, Bird’s Head; BT, Banda Trench; BTFZ, Bewani-Torricelli fault zone; DD, Dayman Dome; DEI, D’Entrecasteaux Islands; FP, Fly Platform; GOP, Gulf of Papua; HP, Huon peninsula; LA, Louisiade Archipelago; LFZ, Lowlands fault zone; MaT, Manus Trench; ML, Mt. Lamington; MT, Mt. Trafalgar; MuT, Mussau Trough; MV, Mt. Victory; MTB, Mamberamo thrust belt; MVF, Managalase Plateau volcanic field; NBT, New Britain Trench; NBA, New Britain arc; NF, Nubara fault; NGT, New Guinea Trench; OJP, Ontong Java Plateau; OSF, Owen Stanley fault zone; PFTB, Papuan fold-and-thrust belt; PP, Papuan peninsula; PRi, Pocklington Rise; PT, Pocklington Trough; RMF, Ramu-Markham fault; SST, South Solomons Trench; SA, Solomon arc; SFZ, Sorong fault zone; ST, Seram Trench; TFZ, Tarera-Aiduna fault zone; TJ, AUS-WDKPAC triple junction; TL, Tasman line; TT, Trobriand Trough;WD, Weber Deep;WB, Woodlark Basin;WFTB, Western (Irian) fold-and-thrust belt; WR,Woodlark Rift; WRi, Woodlark Rise; WTB, Weyland thrust; YFZ, Yapen fault zone.White box indicates the location shown in Figure 3. (b) Map of plates, microplates, and tectonic blocks and elements of the New Guinea region. Tectonic elements modified after Hill & Hall (2003). Abbreviations: ADB, Adelbert block; AOB, April ultramafics; AUS, Australian plate; BHB, Bird’s Head block; CM, Cyclops Mountains; CWB, Cendrawasih block; CAR, Caroline microplate; EMD, Ertsberg Mining District; FA, Finisterre arc; IOB, Irian ophiolite belt; KBB, Kubor & Bena blocks (including Bena Bena terrane); LFTB, Lengguru fold-and-thrust belt; MA, Mapenduma anticline; MB, Mamberamo Basin block; MO, Marum ophiolite belt; MHS, Manus hotspot; NBS, North Bismarck plate; NGH, New Guinea highlands block; NNG, Northern New Guinea block; OKT, Ok Tedi mining district; PAC, Pacific plate; PIC, Porgera intrusive complex; PSP, Philippine Sea plate; PUB, Papuan Ultramafic Belt ophiolite; SB, Sepik Basin block; SDB, Sunda block; SBS, South Bismarck plate; SIB, Solomon Islands block; WP, Wandamen peninsula; WDK, Woodlark microplate; YQ, Yeleme quarries.

Oblique block diagram of New Guinea from the northeast with schematic cross sections showing the present-day plate tectonic setting. Digital elevation model was generated from http://www.geomapapp.org. Oceanic crust in tectonic cross sections is shown by thick black-and-white hatched lines, with arrows indicating active subduction; thick gray-and-white hatched lines indicate uncertain former subduction. Continental crust, transitional continental crust, and arc-related crust are shown without pattern. Representative geologic cross sections across parts of slices C and D are marked with transparent red ovals and within slices B and E are shown by dotted lines. (i ) Cross section of the Papuan peninsula and D’Entrecasteaux Islands modified from Little et al. (2011), showing the obducted ophiolite belt due to collision of the Australian (AUS) plate with an arc in the Paleogene, with later Pliocene extension and exhumation to form the D’Entrecasteaux Islands. (ii ) Cross section of the Papuan peninsula after Davies & Jaques (1984) shows the Papuan ophiolite thrust over metamorphic rocks of AUS margin affinity. (iii ) Across the Papuan mainland, the cross section after Crowhurst et al. (1996) shows the obducted Marum ophiolite and complex folding and thrusting due to collision of the Melanesian arc (the Adelbert, Finisterre, and Huon blocks) in the Late Miocene to recent. (iv) Across the Bird’s Head, the cross section after Bailly et al. (2009) illustrates deformation in the Lengguru fold-and-thrust belt as a result of Late Miocene–Early Pliocene northeast-southwest shortening, followed by Late Pliocene–Quaternary extension. Abbreviations as in Figure 2, in addition to NI, New Ireland; SI, Solomon Islands; SS, Solomon Sea; (U)HP, (ultra)high-pressure.
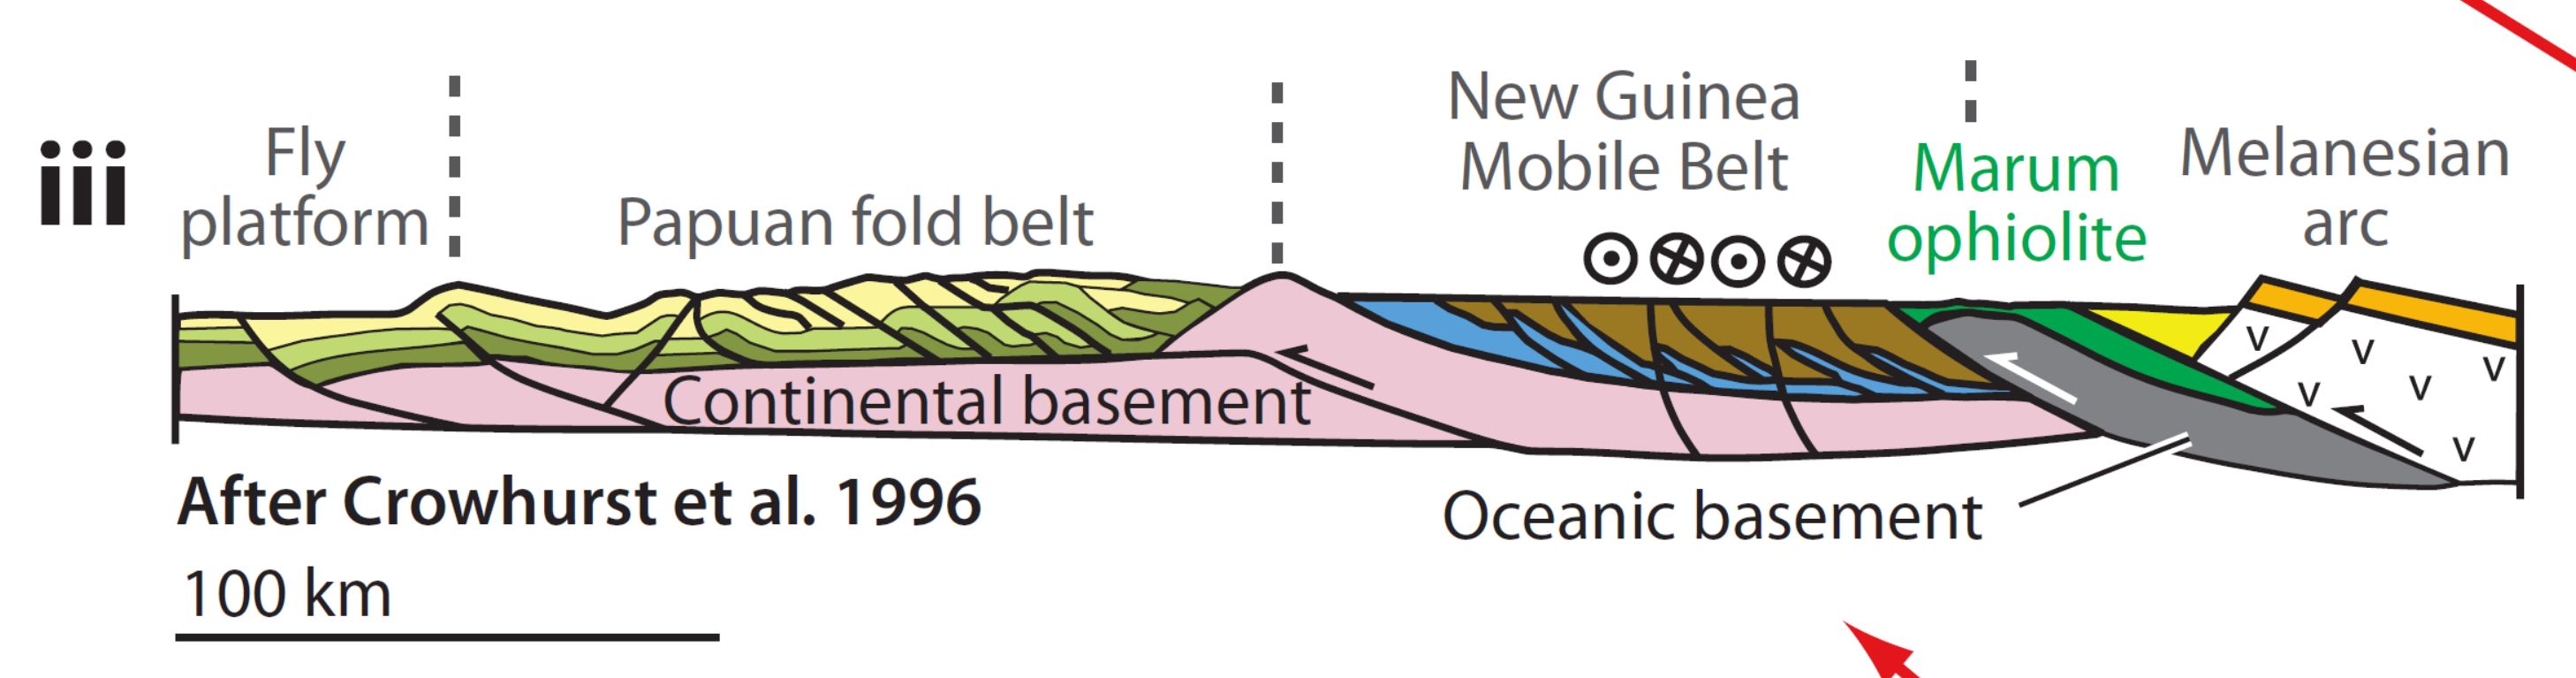
Across the Papuan mainland, the cross section after Crowhurst et al. (1996) shows the obducted Marum ophiolite and complex folding and thrusting due to collision of the Melanesian arc (the Adelbert, Finisterre, and Huon blocks) in the Late Miocene to recent.

Active tectonic setting of eastern Papua New Guinea showing the boundaries of the Woodlark microplate that includes previously proposed oceanic Solomon Sea plate, the Trobriand platform, and the Woodlark plate [Wallace et al., 2014]. The New Britain trench along the northern margin of the Woodlark plate is a rapidly subducting, 600 km long slab that generates a strong pull on the unsubducted Woodlark microplate [Weissel et al., 1982; Wallace et al., 2004, 2014]. Small circles around the Trobriand platform/Australia pole predict the described pattern of transpressional deformation along the Aure-Moresby fold-thrust belt and the formation of the adjacent, late Miocene to Recent Aure-Moresby foreland basin. Approximate location of the downdip limits of the subducted Solomon Sea slabs are shown by dashed lines and modified from Pegler et al. [1995], Woodhead et al. [2010], and Hayes et al. [2012]. Earthquake data are provided courtesy of the U.S. Geological Survey. Note that the tapering triangular shape of the extension in the Woodlark basin closely matches the size and shape of the thrusting observed in the Aure-Moresby fold-thrust belt and foreland basin.
Potential for Ground Failure
Luckily I updated this page because I noticed that the interpretive figure below was incorrect (it was for a different earthquake).
- Below are a series of maps that show the potential for landslides and liquefaction. These are all USGS data products.
There are many different ways in which a landslide can be triggered. The first order relations behind slope failure (landslides) is that the “resisting” forces that are preventing slope failure (e.g. the strength of the bedrock or soil) are overcome by the “driving” forces that are pushing this land downwards (e.g. gravity). The ratio of resisting forces to driving forces is called the Factor of Safety (FOS). We can write this ratio like this:FOS = Resisting Force / Driving Force
- When FOS > 1, the slope is stable and when FOS < 1, the slope fails and we get a landslide. The illustration below shows these relations. Note how the slope angle α can take part in this ratio (the steeper the slope, the greater impact of the mass of the slope can contribute to driving forces). The real world is more complicated than the simplified illustration below.
- Landslide ground shaking can change the Factor of Safety in several ways that might increase the driving force or decrease the resisting force. Keefer (1984) studied a global data set of earthquake triggered landslides and found that larger earthquakes trigger larger and more numerous landslides across a larger area than do smaller earthquakes. Earthquakes can cause landslides because the seismic waves can cause the driving force to increase (the earthquake motions can “push” the land downwards), leading to a landslide. In addition, ground shaking can change the strength of these earth materials (a form of resisting force) with a process called liquefaction.
- Sediment or soil strength is based upon the ability for sediment particles to push against each other without moving. This is a combination of friction and the forces exerted between these particles. This is loosely what we call the “angle of internal friction.” Liquefaction is a process by which pore pressure increases cause water to push out against the sediment particles so that they are no longer touching.
- An analogy that some may be familiar with relates to a visit to the beach. When one is walking on the wet sand near the shoreline, the sand may hold the weight of our body generally pretty well. However, if we stop and vibrate our feet back and forth, this causes pore pressure to increase and we sink into the sand as the sand liquefies. Or, at least our feet sink into the sand.
- Below is a diagram showing how an increase in pore pressure can push against the sediment particles so that they are not touching any more. This allows the particles to move around and this is why our feet sink in the sand in the analogy above. This is also what changes the strength of earth materials such that a landslide can be triggered.
- Below is a diagram based upon a publication designed to educate the public about landslides and the processes that trigger them (USGS, 2004). Additional background information about landslide types can be found in Highland et al. (2008). There was a variety of landslide types that can be observed surrounding the earthquake region. So, this illustration can help people when they observing the landscape response to the earthquake whether they are using aerial imagery, photos in newspaper or website articles, or videos on social media. Will you be able to locate a landslide scarp or the toe of a landslide? This figure shows a rotational landslide, one where the land rotates along a curvilinear failure surface.
- Below is the liquefaction susceptibility and landslide probability map (Jessee et al., 2017; Zhu et al., 2017). Please head over to that report for more information about the USGS Ground Failure products (landslides and liquefaction). Basically, earthquakes shake the ground and this ground shaking can cause landslides.
- I use the same color scheme that the USGS uses on their website. Note how the areas that are more likely to have experienced earthquake induced liquefaction are in the valleys. Learn more about how the USGS prepares these model results here.


- 2023.04.02 M 7.0 Papua New Guinea
- 2023.03.16 M 7.0 Kermadec
- 2023.01.08 M 7.0 Vanuatu Islands
- 2022.11.22 M 7.0 Solomon Isles
- 2022.11.11 M 7.3 Tonga
- 2022.09.10 M 7.6 Papua New Guinea
- 2021.03.04 M 8.1 Kermadec
- 2021.02.10 M 7.7 Loyalty Islands
- 2019.06.15 M 7.2 Kermadec
- 2019.05.14 M 7.5 New Ireland
- 2019.05.06 M 7.2 Papua New Guinea
- 2018.12.05 M 7.5 New Caledonia
- 2018.10.10 M 7.0 New Britain, PNG
- 2018.09.09 M 6.9 Kermadec
- 2018.08.29 M 7.1 Loyalty Islands
- 2018.08.18 M 8.2 Fiji
- 2018.03.26 M 6.9 New Britain
- 2018.03.26 M 6.6 New Britain
- 2018.03.08 M 6.8 New Ireland
- 2018.02.25 M 7.5 Papua New Guinea
- 2018.02.26 M 7.5 Papua New Guinea Update #1
- 2017.11.19 M 7.0 Loyalty Islands Update #1
- 2017.11.07 M 6.5 Papua New Guinea
- 2017.11.04 M 6.8 Tonga
- 2017.10.31 M 6.8 Loyalty Islands
- 2017.08.27 M 6.4 N. Bismarck plate
- 2017.05.09 M 6.8 Vanuatu
- 2017.03.19 M 6.0 Solomon Islands
- 2017.03.05 M 6.5 New Britain
- 2017.01.22 M 7.9 Bougainville
- 2017.01.03 M 6.9 Fiji
- 2016.12.17 M 7.9 Bougainville
- 2016.12.08 M 7.8 Solomons
- 2016.10.17 M 6.9 New Britain
- 2016.10.15 M 6.4 South Bismarck Sea
- 2016.09.14 M 6.0 Solomon Islands
- 2016.08.31 M 6.7 New Britain
- 2016.08.12 M 7.2 New Hebrides Update #2
- 2016.08.12 M 7.2 New Hebrides Update #1
- 2016.08.12 M 7.2 New Hebrides
- 2016.04.06 M 6.9 Vanuatu Update #1
- 2016.04.03 M 6.9 Vanuatu
- 2015.03.30 M 7.5 New Britain (Update #5)
- 2015.03.30 M 7.5 New Britain (Update #4)
- 2015.03.29 M 7.5 New Britain (Update #3)
- 2015.03.29 M 7.5 New Britain (Update #2)
- 2015.03.29 M 7.5 New Britain (Update #1)
- 2015.03.29 M 7.5 New Britain
- 2015.11.18 M 6.8 Solomon Islands
- 2015.05.24 M 6.8, 6.8, 6.9 Santa Cruz Islands
- 2015.05.05 M 7.5 New Britain
New Britain | Solomon | Bougainville | New Hebrides | Tonga | Kermadec Earthquake Reports
General Overview
Earthquake Reports
Social Media
#EarthquakeReport for M7.0 #Earthquake #Gempa in #PapuaNewGuinea
Strike-slip oblique event in one of several potential plates
Learn more abt complicated plate configuration in 2022 reporthttps://t.co/Y11LG1L4kQhttps://t.co/YYoUD6Y4Re pic.twitter.com/YZDefxU6GA
— Jason "Jay" R. Patton (@patton_cascadia) April 2, 2023
#EarthquakeReport for M 7.0 #Gempa #Earthquake in #PapuaNewGuinea
high chance for earthquake induced liquefaction along the floodplain of the Sepik River
see updated poster & read the Earthquake Report for this earthquake: https://t.co/q6snAD90D4 pic.twitter.com/4FWiJLbVv7
— Jason "Jay" R. Patton (@patton_cascadia) April 2, 2023
Mw=7.2, NEW GUINEA, PAPUA NEW GUINEA (Depth: 38 km), 2023/04/02 18:04:10 UTC – Full details here: https://t.co/2fyPxMfrBX pic.twitter.com/mKPZRxWN8L
— Earthquakes (@geoscope_ipgp) April 2, 2023
Prelim M 7.0 earthquake in Papua New Guinea. Lots of liquefaction is expected over an extensive area. Not sure how that will affect destruction or fatalities. #earthquake pic.twitter.com/37nVo6uIQ9
— Brian Olson (@mrbrianolson) April 2, 2023
Seismic shaking from the M7.0 Papua New Guinea earthquake as seen on a seismometer 720 km away. Data from @EarthScope_sci Station Monitor app. https://t.co/ZIY1tPTyqg pic.twitter.com/OpfoTvs7mI
— Wendy Bohon, PhD 🌏 (@DrWendyRocks) April 2, 2023
Just 20 minutes ago, M7.1 #earthquake near Ambuti, Papua New Guinea, not far from the epicenter of the July 16 1980 Mw7.3 earthquake.
Depth was 73 km, but landslides are always to fear…https://t.co/faDg8iiavF pic.twitter.com/EcHpOip5aW— José R. Ribeiro (@JoseRodRibeiro) April 2, 2023
2023-04-02 M7.0 #PNG #earthquake recorded in #Scotland & #Stornoway + historical seismicity & cross section.
In the middle of the shadow zone, core waves well seen by all stations.
Dist: 13459km
Travel Time: 15m 19s
Depth: 62km#Python @raspishake @matplotlib #CitizenScience pic.twitter.com/akbkiEZWNa— Giuseppe Petricca (@gmrpetricca) April 2, 2023
A M7 earthquake occurred an hour ago in Papua New Guinea. Here, the Australian Plate is colliding with the Pacific Plate, and … it's complicated, and extremely seismic.
1/ https://t.co/RLgoh6GHBH pic.twitter.com/mUFTWnpSO8
— Dr. Judith Hubbard (@JudithGeology) April 2, 2023
Preliminary M7.3 #Earthquake
ID: #rs2023gmlahs
New Guinea, Papua New Guinea
2023-04-02 18:04 UTC@raspishake #QuakeView– Learn more about us at https://t.co/ojzht2DDAL
– EVENT: https://t.co/mqZvq8Q35O pic.twitter.com/DawcKV0u0Q
— Raspberry Shake Earthquake Channel (@raspishakEQ) April 2, 2023
Major ~M7, intermediate depth, mostly lateral slip #earthquake in northern #PapuaNewGuinea along Australian-Pacific plates 10cm/y convergence zone. Moderate surface shaking with limited societal impact. Some landslide potential.#geohazards https://t.co/S1cErfcnTN pic.twitter.com/lyyb4Ddbop
— 🌎 Prof Ben van der Pluijm ⚒️ (@vdpluijm) April 2, 2023
62.6Km deep, M7 earthquake in Papua New Guinea at 2023-04-02 18:04:11UTC recorded on the @raspishake and @BGSseismology networks in SW England and Brittany 14116km away, in the core shadow zone. See: https://t.co/EBWY5YqTIc. Uses @obspy, @matplotlib & folium libraries. pic.twitter.com/VIqO6xMQZR
— Mark Vanstone (@wmvanstone) April 2, 2023
Section from today's 62.6km deep, M7 earthquake in Papua New Guinea at 2023-04-02 18:04:11UTC recorded on the @raspishake network, with very clear PKiKP responses and good coverage in the core shadow zone, 104 to 140°. See: https://t.co/EBWY5YqTIc…. Uses @obspy & @matplotlib. pic.twitter.com/QwyXt2aGfw
— Mark Vanstone (@wmvanstone) April 2, 2023
Watch the earthquake waves from the M7.0 in Papua New Guinea sweep across seismic stations in Europe. GMV from @EarthScope_sci
Sound on 🔊 for an explanation pic.twitter.com/N0HbgerTf5
— Wendy Bohon, PhD 🌏 (@DrWendyRocks) April 2, 2023
The M7.0 earthquake in Papua New Guinea today occurred in a region of high seismicity, with complex tectonics and microplates where the Pacific Plate converges rapidly with the Australian Plate. pic.twitter.com/q3Q5LbLQoe
— EarthScope Consortium (@EarthScope_sci) April 2, 2023
Video overview on the M7.0 Papua New Guinea earthquake pic.twitter.com/2FUZba9l4e
— EarthScope Consortium (@EarthScope_sci) April 3, 2023
- Frisch, W., Meschede, M., Blakey, R., 2011. Plate Tectonics, Springer-Verlag, London, 213 pp.
- Hayes, G., 2018, Slab2 – A Comprehensive Subduction Zone Geometry Model: U.S. Geological Survey data release, https://doi.org/10.5066/F7PV6JNV.
- Holt, W. E., C. Kreemer, A. J. Haines, L. Estey, C. Meertens, G. Blewitt, and D. Lavallee (2005), Project helps constrain continental dynamics and seismic hazards, Eos Trans. AGU, 86(41), 383–387, , https://doi.org/10.1029/2005EO410002. /li>
- Jessee, M.A.N., Hamburger, M. W., Allstadt, K., Wald, D. J., Robeson, S. M., Tanyas, H., et al. (2018). A global empirical model for near-real-time assessment of seismically induced landslides. Journal of Geophysical Research: Earth Surface, 123, 1835–1859. https://doi.org/10.1029/2017JF004494
- Kreemer, C., J. Haines, W. Holt, G. Blewitt, and D. Lavallee (2000), On the determination of a global strain rate model, Geophys. J. Int., 52(10), 765–770.
- Kreemer, C., W. E. Holt, and A. J. Haines (2003), An integrated global model of present-day plate motions and plate boundary deformation, Geophys. J. Int., 154(1), 8–34, , https://doi.org/10.1046/j.1365-246X.2003.01917.x.
- Kreemer, C., G. Blewitt, E.C. Klein, 2014. A geodetic plate motion and Global Strain Rate Model in Geochemistry, Geophysics, Geosystems, v. 15, p. 3849-3889, https://doi.org/10.1002/2014GC005407.
- Meyer, B., Saltus, R., Chulliat, a., 2017. EMAG2: Earth Magnetic Anomaly Grid (2-arc-minute resolution) Version 3. National Centers for Environmental Information, NOAA. Model. https://doi.org/10.7289/V5H70CVX
- Müller, R.D., Sdrolias, M., Gaina, C. and Roest, W.R., 2008, Age spreading rates and spreading asymmetry of the world’s ocean crust in Geochemistry, Geophysics, Geosystems, 9, Q04006, https://doi.org/10.1029/2007GC001743
- Pagani,M. , J. Garcia-Pelaez, R. Gee, K. Johnson, V. Poggi, R. Styron, G. Weatherill, M. Simionato, D. Viganò, L. Danciu, D. Monelli (2018). Global Earthquake Model (GEM) Seismic Hazard Map (version 2018.1 – December 2018), DOI: 10.13117/GEM-GLOBAL-SEISMIC-HAZARD-MAP-2018.1
- Silva, V ., D Amo-Oduro, A Calderon, J Dabbeek, V Despotaki, L Martins, A Rao, M Simionato, D Viganò, C Yepes, A Acevedo, N Horspool, H Crowley, K Jaiswal, M Journeay, M Pittore, 2018. Global Earthquake Model (GEM) Seismic Risk Map (version 2018.1). https://doi.org/10.13117/GEM-GLOBAL-SEISMIC-RISK-MAP-2018.1
- Zhu, J., Baise, L. G., Thompson, E. M., 2017, An Updated Geospatial Liquefaction Model for Global Application, Bulletin of the Seismological Society of America, 107, p 1365-1385, https://doi.org/0.1785/0120160198
- Abers, G. and McCaffrey, R., 1988. Active Deformation in the New Guinea Fold-and-Thrust Belt: Seismological Evidence for Strike-Slip Faulting and Basement-Involved Thrusting in JGR, v. 93, no. B11, p. 13,332-13,354
- Baldwin, S.L., Monteleone, B.D., Webb, L.E., Fitzgerald, P.G., Grove, M., and Hill, E.J., 2004. Pliocene eclogite exhumation at plate tectonic rates in eastern Papua New Guinea in Nature, v. 431, p/ 263-267, doi:10.1038/nature02846.
- Baldwin, S.L., Fitzgerald, P.G., and Webb, L.E., 2012. Tectonics of the New Guinea Region, Annu. Rev. Earth Planet. Sci., v. 40, pp. 495-520.
- Cloos, M., Sapiie, B., Quarles van Ufford, A., Weiland, R.J., Warren, P.Q., and McMahon, T.P., 2005. Collisional delamination in New Guinea: The geotectonics of subducting slab breakoff: Geological Society of America Special Paper 400, 51 p., doi: 10.1130/2005.2400.
- Dow, D.B., 1977. A Geological Synthesis of Papua New Guinea, Bureau of Mineral Resources, Geology, and Geophysics, Bulltein 201, Australian Government Publishing Sevice, Canberra, 1977, 58 pp.
- Hamilton, W.B., 1979. Tectonics of the Indonesian Region, USGS Professional Paper 1078.
- Holm, R. and Richards, S.W., 2013. A re-evaluation of arc-continent collision and along-arc variation in the Bismarck Sea region, Papua New Guinea in Australian Journal of Earth Sciences, v. 60, p. 605-619.
- Holm, R.J., Richards, S.W., Rosenbaum, G., and Spandler, C., 2015. Disparate Tectonic Settings for Mineralisation in an Active Arc, Eastern Papua New Guinea and the Solomon Islands in proceedings from PACRIM 2015 Congress, Hong Kong ,18-21 March, 2015, pp. 7.
- Holm, R.J., Rosenbaum, G., Richards, S.W., 2016. Post 8 Ma reconstruction of Papua New Guinea and Solomon Islands: Microplate tectonics in a convergent plate boundary setting in Eartth Science Reviews, v. 156, p. 66-81.
- Johnson, R.W., 1976, Late Cainozoic volcanism and plate tectonics at the southern margin of the Bismarck Sea, Papua New Guinea, in Johnson, R.W., ed., 1976, Volcanism in Australia: Amsterdam, Elsevier, p. 101-116
- Koulali, A., tregoning, P., McClusky, S., Stanaway, R., Wallace, L., and Lister, G., 2015. New Insights into the present-day kinematics of the central and western Papua New Guinea from GPS in GJI, v. 202, p. 993-1004, doi: 10.1093/gji/ggv200
- Ott, B., and P. Mann (2015), Late Miocene to Recent formation of the Aure-Moresby fold-thrust belt and foreland basin as a consequence of Woodlark microplate rotation, Papua New Guinea, Geochem. Geophys. Geosyst., 16, 1988–2004, http://dx.doi.org/10.1002/2014GC005668
- Sapiie, B., and Cloos, M., 2004. Strike-slip faulting in the core of the Central Range of west New Guinea: Ertsberg Mining District, Indonesia in GSA Bulletin, v. 116; no. 3/4; p. 277–293
- Tregoning, P., McQueen, H., Lambeck, K., Jackson, R. Little, T., Saunders, S., and Rosa, R., 2000. Present-day crustal motion in Papua New Guinea, Earth Planets and Space, v. 52, pp. 727-730.
References:
Basic & General References
Specific References
..
Return to the Earthquake Reports page.
- Sorted by Magnitude
- Sorted by Year
- Sorted by Day of the Year
- Sorted By Region