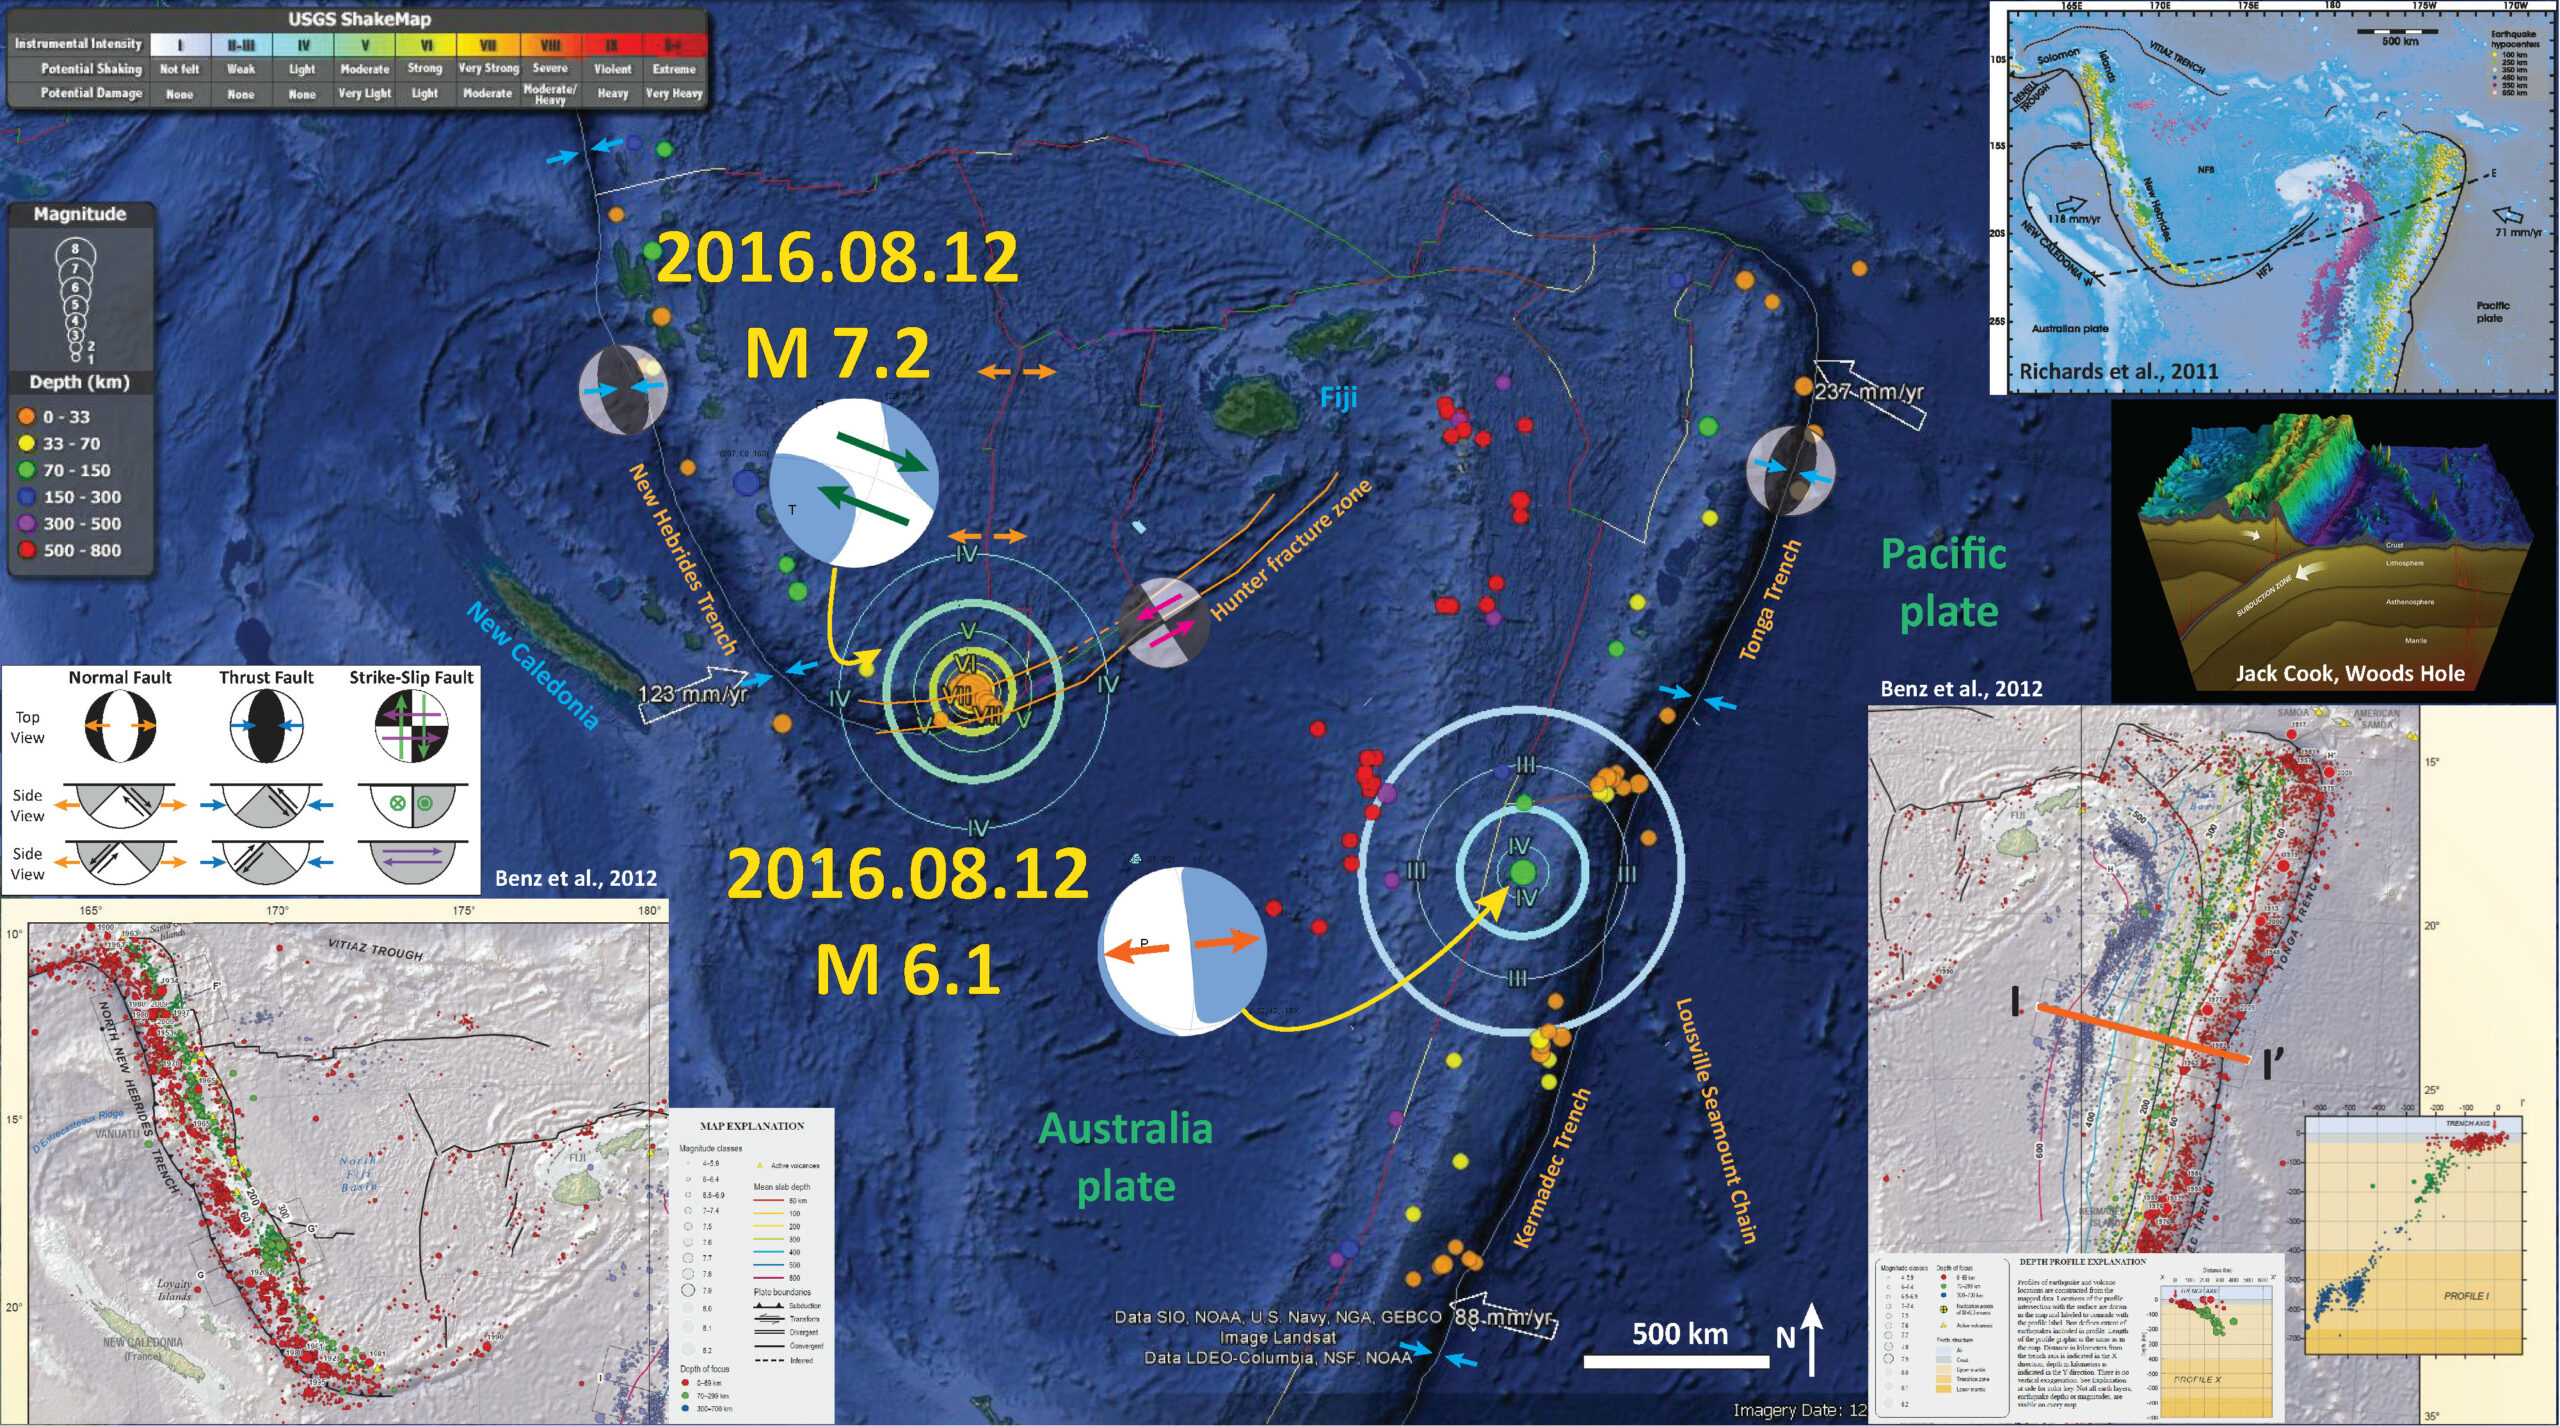
I put together another map that shows these two earthquakes. The M 7.2 earthquake appears to be along a west-northwest striking right lateral strike-slip fault and the M 6.1 appears to be either a steeply or shallowly dipping normal (extension) fault.
-
Here are my two earthquake reports for these earthquakes:
- 2016.08.12 M 7.2 New Hebrides Update #1
- 2016.08.12 M 7.2 New Hebrides
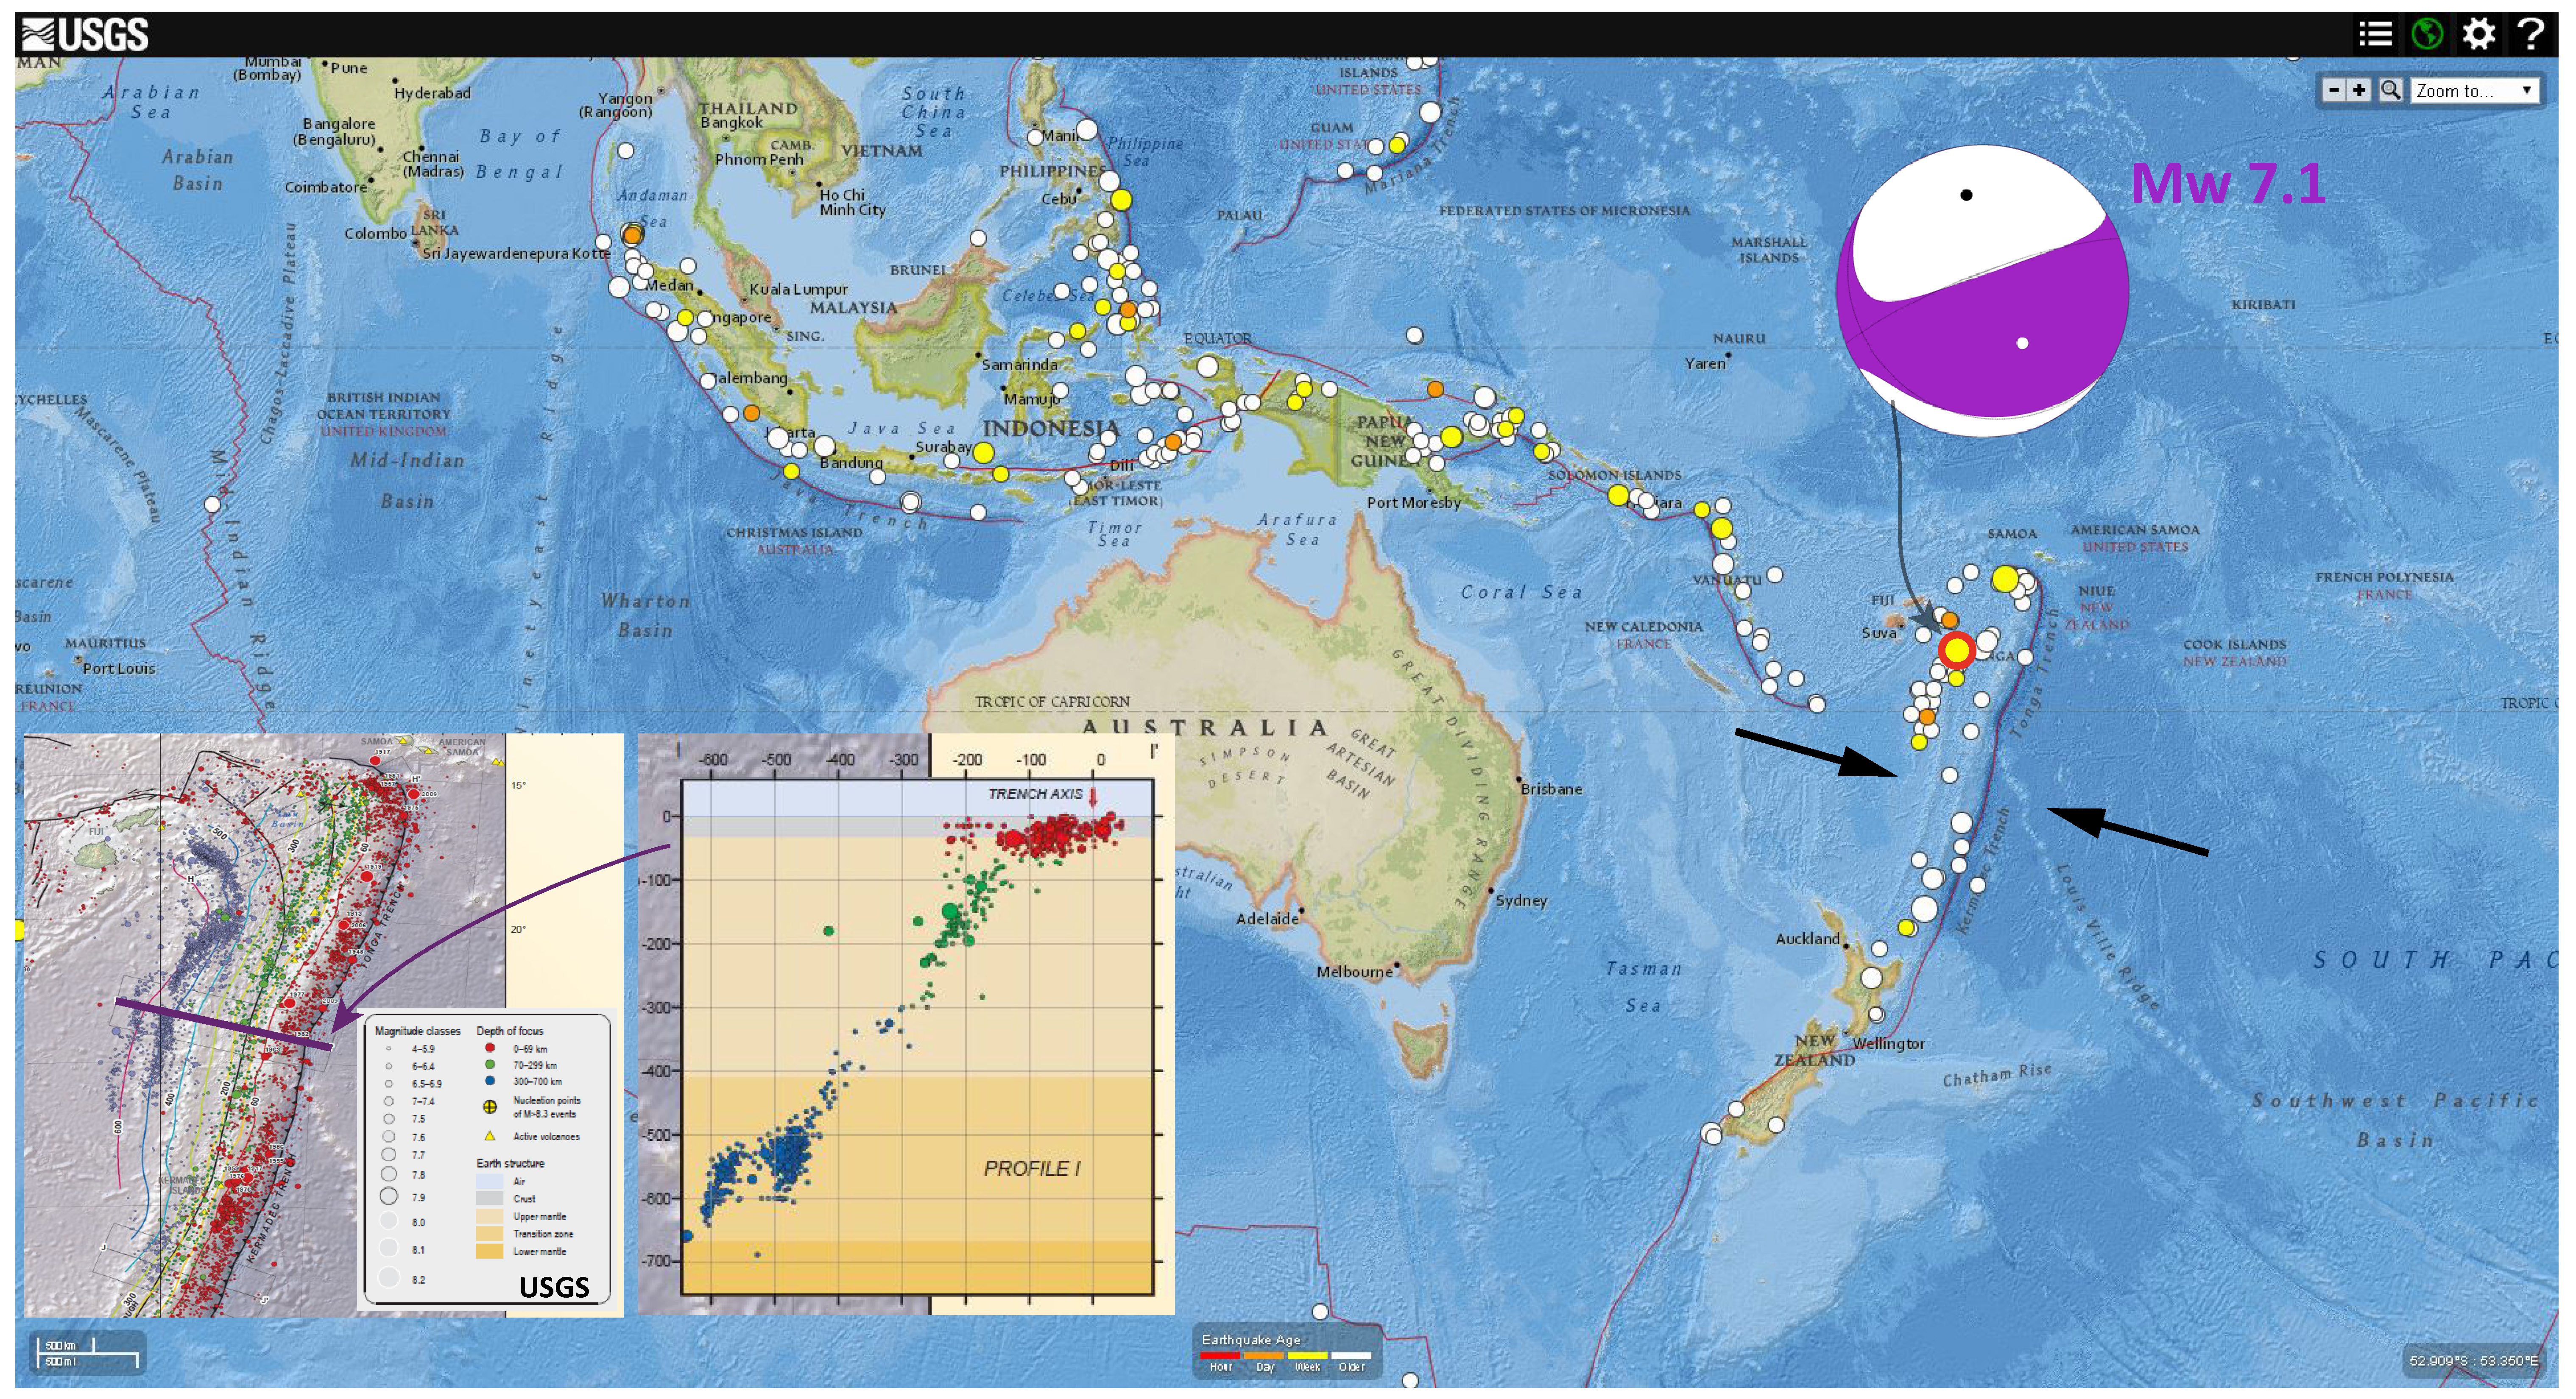
I placed a moment tensor / focal mechanism legend on the poster. There is more material from the USGS web sites about moment tensors and focal mechanisms (the beach ball symbols). Both moment tensors and focal mechanisms are solutions to seismologic data that reveal two possible interpretations for fault orientation and sense of motion. One must use other information, like the regional tectonics, to interpret which of the two possibilities is more likely.
-
I include some inset figures and maps.
- In the upper right corner is a figure from Richards et al. (2011). This is a tectonic map showing the plate boundaries with seismicity colored vs depth. Note how the New Hebrides earthquakes deepen to the east and the Tonga Trench earthquakes deepen to the west.
- Below that is a cross section of the Kermadec trench that includes bathymetry of the region (topography of the sea floor). This graphic was created by scientists at Woods Hole.
- In the lower right corner is a part of a map from the USGS tectonic map poster for this region of the Pacific Ocean. This is from the USGS Open File Report 2010-1083-I (Benz et al., 2011). Hypocenters are plotted as cross sections to show the geometry of the subducting slabs. This map is for the M 6.1 earthquake that appears to be in the downgoing Pacific plate. The earthquake is close to where cross section I-I’ is located (orange line on map).
- In the lower left corner is a part of a map from the USGS tectonic map poster for this region of the Pacific Ocean. This is from the USGS Open File Report 2010-1083-I (Benz et al., 2011). Hypocenters are plotted as cross sections to show the geometry of the subducting slabs. This map is for the M 7.2 earthquake. Note the paucity of seismicity along the Hunter fracture zone.

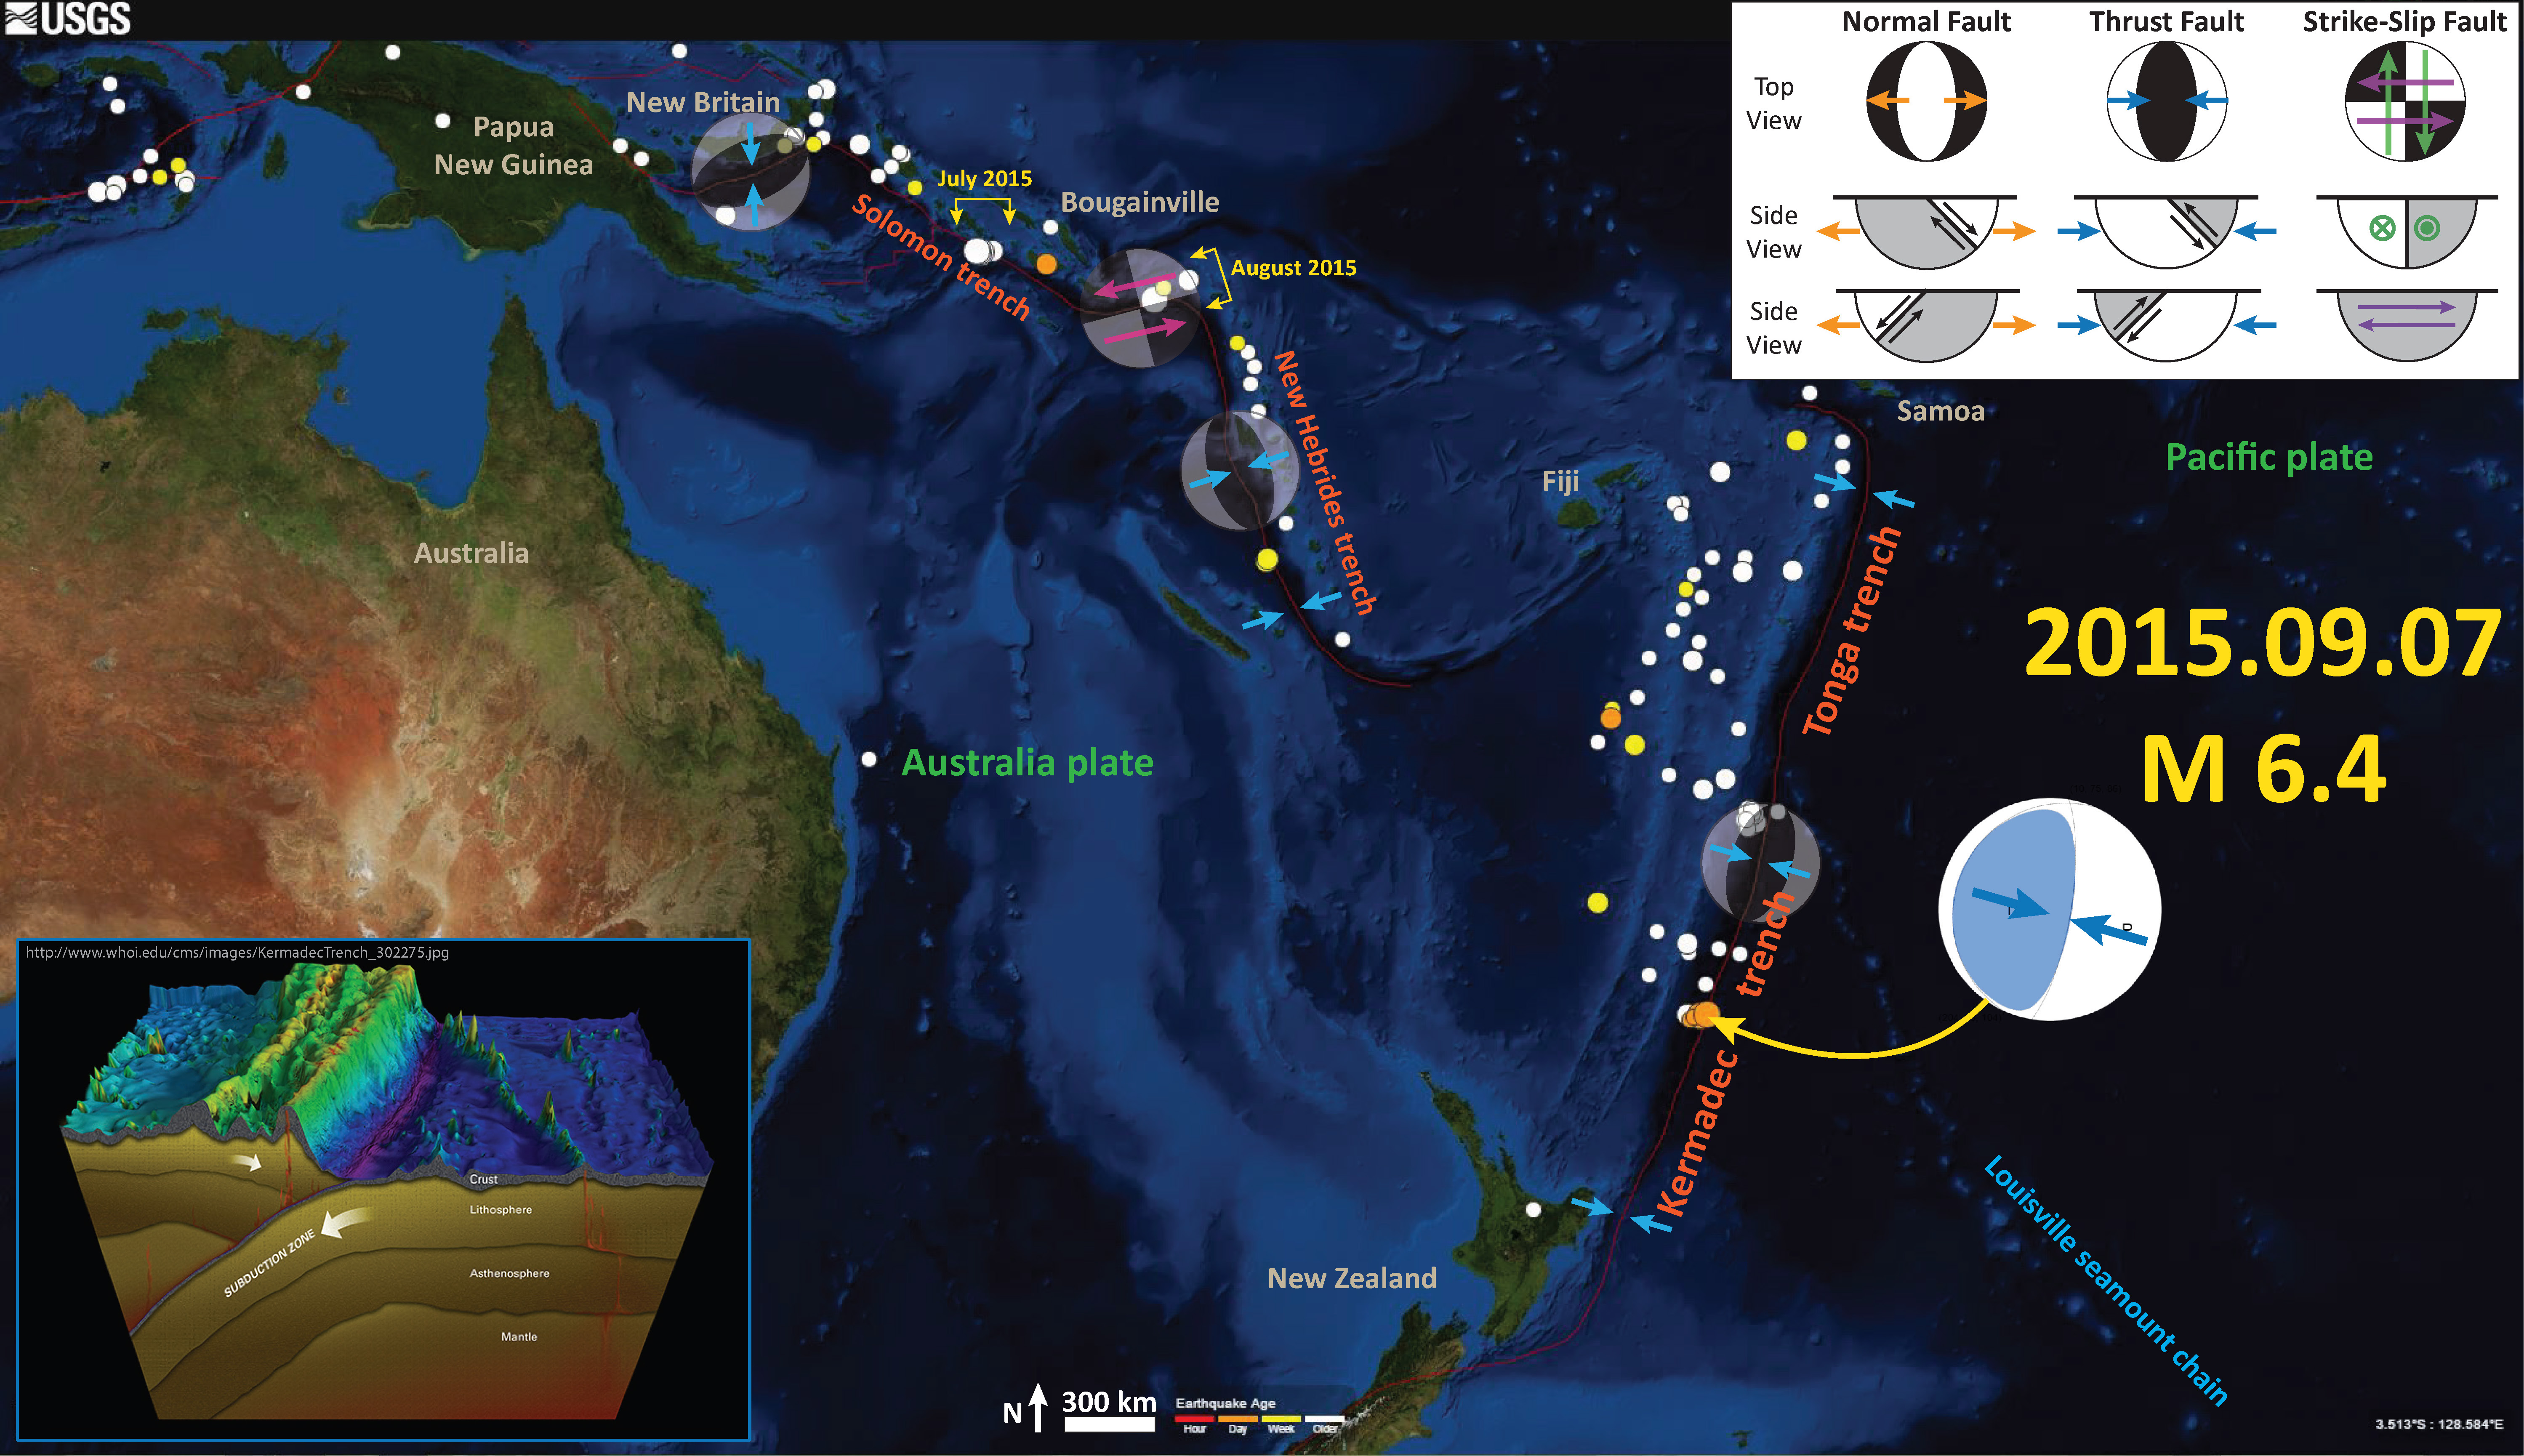
There was some activity in September of 2015 south of the M 6.1. Here is my Earthquake Report for that M 6.4 earthquake. Below is my interpretive poster for that earthquake.
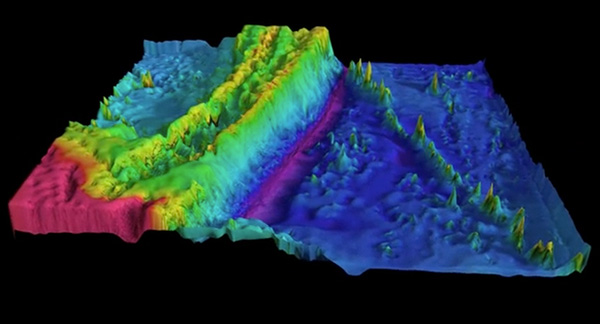
Here is another map of the bathymetry in this region of the Karmadec trench. This was produced by Jack Cook at the Woods Hole Oceanographic Institution. The Lousiville Seamount Chain is clearly visible in this graphic.
I put together an animation of seismicity from 1965 – 2015 Sept. 7. Here is a map that shows the entire seismicity for this period. I plot the slab contours for the subduction zone here. These were created by the USGS (Hayes et al., 2013).
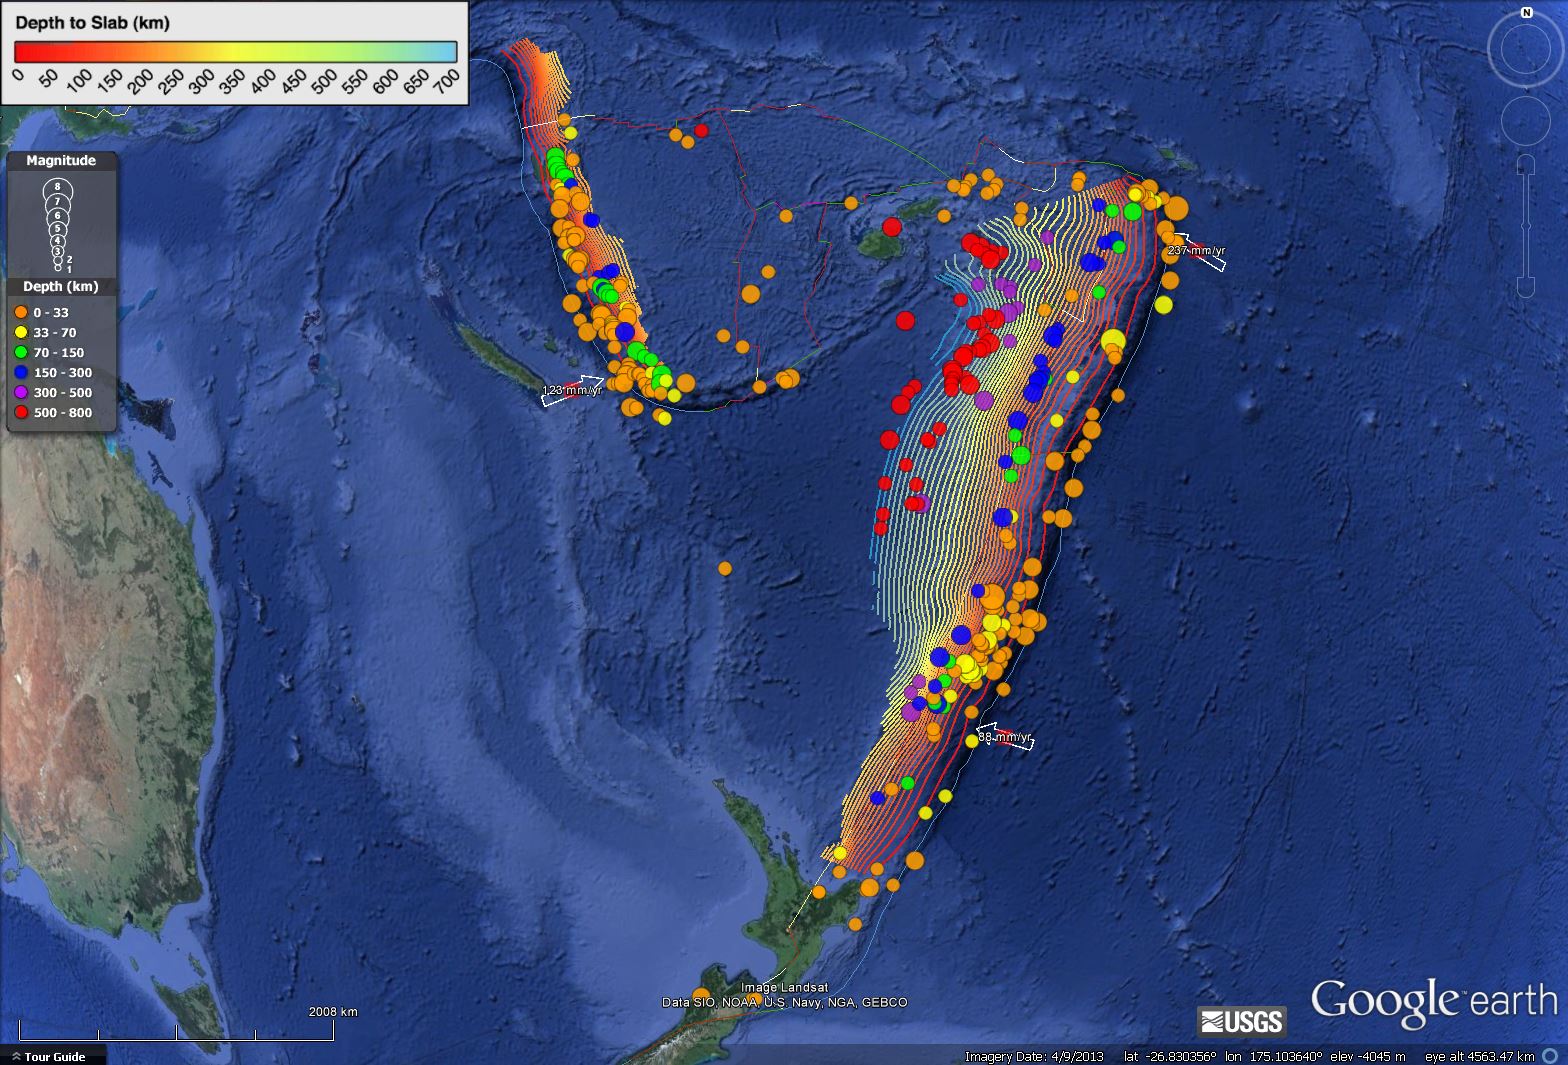
Here is the animation. Download the mp4 file here. This animation includes earthquakes with magnitudes greater than M 6.5 and this is the kml file that I used to make this animation.
There was an earthquake to the north of the M 6.1 in November of 2014. Here is my Earthquake Report for that M 7.1 earthquake. Below is my interpretive map for that earthquake.
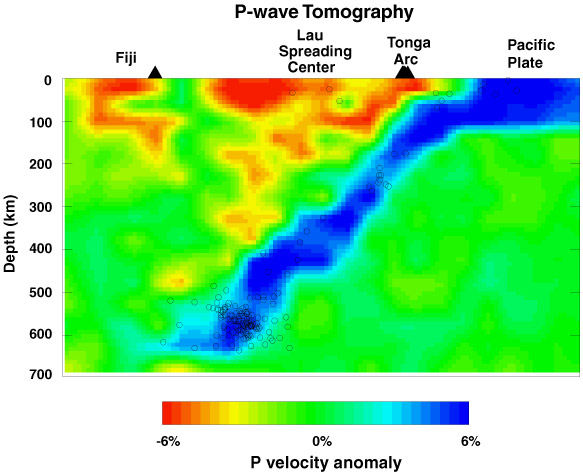
Here is another view of the slab, generated using P-wave tomography. Doug Weins discusses his work in this region. “Red and blue colors denote slow and fast velocities, respectively, and the velocity perturbation scale is shown at the bottom.”
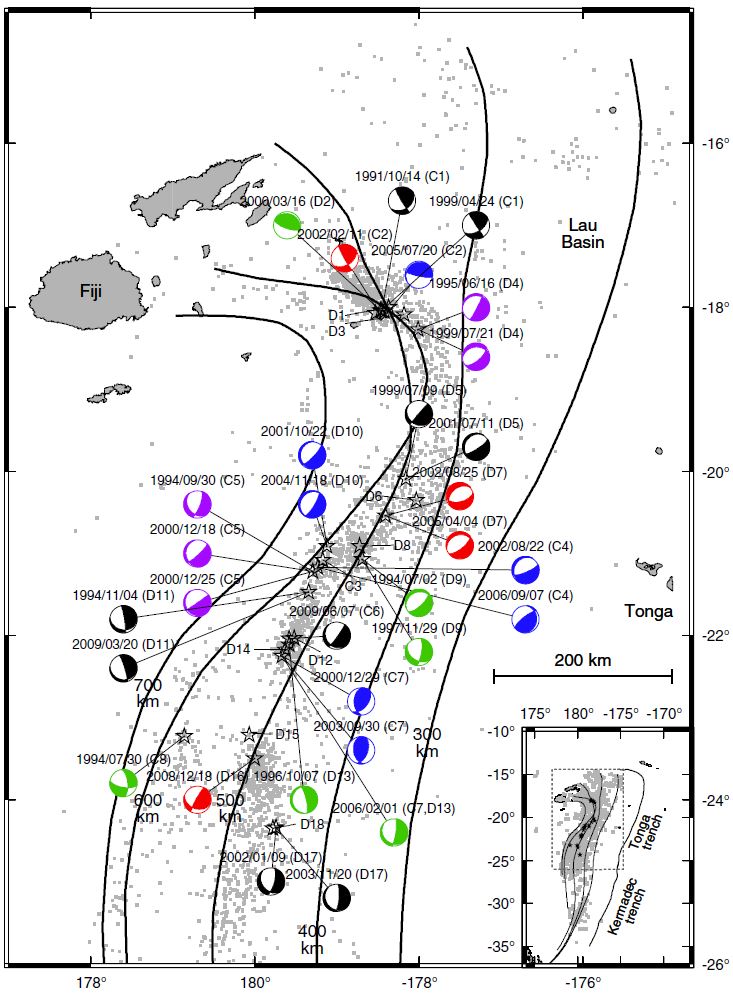
Interestingly, deep focus earthquakes take up ~66% of the deep earthquakes globally. From this paper, we can see that the slab contour may change strike in the region of yesterday’s earthquake.
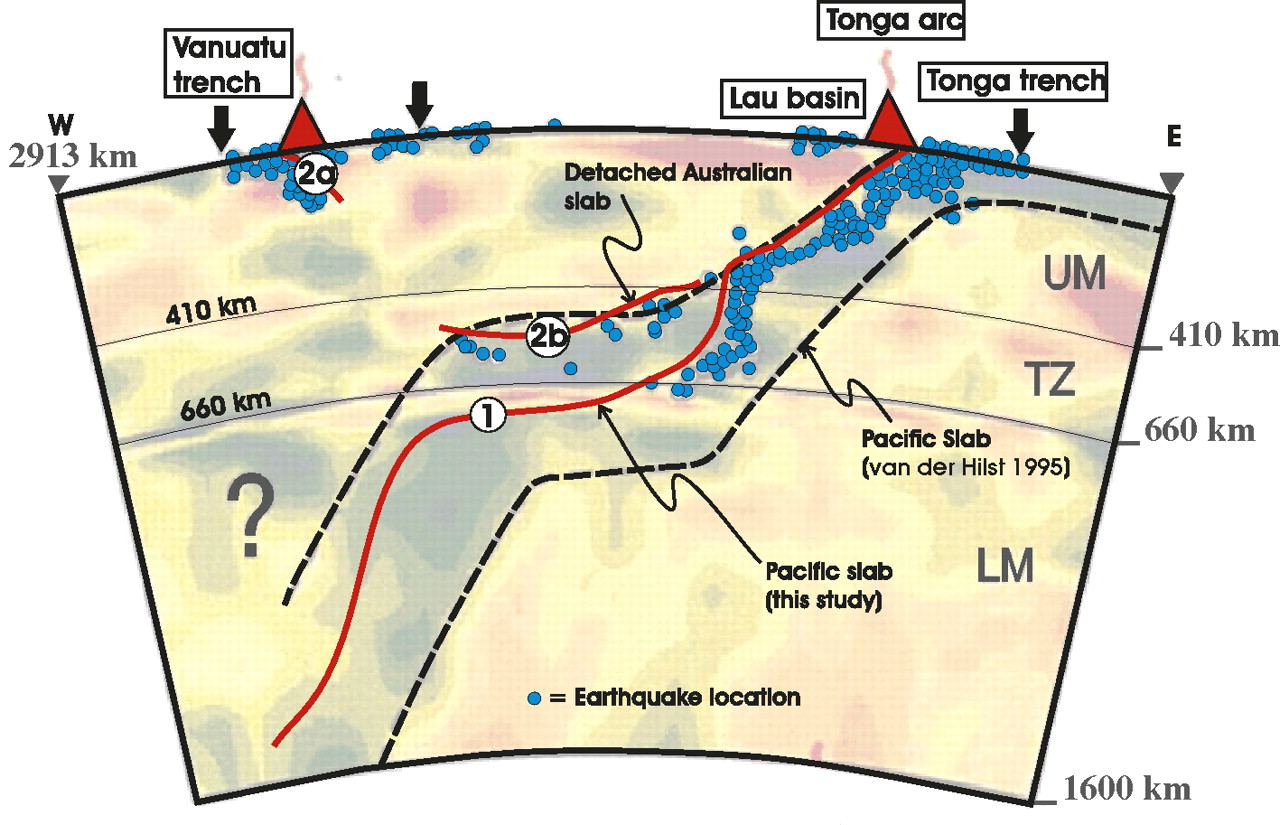
Richards et al., 2011 also show bends in the downgoing slab. There is some controversy about the configuration of the slab in this region. They show a detached slab just above the main port (more Star Wars), above the main slab.
-
References:
- Benz, H.M., Herman, Matthew, Tarr, A.C., Furlong, K.P., Hayes, G.P., Villaseñor, Antonio, Dart, R.L., and Rhea, Susan, 2011. Seismicity of the Earth 1900–2010 eastern margin of the Australia plate: U.S. Geological Survey Open-File Report 2010–1083-I, scale 1:8,000,000.
- Richards, S., Holm., R., Barber, G., 2011. When slabs collide: A tectonic assessment of deep earthquakes in the Tonga-Vanuatu region, Geology, v. 39, pp. 787-790.
- Yu, W. and Wen, L., 2012. Deep-Focus Repeating Earthquakes in the Tonga–Fiji Subduction Zone, BSSA, v. 102, no. 4, pp. 1829-1849