I just got back from one of the best conferences that I have ever attended, PATA Days 2017 (Paleoseismology, Active Tectonics, and Archeoseismology). This conference was held in Blenheim, New Zealand and was planned to commemorate the 300 year anniversary of the 1717 AD Alpine fault earthquake (the possibly last “full” margin rupture of the Alpine fault, a strike-slip plate boundary between the Australia and Pacific plates, with a slip rate of about 30 mm per year, tapering northwwards as synthetic strike slip faults splay off from the AF). While the meeting was being planned, the 2016 M 7.8 Kaikoura earthquake happened, which expanded the subject matter somewhat.
Prior to the meeting, we all attended a one day field trip reviewing field evidence for surface rupture and coseismic deformation and landslides from the M 7.8 earthquake in the northern part of the region. The road is still cut off and being repaired, so one cannot drive along the coast between Blenheim and Christchurch (will be open in a few months). During the meeting, there were three days of excellent talks (check out #PATA17 on twitter). Following the meeting, a myajority of the group attended a three day field trip to review the geologic evidence as reviewed by earthquake geologists here of historic and prehistoric earthquakes on the Alpine fault and faults along the Marlborough fault zone (faults that splay off the Alpine fault, extracting plate boundary motion from the Alpine fault). The final day we saw field evidence of rupture from the M 7.8 earthquake, including a coseismic landslide, which blocked a creek. The creek later over-topped some adjacent landscape, down-cutting and exposing stratigraphy that reveals evidence for past rupture on that fault. The trip was epic and the meeting was groundbreaking (apologies for the pun).
This region of the southern New Hebrides subduction zone is formed by the subduction of the Australia plate beneath the Pacific plate. There has been an ongoing earthquake sequence since around Halloween (I prepared a report shortly after I arrived in New Zealand; here is my report for the early part of this sequence). Today there was the largest magnitude earthquake in the sequence. This M 7.0 earthquake generated a tsunami measured on tide gages in the region. However, there was a low likelihood of a transpacific tsunami. The sequence beginning several weeks ago included outer rise extension earthquakes and associated thrust fault earthquakes along the upper plate. I have discussed how the lower/down-going plates in a subduction zone flex and cause extension in this flexed bulge (called the outer rise because it bulges up slightly). Here is my report discussing a possibly triggered outer rise earthquake associated with the 2011 M 9.0 Tohoku-oki earthquake. Here is my report for this M 6.0 earthquake from 2016.08.20.
While looking into this further today, I found that there was a similar sequence (to the current sequence) in 2003-2004. For both sequences, there is an interplay between the upper and lower plates, with compressional earthquakes in the upper plate and extensional earthquakes in the lower plate. Based upon the 2003-2004 sequence, it is possible that there may be a forthcoming compressional earthquake. However, there are many factors that drive the changes in static stress along subduction zones and how that stress may lead to an earthquake (so, there may not be a large earthquake in the upper plate). This is just a simple comparison (albeit for a section of the subduction zone in close proximity).
- I list below some USGS earthquake pages for earthquakes in this report.
- These are earthquakes from this current sequence.
- 2017.10.31 M 6.8
- 2017.11.16 M 5.9
- 2017.11.19 M 6.4
- 2017.11.19 M 5.9
- 2017.11.19 M 6.6
- 2017.11.19 M 7.0
- 2017.11.20 M 5.8
- These are earthquakes from the 2003-2004 sequence.
- 2003.12.25 M 6.5
- 2003.12.26 M 6.8
- 2003.12.27 M 6.7
- 2003.12.27 M 7.3
- 2003.12.27 M 6.3
- 2004.01.03 M 6.4
- 2004.01.03 M 7.1
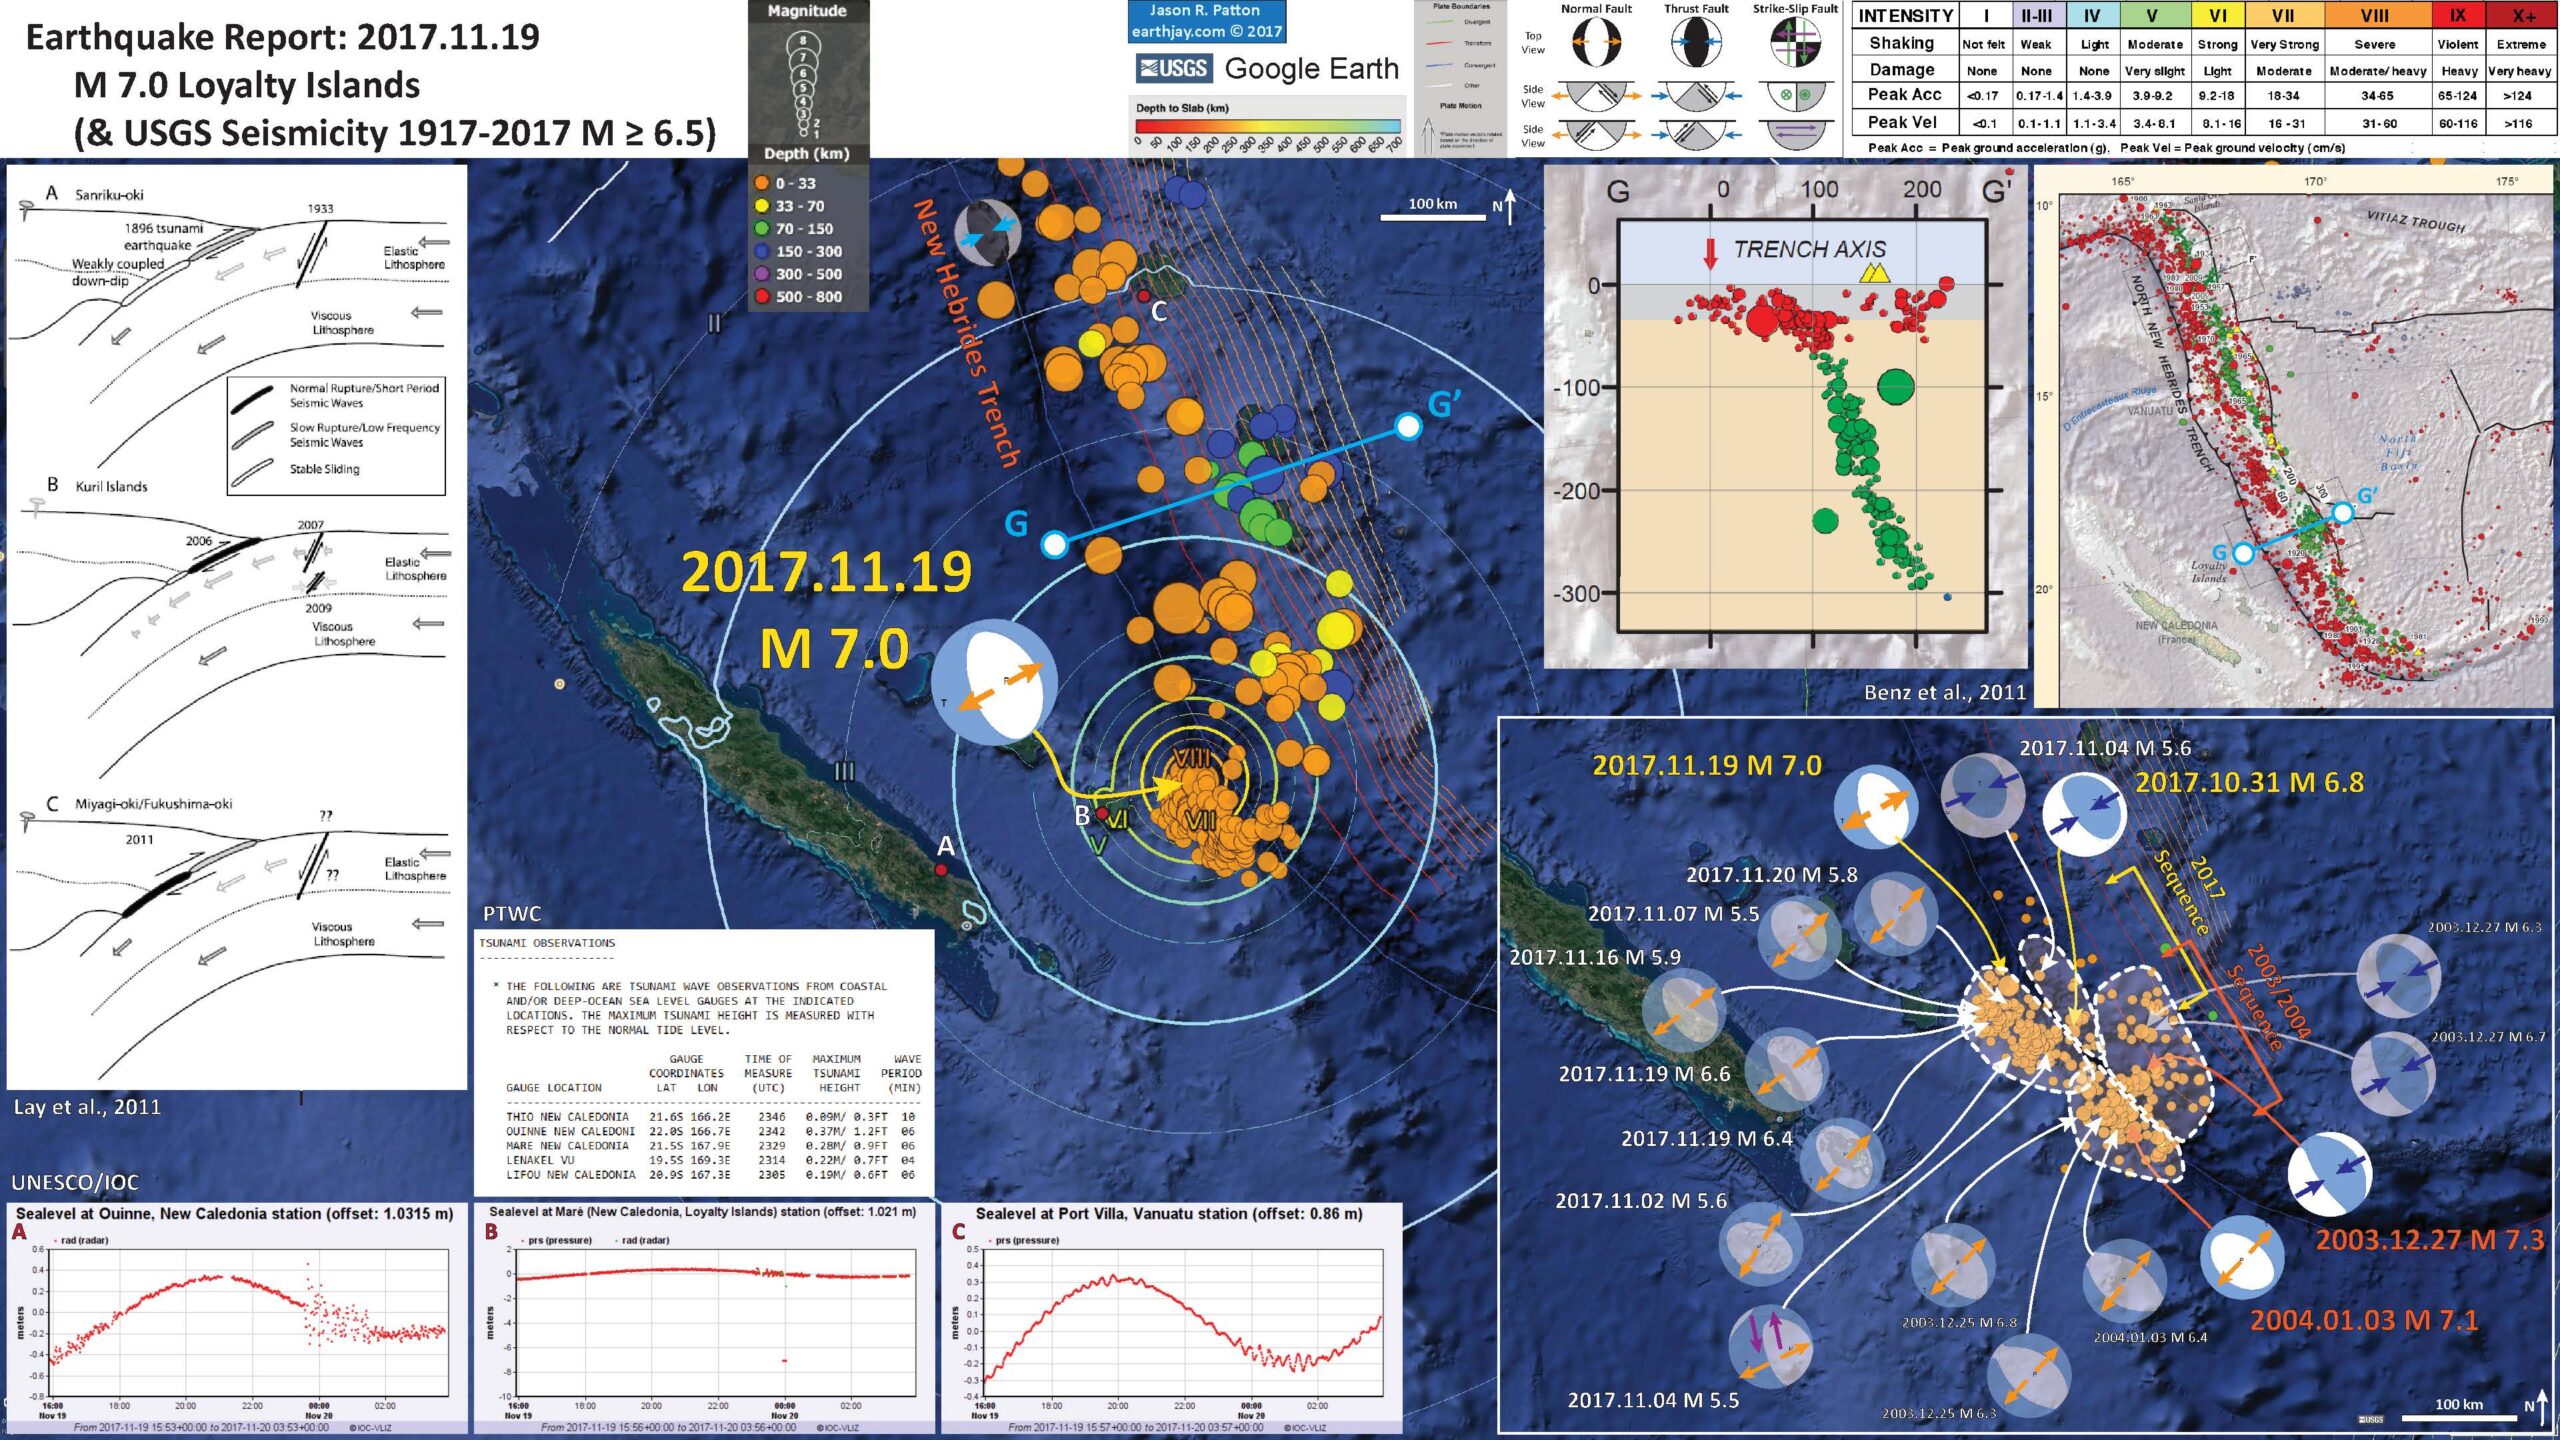
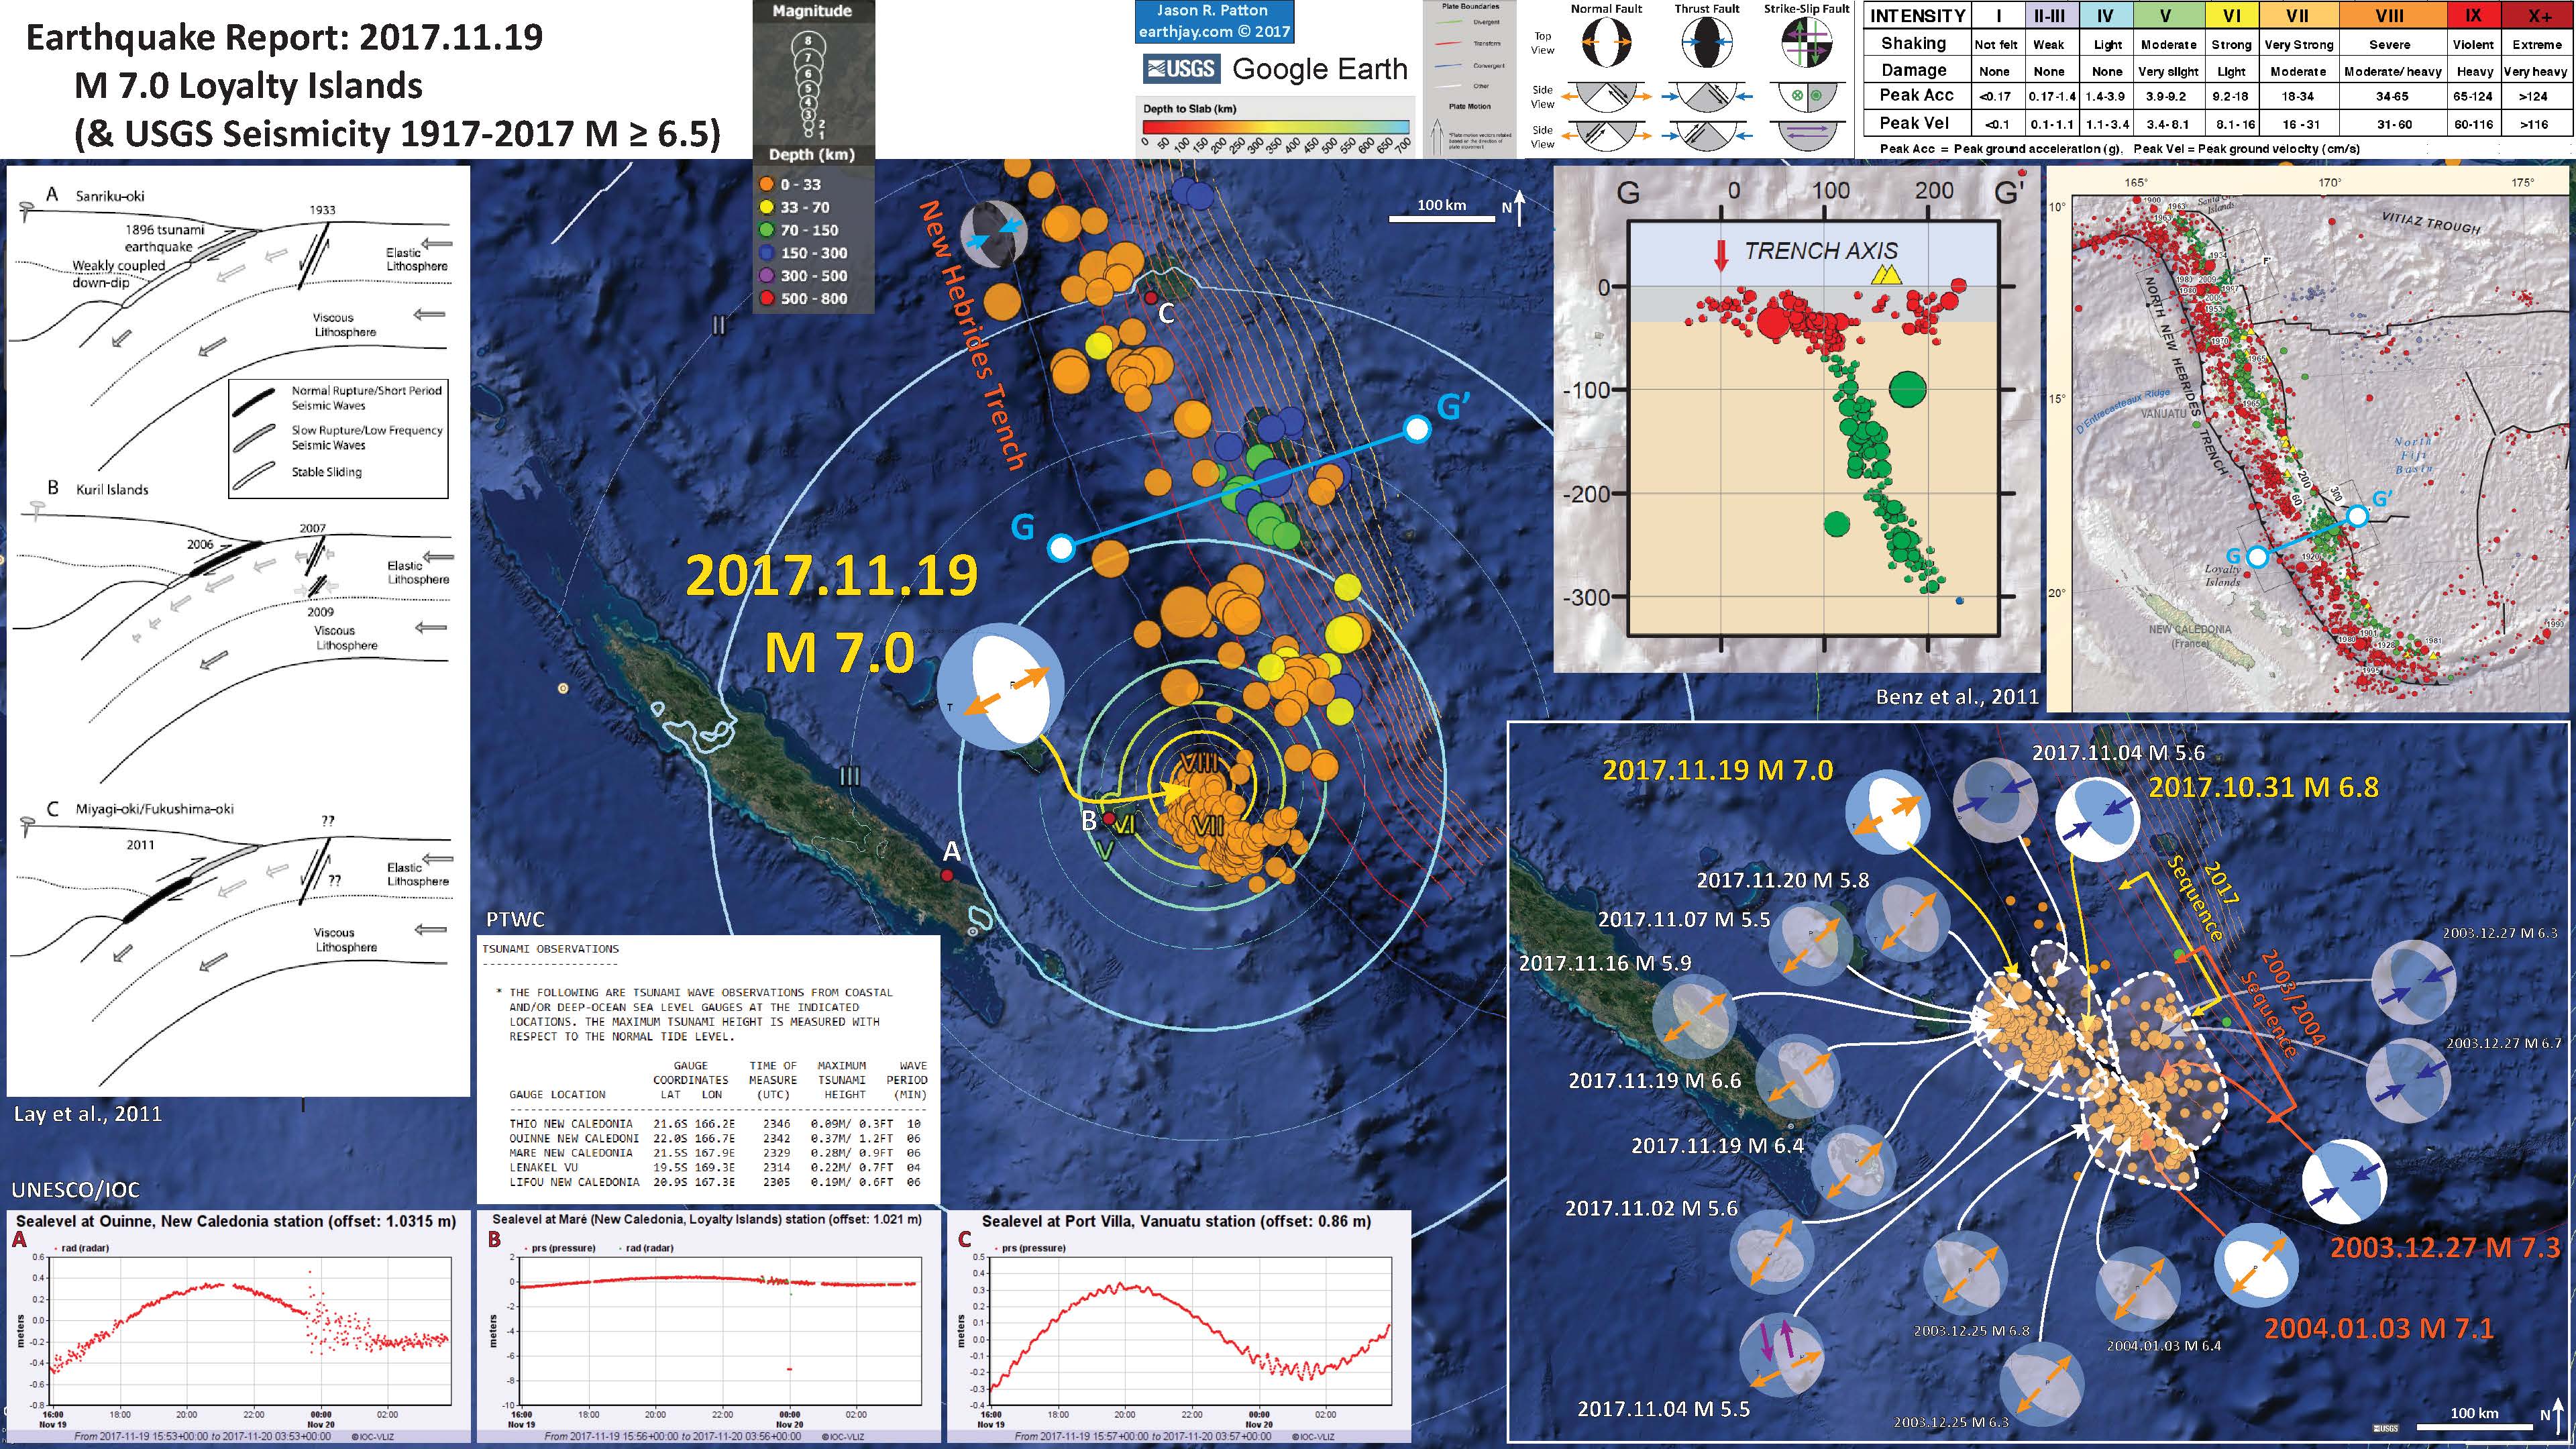
Below is my interpretive poster for this earthquake.
I plot the seismicity from the past month, with color representing depth and diameter representing magnitude (see legend). I include earthquake epicenters from 1917-2017 with magnitudes M > 6.5.
- I placed a moment tensor / focal mechanism legend on the poster. There is more material from the USGS web sites about moment tensors and focal mechanisms (the beach ball symbols). Both moment tensors and focal mechanisms are solutions to seismologic data that reveal two possible interpretations for fault orientation and sense of motion. One must use other information, like the regional tectonics, to interpret which of the two possibilities is more likely. The moment tensor shows northeast-southwest compression, perpendicular to the convergence at this plate boundary. Most of the recent seismicity in this region is associated with convergence along the New Britain trench or the South Solomon trench.
- I also include the shaking intensity contours on the map. These use the Modified Mercalli Intensity Scale (MMI; see the legend on the map). This is based upon a computer model estimate of ground motions, different from the “Did You Feel It?” estimate of ground motions that is actually based on real observations. The MMI is a qualitative measure of shaking intensity. More on the MMI scale can be found here and here. This is based upon a computer model estimate of ground motions, different from the “Did You Feel It?” estimate of ground motions that is actually based on real observations.
- I include the slab contours plotted (Hayes et al., 2012), which are contours that represent the depth to the subduction zone fault. These are mostly based upon seismicity. The depths of the earthquakes have considerable error and do not all occur along the subduction zone faults, so these slab contours are simply the best estimate for the location of the fault.
-
I include some inset figures.
- In the upper right corner I include the map and seismicity cross section from Benz et al. (2011). These maps plot the seismicity and this reveals the nature of the downgoing subducting slab. Shallower earthquakes are generally more related to the subduction zone fault or deformation within either plate (interplate and intraplate earthquakes). While the deeper earthquakes are not megathrust fault related, but solely due to internal crustal deformation (intraplate earthquakes). I highlight the location of the cross section with a blue line labeled G-G’ (and place this cross section in the general location on the main interpretive map.
- In the lower left corner I include some tide gage records from the region, which are from the UNESCO IOC online Sea Level Monitoring Facility. These three records are labeled A, B, and C and the locations of these gages are designated by red dots on the main map, along with A, B, and C labels in white.
- Above the raw tide gage records are some reported wave heights from the Pacific Tsunami Warning Center. These are basically the wave heights recorded on the tide gages, but interpreted by a subject matter expert to estimate the timing of wave arrival and the water surface elevation in excess of the ambient sea level.
- In the lower right corner I include a comparison between the 2003-2004 sequence and the current and ongoing sequence. I plot moment tensors for earthquakes [largely] from after my initial report (though I include the largest magnitude earthquake in the upper plate). I plot USGS moment tensors for the larger magnitude earthquakes from the 2003 sequence. I also label the along strike extent for these two sequences. They overlap by a very small amount, but generally seem to be happening in adjacent sections of the fault system here. All things being equal, the 2003 sequence included M 7 earthquakes in both the upper and lower plates. If the 2017 sequence is similar, there may still be an M 7 earthquake in the upper plate. Of course, there is also a possiblity of a large subduction zone earthquake here too. We just don’t really have enough information to really know (it is difficult to know, if not impossible, the state of stress on the megathrust fault. this make it impossible to predict if there will be more or larger earthquakes here.).
- In the upper left corner I include a figure from Lay et al. (2011) that shows the general tectonic setting at subduction zone faults. There are three examples. Lay et al. (2011) modeled the Japan trench subduction zone after the 2011 M 9.0 Tohoku-Oki earthquake and estimated the static stress changes imparted in the adjacent crust as a result of the M 9.0 earthquake. Lay et al. (2011) determined that the downgoing plate to the east of the M 9.0 earthquake experienced an increase in static stress. This was used to support the hypothesis that the M 6.0 earthquake along the outer rise, east of the M 9.0 slip patch, was statically triggered by the M 9.0 earthquake. The two sequences along the southern New Hebrides trench are probably playing out a similar fault-geometry and static stress relation.
- Here is my poster from the beginning of this sequence.
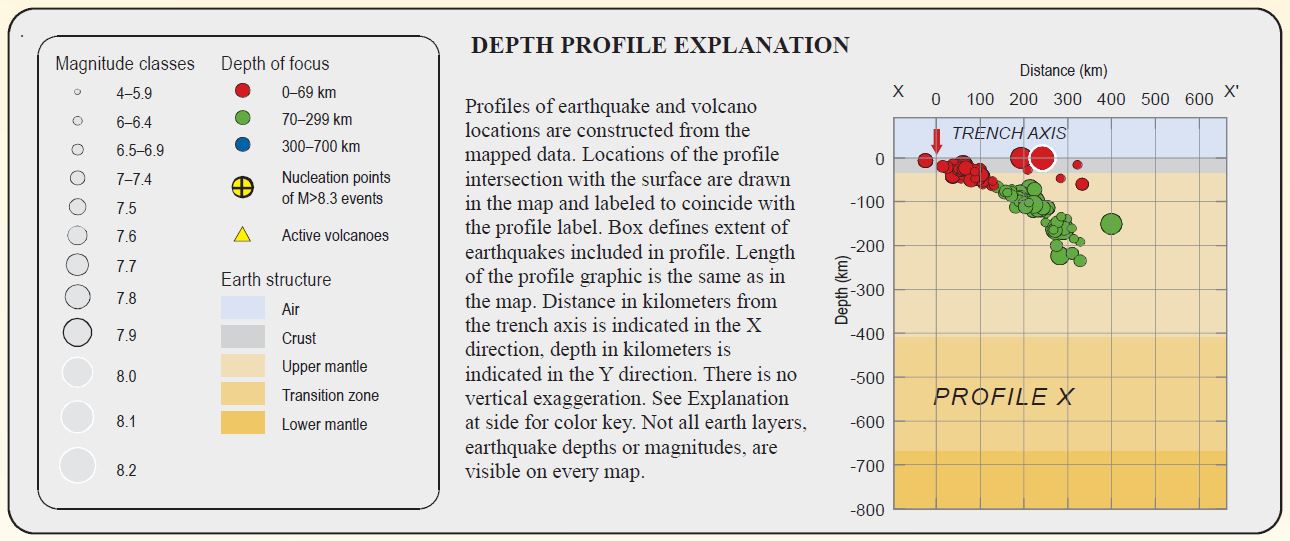
- Here is a map from the USGS report (Benz et al., 2011). Read more about this map on the USGS website. Earthquakes are plotted with color related to depth and circle diameter related to magnitude. Today’s M 6.8 earthquake occurred south of cross section G-G’.
- This is the legend.
- Here is a cross section showing the seismicity along swatch profile G-G’.


- Craig et al. (2014) evaluated the historic record of seismicity for subduction zones globally. In particular, the evaluated the relations between upper and lower plate stresses and earthquake types (cogent for the southern New Hebrides trench). Below is a figure from their paper for this part of the world. I include their figure caption below in blockquote.
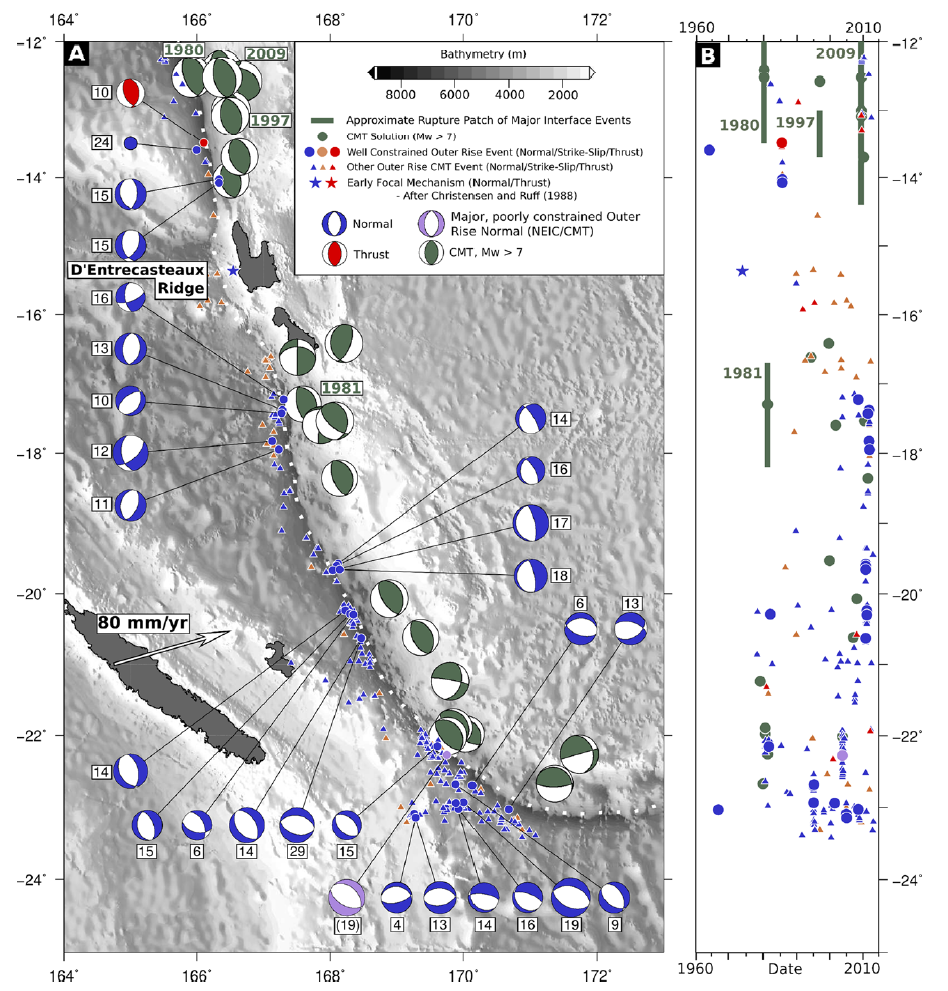
Outer-rise seismicity along the New Hebrides arc. (a) Seismicity and focal mechanisms. Seismicity at the southern end of the arc is dominated by two major outer-rise normal faulting events, and MW 7.6 on 1995 May 16 and an MW 7.1 on 2004 January 3. Earthquakes are included from Chapple & Forsyth (1979); Chinn & Isacks (1983); Liu & McNally (1993). (b) Time versus latitude plot.
- Here is a summary figure from Craig et al. (2014) that shows different stress configurations possibly existing along subduction zones.
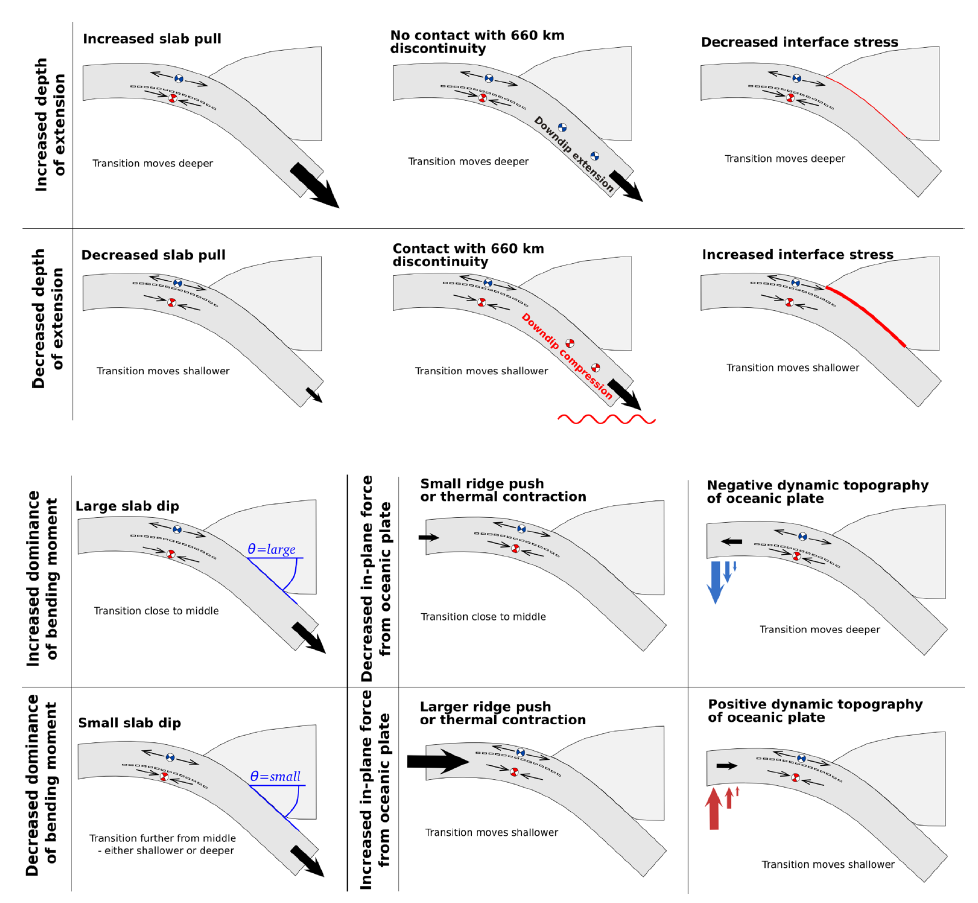
Schematic diagram for the factors influencing the depth of the transition from horizontal extension to horizontal compression beneath the outer rise. Slab pull, the interaction of the descending slab with the 660 km discontinuity (or increasing drag from the surround mantle), and variations in the interface stress influence both the bending moment and the in-plane stress. Increases in the angle of slab dip increases the dominance of the bending moment relative to the in-plane stress, and hence moves the depth of transition towards the middle of the mechanical plate from either an shallower or a deeper position. A decrease in slab dip enhances the influence of the in-plane stress, and hence moves the transition further from the middle of the mechanical plate, either deeper for an extensional in-plane stress, or shallower for a compressional in-plane stress. Increased plate age of the incoming plate leads to increases in the magnitude of ridge push and intraplate thermal contraction, increasing the in-plane compressional stress in the plate prior to bending. Dynamic topography of the oceanic plate seawards of the trench can result in either in-plane extension or compression prior to the application of the bending stresses.
- Here is a great figure from here, the New Caledonian Seismologic Network. This shows how geologists have recorded uplift rates along dip (“perpendicular” to the subduction zone fault). On the left is a map and on the right is a vertical profile showing how these rates of uplift change east-west. This is the upwards flexure related to the outer rise, which causes extension in the upper part of the downgoing/subducting plate.
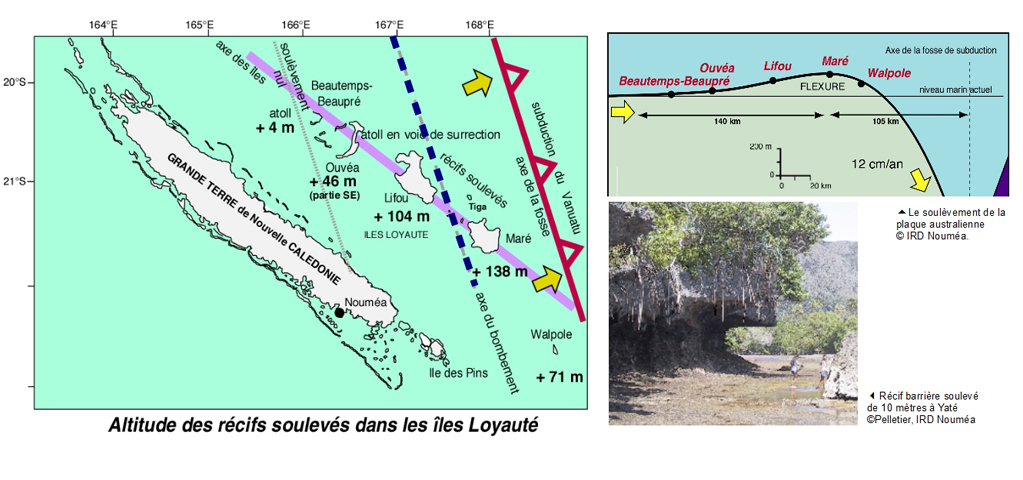
The subduction of the Australian plate under the Vanuatu arc is also accompanied by vertical movements of the lithosphere. Thus, the altitudes recorded by GPS at the level of the Quaternary reef formations that cover the Loyalty Islands (Ouvéa altitude: 46 m, Lifou: 104 m and Maré 138 m) indicate that the Loyalty Islands accompany a bulge of the Australian plate. just before his subduction. Coral reefs that have “recorded” the high historical levels of the sea serve as a reference marker for geologists who map areas in uprising or vertical depression (called uplift and subsidence). Thus, the various studies have shown that the Loyalty Islands, the Isle of Pines but alsothe south of Grande Terre (Yaté region) rise at speeds between 1.2 and 2.5 millimeters per decade.
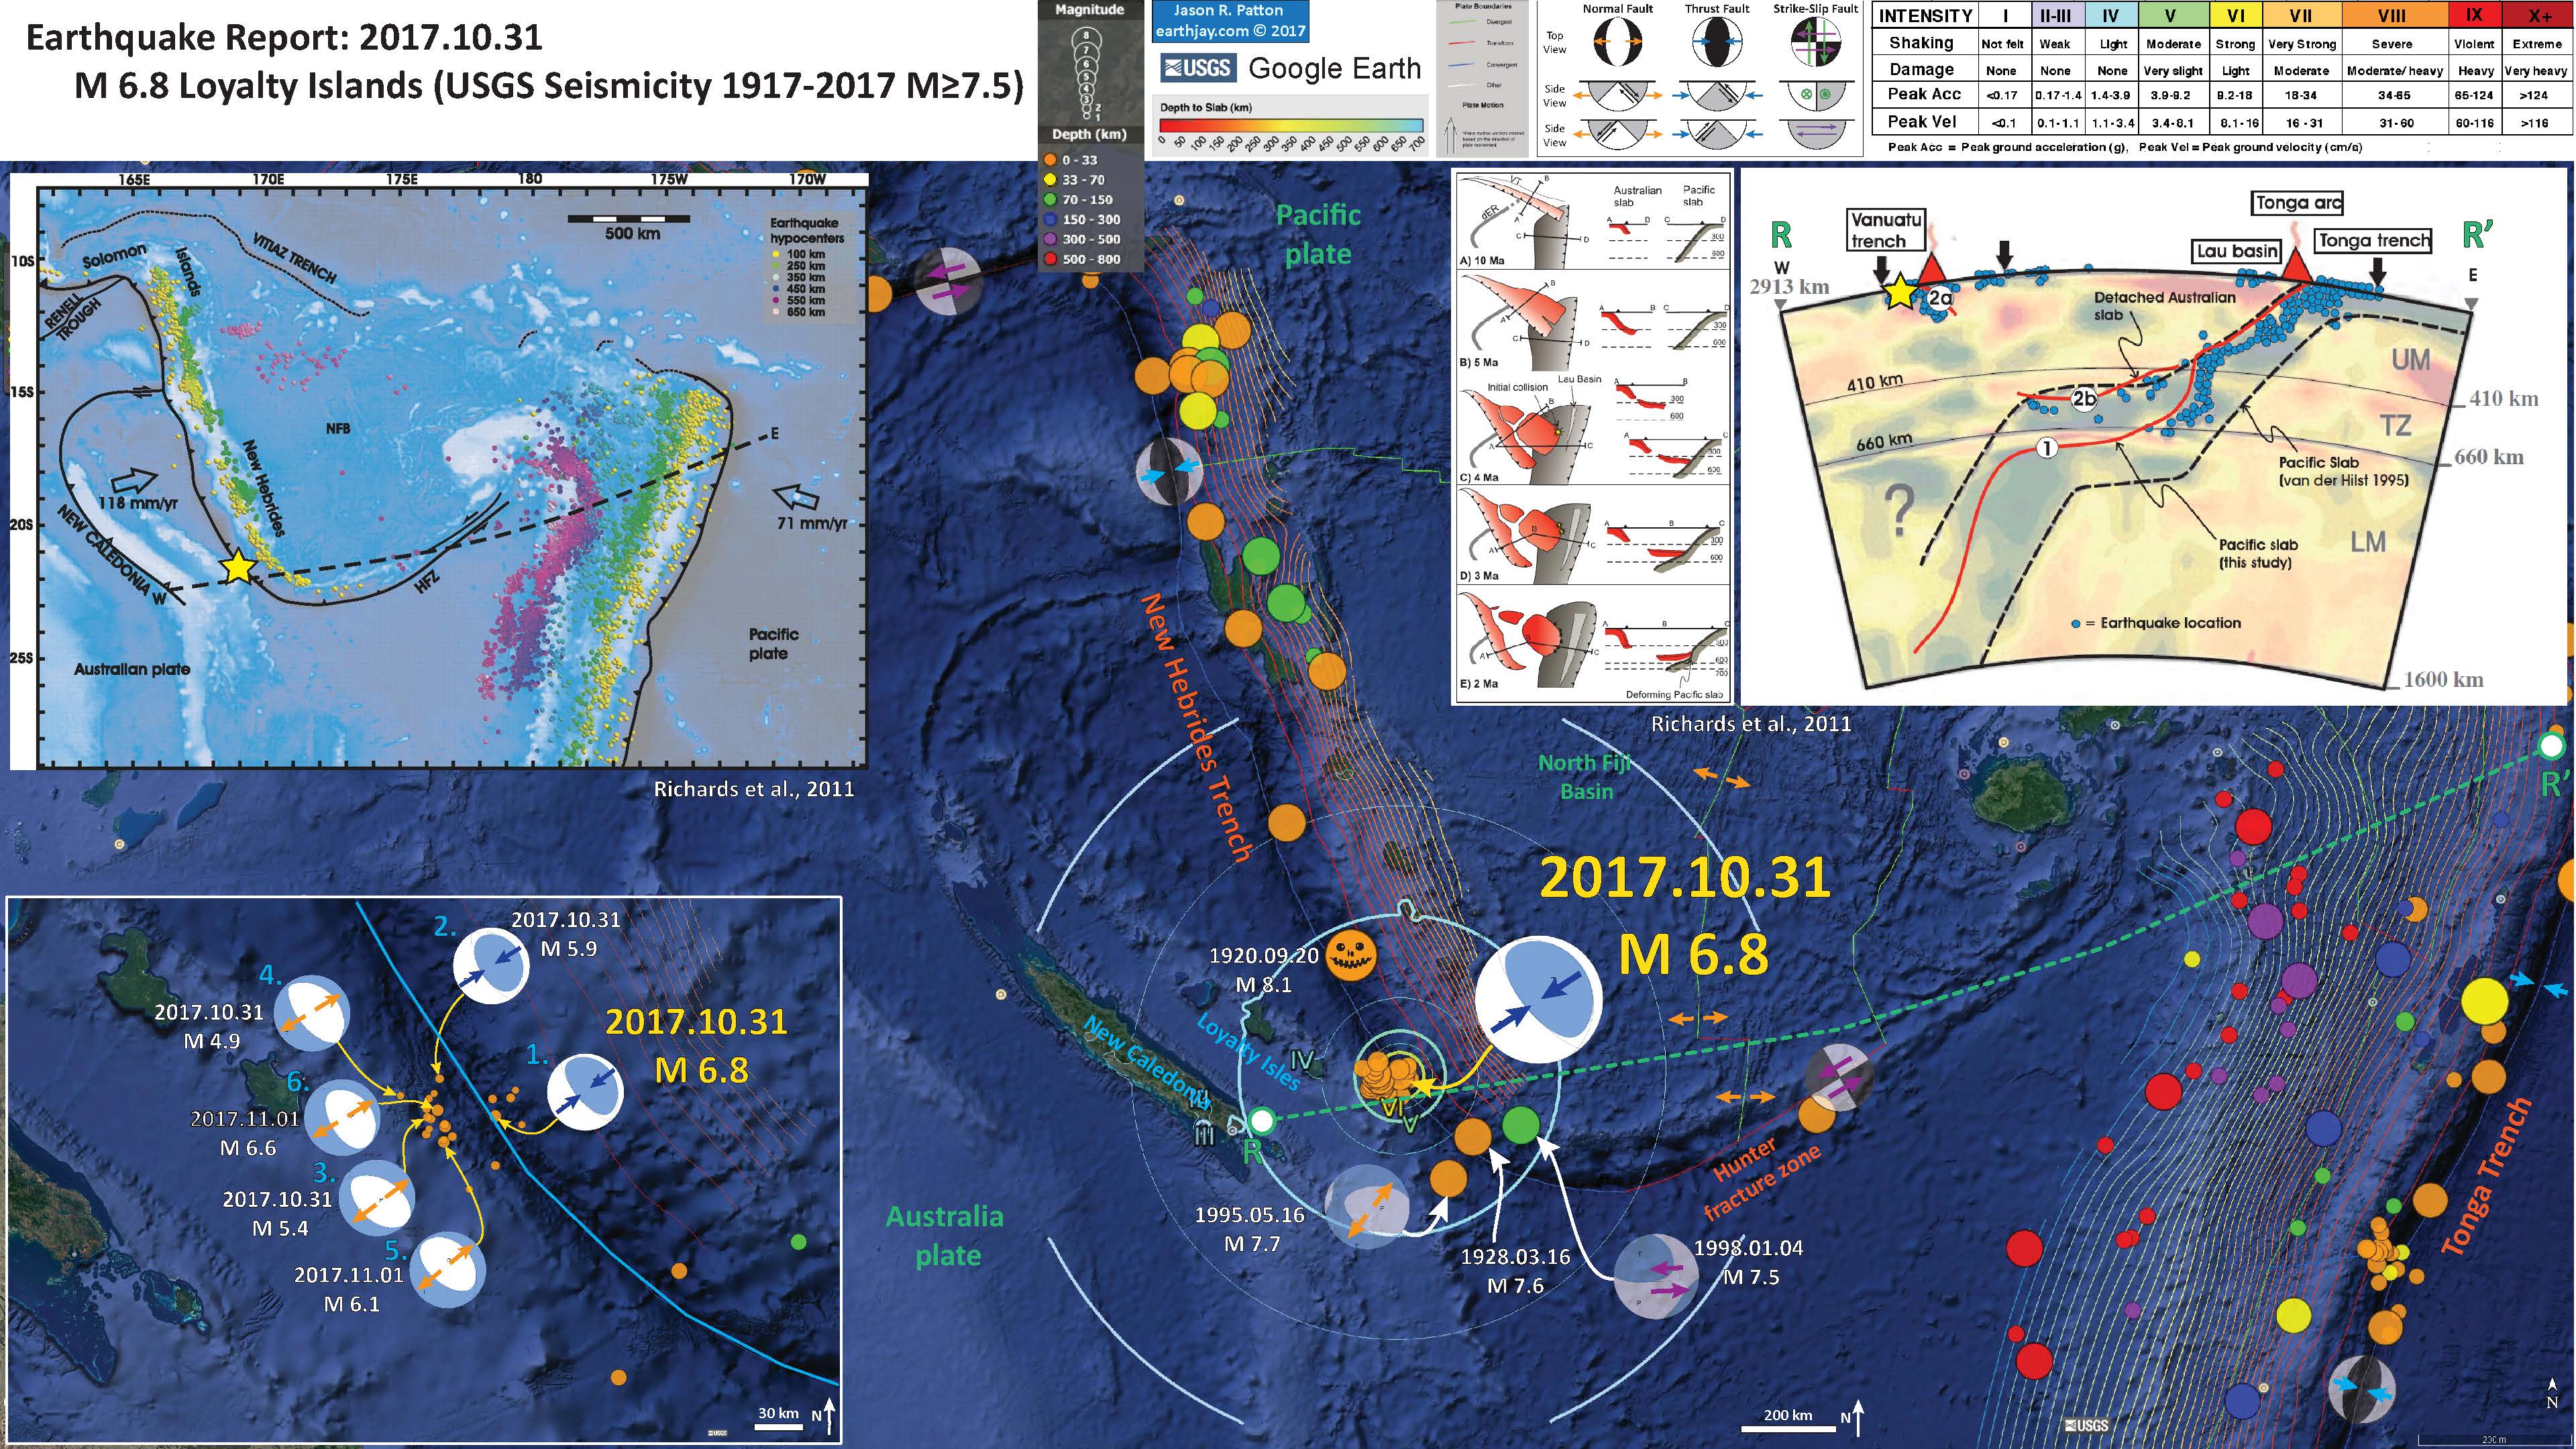
- Here are the figures from Richards et al. (2011) with their figure captions below in blockquote.
- The main tectonic map
- Here is the map showing the current configuration of the slabs in the region.
- This is the cross section showing the megathrust fault configuration based on seismic tomography and seismicity.
- Here is their time step interpretation of the slabs that resulted in the second figure above.
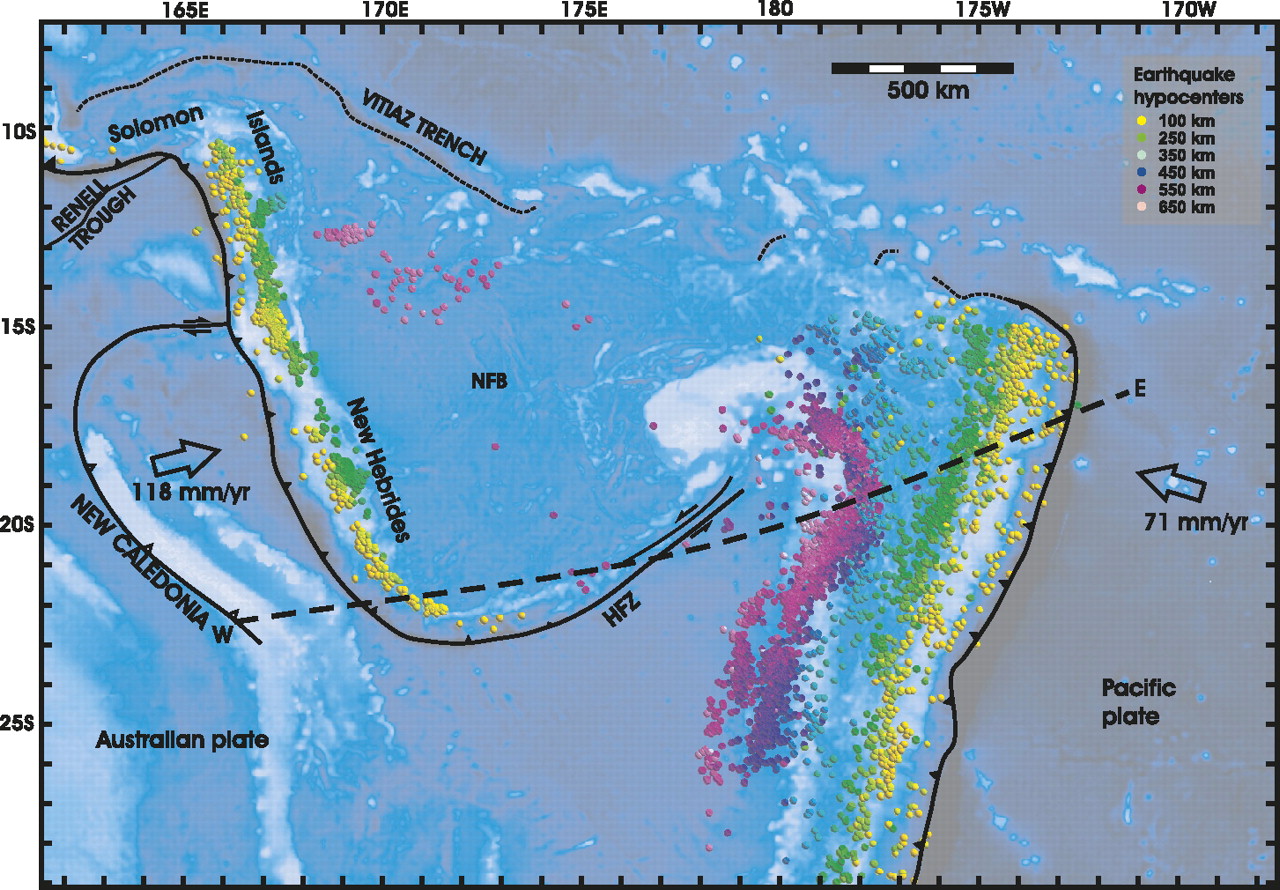
bathymetry, and major tectonic element map of the study area. The Tonga and Vanuatu subduction systems are shown together with the locations of earthquake epicenters discussed herein. Earthquakes between 0 and 70 km depth have been removed for clarity. Remaining earthquakes are color-coded according to depth. Earthquakes located at 500–650 km depth beneath the North Fiji Basin are also shown. Plate motions for Vanuatu are from the U.S. Geological Survey, and for Tonga from Beavan et al. (2002) (see text for details). Dashed line indicates location of cross section shown in Figure 3. NFB—North Fiji Basin; HFZ—Hunter Fracture Zone.
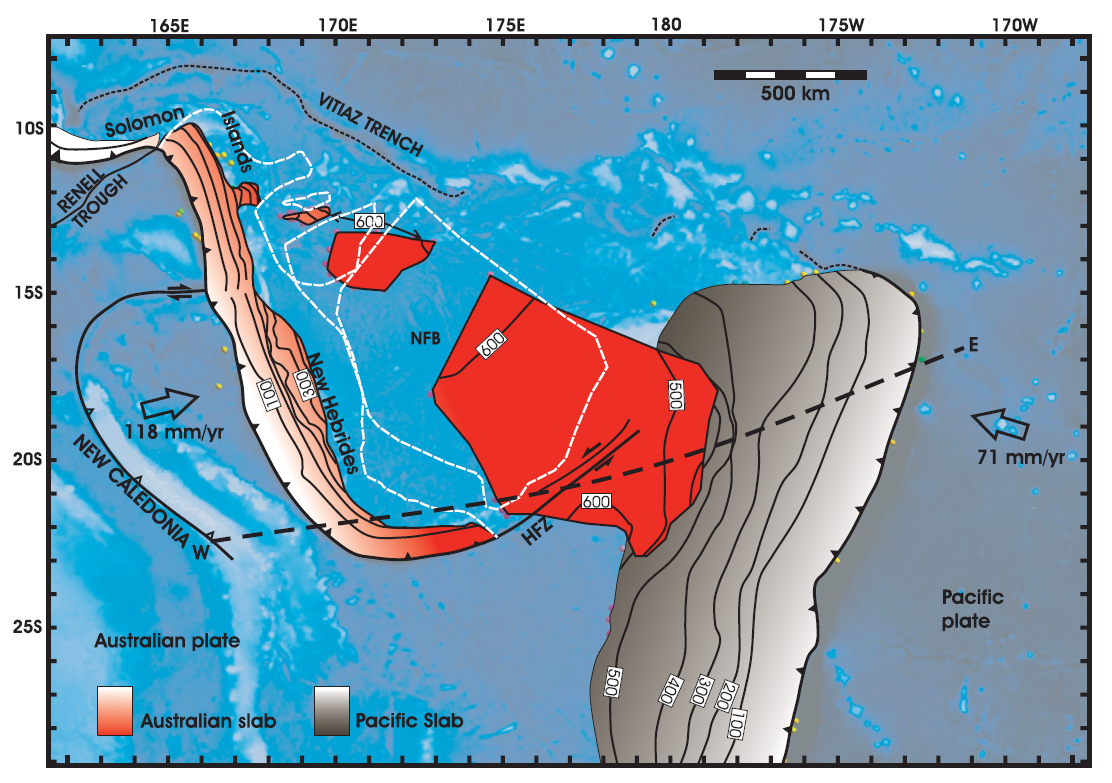
Map showing distribution of slab segments beneath the Tonga-Vanuatu region. West-dipping Pacifi c slab is shown in gray; northeast-dipping Australian slab is shown in red. Three detached segments of Australian slab lie below the North Fiji Basin (NFB). HFZ—Hunter Fracture Zone. Contour interval is 100 km. Detached segments of Australian plate form sub-horizontal sheets located at ~600 km depth. White dashed line shows outline of the subducted slab fragments when reconstructed from 660 km depth to the surface. When all subducted components are brought to the surface, the geometry closely approximates that of the North Fiji Basin.
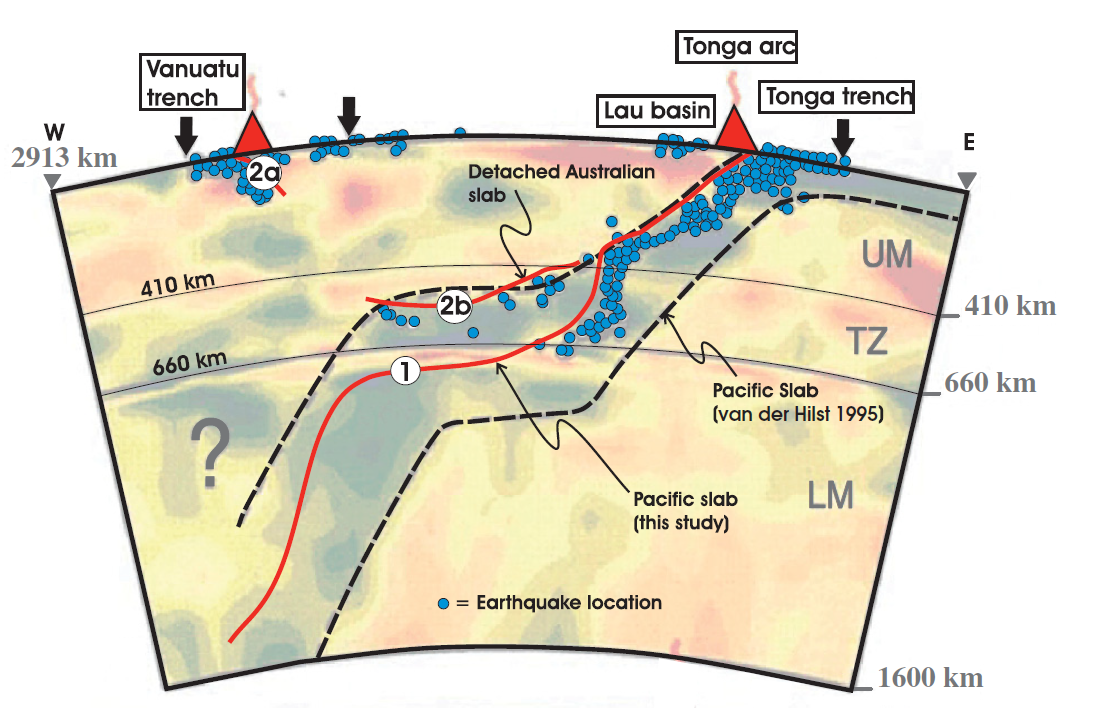
Previous interpretation of combined P-wave tomography and seismicity from van der Hilst (1995). Earthquake hypocenters are shown in blue. The previous interpretation of slab structure is contained within the black dashed lines. Solid red lines mark the surface of the Pacifi c slab (1), the still attached subducting Australian slab (2a), and the detached segment of the Australian plate (2b). UM—upper mantle;
TZ—transition zone; LM—lower mantle.
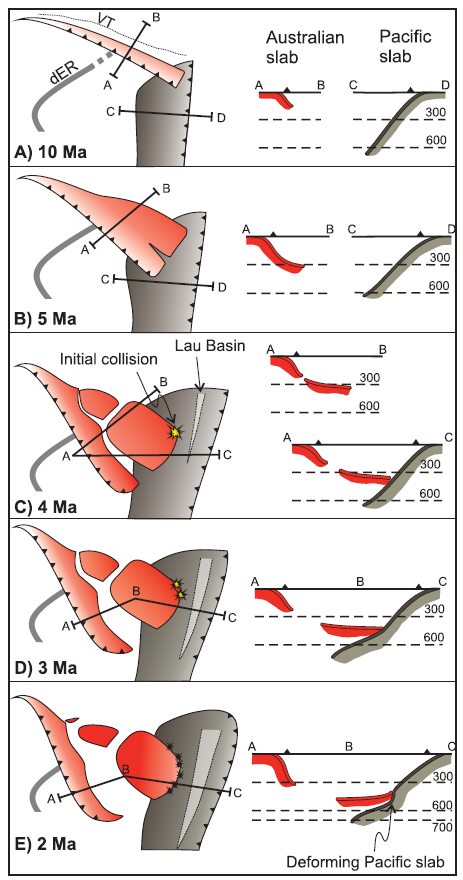
Simplifi ed plate tectonic reconstruction showing the progressive geometric evolution of the Vanuatu and Tonga subduction systems in plan view and in cross section. Initiation of the Vanuatu subduction system begins by 10 Ma. Initial detachment of the basal part of the Australian slab begins at ca. 5–4 Ma and then sinking and collision between the detached segment and the Pacifi c slab occur by 3–4 Ma. Initial opening of the Lau backarc also occurred at this time. Between 3 Ma and the present, both slabs have been sinking progressively to their current position. VT—Vitiaz trench; dER—d’Entrecasteaux Ridge.
- Here is a figure that shows the coulomb stress changes due to the 2011 earthquake. Basically, this shows which locations on the fault where we might expect higher likelihoods of future earthquake slip. I include their figure caption below as a blockquote.

Maps of the Coulomb stress change predicted for the joint P wave, Rayleigh wave and continuous GPS inversion in Fig. 2. The margins of the latter fault model are indicated by the box. Two weeks of aftershock locations from the U.S. Geological Survey are superimposed, with symbol sizes scaled relative to seismic magnitude. (a) The Coulomb stress change averaged over depths of 10–15 km for normal faults with the same westward dipping fault plane geometry as the Mw 7.7 outer rise aftershock, for which the global centroid moment tensor mechanism is shown. (b) Similar stress changes for thrust faults with the same geometry as the mainshock, along with the Mw 7.9 thrusting aftershock to the south, for which the global centroid moment tensor is shown.
- Here is a figure schematically showing how subduction zone earthquakes may increase coulomb stress along the outer rise. The outer rise is a region of the downgoing/subducting plate that is flexing upwards. There are commonly normal faults, sometimes reactivating fracture zone/strike-slip faults, caused by extension along the upper oceanic lithosphere. We call these bending moment normal faults. There was a M 7.1 earthquake on 2013.10.25 that appears to be along one of these faults. I include their figure caption below as a blockquote.

Schematic cross-sections of the A) Sanriku-oki, B) Kuril and C) Miyagi-oki subduction zones where great interplate thrust events have been followed by great trench slope or outer rise extensional events (in the first two cases) and concern about that happening in the case of the 2011 event.
- Here is an animation that shows the seismicity for this region from 1960 – 2016 for earthquakes with magnitudes greater than or equal to 7.0.
- I include some figures mentioned in my report from 2016.04.28 for a sequence of earthquakes in the same region as today’s earthquake (albeit shallower hypocentral depths), in addition to a plot from Cleveland et al. (2014). In the upper right corner, Cleveland et al. (2014) on the left plot a map showing earthquake epicenters for the time period listed below the plot on the right. On the right is a plot of earthquakes (diameter = magnitude) of earthquakes with latitude on the vertical axis and time on the horizontal axis. Cleveland et al (2014) discuss these short periods of seismicity that span a certain range of fault length along the New Hebrides Trench in this area. Above is a screen shot image and below is the video.
- Here is a link to the embedded video below (6 MB mp4)

- 2017.11.19 M 6.8 Loyalty Islands Update #1
- 2017.11.07 M 6.5 Papua New Guinea
- 2017.11.04 M 6.8 Tonga
- 2017.10.31 M 6.8 Loyalty Islands
- 2017.08.27 M 6.4 N. Bismarck plate
- 2017.05.09 M 6.8 Vanuatu
- 2017.03.19 M 6.0 Solomon Islands
- 2017.03.05 M 6.5 New Britain
- 2017.01.22 M 7.9 Bougainville
- 2017.01.03 M 6.9 Fiji
- 2016.12.17 M 7.9 Bougainville
- 2016.12.08 M 7.8 Solomons
- 2016.10.17 M 6.9 New Britain
- 2016.10.15 M 6.4 South Bismarck Sea
- 2016.09.14 M 6.0 Solomon Islands
- 2016.08.31 M 6.7 New Britain
- 2016.08.12 M 7.2 New Hebrides Update #2
- 2016.08.12 M 7.2 New Hebrides Update #1
- 2016.08.12 M 7.2 New Hebrides
- 2016.04.06 M 6.9 Vanuatu Update #1
- 2016.04.03 M 6.9 Vanuatu
- 2015.03.30 M 7.5 New Britain (Update #5)
- 2015.03.30 M 7.5 New Britain (Update #4)
- 2015.03.29 M 7.5 New Britain (Update #3)
- 2015.03.29 M 7.5 New Britain (Update #2)
- 2015.03.29 M 7.5 New Britain (Update #1)
- 2015.03.29 M 7.5 New Britain
- 2015.11.18 M 6.8 Solomon Islands
- 2015.05.24 M 6.8, 6.8, 6.9 Santa Cruz Islands
- 2015.05.05 M 7.5 New Britain
New Britain | Solomon | Bougainville | New Hebrides | Tonga | Kermadec
General Overview
Earthquake Reports
- Benz, H.M., Herman, M., Tarr, A.C., Hayes, G.P., Furlong, K.P., Villaseñor, A., Dart, R.L., and Rhea, S., 2011. Seismicity of the Earth 1900–2010 New Guinea and vicinity: U.S. Geological Survey Open-File Report 2010–1083-H, scale 1:8,000,000.
- Bird, P., 2003. An updated digital model of plate boundaries in Geochemistry, Geophysics, Geosystems, v. 4, doi:10.1029/2001GC000252, 52 p.
- Craig, T.J., Copley, A., and Jackson, J., 2014. A reassessment of outer-rise seismicity and its implications for the mechanics of oceanic lithosphere in Geophysical Journal International, v. 197, p/ 63-89.
- Geist, E.L., and Parsons, T., 2005, Triggering of tsunamigenic aftershocks from large strike-slip earthquakes: Analysis of the November 2000 New Ireland earthquake sequence: Geochemistry, Geophysics, Geosystems, v. 6, doi:10.1029/2005GC000935, 18 p. [Download PDF (6.5 MB)]
- Hayes, G. P., D. J. Wald, and R. L. Johnson (2012), Slab1.0: A three-dimensional model of global subduction zone geometries, J. Geophys. Res., 117, B01302, doi:10.1029/2011JB008524.
- Lay, T., and Kanamori, H., 1980, Earthquake doublets in the Solomon Islands: Physics of the Earth and Planetary Interiors, v. 21, p. 283-304.
- Lay, T., Ammon, C.J., Kanamori, H., Kim, M.J., and Xue, L., 2011. Outer trench-slope faulting and the 2011 Mw 9.0 off the Pacific coast of Tohoku Earthquake in Earth Planets Space,
v. 63, p. 713-718. - Richards, S., Holm, R., Barber, G., 2011. When slabs collide: A tectonic assessment of deep earthquakes in the Tonga-Vanuatu region in Geology, v. 39, no. 8., p. 787-790
- Schwartz, S.Y., 1999, Noncharacteristic behavior and complex recurrence of large subduction zone earthquakes: Journal of Geophysical Research, v. 104, p. 23,111-123,125.
- Schwartz, S.Y., Lay, T., and Ruff, L.J., 1989, Source process of the great 1971 Solomon Islands doublet: Physics of the Earth and Planetary Interiors, v. 56, p. 294-310.