
The past couple of weeks have been busy from an earthquake perspective. There have been four M7 events.
I am writing this report a few days late. But, better late than never!
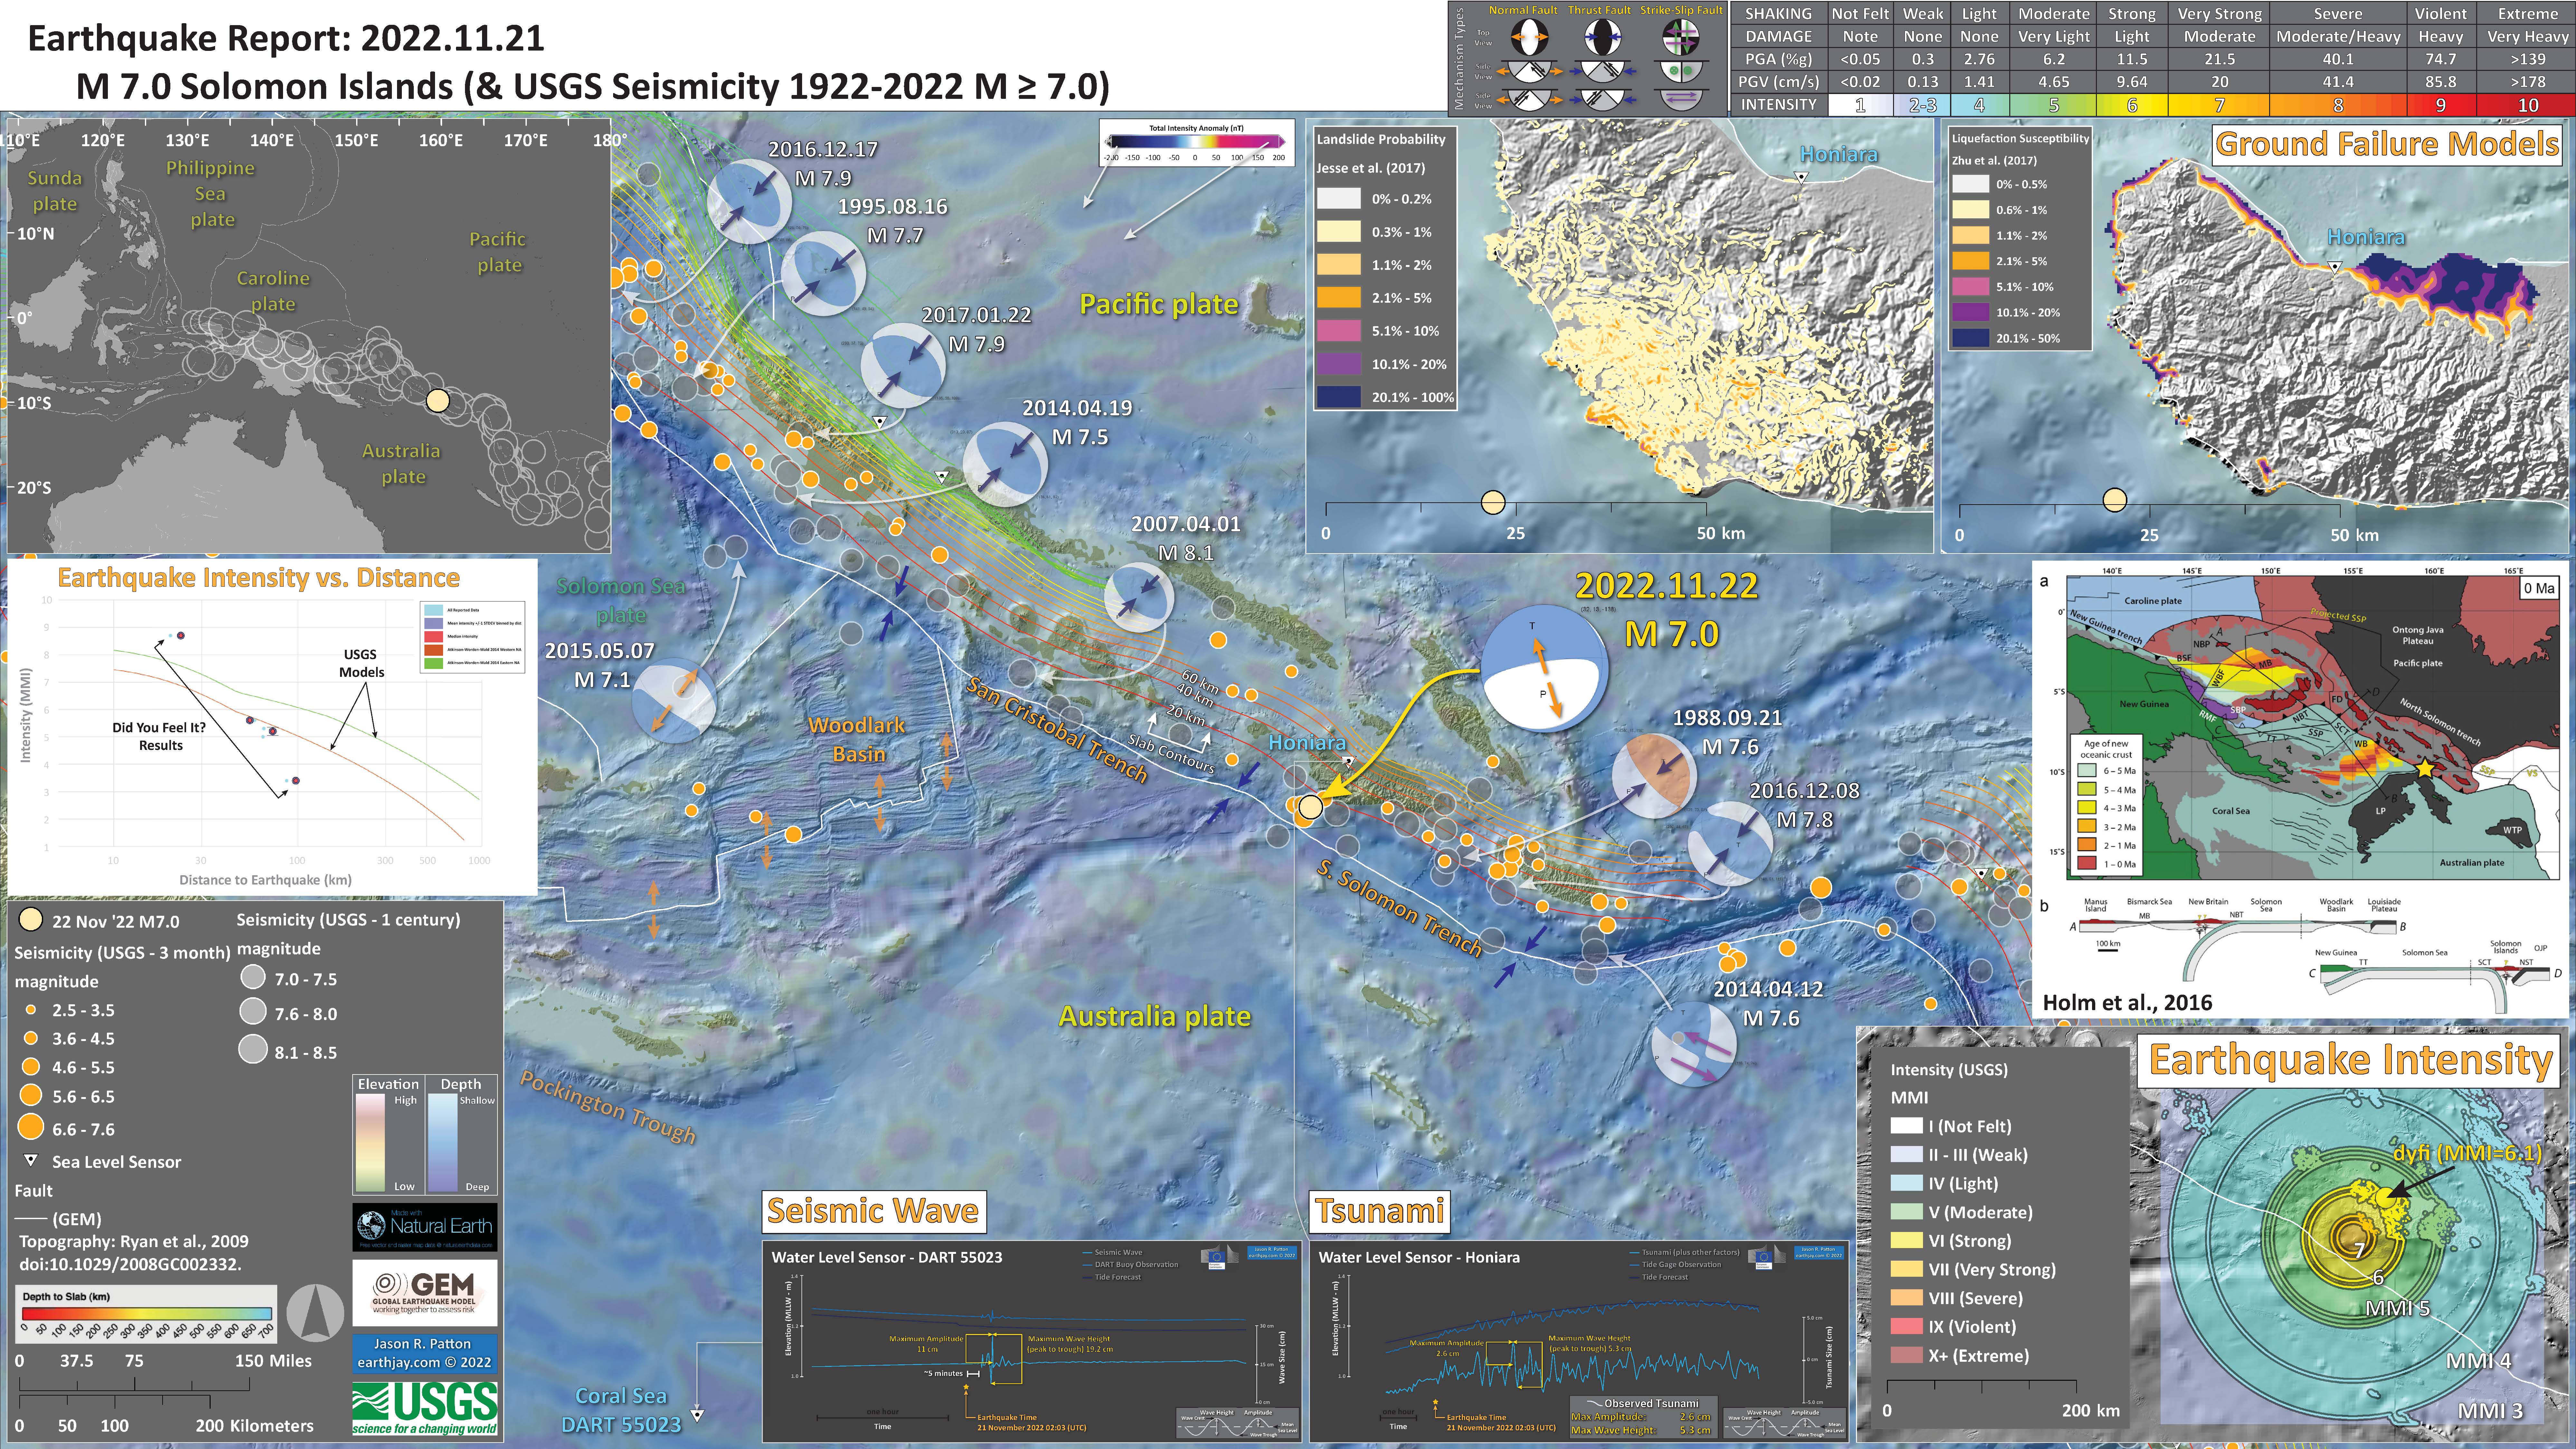
There was a magnitude M 7.0 earthquake offshore of the Solomon Islands.
https://earthquake.usgs.gov/earthquakes/eventpage/us7000irfb/executive
The Solomon Islands owe their existence to the plate boundary fault system there, a convergent plate boundary where plates move towards each other. The plate boundary here is formed by the subduction of the Australia plate beneath the Pacific plate.
The largest earthquakes that happen on Earth happen on these subduction zone faults.
At first I thought that this was an interface earthquake along the megathrust subduction zone fault. These are called interface events because they happen along the fault interface between the two plates. They are also called interplate earthquakes.
However, as the earthquake mechanisms (e.g., focal mechanism or moment tensor) were calculated and posted online, it was clear that this was not a megathrust earthquake.
Here is an illustration that shows a cross section of a subduction zone. I show hypothetical locations for different types of earthquakes. I include earthquake mechanisms (as they would be viewed from map view) for these different types of earthquakes.
Here is a legend for these different mechanisms. We can see what the mechanisms look like from map view (from looking down onto Earth from outer space or from flying in an airplane) and what they look like from the side.
The mechanism for the M 7.0 Solomon Isle earthquake is an extensional (normal) type of an earthquake that happened in the slab of the Australia plate.
Typically, the extension in these slab events is perpendicular to the plate boundary fault because that is the direction that the plate is pulling down (slab pull) due to gravity or that is the orientation of bending of the plate that causes this extension.
In this case, the orientation of extension is oblique (not perpendicular, nor parallel) to the plate boundary. The leading hypothesis for this is that there is some pre-existing structure in the Australia plate that hosted this earthquake fault slip.
If we look to the west, to the structures in the Woodlark Basin, we see some candidate structures for this earthquake. These are faults that are related to the seafloor spreading that formed the Woodlark Basin. It is possible that some of these faults have been subducted beneath the Solomon Isles (though this is unclear).
There are also records of tsunami and seismic waves on water level sensors in this region. A tsunami was observed on the Honiara tide gage and seismic waves observed on the Coral Sea DART Buoy 55023.
Here are the tide gage data from https://webcritech.jrc.ec.europa.eu/SeaLevelsDb/Home. This is a small tsunami that happened on a tide gage with noisy data. So, it is difficult to tell how long the tsunami lasted here.
Here are the DART data from the same website. I triple checked the size of the wave but it still seems a little large for a seismic wave. I could still be wrong. Feel free to contact me if you think this plot needs to be corrected! quakejay at gmail.com.
Below is my interpretive poster for this earthquake
- I plot the seismicity from the past month, with diameter representing magnitude (see legend). I include earthquake epicenters from 1922-2022 with magnitudes M ≥ 3.0 in one version.
- I plot the USGS fault plane solutions (moment tensors in blue and focal mechanisms in orange), possibly in addition to some relevant historic earthquakes.
- A review of the basic base map variations and data that I use for the interpretive posters can be found on the Earthquake Reports page. I have improved these posters over time and some of this background information applies to the older posters.
- Some basic fundamentals of earthquake geology and plate tectonics can be found on the Earthquake Plate Tectonic Fundamentals page.
- In the upper left is a map that shows the plate boundary faults and a century of seismicity. The shoreline data come from GIS data at Natural Earth (a great source of fee GIS data).
- In the center right is a map from Holm et al. (2016) that shows various key elements of the plate configuration in this region. Colors representing the age of the crust shows how the Woodlark Basin has an active spreading ridge system with ridges striking East-West. Large Igneous Provinces are shown here in dark gray. A relevant cross section is C-D, with the location highlighted in magenta on the map. The cross section shows how the North Solomon Trench is configured.
- In the lower right corner is a map that shows the ground shaking from the earthquake, with color representing intensity using the Modified Mercalli Intensity (MMI) scale. The closer to the earthquake, the stronger the ground shaking. The colors on the map represent the USGS model of ground shaking. The colored circles represent reports from people who posted information on the USGS Did You Feel It? part of the website for this earthquake. There are things that affect the strength of ground shaking other than distance, which is why the reported intensities are different from the modeled intensities.
- In the center left is a plot that shows how the shaking intensity models and reports relate to each other. The horizontal axis is distance from the earthquake and the vertical axis is shaking intensity (using the MMI scale, just like in the map to the right: these are the same datasets).
- In the upper right are two maps that show models of how there may have been landslides or liquefaction because of the earthquake shaking and impacts. Read more about landslides and liquefaction here. I include the USGS epicenter as a yellow circle. These ground failure models are based on the USGS epicenter/location.
- In the lower center are water surface elevation (WSE) data from a tide gage in Honiara and a DART buoy located near Cocos Island. The tide gage shows a small tsunami and the DART buoy shows evidence for seismic waves from this earhquake.
I include some inset figures. Some of the same figures are located in different places on the larger scale map below.
- Here is the map with 3 month’s seismicity plotted.
- Here is an educational video (from IRIS) for this part of the western Pacific. There are many plate boundaries and these margins are very active. This is a link to the embedded video below (10.4 MB mp4)
Other Report Pages
- This figure shows an interpretation of the regional tectonics (Holm et al., 2016). I include the figure caption below as a blockquote.
- This figure shows details of the regional tectonics (Holm et al., 2016). I include the figure caption below as a blockquote.
Some Relevant Discussion and Figures
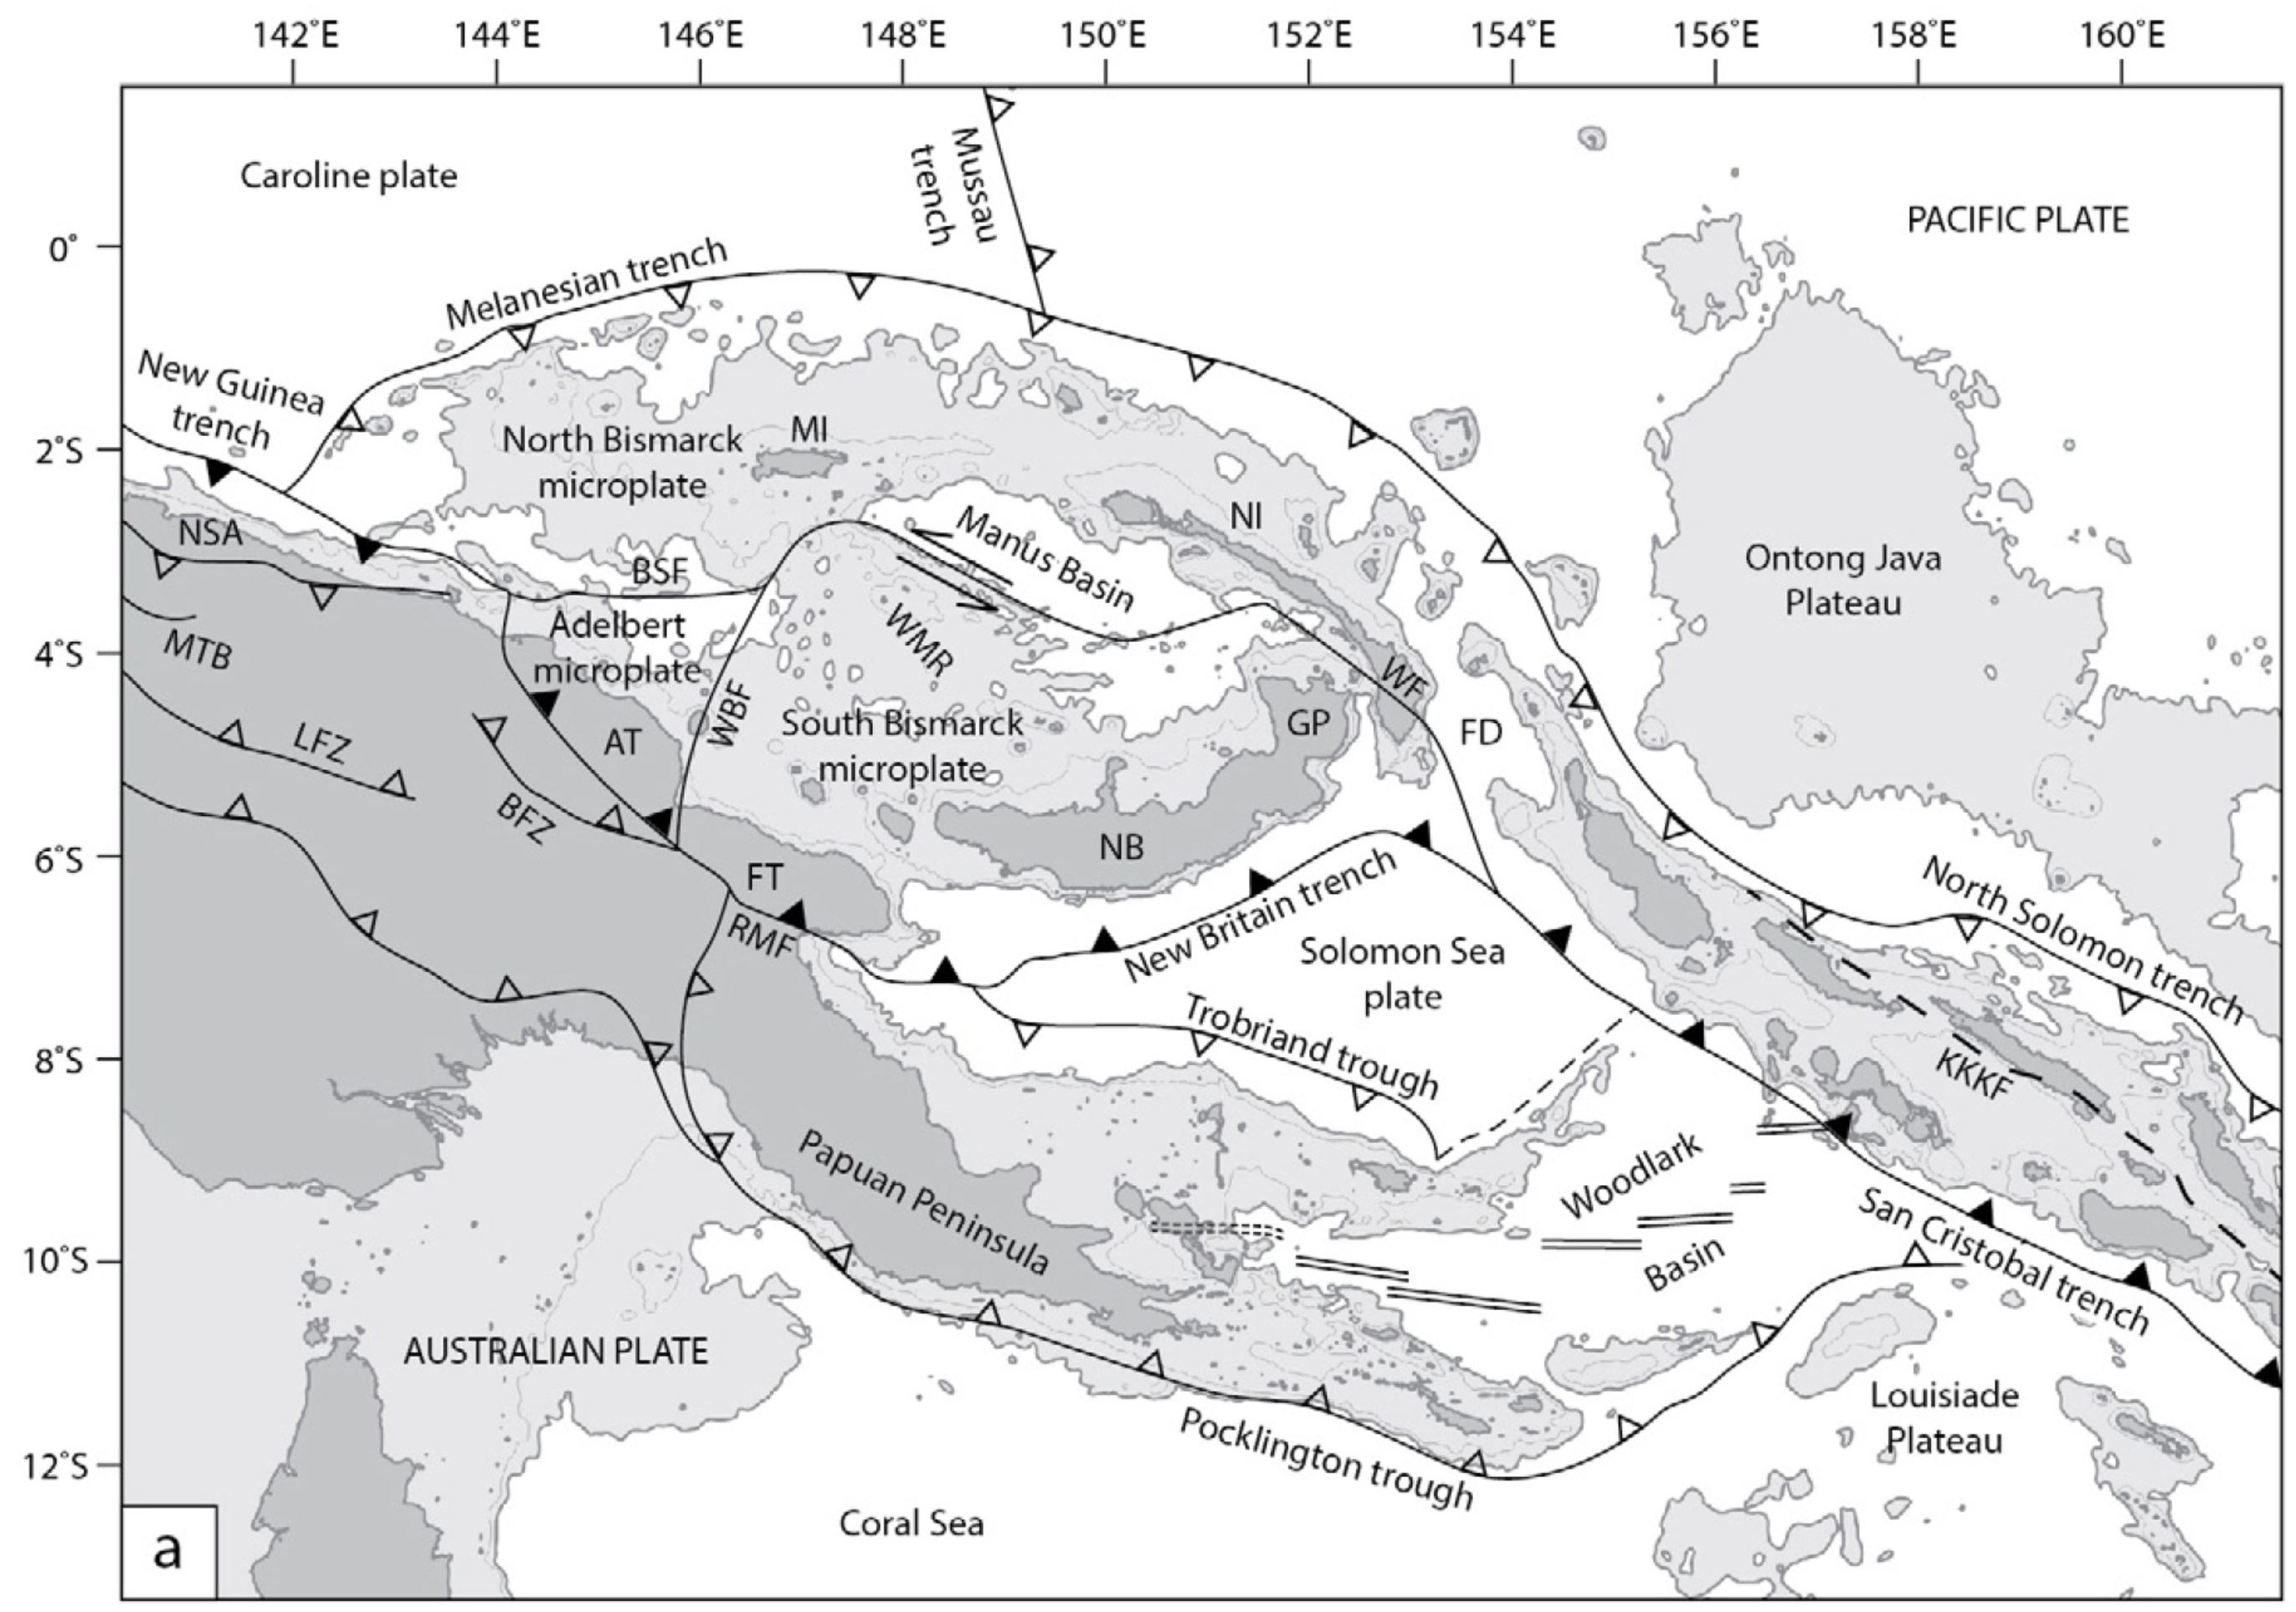
Tectonic setting of Papua New Guinea and Solomon Islands. a) Regional plate boundaries and tectonic elements. Light grey shading illustrates bathymetry b 2000 m below sea level indicative of continental or arc crust, and oceanic plateaus; 1000 m depth contour is also shown. Adelbert Terrane (AT); Bismarck Sea fault (BSF); Bundi fault zone (BFZ); Feni Deep (FD); Finisterre Terrane (FT); Gazelle Peninsula (GP); Kia-Kaipito-Korigole fault zone (KKKF); Lagaip fault zone (LFZ); Mamberamo thrust belt (MTB); Manus Island (MI); New Britain (NB); New Ireland (NI); North Sepik arc (NSA); Ramu-Markham fault (RMF); Weitin Fault (WF);West Bismarck fault (WBF); Willaumez-Manus Rise (WMR).
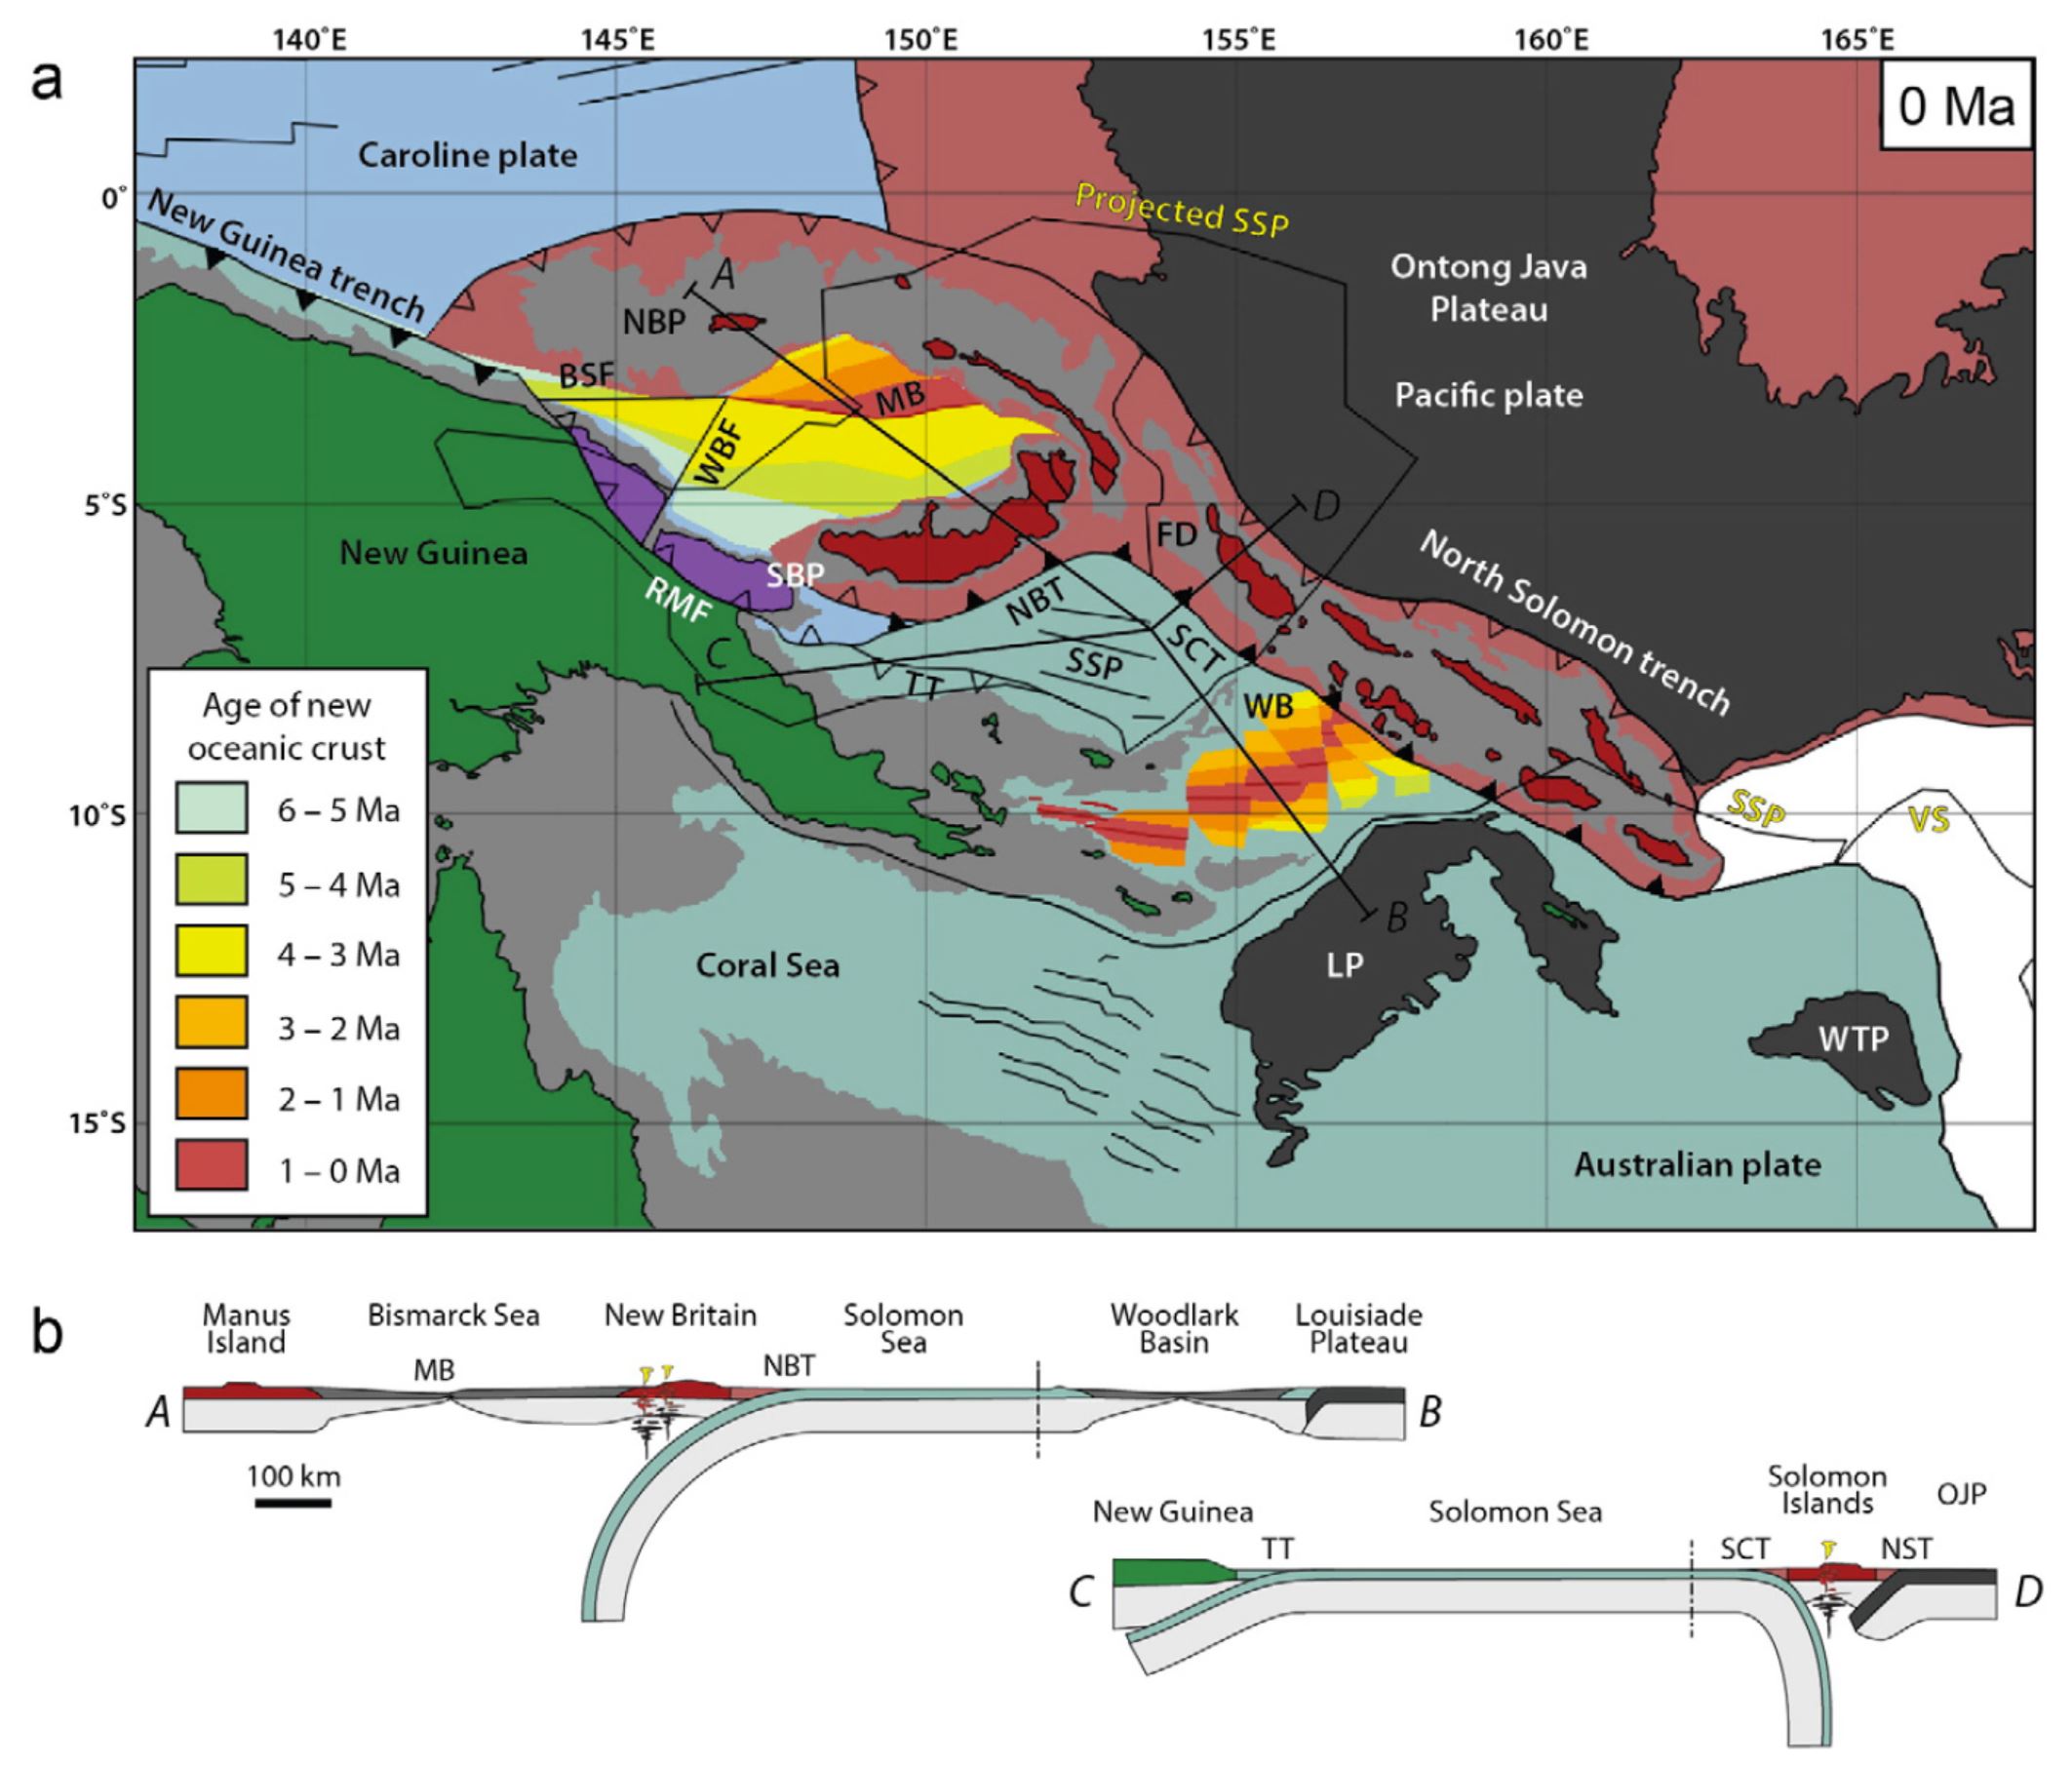
a) Present day tectonic features of the Papua New Guinea and Solomon Islands region as shown in plate reconstructions. Sea floor magnetic anomalies are shown for the Caroline plate (Gaina and Müller, 2007), Solomon Sea plate (Gaina and Müller, 2007) and Coral Sea (Weissel and Watts, 1979). Outline of the reconstructed Solomon Sea slab (SSP) and Vanuatu slab (VS)models are as indicated. b) Cross-sections related to the present day tectonic setting. Section locations are as indicated. Bismarck Sea fault (BSF); Feni Deep (FD); Louisiade Plateau
(LP); Manus Basin (MB); New Britain trench (NBT); North Bismarck microplate (NBP); North Solomon trench (NST); Ontong Java Plateau (OJP); Ramu-Markham fault (RMF); San Cristobal trench (SCT); Solomon Sea plate (SSP); South Bismarck microplate (SBP); Trobriand trough (TT); projected Vanuatu slab (VS); West Bismarck fault (WBF); West Torres Plateau (WTP); Woodlark Basin (WB).
- 2022.11.22 M 7.0 Solomon Isles
- 2022.11.11 M 7.3 Tonga
- 2022.09.10 M 7.6 Papua New Guinea
- 2021.03.04 M 8.1 Kermadec
- 2021.02.10 M 7.7 Loyalty Islands
- 2019.06.15 M 7.2 Kermadec
- 2019.05.14 M 7.5 New Ireland
- 2019.05.06 M 7.2 Papua New Guinea
- 2018.12.05 M 7.5 New Caledonia
- 2018.10.10 M 7.0 New Britain, PNG
- 2018.09.09 M 6.9 Kermadec
- 2018.08.29 M 7.1 Loyalty Islands
- 2018.08.18 M 8.2 Fiji
- 2018.03.26 M 6.9 New Britain
- 2018.03.26 M 6.6 New Britain
- 2018.03.08 M 6.8 New Ireland
- 2018.02.25 M 7.5 Papua New Guinea
- 2018.02.26 M 7.5 Papua New Guinea Update #1
- 2017.11.19 M 7.0 Loyalty Islands Update #1
- 2017.11.07 M 6.5 Papua New Guinea
- 2017.11.04 M 6.8 Tonga
- 2017.10.31 M 6.8 Loyalty Islands
- 2017.08.27 M 6.4 N. Bismarck plate
- 2017.05.09 M 6.8 Vanuatu
- 2017.03.19 M 6.0 Solomon Islands
- 2017.03.05 M 6.5 New Britain
- 2017.01.22 M 7.9 Bougainville
- 2017.01.03 M 6.9 Fiji
- 2016.12.17 M 7.9 Bougainville
- 2016.12.08 M 7.8 Solomons
- 2016.10.17 M 6.9 New Britain
- 2016.10.15 M 6.4 South Bismarck Sea
- 2016.09.14 M 6.0 Solomon Islands
- 2016.08.31 M 6.7 New Britain
- 2016.08.12 M 7.2 New Hebrides Update #2
- 2016.08.12 M 7.2 New Hebrides Update #1
- 2016.08.12 M 7.2 New Hebrides
- 2016.04.06 M 6.9 Vanuatu Update #1
- 2016.04.03 M 6.9 Vanuatu
- 2015.03.30 M 7.5 New Britain (Update #5)
- 2015.03.30 M 7.5 New Britain (Update #4)
- 2015.03.29 M 7.5 New Britain (Update #3)
- 2015.03.29 M 7.5 New Britain (Update #2)
- 2015.03.29 M 7.5 New Britain (Update #1)
- 2015.03.29 M 7.5 New Britain
- 2015.11.18 M 6.8 Solomon Islands
- 2015.05.24 M 6.8, 6.8, 6.9 Santa Cruz Islands
- 2015.05.05 M 7.5 New Britain
New Britain | Solomon | Bougainville | New Hebrides | Tonga | Kermadec Earthquake Reports
General Overview
Earthquake Reports
Social Media
- Frisch, W., Meschede, M., Blakey, R., 2011. Plate Tectonics, Springer-Verlag, London, 213 pp.
- Hayes, G., 2018, Slab2 – A Comprehensive Subduction Zone Geometry Model: U.S. Geological Survey data release, https://doi.org/10.5066/F7PV6JNV.
- Holt, W. E., C. Kreemer, A. J. Haines, L. Estey, C. Meertens, G. Blewitt, and D. Lavallee (2005), Project helps constrain continental dynamics and seismic hazards, Eos Trans. AGU, 86(41), 383–387, , https://doi.org/10.1029/2005EO410002. /li>
- Jessee, M.A.N., Hamburger, M. W., Allstadt, K., Wald, D. J., Robeson, S. M., Tanyas, H., et al. (2018). A global empirical model for near-real-time assessment of seismically induced landslides. Journal of Geophysical Research: Earth Surface, 123, 1835–1859. https://doi.org/10.1029/2017JF004494
- Kreemer, C., J. Haines, W. Holt, G. Blewitt, and D. Lavallee (2000), On the determination of a global strain rate model, Geophys. J. Int., 52(10), 765–770.
- Kreemer, C., W. E. Holt, and A. J. Haines (2003), An integrated global model of present-day plate motions and plate boundary deformation, Geophys. J. Int., 154(1), 8–34, , https://doi.org/10.1046/j.1365-246X.2003.01917.x.
- Kreemer, C., G. Blewitt, E.C. Klein, 2014. A geodetic plate motion and Global Strain Rate Model in Geochemistry, Geophysics, Geosystems, v. 15, p. 3849-3889, https://doi.org/10.1002/2014GC005407.
- Meyer, B., Saltus, R., Chulliat, a., 2017. EMAG2: Earth Magnetic Anomaly Grid (2-arc-minute resolution) Version 3. National Centers for Environmental Information, NOAA. Model. https://doi.org/10.7289/V5H70CVX
- Müller, R.D., Sdrolias, M., Gaina, C. and Roest, W.R., 2008, Age spreading rates and spreading asymmetry of the world’s ocean crust in Geochemistry, Geophysics, Geosystems, 9, Q04006, https://doi.org/10.1029/2007GC001743
- Pagani,M. , J. Garcia-Pelaez, R. Gee, K. Johnson, V. Poggi, R. Styron, G. Weatherill, M. Simionato, D. Viganò, L. Danciu, D. Monelli (2018). Global Earthquake Model (GEM) Seismic Hazard Map (version 2018.1 – December 2018), DOI: 10.13117/GEM-GLOBAL-SEISMIC-HAZARD-MAP-2018.1
- Silva, V ., D Amo-Oduro, A Calderon, J Dabbeek, V Despotaki, L Martins, A Rao, M Simionato, D Viganò, C Yepes, A Acevedo, N Horspool, H Crowley, K Jaiswal, M Journeay, M Pittore, 2018. Global Earthquake Model (GEM) Seismic Risk Map (version 2018.1). https://doi.org/10.13117/GEM-GLOBAL-SEISMIC-RISK-MAP-2018.1
- Zhu, J., Baise, L. G., Thompson, E. M., 2017, An Updated Geospatial Liquefaction Model for Global Application, Bulletin of the Seismological Society of America, 107, p 1365-1385, https://doi.org/0.1785/0120160198
- Baldwin, S.L., Fitzgerald, P.G., and Webb, L.E., 2012, Tectonics of the New Guinea Region, Annu. Rev. Earth Planet. Sci., v. 40, pp. 495-520.
- Benz, H.M., Herman, M., Tarr, A.C., Hayes, G.P., Furlong, K.P., Villaseñor, A., Dart, R.L., and Rhea, S., 2011. Seismicity of the Earth 1900–2010 New Guinea and vicinity: U.S. Geological Survey Open-File Report 2010–1083-H, scale 1:8,000,000.
- Bird, P., 2003. An updated digital model of plate boundaries in Geochemistry, Geophysics, Geosystems, v. 4, doi:10.1029/2001GC000252, 52 p.
- Geist, E.L., and Parsons, T., 2005, Triggering of tsunamigenic aftershocks from large strike-slip earthquakes: Analysis of the November 2000 New Ireland earthquake sequence: Geochemistry, Geophysics, Geosystems, v. 6, doi:10.1029/2005GC000935, 18 p. [Download PDF (6.5 MB)]
- Hamilton, W.B., 1979. Tectonics of the Indonesian Region, USGS Professional Paper 1078.
- Hayes, G. P., D. J. Wald, and R. L. Johnson (2012), Slab1.0: A three-dimensional model of global subduction zone geometries, J. Geophys. Res., 117, B01302, doi:10.1029/2011JB008524.
- Holm, R. and Richards, S.W., 2013. A re-evaluation of arc-continent collision and along-arc variation in the Bismarck Sea region, Papua New Guinea in Australian Journal of Earth Sciences, v. 60, p. 605-619.
- Holm, R.J., Richards, S.W., Rosenbaum, G., and Spandler, C., 2015. Disparate Tectonic Settings for Mineralisation in an Active Arc, Eastern Papua New Guinea and the Solomon Islands in proceedings from PACRIM 2015 Congress, Hong Kong ,18-21 March, 2015, pp. 7.
- Holm, R.J., Rosenbaum, G, and Richards, S.W., 2016. Post 8 Ma reconstruction of Papua New Guinea and Solomon Islands: Microplate tectonics in a convergent plate boundary setting in Earth-Science Reviews, v. 156, pp. 66-81.
- Johnson, R.W., 1976, Late Cainozoic volcanism and plate tectonics at the southern margin of the Bismarck Sea, Papua New Guinea, in Johnson, R.W., ed., 1976, Volcanism in Australia: Amsterdam, Elsevier, p. 101-116
- Lay, T., and Kanamori, H., 1980, Earthquake doublets in the Solomon Islands: Physics of the Earth and Planetary Interiors, v. 21, p. 283-304.
- Schwartz, S.Y., 1999, Noncharacteristic behavior and complex recurrence of large subduction zone earthquakes: Journal of Geophysical Research, v. 104, p. 23,111-123,125.
- Schwartz, S.Y., Lay, T., and Ruff, L.J., 1989, Source process of the great 1971 Solomon Islands doublet: Physics of the Earth and Planetary Interiors, v. 56, p. 294-310.
- Tregoning, P., McQueen, H., Lambeck, K., Jackson, R. Little, T., Saunders, S., and Rosa, R., 2000. Present-day crustal motion in Papua New Guinea, Earth Planets and Space, v. 52, pp. 727-730.
- USGS, 2007. Preliminary Analysis of the April 2007 Solomon Islands Tsunami, Southwest Pacific Ocean
References:
Basic & General References
Specific References
Return to the Earthquake Reports page.
- Sorted by Magnitude
- Sorted by Year
- Sorted by Day of the Year
- Sorted By Region