I was travelling to southern California to attend the annual meeting for the Southern California Earthquake Center. This was the first in person meeting since 2019, my first SCEC meeting. I had landed and was waiting for the luggage to arrive when I saw the CSEM earthquake app notification that there was a large earthquake in Papua New Guinea (PNG).
I put together a quick tweet before anything was posted on the USGS earthquake page other than the location and depth.
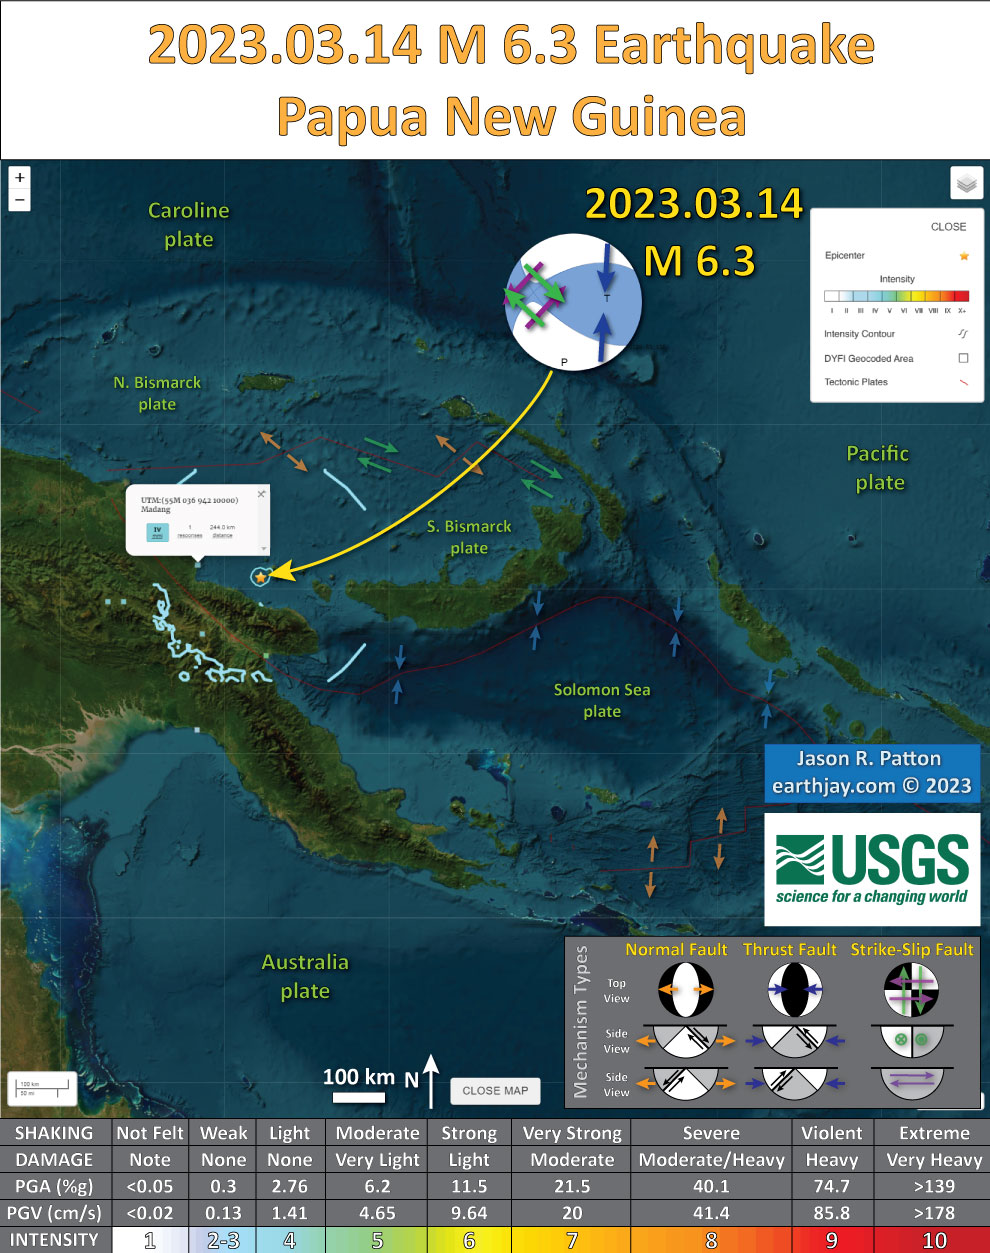
When I got to my hotel room later, more information was up.
However, due to some problems with Dreamhost (my website hosting company), I am migrating to a different company. For a little while, parts of this website (like the links and the images) will be non-functional. I will not be using Dreamhost again. I don’t have any more to say about this since they have not returned any of my emails in over a week, basically abandoning my website in the middle of the night without any warning.
https://earthquake.usgs.gov/earthquakes/eventpage/us6000iitd/executive
The depth increased to about 90 km and has a normal-oblique sense of motion. This means that the earthquake was the result of a combination of extension (stretching) and strike-slip.
This area is a complicated region from a tectonic perspective. There are old faults and old plate boundaries that may no longer be active and there are known active faults that juxtapose these older structures.
For example, there is a convergent (moving together) plate boundary fault system on the north side of Papua New Guinea. This ‘subduction zone’ formed a deep sea trench called the New Guinea trench, where the Caroline plate subducted south beneath Papua New Guinea. This plate boundary fault system is thought to be inactive on the west side of the island and active, but with a slow convergence rate, on the eastern side of the island.
Then, to the southeast of PNG, there is a deep sea trench formed by the subduction of the Australia plate diving to the north beneath the island. This fault is inactive offshore and turns into the Papua fold and thrust belt (PFTB) onshore. The PFTB onshore is inactive in the western part of the island and has a slow convergence rate on the eastern side of the island. On 25 February 2018 there was a M 7.5 earthquake associated with the PFTB. Here is the earthquake report for that earthquake.
Between these two subduction zones, that dip in opposite directions, are several large strike-slip fault systems, which also have varying levels of activity.
“Yesterday’s” M 7.6 occurred in one of the plates that is/was being subducted. It was probably in the Australia plate that dives beneath PNG (which is responsible for the PFTB).
I updated this page a bit on 13 March 2023 and make some corrections. I note these changes below.
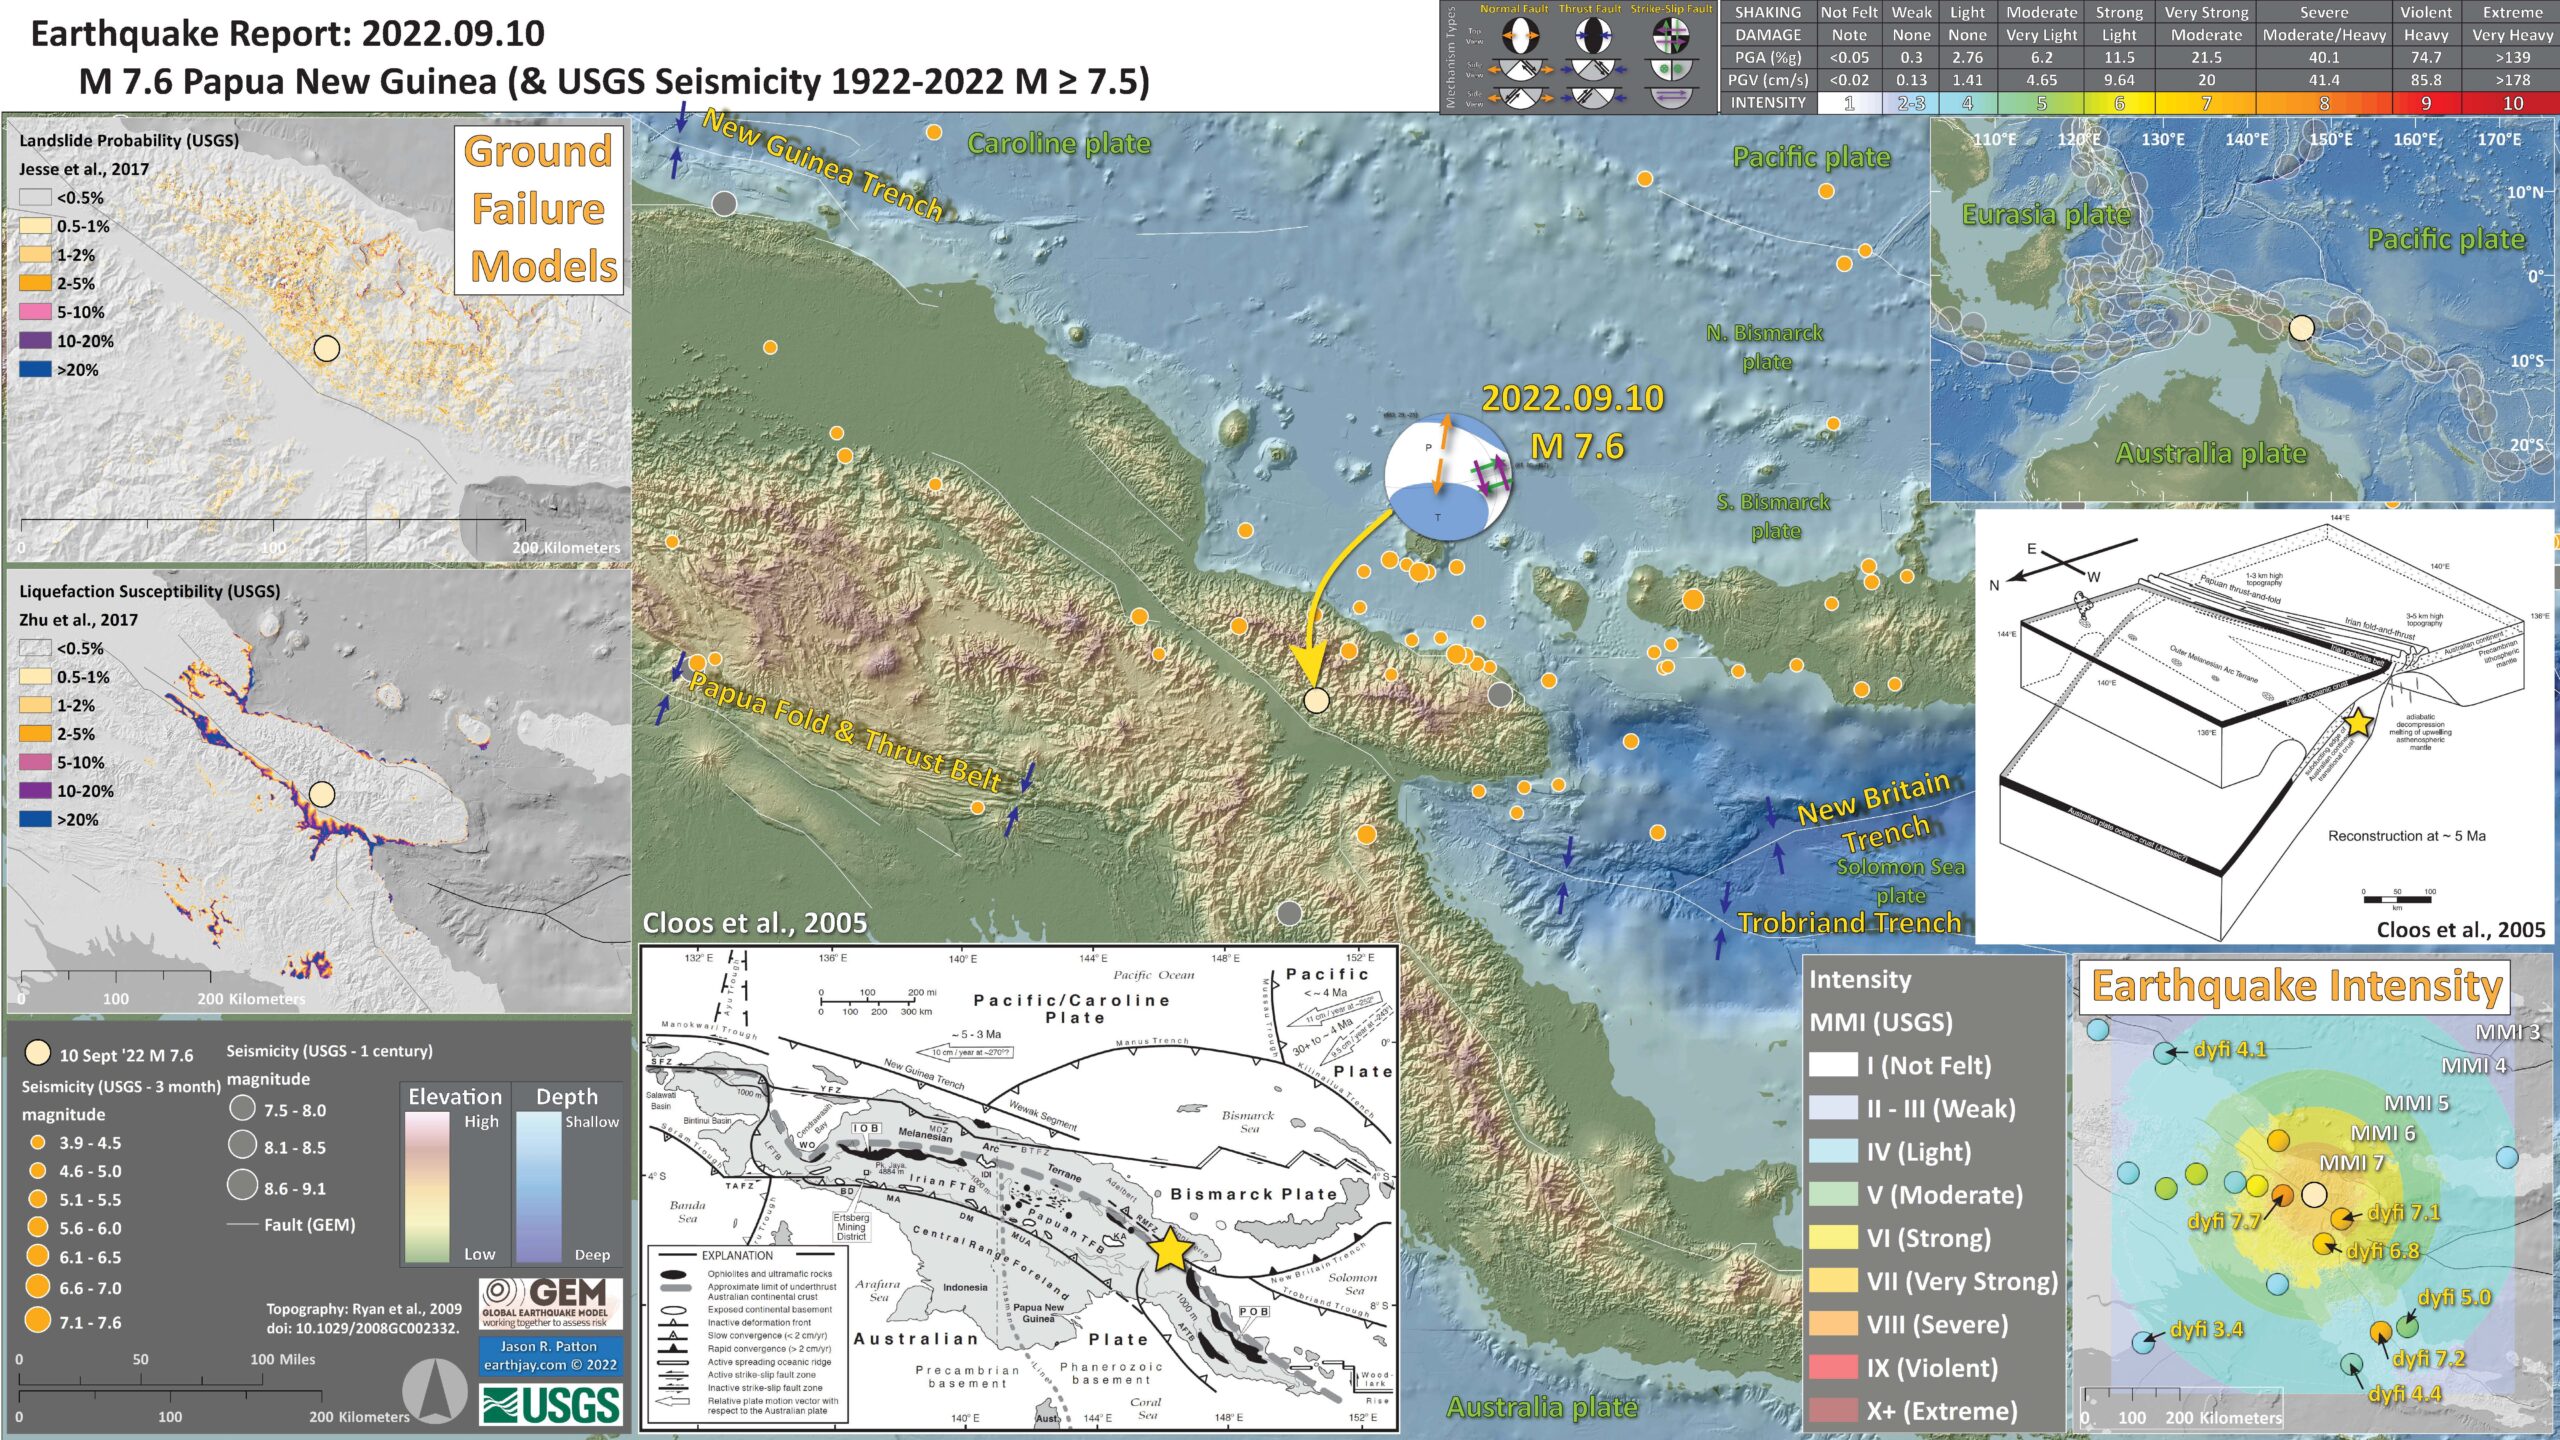
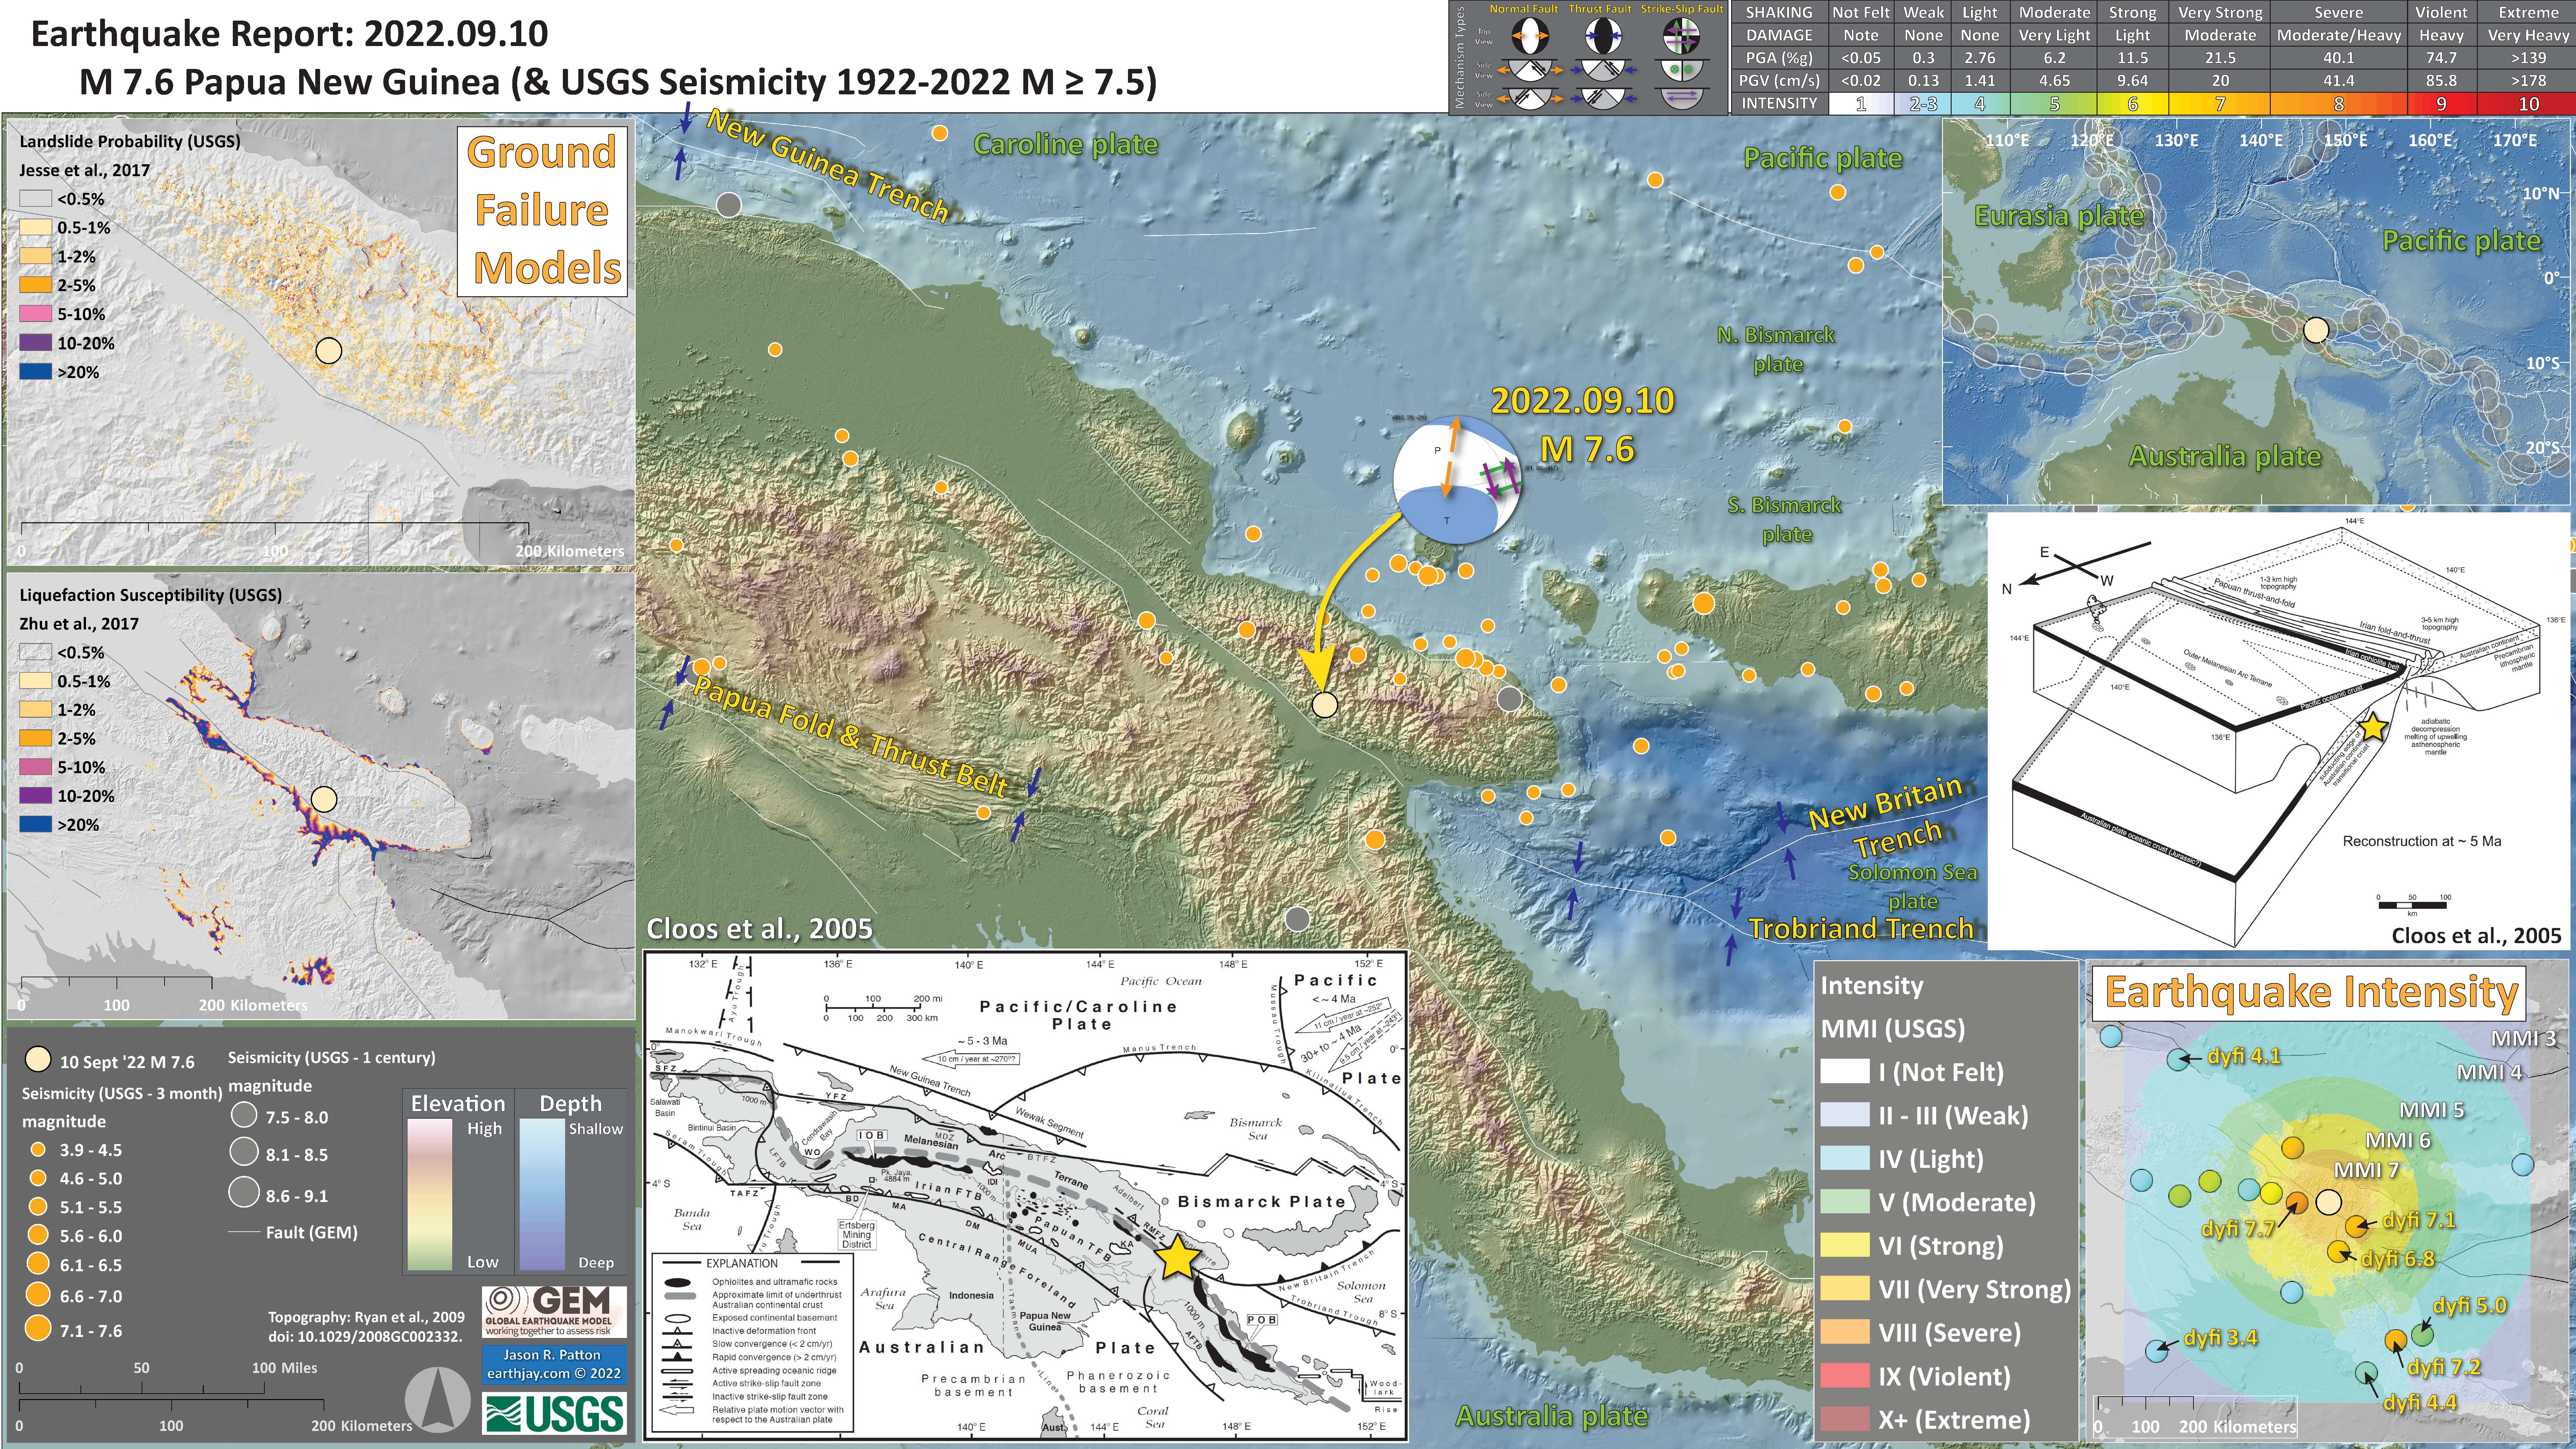
Below is my interpretive poster for this earthquake
- I plot the seismicity from the past month, with diameter representing magnitude (see legend). I include earthquake epicenters from 1920-2020 with magnitudes M ≥ 3.0 in one version.
- I plot the USGS fault plane solutions (moment tensors in blue and focal mechanisms in orange), possibly in addition to some relevant historic earthquakes.
- A review of the basic base map variations and data that I use for the interpretive posters can be found on the Earthquake Reports page. I have improved these posters over time and some of this background information applies to the older posters.
- Some basic fundamentals of earthquake geology and plate tectonics can be found on the Earthquake Plate Tectonic Fundamentals page.
- In the lower right corner is a map that shows the earthquake intensity using the modified Mercalli intensity scale. Earthquake intensity is a measure of how strongly the Earth shakes during an earthquake, so gets smaller the further away one is from the earthquake epicenter. The map colors represent a model of what the intensity may be. The USGS has a system called “Did You Feel It?” (DYFI) where people enter their observations from the earthquake and the USGS calculates what the intensity was for that person. The dots with yellow labels show what people actually felt in those different locations.
- In the lower left center, there is a plate tectonic map showing the tectonic plates and their boundaries (Cloos et al., 2005). I place a yellow star in the general location of this M 7.6 earthquake.
- On the right, above the intensity map, is a low angle oblique view of the tectonic plate configuration from Cloos et al. (2005). This shows how the Australia plate may be oriented and I place a yellow star to show how the earthquake may be located within the plate (the “slab”).
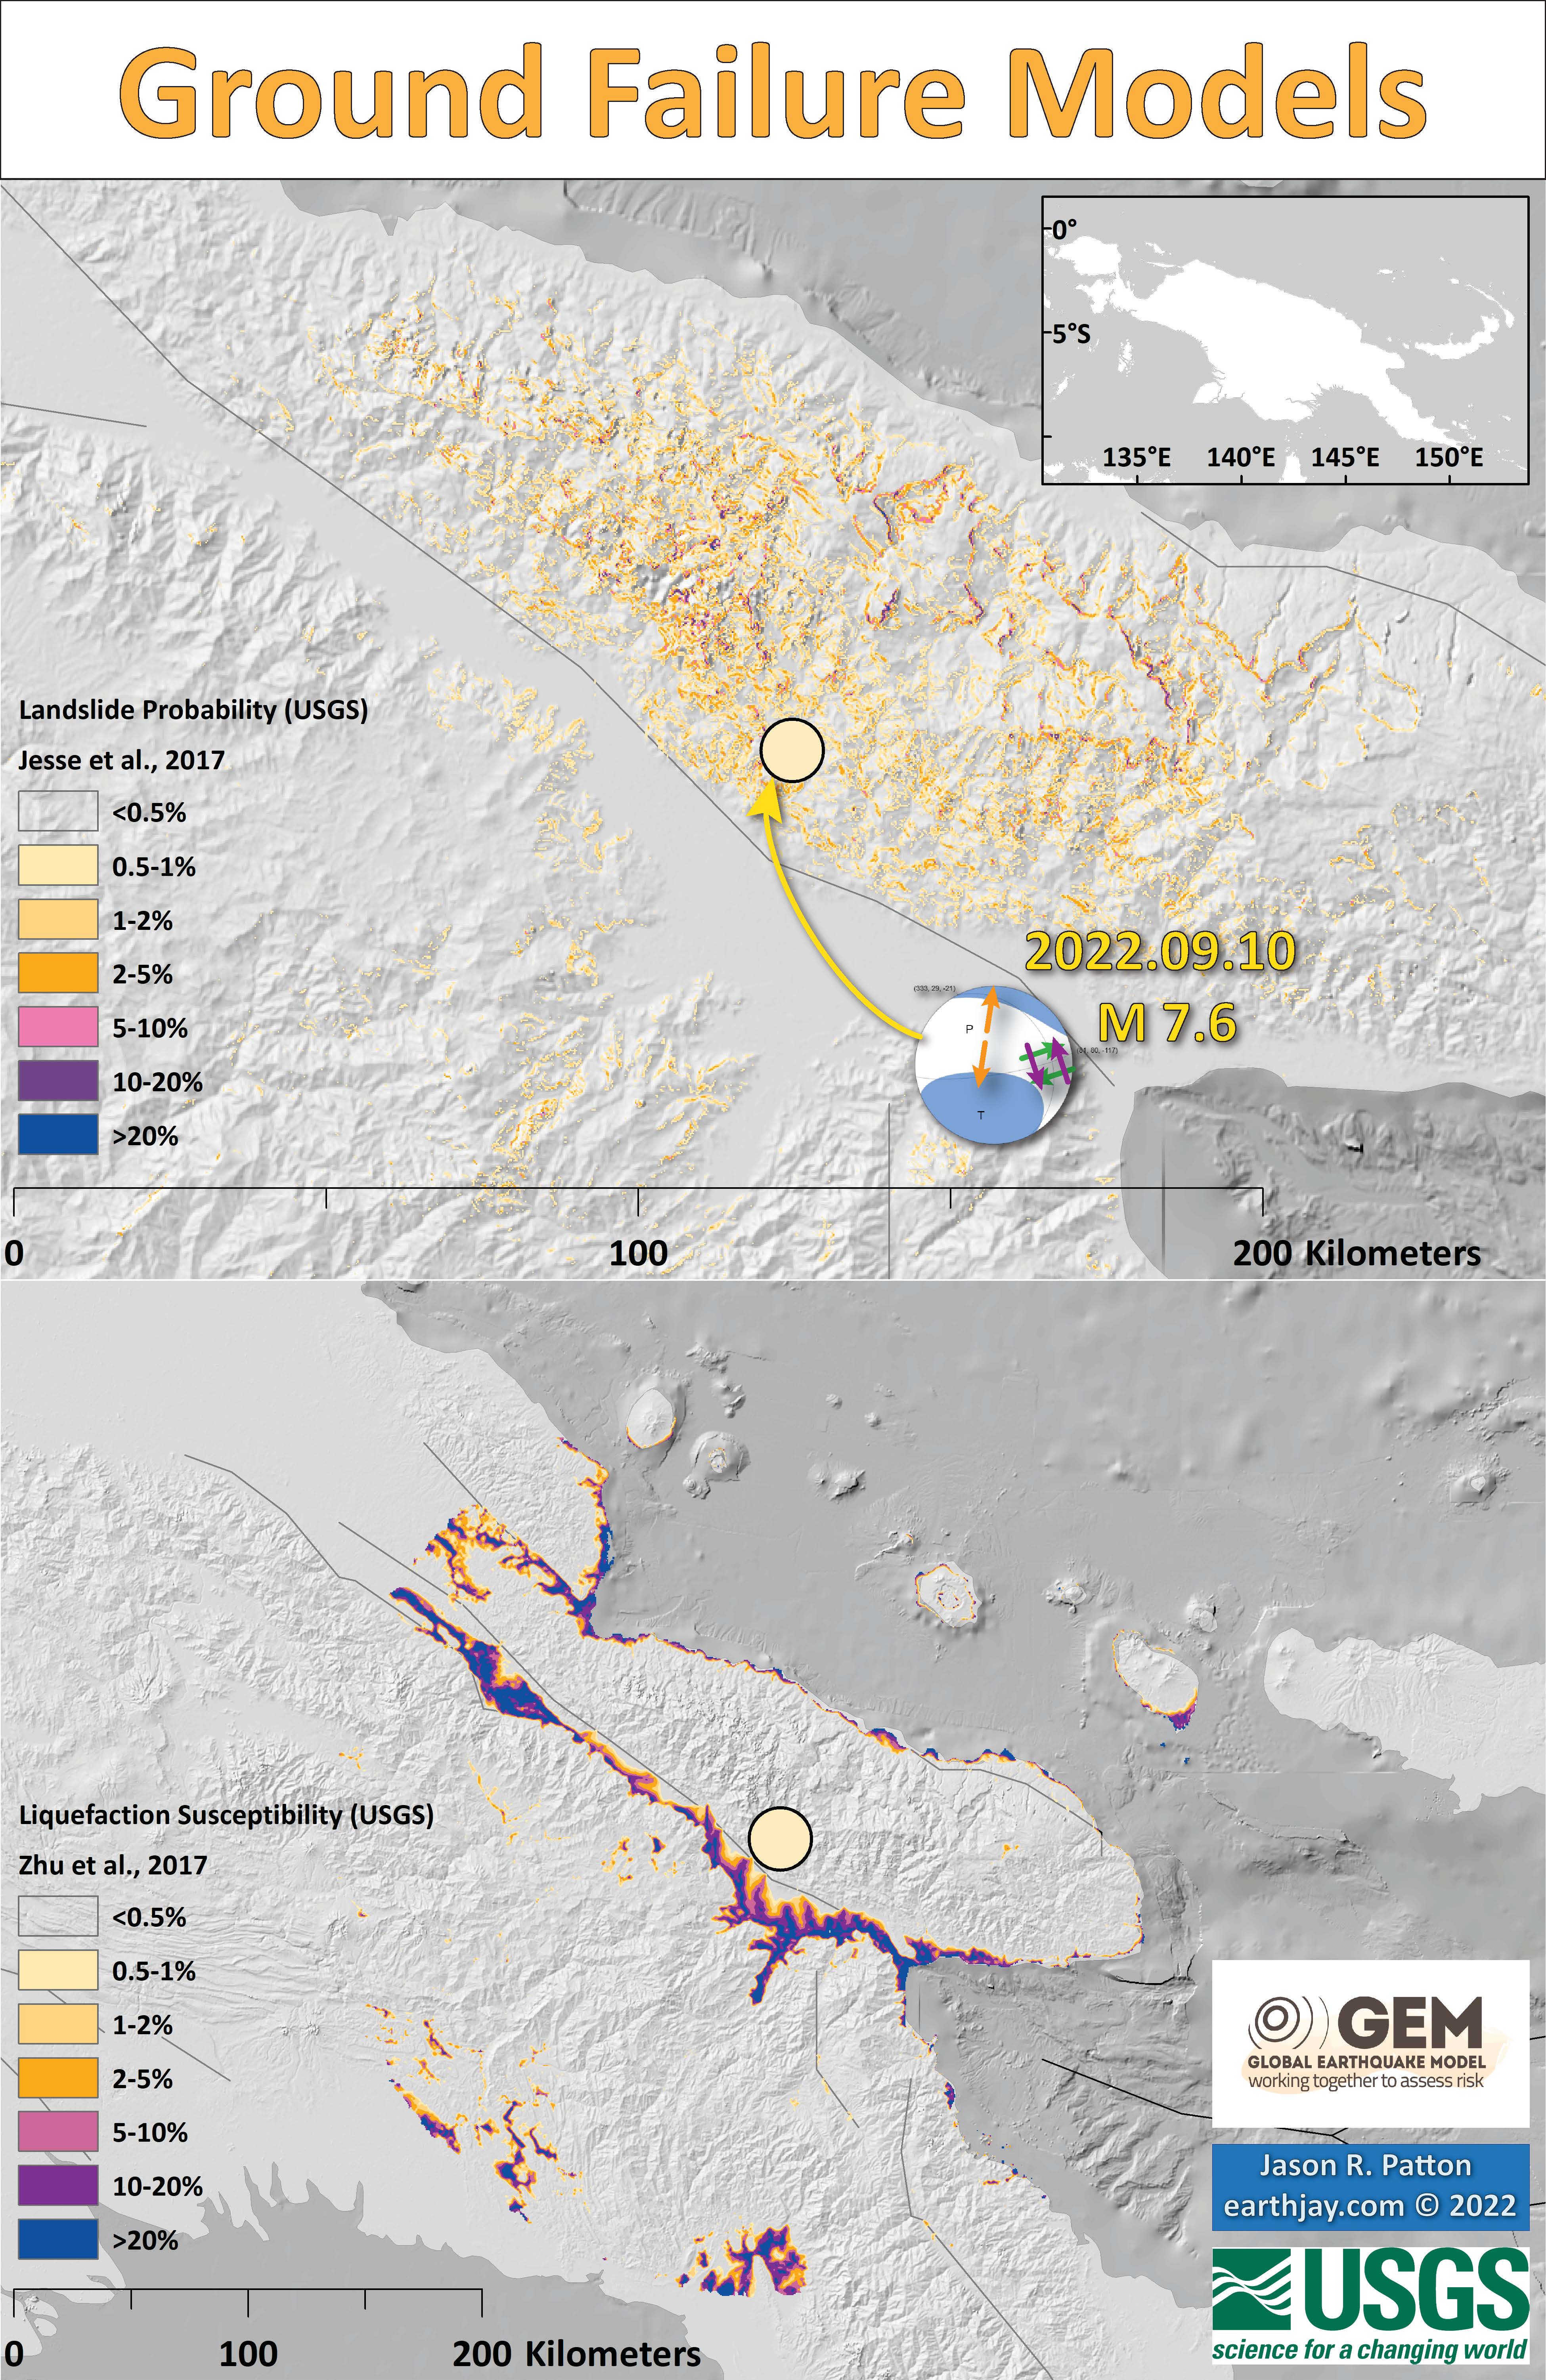
- In the upper left corner are two maps showing the probability of earthquake triggered landslides and possibility of earthquake induced liquefaction. I will describe these phenomena below.
I include some inset figures. Some of the same figures are located in different places on the larger scale map below.
- Here is the map with 3 month’s seismicity plotted.
Other Report Pages
Some Relevant Discussion and Figures
- Here is the Holm et al. (2016) figure, showing the major plate boundary faults (symbols tell us which plate boundaries are no longer active: dark symbols = active, hollow symbols = inactive).

Topography, bathymetry and regional tectonic setting of New Guinea and Solomon Islands. Arrows indicate rate and direction of plate motion of the Australian and Pacific plates (MORVEL, DeMets et al., 2010); Mamberamo thrust belt, Indonesia (MTB); North Fiji Basin (NFB)
- This is the Cloos et al. (2005) map from the poster.

Tectonic map of New Guinea, adapted from Hamilton (1979), Cooper and Taylor (1987), Dow et al. (1988), and Sapiie et al. (1999). AFTB—Aure fold and thrust belt, FTB—fold-and-thrust belt, IOB—Irian Ophiolite Belt, TFB—thrust-and-fold belt, POB—Papuan Ophiolite Belt, BTFZ—Bewani-Torricelli fault zone, MDZ—Mamberamo deformation zone, YFZ—Yapen fault zone, SFZ—Sorong fault zone, WO—Weyland overthrust. Continental basement exposures are concentrated along the southern fl ank of the Central Range: BD—Baupo Dome, MA—Mapenduma anticline, DM—Digul monocline, IDI—Idenberg Inlier, MUA—Mueller anticline, KA—Kubor anticline, LFTB—Legguru fold-and-thrust belt, RMFZ—Ramu-Markham fault zone, TAFZ—Tarera-Aiduna fault zone. The Tasman line separates continental crust that is Paleozoic and younger to the east from Precambrian to the west.
- This is the Cloos et al. (2005) cross section, showing a different interpretation of the delaminated slab.

Lithospheric-scale cross section at 2 Ma. Plate motion is now focused along the Yapen fault zone in the center of the recently extinct arc. This probably occurred because this zone of weakness had a trend that could accommodate the imposed movements as the corner of the Caroline microplate ruptured, forming the Bismarck plate, and the corner of the Australian plate ruptured, forming the Solomon microplate. The collisional delamination-generated magmatic event ends in the highlands as the lower crustal magma chamber solidifies. Upwelled asthenosphere cools and transforms into lithospheric mantle. This drives a slow regional subsidence of the highlands that will continue for tens of millions of years or until other plate-tectonic movements are initiated. Deep erosion is still concentrated on the fl anks of the mountain belt. RMB—Ruffaer Metamorphic Belt, AUS—Australian plate, PAC—Pacific plate.
- Here is the tectonic map figure from Sappie and Cloos (2004). Their work was focused on western PNG, so their interpretations are more detailed there (and perhaps less relevant for us for these eastern PNG earthquakes).

Seismotectonic interpretation of New Guinea. Tectonic features: PTFB—Papuan thrust-and-fold belt; RMFZ—Ramu-Markham fault zone; BTFZ—Bewani-Torricelli fault zone; MTFB—Mamberamo thrust-and-fold belt; SFZ—Sorong fault zone; YFZ—Yapen fault zone; RFZ—Ransiki fault zone; TAFZ—Tarera-Aiduna fault zone; WT—Waipona Trough. After Sapiie et al. (1999).
- This is the two panel figure from Holm and Richards (2013) that shows how the New Britain trench megathrust splays into three thrust faults as this fault system heads onto PNG. They plot active thrust faults as black triangles (with the triangles on the hanging wall side of the fault) and inactive thrust faults as open triangles. So, either the NG trench subduction zone extends further east than is presented in earlier work or the Bundi Fault Zone is the fault associated with this deep seismicity.
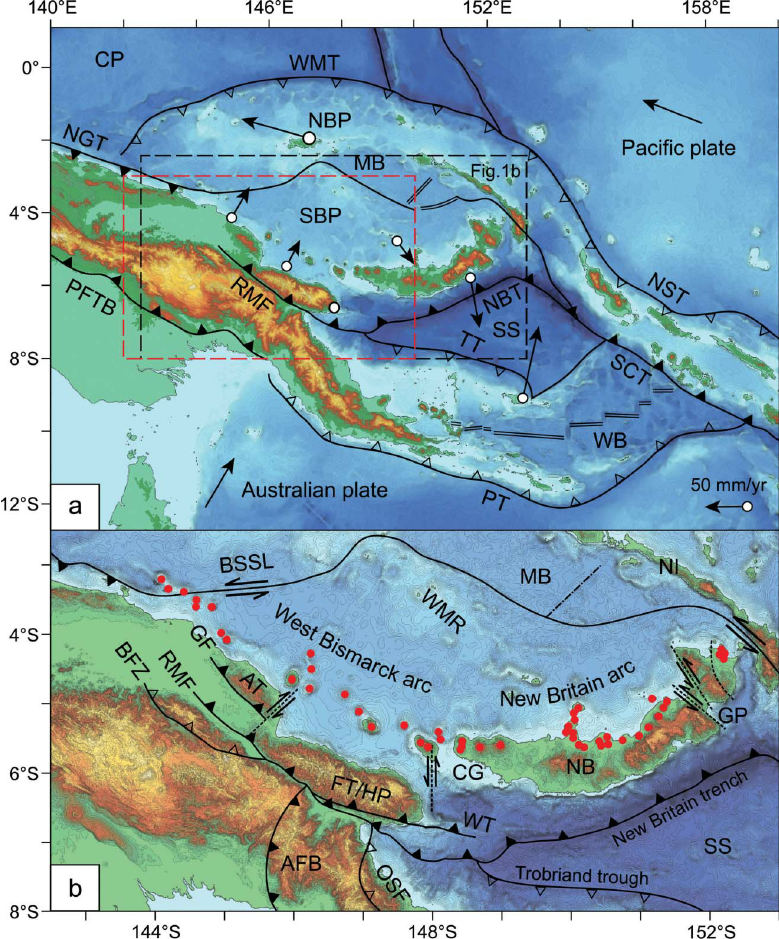
Topography, bathymetry and major tectonic elements of the study area. (a) Major tectonic boundaries of Papua New Guinea and the western Solomon Islands; CP, Caroline plate; MB, Manus Basin; NBP, North Bismarck plate; NBT, New Britain trench; NGT, New Guinea trench; NST, North Solomon trench; PFTB, Papuan Fold and Thrust Belt; PT, Pocklington trough; RMF, Ramu-Markham Fault; SBP, South Bismarck plate; SCT, San Cristobal trench; SS, Solomon Sea plate; TT, Trobriand trough; WB,Woodlark Basin; WMT,West Melanesian trench. Study area is indicated by rectangle labelled Figure 1b; the other inset rectangle highlights location for subsequent figures. Present day GPS motions of plates are indicated relative to the Australian plate (from Tregoning et al. 1998, 1999; Tregoning 2002; Wallace et al. 2004). (b) Detailed topography, bathymetry and structural elements significant to the South Bismarck region (terms not in common use are referenced); AFB, Aure Fold Belt (Davies 2012); AT, Adelbert Terrane (e.g. Wallace et al. 2004); BFZ, Bundi Fault Zone (Abbott 1995); BSSL, Bismarck Sea Seismic Lineation; CG, Cape Gloucester; FT, Finisterre Terrane; GF, Gogol Fault (Abbott 1995); GP, Gazelle Peninsula; HP, Huon Peninsula; MB, Manus Basin; NB, New Britain; NI, New Ireland; OSF, Owen Stanley Fault; RMF, Ramu-Markham Fault; SS, Solomon Sea; WMR, Willaumez-Manus Rise (Johnson et al. 1979); WT, Wonga Thrust (Abbott et al. 1994); minor strike-slip faults are shown adjacent to Huon Peninsula (Abers & McCaffrey 1994) and in east New Britain, the Gazelle Peninsula (e.g. Madsen & Lindley 1994). Circles indicate centres of Quaternary volcanism of the Bismarck arc. Filled triangles indicate active thrusting or subduction, empty triangles indicate extinct or negligible thrusting or subduction.
- Here is the slab interpretation for the New Britain region from Holm and Richards, 2013. I include the figure caption below as a blockquote.
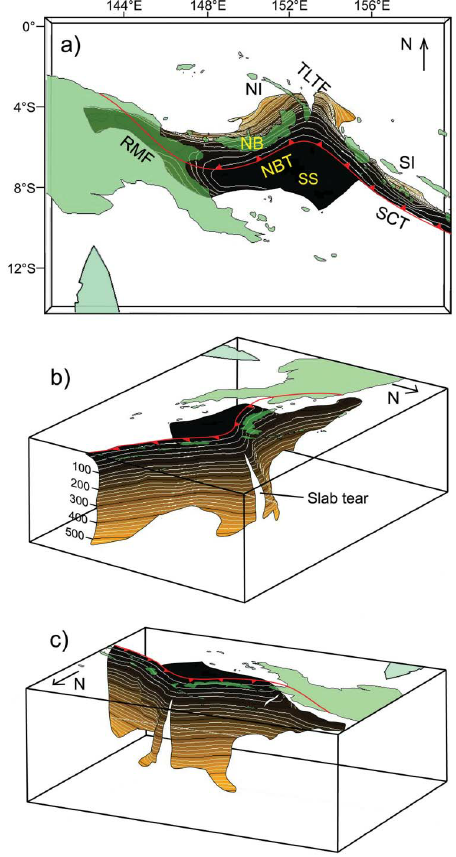
3-D model of the Solomon slab comprising the subducted Solomon Sea plate, and associated crust of the Woodlark Basin and Australian plate subducted at the New Britain and San Cristobal trenches. Depth is in kilometres; the top surface of the slab is contoured at 20 km intervals from the Earth’s surface (black) to termination of slabrelated seismicity at approximately 550 km depth (light brown). Red line indicates the locations of the Ramu-Markham Fault (RMF)–New Britain trench (NBT)–San Cristobal trench (SCT); other major structures are removed for clarity; NB, New Britain; NI, New Ireland; SI, Solomon Islands; SS, Solomon Sea; TLTF, Tabar–Lihir–Tanga–Feni arc. See text for details.
- Here are the forward models for the slab in the New Britain region from Holm and Richards, 2013. I include the figure caption below as a blockquote.
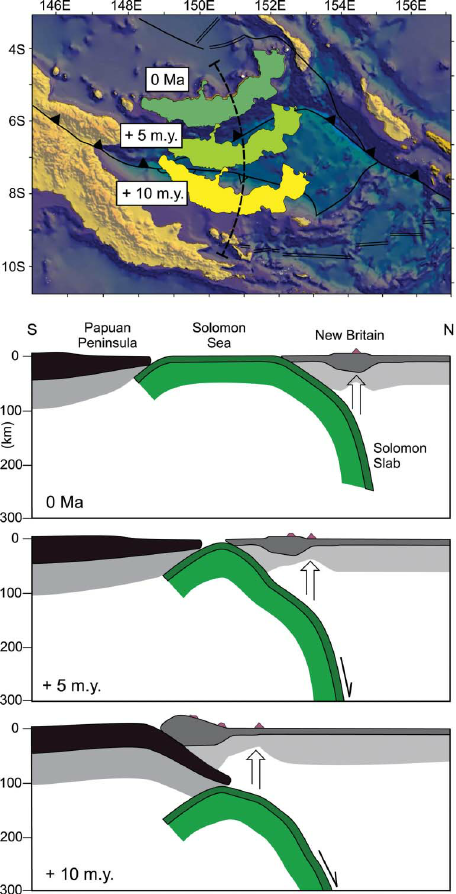
Forward tectonic reconstruction of progressive arc collision and accretion of New Britain to the Papua New Guinea margin. (a) Schematic forward reconstruction of New Britain relative to Papua New Guinea assuming continued northward motion of the Australian plate and clockwise rotation of the South Bismarck plate. (b) Cross-sections illustrate a conceptual interpretation of collision between New Britain and Papua New Guinea.
UPDATE: 2023.03.13
- Today (13 March 2023) there was an M 6.3 earthquake that made me look back at this M 7.6 event.
- This area is interesting, in how there are relict plate boundaries surrounded by active ones. The maps shown above make that clear.
- The series of figures that I want to add are from Holm et al. (2015). They have some excellent cross sections that show their interpretation of the evolution of the plate boundary between the Australia and Pacific plates (including the Bismarck plates as well).
- Holm et al. (2015) use radiometric ages and geochemical analysis of the rocks in the region to show that there was once a subduction zone, followed by a collision zone, slab foundering, all leading to the existing configuration.
- This first figure shows (b) the plate boundary faults and topography, (a) their study area and the magmatic arc geology and geochronology, and (c) a large scale map showing their study sites.
- This second figure shows their interpretation of the evolution for this plate boundary in cross sectional view.
- Time spans 15 million years. The most important figure in this entire report is this one, particularly the lowest panel.
- The lowest panel shows how there are three plates atop each other and this 7.6 is somewhere within this stack of plates. (Same for the 13 March 2023 earthquake)
- Here is the tweet for the 13 March 2023 M 6.3 earthquake.

Panel A: Distribution of mapped magmatic rock units (from Australian Bureau of Mineral Resources (1972)) and major tectonic boundaries of central Papua New Guinea. Published K/Ar (white boxes) and U–Pb ages (grey boxes) for Late Cenozoic magmatic rocks are from Page and McDougall (1972), Grant and Nielsen (1975), Page (1976), Whalen et al. (1982), Rogerson and Williamson (1985), Richards and McDougall (1990), and van Dongen et al. (2010). Panel B: Major tectonic elements of Papua New Guinea; Adelbert Terrane (AT); Aure trough (AuT); Bundi fault zone (BFZ); Bismarck Sea seismic lineation (BSSL); Fly Platform (FP); Finisterre Terrane (FT); Lagaip fault zone (LFZ); Manus Basin (MB); New Britain (NB); New Britain trench (NBT); New Guinea trench (NGT); North Sepik arc (NSA); Owen Stanley fault zone (OSFZ); Papuan Fold and Thrust Belt (PFTB); Papuan Peninsula (PP); Pocklington trough (PT); Ramu–Markham fault zone (RMFZ); South Bismarck plate (SBP); Solomon Sea (SS); Trobriand trough (TT);Woodlark Basin (WB). Panel C: Regional geology of the eastern Papuan Highlands (modified from Australian Bureau of Mineral Resources (1989)).
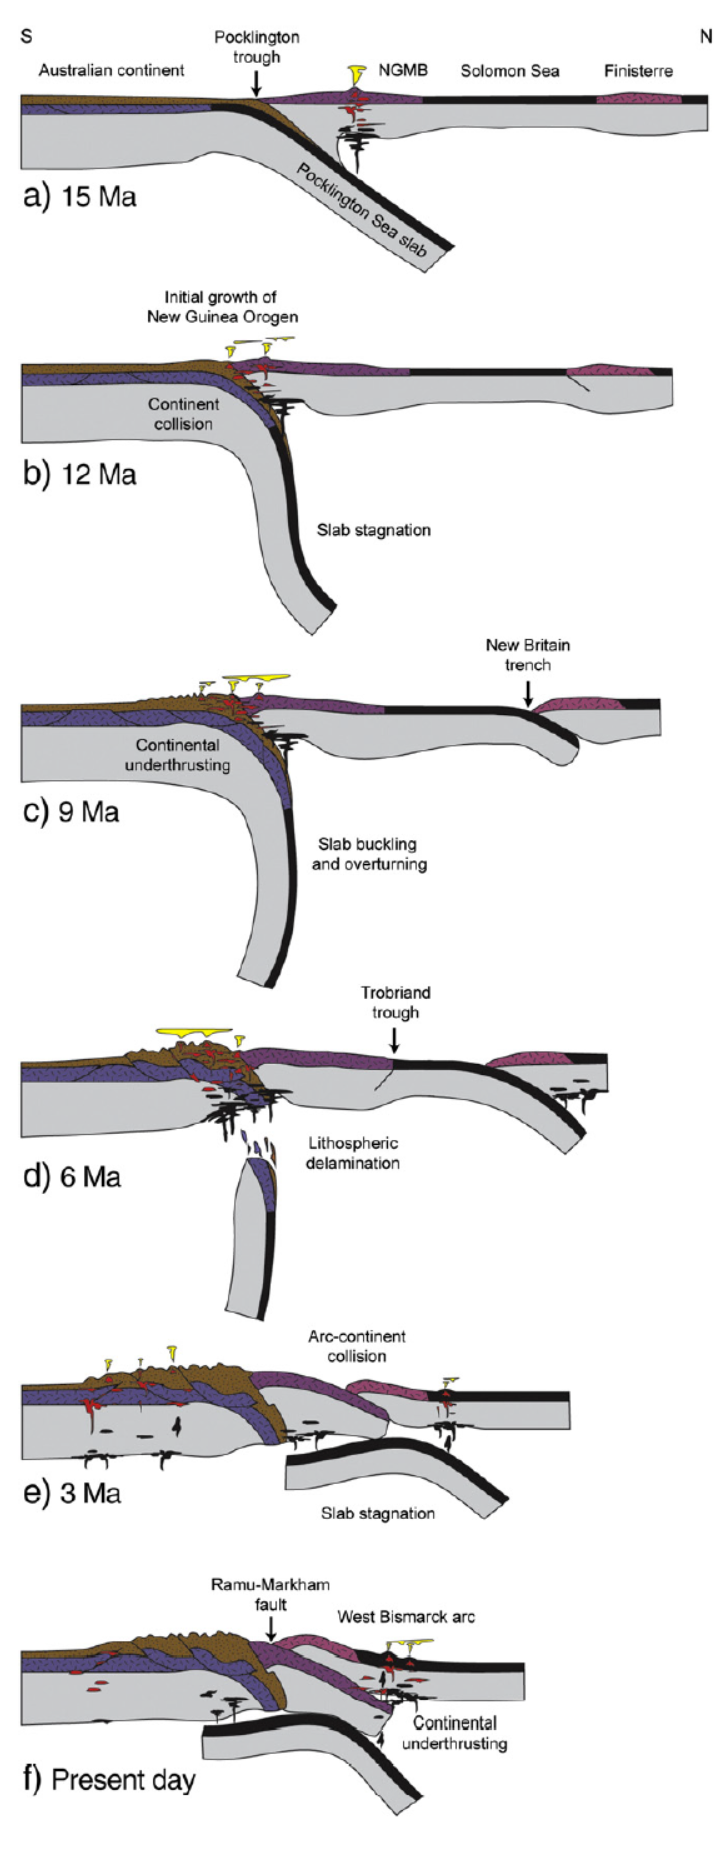
Simplified geodynamic evolution of the Maramuni arc. Time steps represent: a) north-dipping subduction of the Pocklington Sea slab at the Pocklington trough and associated magmatism of the Maramuni arc intruding the New Guinea Mobile Belt (NGMB); b) onset of continental collision and growth of the New Guinea Orogen from ca. 12 Ma as the Australian continent enters the Pocklington trough. Collision between the Australian continent and the New Guinea Mobile Belt leads to cessation of subduction at the Pocklington trough and associated foundering and steepening of the Pocklington Sea slab in the mantle; c) continued orogenesis results from convergence between the Australian continent and New Guinea Mobile Belt, associated with under thrusting of the leading Australian continental margin at the Pocklington trough. Northward motion of the Australian plate relative to the foundering Pocklington Sea slab leads to buckling and overturning of the slab. A reduction in convergence at the Pocklington trough is accommodated by initiation of north-dipping subduction of the Solomon Sea plate beneath the Finisterre Terrane; d) lithospheric delamination of the Pocklington Sea slab some 6 m.y. after continental collision results in renewed orogenesis in the New Guinea Orogen, and HREE-depleted magmatism at Kokofimpa. Subduction of the Solomon Sea plate continues at the New Britain trench but also begins to underthrust the New Guinea Mobile Belt at the Trobriand trough (Holmet al., unpublished data); e) Maramuni arc magmatism migrates southward into the Papuan Fold and Thrust Belt. Subduction of the Solomon Sea plate at the New Britain and Trobriand subduction systems results in closure of the Solomon Sea and collision and overthrusting of the Finisterre Terrane above the New Guinea Mobile Belt. Magmatism of the West Bismarck arc begins northward of the Finisterre Terrane; and f) convergence between the Finisterre Terrane and New Guinea Mobile Belt continues at the Ramu–Markham fault. Underthrusting of the New Guinea Mobile Belt beneath the Finisterre Terrane results in crustal-derived magmatism in theWest Bismarck arc. The foundered Solomon Sea slab is laterally continuous with the present day Solomon Sea plate to the east (see Fig. 1). Present day cross-section is modified from Holm and Richards (2013).
Shaking Intensity
Luckily I updated this page because I noticed that the interpretive figure below was incorrect (it was for a different earthquake).
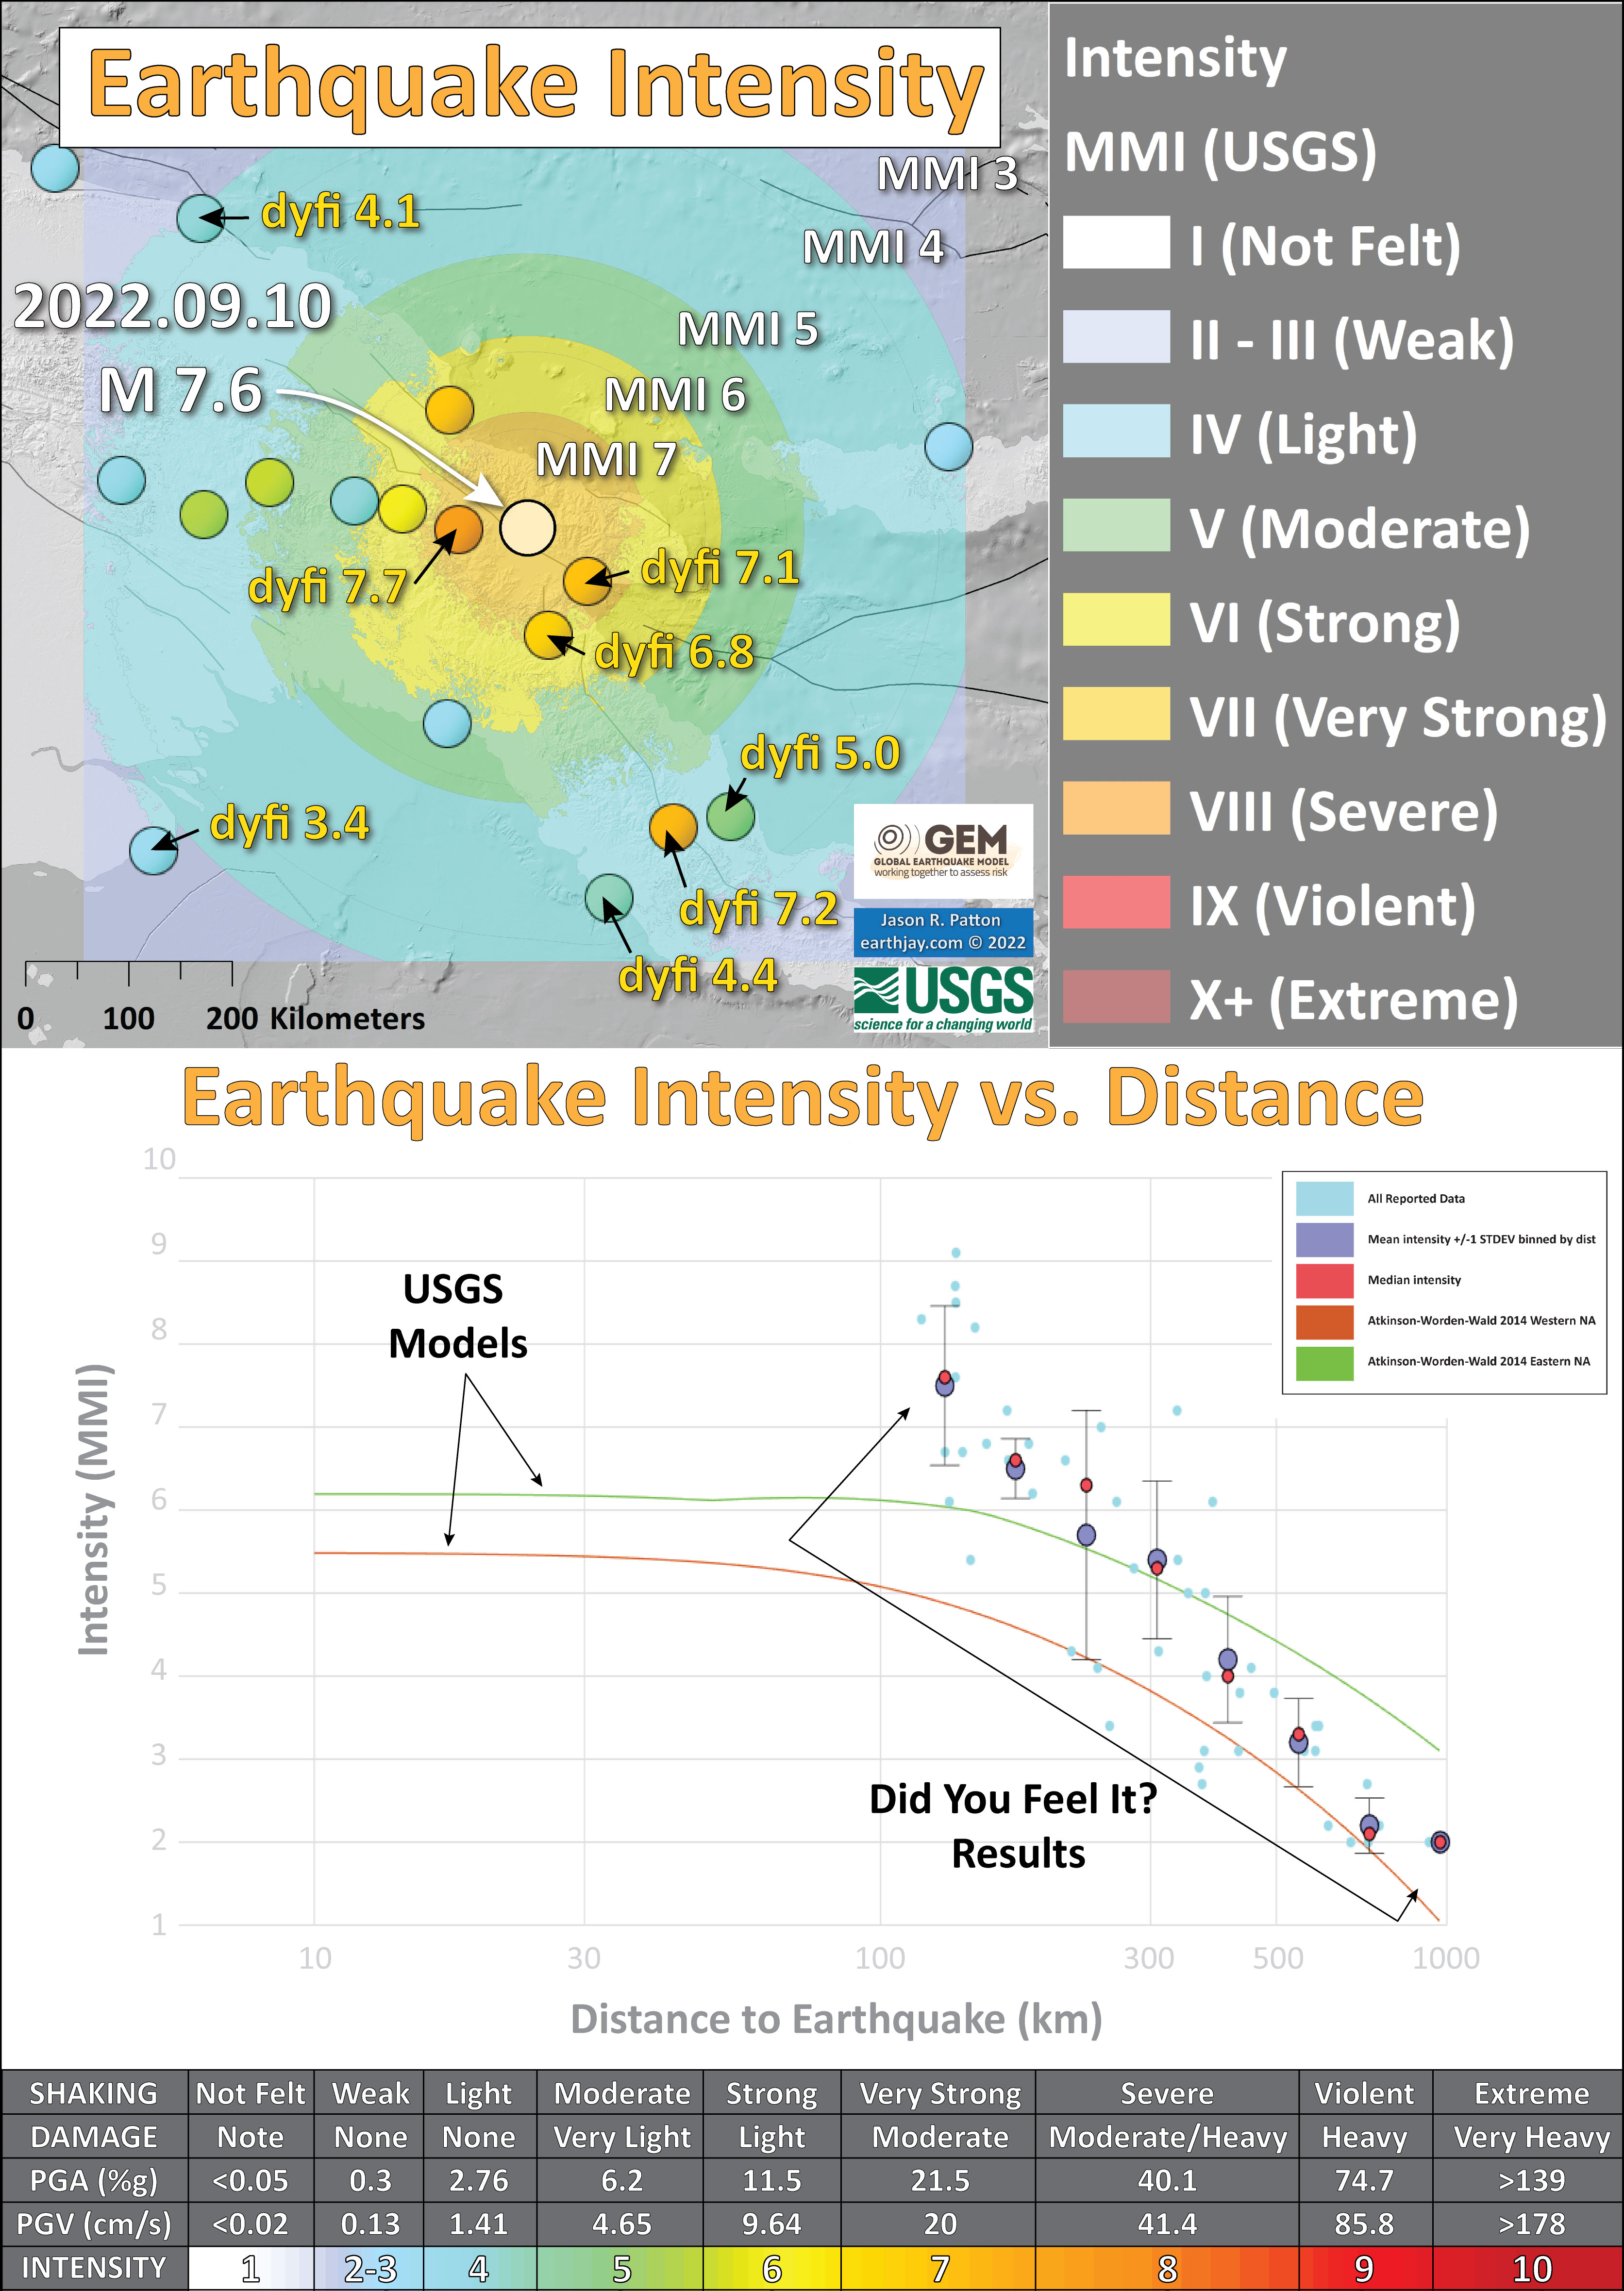
- Here is a figure that shows a more detailed comparison between the modeled intensity and the reported intensity. Both data use the same color scale, the Modified Mercalli Intensity Scale (MMI). More about this can be found here. The colors and contours on the map are results from the USGS modeled intensity. The DYFI data are plotted as colored dots (color = MMI, diameter = number of reports).
- In the upper panel is the USGS Did You Feel It reports map, showing reports as colored dots using the MMI color scale. Underlain on this map are colored areas showing the USGS modeled estimate for shaking intensity (MMI scale).
- In the lower panel is a plot showing MMI intensity (vertical axis) relative to distance from the earthquake (horizontal axis). The models are represented by the green and orange lines. The DYFI data are plotted as light blue dots. The mean and median (different types of “average”) are plotted as orange and purple dots. Note how well the reports fit the green line (the model that represents how MMI works based on quakes in California).
- Below the lower plot is the USGS MMI Intensity scale, which lists the level of damage for each level of intensity, along with approximate measures of how strongly the ground shakes at these intensities, showing levels in acceleration (Peak Ground Acceleration, PGA) and velocity (Peak Ground Velocity, PGV).
Potential for Ground Failure
Luckily I updated this page because I noticed that the interpretive figure below was incorrect (it was for a different earthquake).
- Below are a series of maps that show the potential for landslides and liquefaction. These are all USGS data products.
There are many different ways in which a landslide can be triggered. The first order relations behind slope failure (landslides) is that the “resisting” forces that are preventing slope failure (e.g. the strength of the bedrock or soil) are overcome by the “driving” forces that are pushing this land downwards (e.g. gravity). The ratio of resisting forces to driving forces is called the Factor of Safety (FOS). We can write this ratio like this:FOS = Resisting Force / Driving Force
- When FOS > 1, the slope is stable and when FOS < 1, the slope fails and we get a landslide. The illustration below shows these relations. Note how the slope angle α can take part in this ratio (the steeper the slope, the greater impact of the mass of the slope can contribute to driving forces). The real world is more complicated than the simplified illustration below.
- Landslide ground shaking can change the Factor of Safety in several ways that might increase the driving force or decrease the resisting force. Keefer (1984) studied a global data set of earthquake triggered landslides and found that larger earthquakes trigger larger and more numerous landslides across a larger area than do smaller earthquakes. Earthquakes can cause landslides because the seismic waves can cause the driving force to increase (the earthquake motions can “push” the land downwards), leading to a landslide. In addition, ground shaking can change the strength of these earth materials (a form of resisting force) with a process called liquefaction.
- Sediment or soil strength is based upon the ability for sediment particles to push against each other without moving. This is a combination of friction and the forces exerted between these particles. This is loosely what we call the “angle of internal friction.” Liquefaction is a process by which pore pressure increases cause water to push out against the sediment particles so that they are no longer touching.
- An analogy that some may be familiar with relates to a visit to the beach. When one is walking on the wet sand near the shoreline, the sand may hold the weight of our body generally pretty well. However, if we stop and vibrate our feet back and forth, this causes pore pressure to increase and we sink into the sand as the sand liquefies. Or, at least our feet sink into the sand.
- Below is a diagram showing how an increase in pore pressure can push against the sediment particles so that they are not touching any more. This allows the particles to move around and this is why our feet sink in the sand in the analogy above. This is also what changes the strength of earth materials such that a landslide can be triggered.
- Below is a diagram based upon a publication designed to educate the public about landslides and the processes that trigger them (USGS, 2004). Additional background information about landslide types can be found in Highland et al. (2008). There was a variety of landslide types that can be observed surrounding the earthquake region. So, this illustration can help people when they observing the landscape response to the earthquake whether they are using aerial imagery, photos in newspaper or website articles, or videos on social media. Will you be able to locate a landslide scarp or the toe of a landslide? This figure shows a rotational landslide, one where the land rotates along a curvilinear failure surface.
- Below is the liquefaction susceptibility and landslide probability map (Jessee et al., 2017; Zhu et al., 2017). Please head over to that report for more information about the USGS Ground Failure products (landslides and liquefaction). Basically, earthquakes shake the ground and this ground shaking can cause landslides.
- I use the same color scheme that the USGS uses on their website. Note how the areas that are more likely to have experienced earthquake induced liquefaction are in the valleys. Learn more about how the USGS prepares these model results here.


- 2022.09.10 M 7.6 Papua New Guinea
- 2021.03.04 M 8.1 Kermadec
- 2021.02.10 M 7.7 Loyalty Islands
- 2019.06.15 M 7.2 Kermadec
- 2019.05.14 M 7.5 New Ireland
- 2019.05.06 M 7.2 Papua New Guinea
- 2018.12.05 M 7.5 New Caledonia
- 2018.10.10 M 7.0 New Britain, PNG
- 2018.09.09 M 6.9 Kermadec
- 2018.08.29 M 7.1 Loyalty Islands
- 2018.08.18 M 8.2 Fiji
- 2018.03.26 M 6.9 New Britain
- 2018.03.26 M 6.6 New Britain
- 2018.03.08 M 6.8 New Ireland
- 2018.02.25 M 7.5 Papua New Guinea
- 2018.02.26 M 7.5 Papua New Guinea Update #1
- 2017.11.19 M 7.0 Loyalty Islands Update #1
- 2017.11.07 M 6.5 Papua New Guinea
- 2017.11.04 M 6.8 Tonga
- 2017.10.31 M 6.8 Loyalty Islands
- 2017.08.27 M 6.4 N. Bismarck plate
- 2017.05.09 M 6.8 Vanuatu
- 2017.03.19 M 6.0 Solomon Islands
- 2017.03.05 M 6.5 New Britain
- 2017.01.22 M 7.9 Bougainville
- 2017.01.03 M 6.9 Fiji
- 2016.12.17 M 7.9 Bougainville
- 2016.12.08 M 7.8 Solomons
- 2016.10.17 M 6.9 New Britain
- 2016.10.15 M 6.4 South Bismarck Sea
- 2016.09.14 M 6.0 Solomon Islands
- 2016.08.31 M 6.7 New Britain
- 2016.08.12 M 7.2 New Hebrides Update #2
- 2016.08.12 M 7.2 New Hebrides Update #1
- 2016.08.12 M 7.2 New Hebrides
- 2016.04.06 M 6.9 Vanuatu Update #1
- 2016.04.03 M 6.9 Vanuatu
- 2015.03.30 M 7.5 New Britain (Update #5)
- 2015.03.30 M 7.5 New Britain (Update #4)
- 2015.03.29 M 7.5 New Britain (Update #3)
- 2015.03.29 M 7.5 New Britain (Update #2)
- 2015.03.29 M 7.5 New Britain (Update #1)
- 2015.03.29 M 7.5 New Britain
- 2015.11.18 M 6.8 Solomon Islands
- 2015.05.24 M 6.8, 6.8, 6.9 Santa Cruz Islands
- 2015.05.05 M 7.5 New Britain
New Britain | Solomon | Bougainville | New Hebrides | Tonga | Kermadec Earthquake Reports
General Overview
Earthquake Reports
Social Media
#EarthquakeReport for M7.6 #Gempa #Earthquake in #PapuaNewGuinea
Strong shaking, hi chance for damage, casualties, landslides, and liquefaction
Hopefully there is not much suffering https://t.co/qv9dci3yu0 pic.twitter.com/Mc3HjtGgQS
— Jason "Jay" R. Patton (@patton_cascadia) September 11, 2022
#EarthquakeReport for M 7.6 #Gempa #Sismo #Earthquake in #PapuaNewGuinea
possibly in Australia plate slab
normal obliqueanalogous events
7 dec '89 M7.1
14 dec '11 M7.1
6 may '19 M7.1earthjay website is down as i migrate to aws away from dreamhosthttps://t.co/M8yFwXgiI2 pic.twitter.com/EFSqVdTKKM
— Jason "Jay" R. Patton (@patton_cascadia) September 11, 2022
— Jason "Jay" R. Patton (@patton_cascadia) September 11, 2022
Hoping Kainantu is OK. Scenes from Madang #earthquake pic.twitter.com/NH5oTsabHI
— Chakriya Bowman (@CIPRD) September 11, 2022
🏚FUERTE #SISMO Mw7.7 con epicentro a #Morobe, #PapuaNuevaGuinea 🇵🇬 (ocurrió el 10-septiembre-2022 18:46 hrs EST) fue registrado por mi estación AM.#R69E9 ubicada en #Veraguas, #Panamá 🇵🇦
🔸Intensidad MMI: IX (Extremo)
🔸Profundidad: 61 km
🔸Distancia: 14772 (epicentro-estación) pic.twitter.com/8EVKmCIHT1— Monitoreo Sísmico JP 🇵🇦 (@monitoreojp) September 11, 2022
About ~15 mins ago, a M7.5 near Lae, Papua New Guinea, as recorded by the @AusQuake seismograph network in southeast Australia. Reportedly at a depth of ~100 km. pic.twitter.com/SnY8WbXNeI
— Dr. Dee Ninis (@DeeNinis) September 11, 2022
The waves from the M7.6 Papua New Guinea earthquake are rolling under the east coast of the US right now. (The timing makes the trace kind of hard to see.) Images from @IRIS_EPO Station Monitor. https://t.co/UGVApJ6xpu pic.twitter.com/QSMxw4mpmz
— Wendy Bohon, PhD 🌏 (@DrWendyRocks) September 11, 2022
Mw=7.7, EASTERN NEW GUINEA REG., P.N.G. (Depth: 39 km), 2022/09/10 23:46:55 UTC – Full details here: https://t.co/b2drScMokg pic.twitter.com/t1empyuII5
— Earthquakes (@geoscope_ipgp) September 11, 2022
The IRIS Earthquake Browser shows the distribution of earthquakes that have occurred near this Magnitude 7.6 earthquake in Papau New Guinea
➡️https://t.co/fhm2uyCHNW pic.twitter.com/d0eVSgZUQq
— IRIS Earthquake Sci (@IRIS_EPO) September 11, 2022
A dormitory building at the University of Goroka suffered moderate damage to what appears to be decorative awnings & some wall spalling & parapet collapse. Overall building seems intact, but LOTS of falling debris that could hurt or kill someone below. #PNG #earthquake pic.twitter.com/0tZCN3qA36
— Brian Olson (@mrbrianolson) September 11, 2022
🇵🇬| Papua New Guinea – Registro desde una camara de seguridad del evento sismico Mw7.7
•Creditos Respectivos
•No se sabe localizacion precisa (Probablemente Madang)
–#Sismo #Temblor #Earthquake pic.twitter.com/Rq67oUONGU— Seba Sismos CL (@Seba_Sismos_CL) September 11, 2022
— Elior Cohen (@Elior_C_E) September 11, 2022
#Helicopter in an #Earthquake near #Lae PNG this morning. 7.6 Magnitude pic.twitter.com/MYyi9tDetu
— David Bennet (@bennetdg5454) September 11, 2022
Watch the waves from the M7.6 earthquake in Papua New Guinea roll across seismic stations in North America.
🎥 https://t.co/yHxbrJ92kh pic.twitter.com/P4mS7M1N4k
— IRIS Earthquake Sci (@IRIS_EPO) September 11, 2022
View a visual explainer and more videos like this on our TikTok, Terra Explore https://t.co/tSbAKZfjif pic.twitter.com/B7pJGCRdwZ
— IRIS Earthquake Sci (@IRIS_EPO) September 11, 2022
- Frisch, W., Meschede, M., Blakey, R., 2011. Plate Tectonics, Springer-Verlag, London, 213 pp.
- Hayes, G., 2018, Slab2 – A Comprehensive Subduction Zone Geometry Model: U.S. Geological Survey data release, https://doi.org/10.5066/F7PV6JNV.
- Holt, W. E., C. Kreemer, A. J. Haines, L. Estey, C. Meertens, G. Blewitt, and D. Lavallee (2005), Project helps constrain continental dynamics and seismic hazards, Eos Trans. AGU, 86(41), 383–387, , https://doi.org/10.1029/2005EO410002. /li>
- Jessee, M.A.N., Hamburger, M. W., Allstadt, K., Wald, D. J., Robeson, S. M., Tanyas, H., et al. (2018). A global empirical model for near-real-time assessment of seismically induced landslides. Journal of Geophysical Research: Earth Surface, 123, 1835–1859. https://doi.org/10.1029/2017JF004494
- Kreemer, C., J. Haines, W. Holt, G. Blewitt, and D. Lavallee (2000), On the determination of a global strain rate model, Geophys. J. Int., 52(10), 765–770.
- Kreemer, C., W. E. Holt, and A. J. Haines (2003), An integrated global model of present-day plate motions and plate boundary deformation, Geophys. J. Int., 154(1), 8–34, , https://doi.org/10.1046/j.1365-246X.2003.01917.x.
- Kreemer, C., G. Blewitt, E.C. Klein, 2014. A geodetic plate motion and Global Strain Rate Model in Geochemistry, Geophysics, Geosystems, v. 15, p. 3849-3889, https://doi.org/10.1002/2014GC005407.
- Meyer, B., Saltus, R., Chulliat, a., 2017. EMAG2: Earth Magnetic Anomaly Grid (2-arc-minute resolution) Version 3. National Centers for Environmental Information, NOAA. Model. https://doi.org/10.7289/V5H70CVX
- Müller, R.D., Sdrolias, M., Gaina, C. and Roest, W.R., 2008, Age spreading rates and spreading asymmetry of the world’s ocean crust in Geochemistry, Geophysics, Geosystems, 9, Q04006, https://doi.org/10.1029/2007GC001743
- Pagani,M. , J. Garcia-Pelaez, R. Gee, K. Johnson, V. Poggi, R. Styron, G. Weatherill, M. Simionato, D. Viganò, L. Danciu, D. Monelli (2018). Global Earthquake Model (GEM) Seismic Hazard Map (version 2018.1 – December 2018), DOI: 10.13117/GEM-GLOBAL-SEISMIC-HAZARD-MAP-2018.1
- Silva, V ., D Amo-Oduro, A Calderon, J Dabbeek, V Despotaki, L Martins, A Rao, M Simionato, D Viganò, C Yepes, A Acevedo, N Horspool, H Crowley, K Jaiswal, M Journeay, M Pittore, 2018. Global Earthquake Model (GEM) Seismic Risk Map (version 2018.1). https://doi.org/10.13117/GEM-GLOBAL-SEISMIC-RISK-MAP-2018.1
- Zhu, J., Baise, L. G., Thompson, E. M., 2017, An Updated Geospatial Liquefaction Model for Global Application, Bulletin of the Seismological Society of America, 107, p 1365-1385, https://doi.org/0.1785/0120160198
- Abers, G. and McCaffrey, R., 1988. Active Deformation in the New Guinea Fold-and-Thrust Belt: Seismological Evidence for Strike-Slip Faulting and Basement-Involved Thrusting in JGR, v. 93, no. B11, p. 13,332-13,354
- Baldwin, S.L., Monteleone, B.D., Webb, L.E., Fitzgerald, P.G., Grove, M., and Hill, E.J., 2004. Pliocene eclogite exhumation at plate tectonic rates in eastern Papua New Guinea in Nature, v. 431, p/ 263-267, doi:10.1038/nature02846.
- Baldwin, S.L., Fitzgerald, P.G., and Webb, L.E., 2012. Tectonics of the New Guinea Region, Annu. Rev. Earth Planet. Sci., v. 40, pp. 495-520.
- Cloos, M., Sapiie, B., Quarles van Ufford, A., Weiland, R.J., Warren, P.Q., and McMahon, T.P., 2005. Collisional delamination in New Guinea: The geotectonics of subducting slab breakoff: Geological Society of America Special Paper 400, 51 p., doi: 10.1130/2005.2400.
- Dow, D.B., 1977. A Geological Synthesis of Papua New Guinea, Bureau of Mineral Resources, Geology, and Geophysics, Bulltein 201, Australian Government Publishing Sevice, Canberra, 1977, 58 pp.
- Hamilton, W.B., 1979. Tectonics of the Indonesian Region, USGS Professional Paper 1078.
- Holm, R. and Richards, S.W., 2013. A re-evaluation of arc-continent collision and along-arc variation in the Bismarck Sea region, Papua New Guinea in Australian Journal of Earth Sciences, v. 60, p. 605-619.
- Holm, R.J., Richards, S.W., Rosenbaum, G., and Spandler, C., 2015. Disparate Tectonic Settings for Mineralisation in an Active Arc, Eastern Papua New Guinea and the Solomon Islands in proceedings from PACRIM 2015 Congress, Hong Kong ,18-21 March, 2015, pp. 7.
- Holm, R.J., Rosenbaum, G., Richards, S.W., 2016. Post 8 Ma reconstruction of Papua New Guinea and Solomon Islands: Microplate tectonics in a convergent plate boundary setting in Eartth Science Reviews, v. 156, p. 66-81.
- Johnson, R.W., 1976, Late Cainozoic volcanism and plate tectonics at the southern margin of the Bismarck Sea, Papua New Guinea, in Johnson, R.W., ed., 1976, Volcanism in Australia: Amsterdam, Elsevier, p. 101-116
- Koulali, A., tregoning, P., McClusky, S., Stanaway, R., Wallace, L., and Lister, G., 2015. New Insights into the present-day kinematics of the central and western Papua New Guinea from GPS in GJI, v. 202, p. 993-1004, doi: 10.1093/gji/ggv200
- Sapiie, B., and Cloos, M., 2004. Strike-slip faulting in the core of the Central Range of west New Guinea: Ertsberg Mining District, Indonesia in GSA Bulletin, v. 116; no. 3/4; p. 277–293
- Tregoning, P., McQueen, H., Lambeck, K., Jackson, R. Little, T., Saunders, S., and Rosa, R., 2000. Present-day crustal motion in Papua New Guinea, Earth Planets and Space, v. 52, pp. 727-730.
References:
Basic & General References
Specific References
..
Return to the Earthquake Reports page.
- Sorted by Magnitude
- Sorted by Year
- Sorted by Day of the Year
- Sorted By Region