Earlier today, there was an intermediate depth beneath eastern Papua New Guinea (PNG). With a magnitude M = 7.2, this is one of the largest earthquake so far in 2019. Here is the USGS website for this earthquake.
Today’s earthquake was quite deep, about 130 km. There are several ways that people have interpreted the tectonics here (which is more common than not).
PNG and New Britain are a region of convergence, where the Australia plate to the south is moving northwards to the Pacific plate (and lots of smaller plates are moving around too).
To the east is a subduction zone (convergent plate boundary) where the Solomon Sea plate dives north beneath the South Bismarck plate. I have prepared many earthquake reports for earthquakes in this region, most of them thrust (compressional) earthquakes related to subduction.
To the north of PNG is a transform plate boundary (strike-slip) that begins at the eastern boundary of the New Britain trench and extends along the north side of PNG, eventually turning into the Sorong fault, then the Palu Koro system in Sulawesi. On 28 September 2018 was an interesting earthquake and tsunami, along with some mega landslides. Here is my report for that series of events.
In the center of PNG, running east-west, is a collision zone formed by the north-south compression I mentioned above. There is a series of compressional folds and faults called the Papua Fold Belt. There have been several large quakes recently in this fold belt. Here is a report for one of those thrust earthquakes, much shallower than today’s eq.
The convergent plate boundary faults in this region have been long lived and have an interesting history. Some of the subduction zones that show up on the maps we will look at are fossil subduction zones (they are no longer active). However, just because they are not active does not mean that there are no earthquakes there. Often, earthquakes can happen along pre-existing zones of weakness. Today’s earthquake may be such a quake. It is difficult to really know.
There have been about 4 earthquakes in the area of today’s quake, with magnitudes M > 7.0. Today’s earthquake is extensional, but intermediate depth earthquakes can be of all types. The 2 quakes that have USGS mechanisms were strike-slip, but one was oblique (it was extensional and strike-slip).
Today, there was also a thrust earthquake, associated with the San Cristobal Trench (the subduction zone to the east of the New Britain trench). I did not label this subduction zone in the map below, but here is an earthquake sequence where I describe this fault zone in greater detail.
Today’s M 7.2 temblor is a cool mystery!
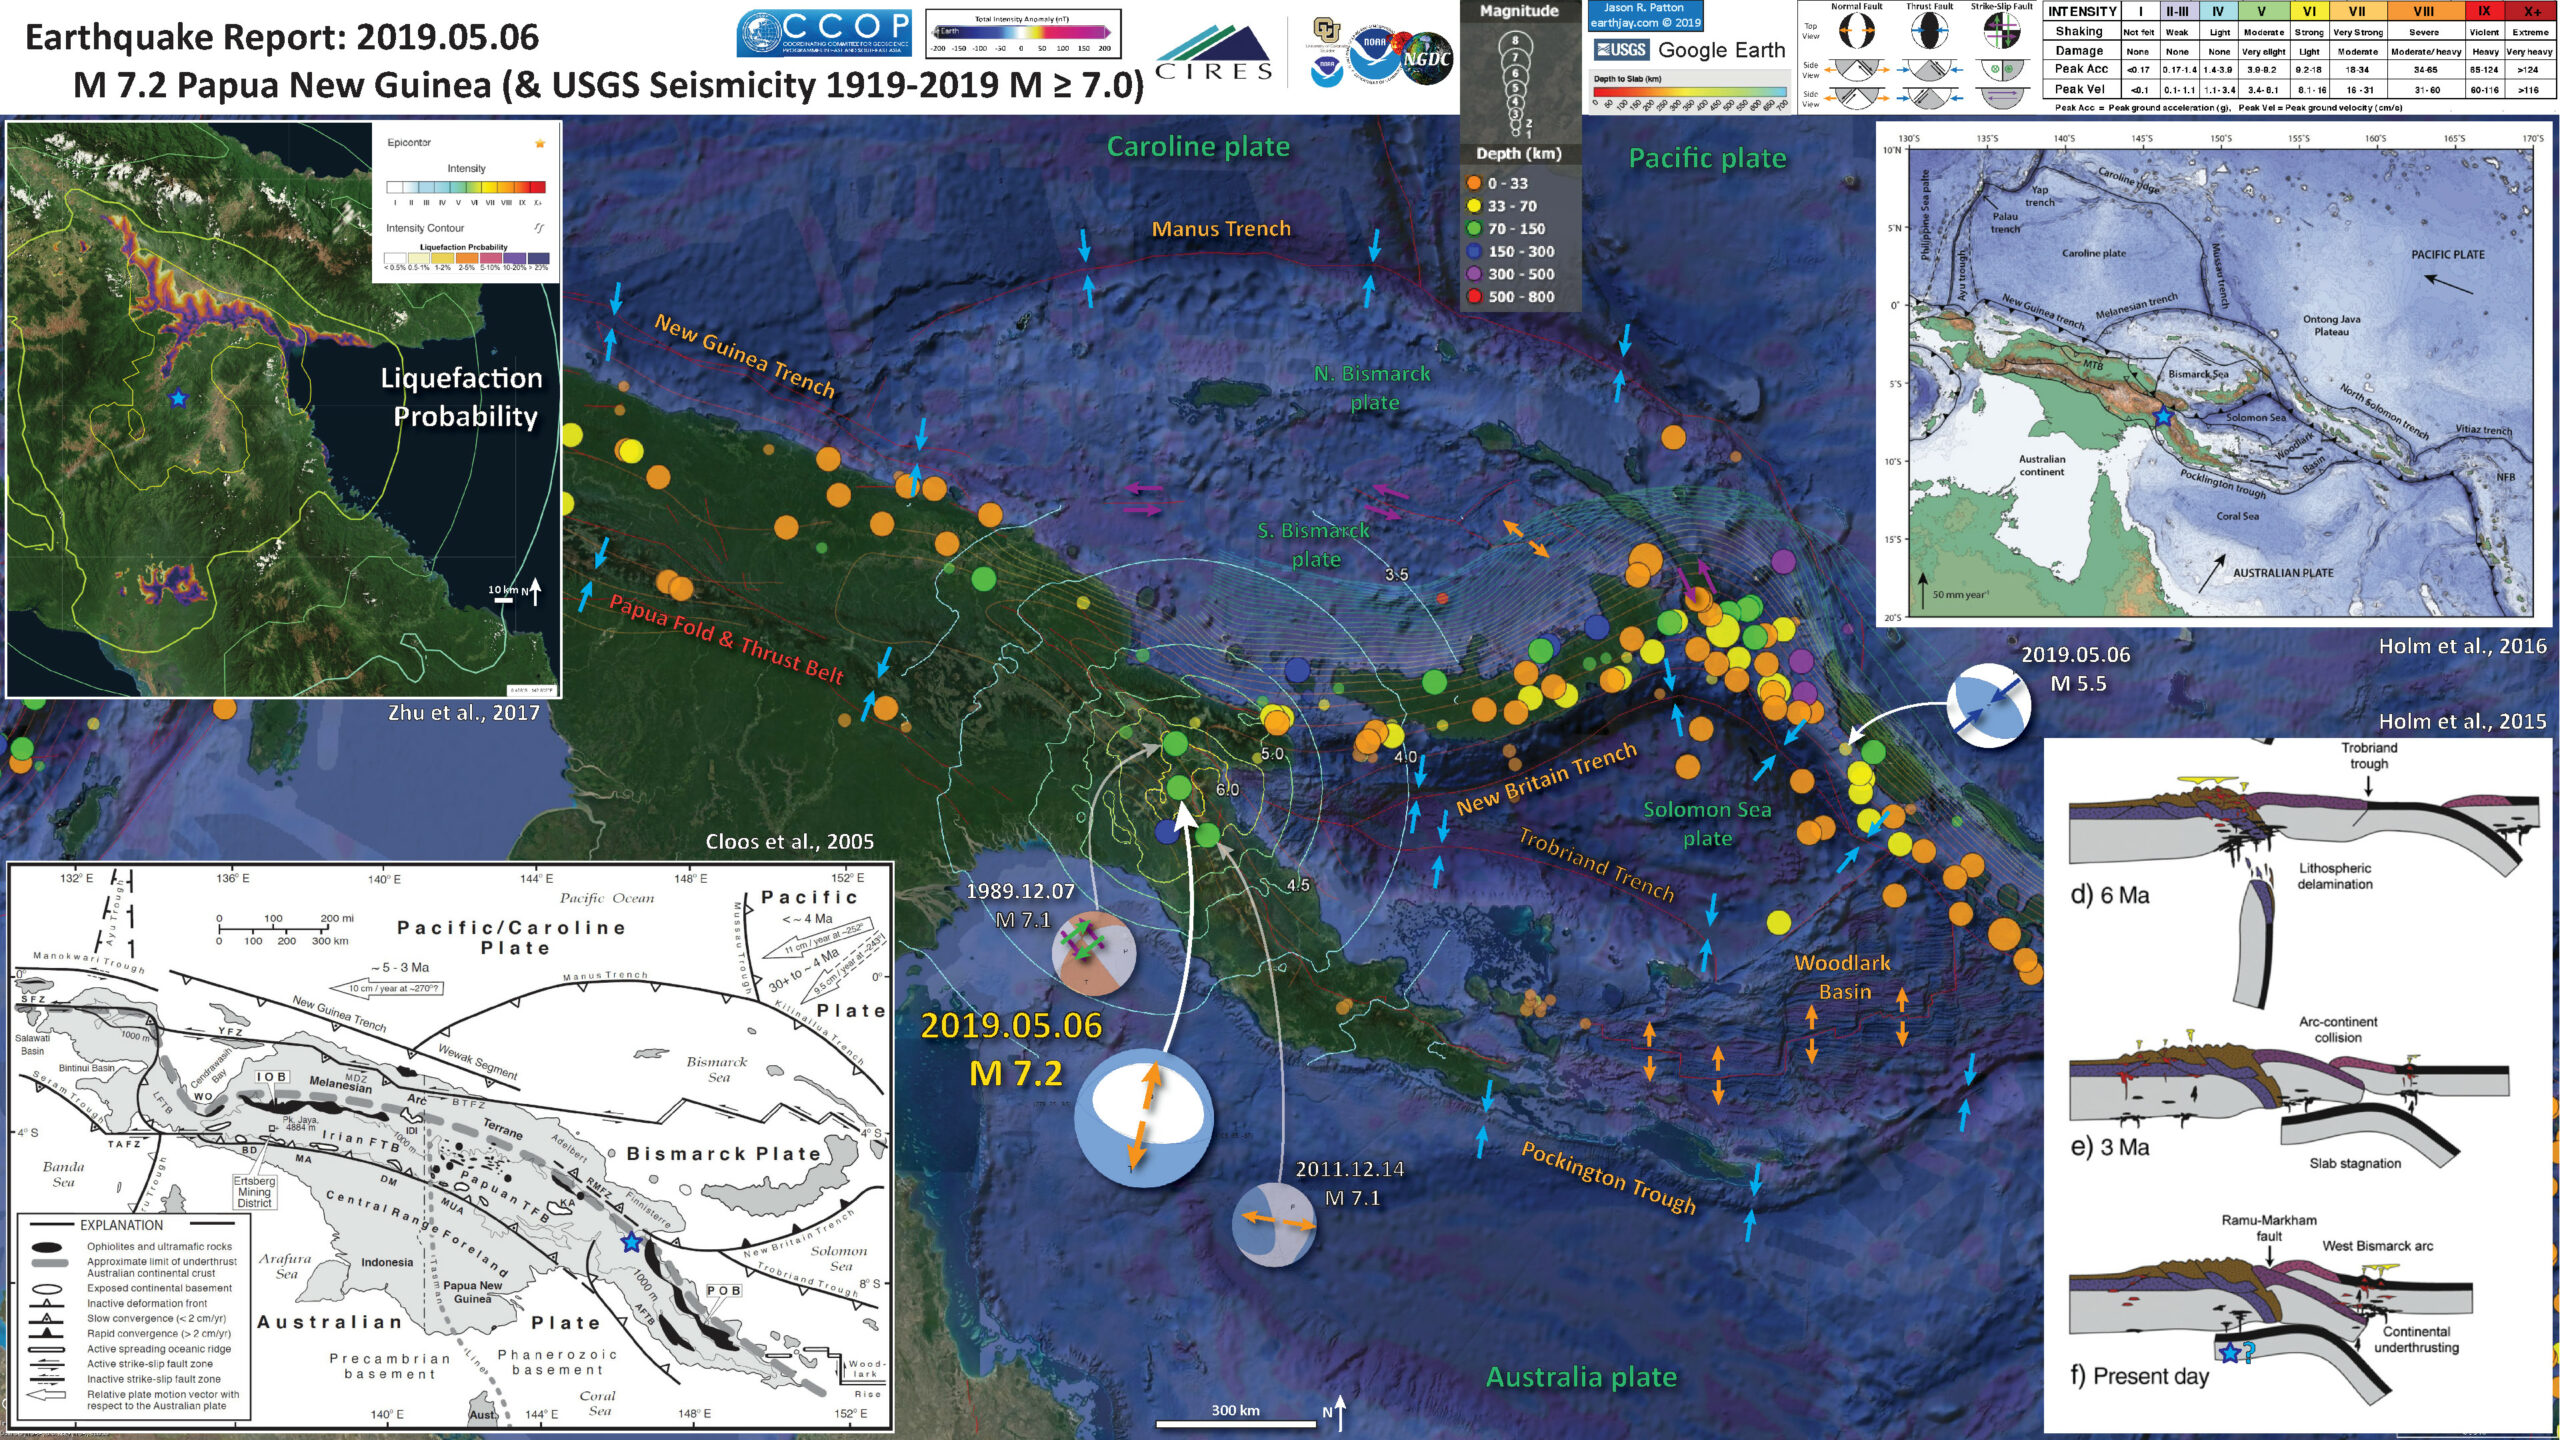
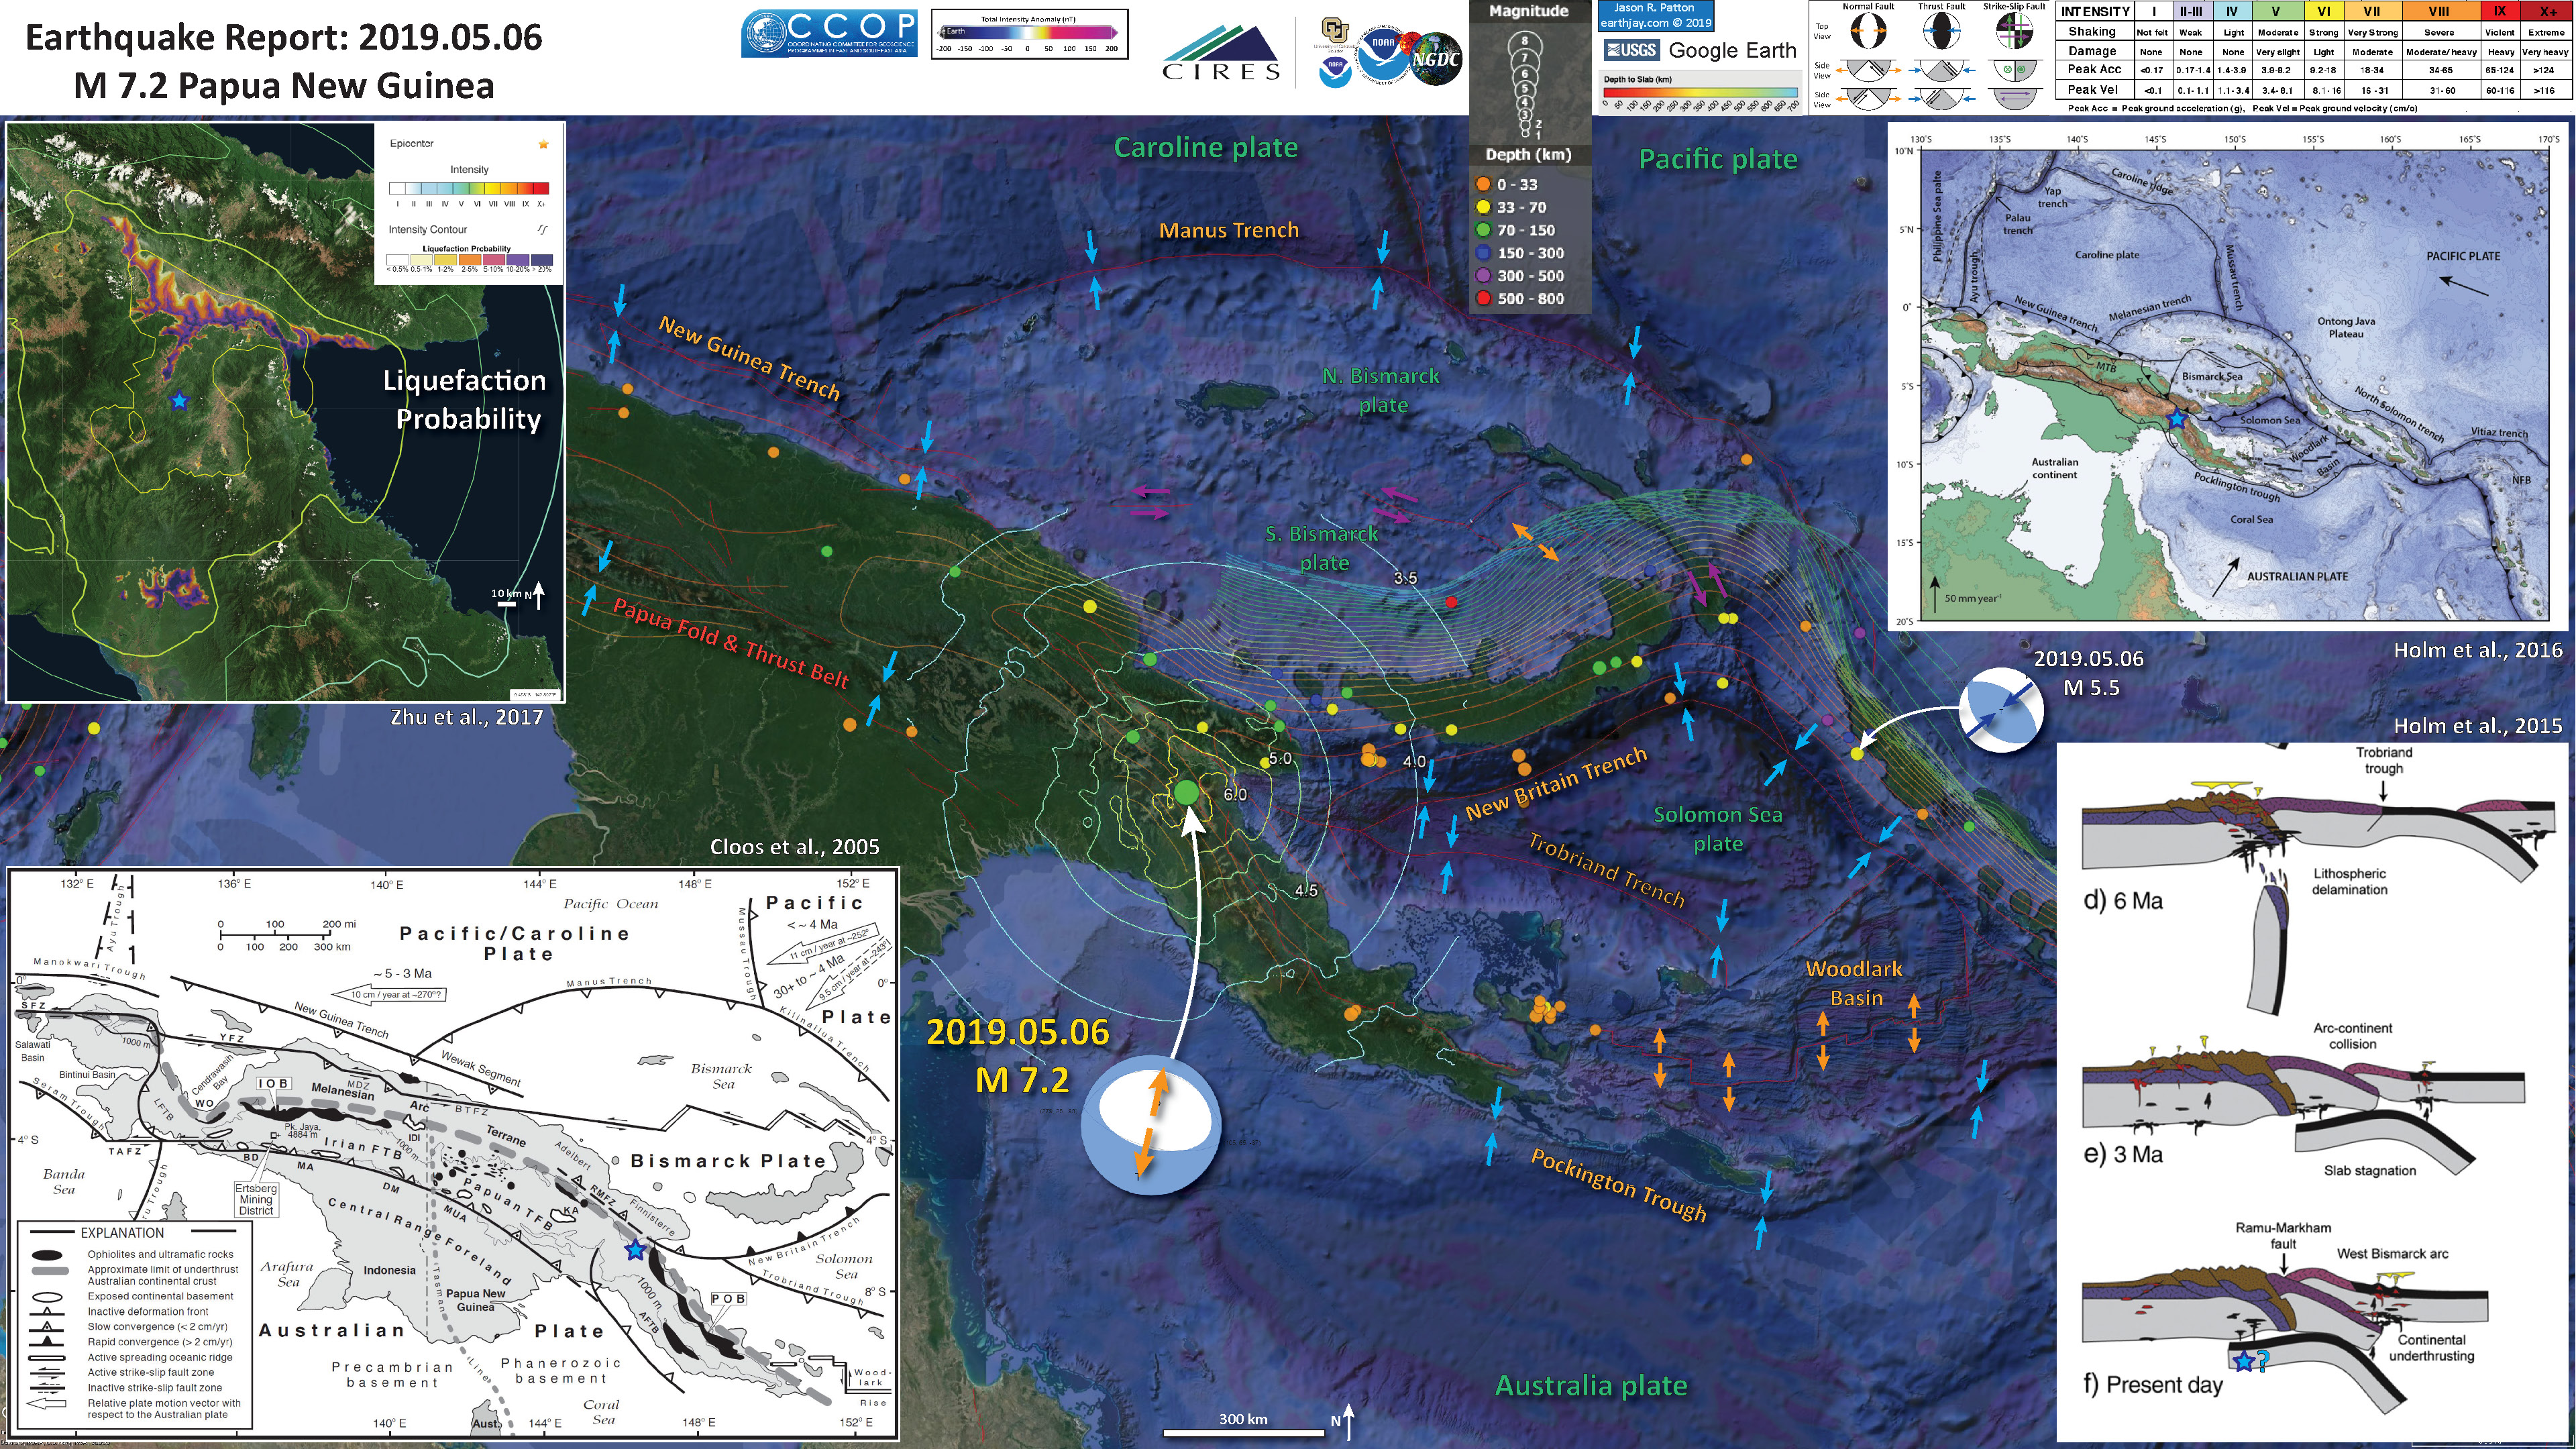
Below is my interpretive poster for this earthquake
I plot the seismicity from the past month, with color representing depth and diameter representing magnitude (see legend). I include earthquake epicenters from 1918-2018 with magnitudes M ≥ 3.0 in one version.
I plot the USGS fault plane solutions (moment tensors in blue and focal mechanisms in orange), possibly in addition to some relevant historic earthquakes.
- I placed a moment tensor / focal mechanism legend on the poster. There is more material from the USGS web sites about moment tensors and focal mechanisms (the beach ball symbols). Both moment tensors and focal mechanisms are solutions to seismologic data that reveal two possible interpretations for fault orientation and sense of motion. One must use other information, like the regional tectonics, to interpret which of the two possibilities is more likely.
- I also include the shaking intensity contours on the map. These use the Modified Mercalli Intensity Scale (MMI; see the legend on the map). This is based upon a computer model estimate of ground motions, different from the “Did You Feel It?” estimate of ground motions that is actually based on real observations. The MMI is a qualitative measure of shaking intensity. More on the MMI scale can be found here and here. This is based upon a computer model estimate of ground motions, different from the “Did You Feel It?” estimate of ground motions that is actually based on real observations.
- I include the slab 2.0 contours plotted (Hayes, 2018), which are contours that represent the depth to the subduction zone fault. These are mostly based upon seismicity. The depths of the earthquakes have considerable error and do not all occur along the subduction zone faults, so these slab contours are simply the best estimate for the location of the fault.
- Note the interesting orientation of the slab contours near today’s quake. Along the New Britain trench, they get deeper to the north (red contours near the trench and blue contours to the north). These contours wrap around on the west, so in the region of today’s quake, they get deeper to the south. There may be a subducting slab dipping to the south here, perhaps associated with the Trobriand Trench. This is one interpretation, which suggests today’s temblor was in an oceanic slab dipping to the south. Holm et al. (2015) favor a different interpretation, where the fossil subduction zone (forming the Pockington Trough) left behind a delaminated slab. So, today’s quake would be in the oceanic plate from the Australia plate that used to be dipping to the north. I don’t know if we can tell which is the correct hypothesis.
- In the map below, I include a transparent overlay of the magnetic anomaly data from EMAG2 (Meyer et al., 2017). As oceanic crust is formed, it inherits the magnetic field at the time. At different points through time, the magnetic polarity (north vs. south) flips, the North Pole becomes the South Pole. These changes in polarity can be seen when measuring the magnetic field above oceanic plates. This is one of the fundamental evidences for plate spreading at oceanic spreading ridges (like the Gorda rise).
- Regions with magnetic fields aligned like today’s magnetic polarity are colored red in the EMAG2 data, while reversed polarity regions are colored blue. Regions of intermediate magnetic field are colored light purple.
- We can see the roughly east-west trends of these red and blue stripes in the Woodlark Basin and Solomon Sea plate. These lines are parallel to the ocean spreading ridges from where they were formed. The stripes disappear at the subduction zone because the oceanic crust with these anomalies is diving deep beneath the overlying plate, so the magnetic anomalies mask the evidence for the downgoing plate.
Magnetic Anomalies
- In the upper right corner is a great figure showing the generalized plate tectonic boundaries in this region of the equatorial Pacific Ocean (Holm et al., 2016). I place a blue star in the general location of the M 6.5 earthquake (also plotted in other inset figures). This map shows the major plate boundary faults. Active subduction zones have shaded triangle fault symbols, while inactive subduction zones have un-shaded triangle fault line symbols. I place a blue star in the general location of today’s temblor (as in other inset figures).
- In the lower left corner is a map showing the fault systems in the region (Cloos et al., 2005). The legend allows us to distinguish between active and inactive fault systems.
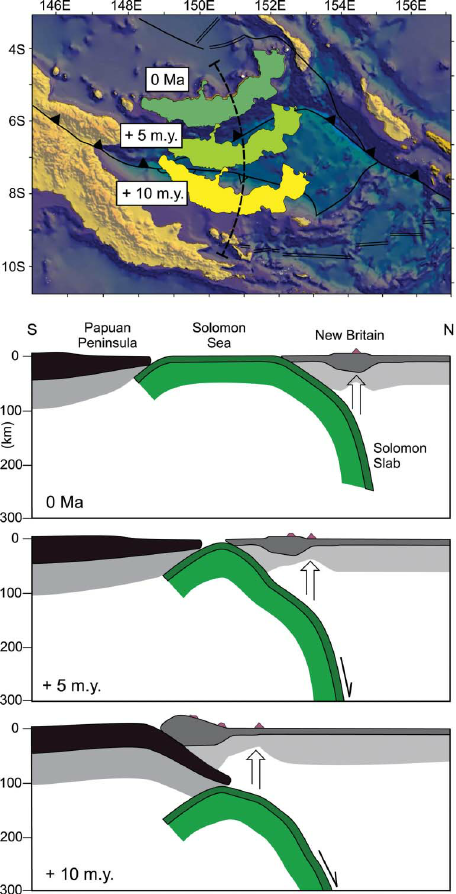
- In the lower right corner is a time history of this plate boundary from Holm et al. (2015). This is generalized with south on the left and north on the right. The plate on the left is the Australia plate and the downgoing plate was previously a subduction zone that formed the Pockington Trough.
- In the upper left corner is a map that shows the probability (likelihood) for liquefaction (Zhu et al;., 2017). This is a recent addition to the USGS earthquake pages. Read more about this modeling here. These areas that may experience liquefaction are areas that are low lying topography with underlying sediment (as opposed to bedrock) that have the correct properties (e.g. water saturated) to liquefy. I discuss liquefaction in the Donggala-Palu earthquake report here.
I include some inset figures. Some of the same figures are located in different places on the larger scale map below.
- Here is the map with a month’s seismicity plotted.
- Here is the map with a century’s seismicity plotted.

- Here is the map with a month’s seismicity plotted, but i have plotted the active faults in the CCOP database (white lines). These fault lines nicely highlight the Papua fold belt.

Other Report Pages
Some Relevant Discussion and Figures
- Here is the Holm et al. (2016) figure, showing the major plate boundary faults (symbols tell us which plate boundaries are no longer active: dark symbols = active, hollow symbols = inactive).

Topography, bathymetry and regional tectonic setting of New Guinea and Solomon Islands. Arrows indicate rate and direction of plate motion of the Australian and Pacific plates (MORVEL, DeMets et al., 2010); Mamberamo thrust belt, Indonesia (MTB); North Fiji Basin (NFB)
- This is the Cloos et al. (2005) map from the poster.

Tectonic map of New Guinea, adapted from Hamilton (1979), Cooper and Taylor (1987), Dow et al. (1988), and Sapiie et al. (1999). AFTB—Aure fold and thrust belt, FTB—fold-and-thrust belt, IOB—Irian Ophiolite Belt, TFB—thrust-and-fold belt, POB—Papuan Ophiolite Belt, BTFZ—Bewani-Torricelli fault zone, MDZ—Mamberamo deformation zone, YFZ—Yapen fault zone, SFZ—Sorong fault zone, WO—Weyland overthrust. Continental basement exposures are concentrated along the southern fl ank of the Central Range: BD—Baupo Dome, MA—Mapenduma anticline, DM—Digul monocline, IDI—Idenberg Inlier, MUA—Mueller anticline, KA—Kubor anticline, LFTB—Legguru fold-and-thrust belt, RMFZ—Ramu-Markham fault zone, TAFZ—Tarera-Aiduna fault zone. The Tasman line separates continental crust that is Paleozoic and younger to the east from Precambrian to the west.
- This is the Cloos et al. (2005) cross section, showing a different interpretation of the delaminated slab.

Lithospheric-scale cross section at 2 Ma. Plate motion is now focused along the Yapen fault zone in the center of the recently extinct arc. This probably occurred because this zone of weakness had a trend that could accommodate the imposed movements as the corner of the Caroline microplate ruptured, forming the Bismarck plate, and the corner of the Australian plate ruptured, forming the Solomon microplate. The collisional delamination-generated magmatic event ends in the highlands as the lower crustal magma chamber solidifies. Upwelled asthenosphere cools and transforms into lithospheric mantle. This drives a slow regional subsidence of the highlands that will continue for tens of millions of years or until other plate-tectonic movements are initiated. Deep erosion is still concentrated on the fl anks of the mountain belt. RMB—Ruffaer Metamorphic Belt, AUS—Australian plate, PAC—Pacific plate.
- Here is the tectonic map figure from Sappie and Cloos (2004). Their work was focused on western PNG, so their interpretations are more detailed there (and perhaps less relevant for us for these eastern PNG earthquakes).

Seismotectonic interpretation of New Guinea. Tectonic features: PTFB—Papuan thrust-and-fold belt; RMFZ—Ramu-Markham fault zone; BTFZ—Bewani-Torricelli fault zone; MTFB—Mamberamo thrust-and-fold belt; SFZ—Sorong fault zone; YFZ—Yapen fault zone; RFZ—Ransiki fault zone; TAFZ—Tarera-Aiduna fault zone; WT—Waipona Trough. After Sapiie et al. (1999).
- This is the two panel figure from Holm and Richards (2013) that shows how the New Britain trench megathrust splays into three thrust faults as this fault system heads onto PNG. They plot active thrust faults as black triangles (with the triangles on the hanging wall side of the fault) and inactive thrust faults as open triangles. So, either the NG trench subduction zone extends further east than is presented in earlier work or the Bundi Fault Zone is the fault associated with this deep seismicity.
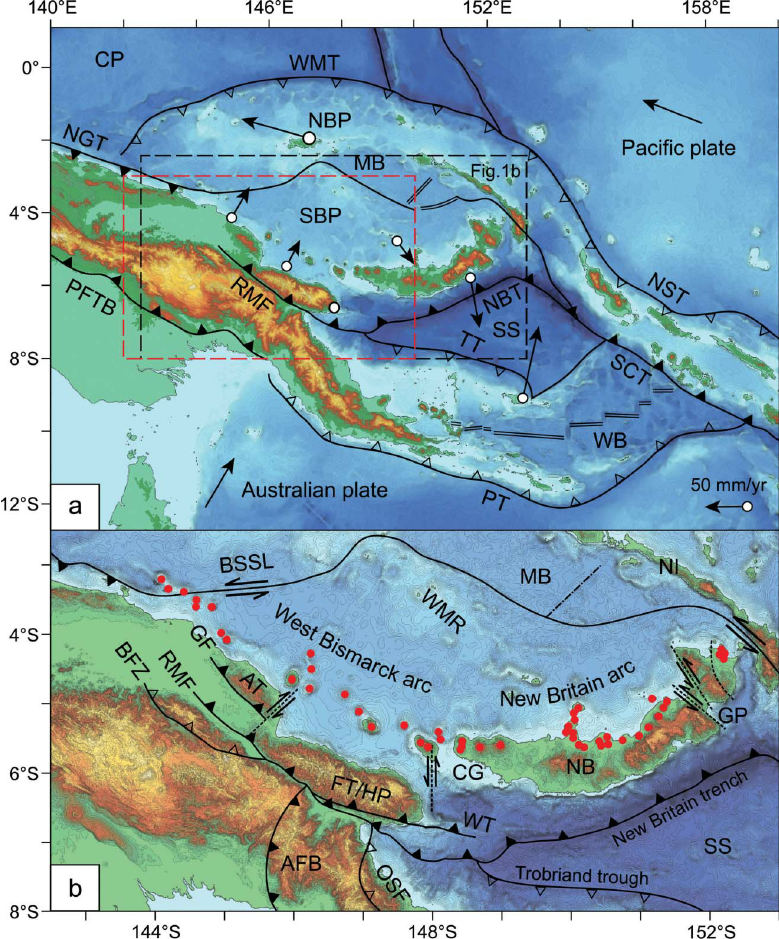
Topography, bathymetry and major tectonic elements of the study area. (a) Major tectonic boundaries of Papua New Guinea and the western Solomon Islands; CP, Caroline plate; MB, Manus Basin; NBP, North Bismarck plate; NBT, New Britain trench; NGT, New Guinea trench; NST, North Solomon trench; PFTB, Papuan Fold and Thrust Belt; PT, Pocklington trough; RMF, Ramu-Markham Fault; SBP, South Bismarck plate; SCT, San Cristobal trench; SS, Solomon Sea plate; TT, Trobriand trough; WB,Woodlark Basin; WMT,West Melanesian trench. Study area is indicated by rectangle labelled Figure 1b; the other inset rectangle highlights location for subsequent figures. Present day GPS motions of plates are indicated relative to the Australian plate (from Tregoning et al. 1998, 1999; Tregoning 2002; Wallace et al. 2004). (b) Detailed topography, bathymetry and structural elements significant to the South Bismarck region (terms not in common use are referenced); AFB, Aure Fold Belt (Davies 2012); AT, Adelbert Terrane (e.g. Wallace et al. 2004); BFZ, Bundi Fault Zone (Abbott 1995); BSSL, Bismarck Sea Seismic Lineation; CG, Cape Gloucester; FT, Finisterre Terrane; GF, Gogol Fault (Abbott 1995); GP, Gazelle Peninsula; HP, Huon Peninsula; MB, Manus Basin; NB, New Britain; NI, New Ireland; OSF, Owen Stanley Fault; RMF, Ramu-Markham Fault; SS, Solomon Sea; WMR, Willaumez-Manus Rise (Johnson et al. 1979); WT, Wonga Thrust (Abbott et al. 1994); minor strike-slip faults are shown adjacent to Huon Peninsula (Abers & McCaffrey 1994) and in east New Britain, the Gazelle Peninsula (e.g. Madsen & Lindley 1994). Circles indicate centres of Quaternary volcanism of the Bismarck arc. Filled triangles indicate active thrusting or subduction, empty triangles indicate extinct or negligible thrusting or subduction.
- Here is the slab interpretation for the New Britain region from Holm and Richards, 2013. I include the figure caption below as a blockquote.
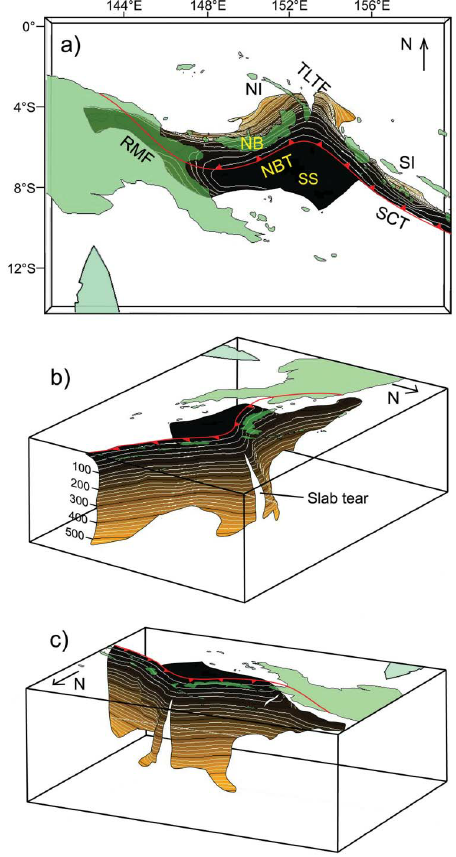
3-D model of the Solomon slab comprising the subducted Solomon Sea plate, and associated crust of the Woodlark Basin and Australian plate subducted at the New Britain and San Cristobal trenches. Depth is in kilometres; the top surface of the slab is contoured at 20 km intervals from the Earth’s surface (black) to termination of slabrelated seismicity at approximately 550 km depth (light brown). Red line indicates the locations of the Ramu-Markham Fault (RMF)–New Britain trench (NBT)–San Cristobal trench (SCT); other major structures are removed for clarity; NB, New Britain; NI, New Ireland; SI, Solomon Islands; SS, Solomon Sea; TLTF, Tabar–Lihir–Tanga–Feni arc. See text for details.
- Here are the forward models for the slab in the New Britain region from Holm and Richards, 2013. I include the figure caption below as a blockquote.
Forward tectonic reconstruction of progressive arc collision and accretion of New Britain to the Papua New Guinea margin. (a) Schematic forward reconstruction of New Britain relative to Papua New Guinea assuming continued northward motion of the Australian plate and clockwise rotation of the South Bismarck plate. (b) Cross-sections illustrate a conceptual interpretation of collision between New Britain and Papua New Guinea.
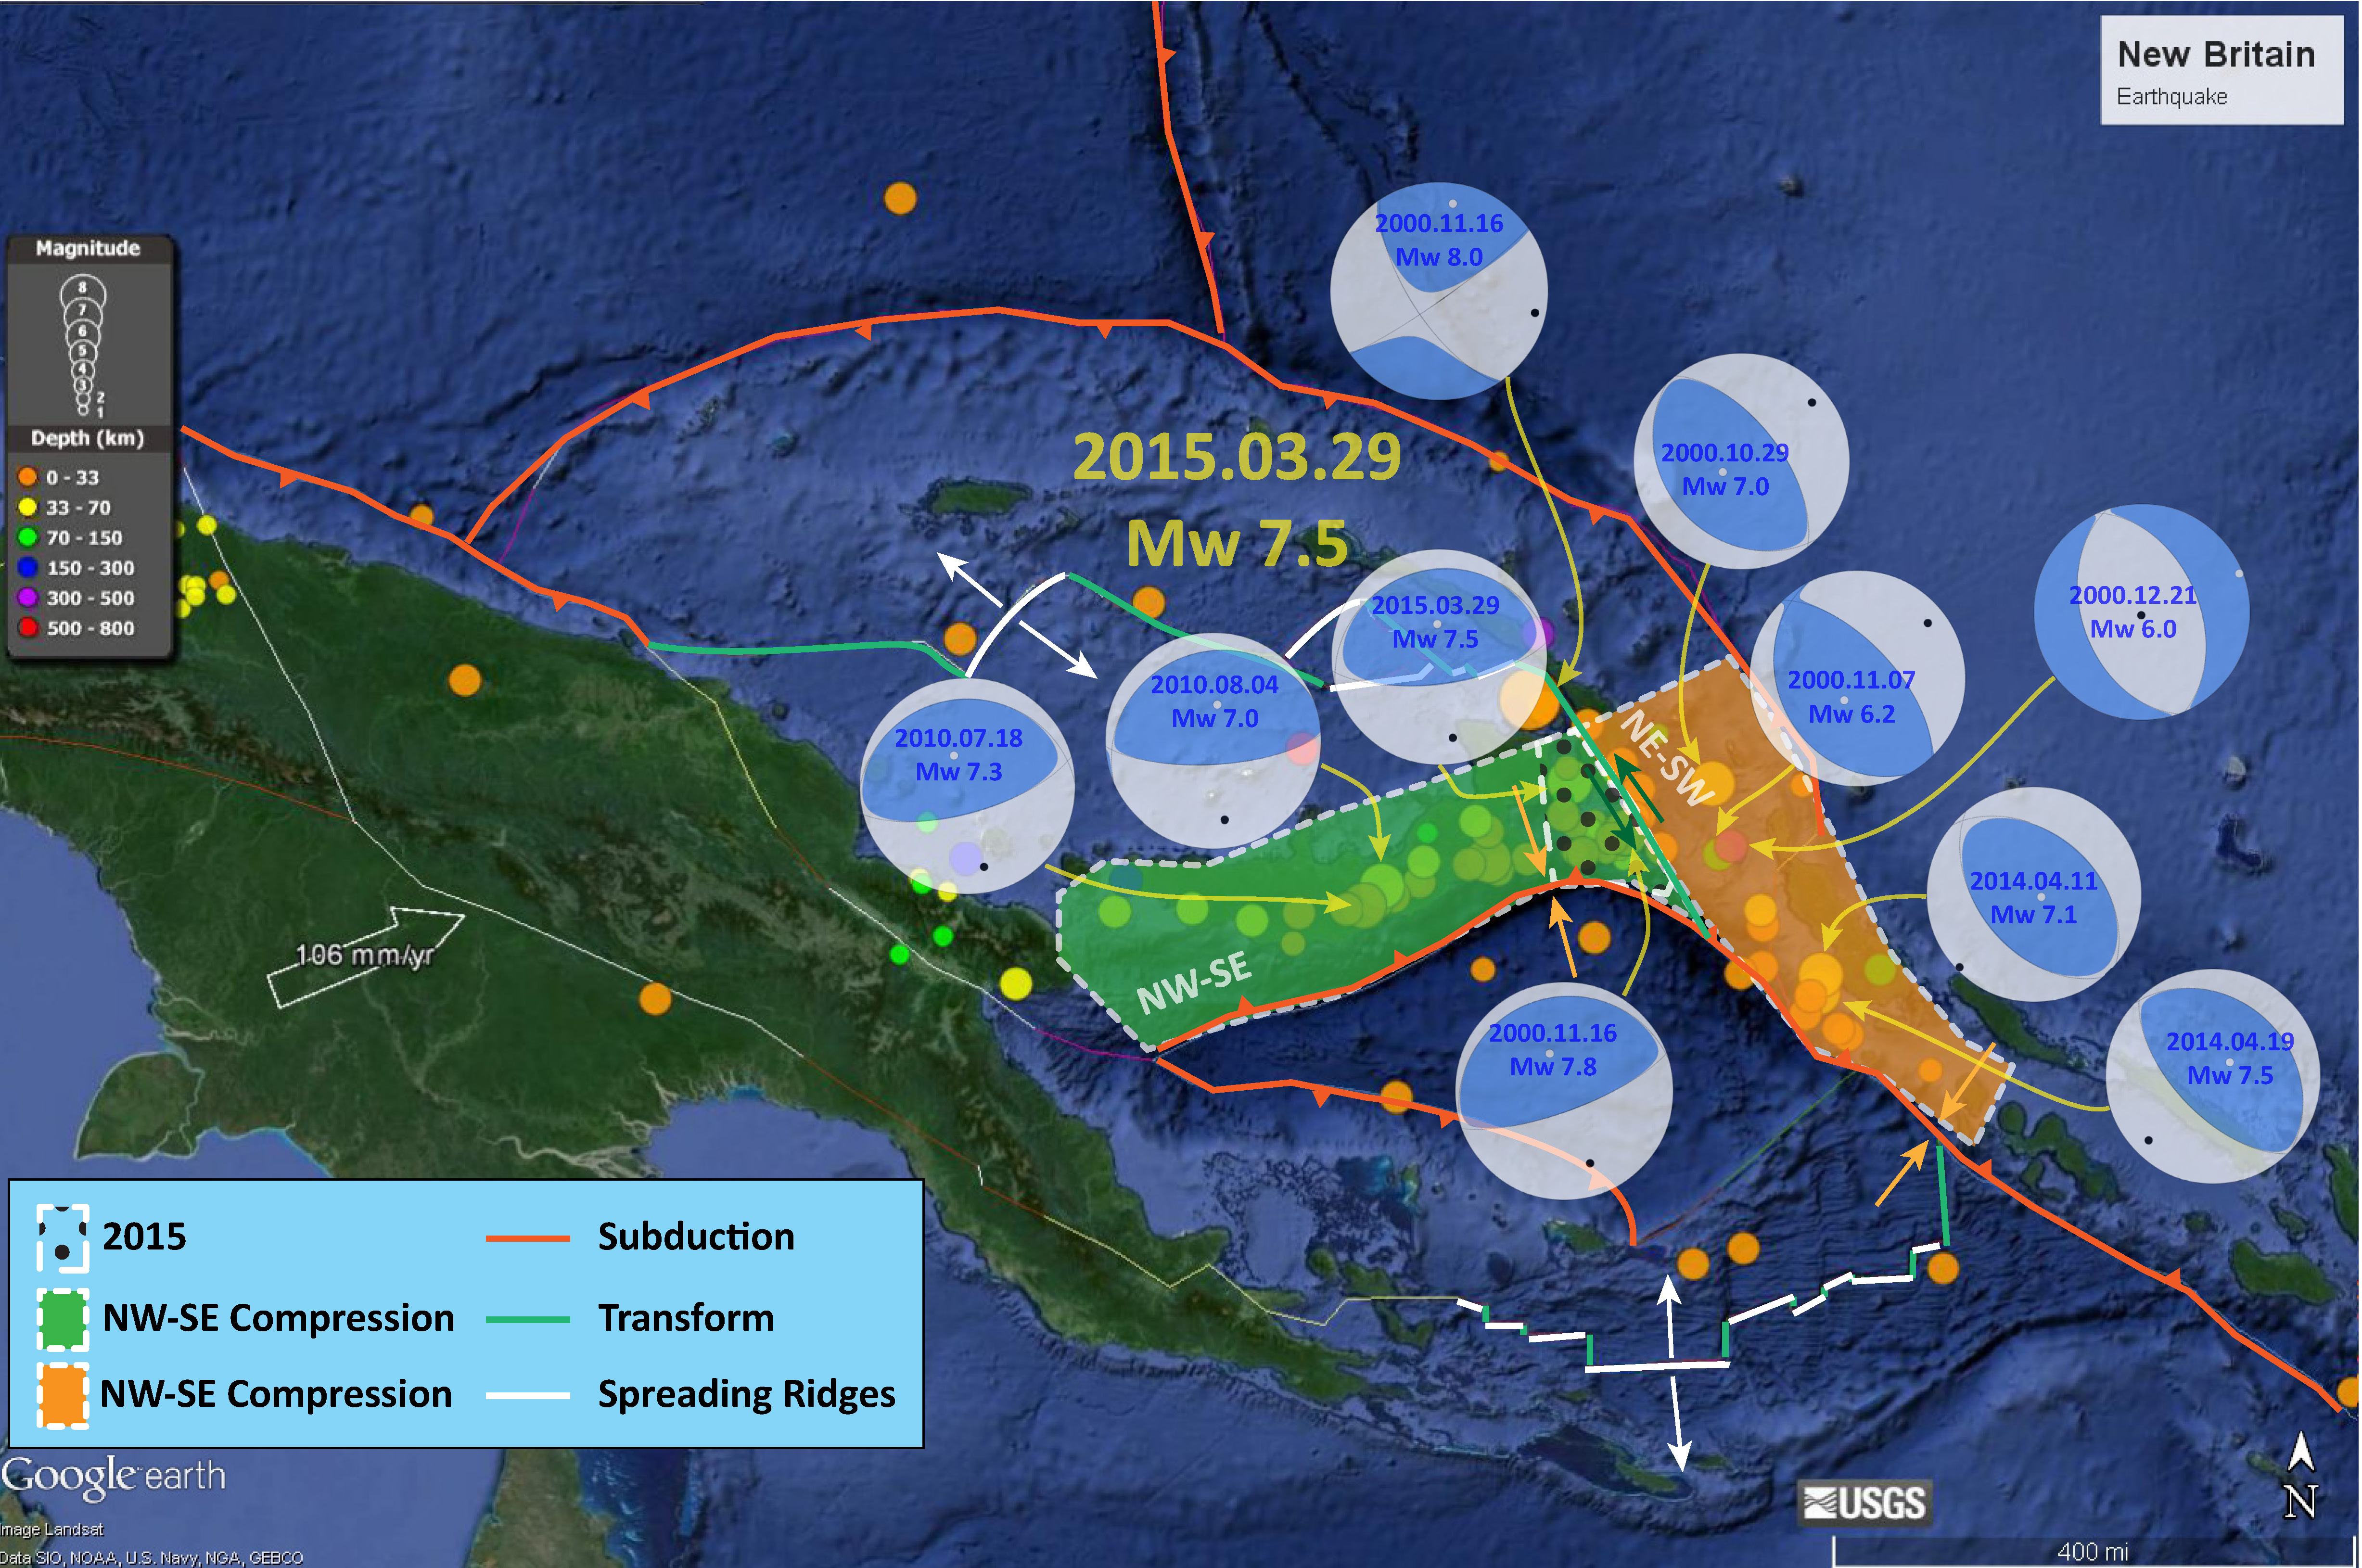
- Earlier, in other earthquake reports, I have discussed seismicity from 2000-2015 here. The seismicity on the west of this region appears aligned with north-south shortening along the New Britain trench, while seismicity on the east of this region appears aligned with more east-west shortening. Here is a map that I put together where I show these two tectonic domains with the seismicity from this time period (today’s earthquakes are not plotted on this map, but one may see where they might plot).
- This map shows plate velocities and euler poles for different blocks. I include the figure caption below as a blockquote.

Tectonic maps of the New Guinea region. (a) Seismicity, volcanoes, and plate motion vectors. Plate motion vectors relative to the Australian plate are surface velocity models based on GPS data, fault slip rates, and earthquake focal mechanisms (UNAVCO, http://jules.unavco.org/Voyager/Earth). Earthquake data are sourced from the International Seismological Center EHB Bulletin (http://www.isc.ac.uk); data represent events from January 1994 through January 2009 with constrained focal depths. Background image is generated from http://www.geomapapp.org. Abbreviations: AB, Arafura Basin; AT, Aure Trough; AyT, Ayu Trough; BA, Banda arc; BSSL, Bismarck Sea seismic lineation; BH, Bird’s Head; BT, Banda Trench; BTFZ, Bewani-Torricelli fault zone; DD, Dayman Dome; DEI, D’Entrecasteaux Islands; FP, Fly Platform; GOP, Gulf of Papua; HP, Huon peninsula; LA, Louisiade Archipelago; LFZ, Lowlands fault zone; MaT, Manus Trench; ML, Mt. Lamington; MT, Mt. Trafalgar; MuT, Mussau Trough; MV, Mt. Victory; MTB, Mamberamo thrust belt; MVF, Managalase Plateau volcanic field; NBT, New Britain Trench; NBA, New Britain arc; NF, Nubara fault; NGT, New Guinea Trench; OJP, Ontong Java Plateau; OSF, Owen Stanley fault zone; PFTB, Papuan fold-and-thrust belt; PP, Papuan peninsula; PRi, Pocklington Rise; PT, Pocklington Trough; RMF, Ramu-Markham fault; SST, South Solomons Trench; SA, Solomon arc; SFZ, Sorong fault zone; ST, Seram Trench; TFZ, Tarera-Aiduna fault zone; TJ, AUS-WDKPAC triple junction; TL, Tasman line; TT, Trobriand Trough;WD, Weber Deep;WB, Woodlark Basin;WFTB, Western (Irian) fold-and-thrust belt; WR,Woodlark Rift; WRi, Woodlark Rise; WTB, Weyland thrust; YFZ, Yapen fault zone.White box indicates the location shown in Figure 3. (b) Map of plates, microplates, and tectonic blocks and elements of the New Guinea region. Tectonic elements modified after Hill & Hall (2003). Abbreviations: ADB, Adelbert block; AOB, April ultramafics; AUS, Australian plate; BHB, Bird’s Head block; CM, Cyclops Mountains; CWB, Cendrawasih block; CAR, Caroline microplate; EMD, Ertsberg Mining District; FA, Finisterre arc; IOB, Irian ophiolite belt; KBB, Kubor & Bena blocks (including Bena Bena terrane); LFTB, Lengguru fold-and-thrust belt; MA, Mapenduma anticline; MB, Mamberamo Basin block; MO, Marum ophiolite belt; MHS, Manus hotspot; NBS, North Bismarck plate; NGH, New Guinea highlands block; NNG, Northern New Guinea block; OKT, Ok Tedi mining district; PAC, Pacific plate; PIC, Porgera intrusive complex; PSP, Philippine Sea plate; PUB, Papuan Ultramafic Belt ophiolite; SB, Sepik Basin block; SDB, Sunda block; SBS, South Bismarck plate; SIB, Solomon Islands block; WP, Wandamen peninsula; WDK, Woodlark microplate; YQ, Yeleme quarries.
- This figure incorporates cross sections and map views of various parts of the regional tectonics (Baldwin et al., 2012). These deep earthquakes are nearest the cross section D (though are much deeper than these shallow cross sections). I include the figure caption below as a blockquote.

Oblique block diagram of New Guinea from the northeast with schematic cross sections showing the present-day plate tectonic setting. Digital elevation model was generated from http://www.geomapapp.org. Oceanic crust in tectonic cross sections is shown by thick black-and-white hatched lines, with arrows indicating active subduction; thick gray-and-white hatched lines indicate uncertain former subduction. Continental crust, transitional continental crust, and arc-related crust are shown without pattern. Representative geologic cross sections across parts of slices C and D are marked with transparent red ovals and within slices B and E are shown by dotted lines. (i ) Cross section of the Papuan peninsula and D’Entrecasteaux Islands modified from Little et al. (2011), showing the obducted ophiolite belt due to collision of the Australian (AUS) plate with an arc in the Paleogene, with later Pliocene extension and exhumation to form the D’Entrecasteaux Islands. (ii ) Cross section of the Papuan peninsula after Davies & Jaques (1984) shows the Papuan ophiolite thrust over metamorphic rocks of AUS margin affinity. (iii ) Across the Papuan mainland, the cross section after Crowhurst et al. (1996) shows the obducted Marum ophiolite and complex folding and thrusting due to collision of the Melanesian arc (the Adelbert, Finisterre, and Huon blocks) in the Late Miocene to recent. (iv) Across the Bird’s Head, the cross section after Bailly et al. (2009) illustrates deformation in the Lengguru fold-and-thrust belt as a result of Late Miocene–Early Pliocene northeast-southwest shortening, followed by Late Pliocene–Quaternary extension. Abbreviations as in Figure 2, in addition to NI, New Ireland; SI, Solomon Islands; SS, Solomon Sea; (U)HP, (ultra)high-pressure.
- In 1977, D.B. Dow published a Geological Synthesis of Papua New Guinea. There are some excellent low angle oblique views of tectonic geomorphologic features, including the Papua fold belt. Below are two examples, one with an arc volcano formed in the midst of the fold belt. These images are based on RADAR imagery.

Radar image of Mount Murray stratovolcano (lat. 6°45’S, long. 144°00’E)—of late Pliocene or Quaternary age—surmounting the prominent strike ridges of folded Miocene Darai Limestone. Deep erosion of the crater has exposed the intrusive core of the volcano. (Scale about 1:250 000.)

Side-looking radar image of the eastern end of the Papuan Fold Belt between Mount Murray and Mount Karimui. The prominent ridges are steeply dipping Darai Limestone which has been repeated by folding and thrust-faulting. The karst surface developed on the limestone is evident despite the very heavy jungle cover. This image was obtained with the radar looking from the south, so the image is oriented with north to the bottom of the page to prevent the viewer seeing inverted topography. (Scale about 1:250 000.)
Geologic Fundamentals
- For more on the graphical representation of moment tensors and focal mechanisms, check this IRIS video out:
- Here is a fantastic infographic from Frisch et al. (2011). This figure shows some examples of earthquakes in different plate tectonic settings, and what their fault plane solutions are. There is a cross section showing these focal mechanisms for a thrust or reverse earthquake. The upper right corner includes my favorite figure of all time. This shows the first motion (up or down) for each of the four quadrants. This figure also shows how the amplitude of the seismic waves are greatest (generally) in the middle of the quadrant and decrease to zero at the nodal planes (the boundary of each quadrant).

- Here is another way to look at these beach balls.
The two beach balls show the stike-slip fault motions for the M6.4 (left) and M6.0 (right) earthquakes. Helena Buurman's primer on reading those symbols is here. pic.twitter.com/aWrrb8I9tj
— AK Earthquake Center (@AKearthquake) August 15, 2018
- There are three types of earthquakes, strike-slip, compressional (reverse or thrust, depending upon the dip of the fault), and extensional (normal). Here is are some animations of these three types of earthquake faults. The following three animations are from IRIS.
Strike Slip:
Compressional:
Extensional:
- This is an image from the USGS that shows how, when an oceanic plate moves over a hotspot, the volcanoes formed over the hotspot form a series of volcanoes that increase in age in the direction of plate motion. The presumption is that the hotspot is stable and stays in one location. Torsvik et al. (2017) use various methods to evaluate why this is a false presumption for the Hawaii Hotspot.
- Here is a map from Torsvik et al. (2017) that shows the age of volcanic rocks at different locations along the Hawaii-Emperor Seamount Chain.
- Here is a great tweet that discusses the different parts of a seismogram and how the internal structures of the Earth help control seismic waves as they propagate in the Earth.

A cutaway view along the Hawaiian island chain showing the inferred mantle plume that has fed the Hawaiian hot spot on the overriding Pacific Plate. The geologic ages of the oldest volcano on each island (Ma = millions of years ago) are progressively older to the northwest, consistent with the hot spot model for the origin of the Hawaiian Ridge-Emperor Seamount Chain. (Modified from image of Joel E. Robinson, USGS, in “This Dynamic Planet” map of Simkin and others, 2006.)

Hawaiian-Emperor Chain. White dots are the locations of radiometrically dated seamounts, atolls and islands, based on compilations of Doubrovine et al. and O’Connor et al. Features encircled with larger white circles are discussed in the text and Fig. 2. Marine gravity anomaly map is from Sandwell and Smith.
Today, on #SeismogramSaturday: what are all those strangely-named seismic phases described in seismograms from distant earthquakes? And what do they tell us about Earth’s interior? pic.twitter.com/VJ9pXJFdCy
— Jackie Caplan-Auerbach (@geophysichick) February 23, 2019
- 2019.05.06 M 7.2 Papua New Guinea
- 2018.12.05 M 7.5 New Caledonia
- 2018.10.10 M 7.0 New Britain, PNG
- 2018.09.09 M 6.9 Kermadec
- 2018.08.29 M 7.1 Loyalty Islands
- 2018.08.18 M 8.2 Fiji
- 2018.03.26 M 6.9 New Britain
- 2018.03.26 M 6.6 New Britain
- 2018.03.08 M 6.8 New Ireland
- 2018.02.25 M 7.5 Papua New Guinea
- 2018.02.26 M 7.5 Papua New Guinea Update #1
- 2017.11.19 M 7.0 Loyalty Islands Update #1
- 2017.11.07 M 6.5 Papua New Guinea
- 2017.11.04 M 6.8 Tonga
- 2017.10.31 M 6.8 Loyalty Islands
- 2017.08.27 M 6.4 N. Bismarck plate
- 2017.05.09 M 6.8 Vanuatu
- 2017.03.19 M 6.0 Solomon Islands
- 2017.03.05 M 6.5 New Britain
- 2017.01.22 M 7.9 Bougainville
- 2017.01.03 M 6.9 Fiji
- 2016.12.17 M 7.9 Bougainville
- 2016.12.08 M 7.8 Solomons
- 2016.10.17 M 6.9 New Britain
- 2016.10.15 M 6.4 South Bismarck Sea
- 2016.09.14 M 6.0 Solomon Islands
- 2016.08.31 M 6.7 New Britain
- 2016.08.12 M 7.2 New Hebrides Update #2
- 2016.08.12 M 7.2 New Hebrides Update #1
- 2016.08.12 M 7.2 New Hebrides
- 2016.04.06 M 6.9 Vanuatu Update #1
- 2016.04.03 M 6.9 Vanuatu
- 2015.03.30 M 7.5 New Britain (Update #5)
- 2015.03.30 M 7.5 New Britain (Update #4)
- 2015.03.29 M 7.5 New Britain (Update #3)
- 2015.03.29 M 7.5 New Britain (Update #2)
- 2015.03.29 M 7.5 New Britain (Update #1)
- 2015.03.29 M 7.5 New Britain
- 2015.11.18 M 6.8 Solomon Islands
- 2015.05.24 M 6.8, 6.8, 6.9 Santa Cruz Islands
- 2015.05.05 M 7.5 New Britain
New Britain | Solomon | Bougainville | New Hebrides | Tonga | Kermadec Earthquake Reports
General Overview
Earthquake Reports
Social Media
- Abers, G. and McCaffrey, R., 1988. Active Deformation in the New Guinea Fold-and-Thrust Belt: Seismological Evidence for Strike-Slip Faulting and Basement-Involved Thrusting in JGR, v. 93, no. B11, p. 13,332-13,354
- Baldwin, S.L., Monteleone, B.D., Webb, L.E., Fitzgerald, P.G., Grove, M., and Hill, E.J., 2004. Pliocene eclogite exhumation at plate tectonic rates in eastern Papua New Guinea in Nature, v. 431, p/ 263-267, doi:10.1038/nature02846.
- Baldwin, S.L., Fitzgerald, P.G., and Webb, L.E., 2012. Tectonics of the New Guinea Region, Annu. Rev. Earth Planet. Sci., v. 40, pp. 495-520.
- Cloos, M., Sapiie, B., Quarles van Ufford, A., Weiland, R.J., Warren, P.Q., and McMahon, T.P., 2005. Collisional delamination in New Guinea: The geotectonics of subducting slab breakoff: Geological Society of America Special Paper 400, 51 p., doi: 10.1130/2005.2400.
- Dow, D.B., 1977. A Geological Synthesis of Papua New Guinea, Bureau of Mineral Resources, Geology, and Geophysics, Bulltein 201, Australian Government Publishing Sevice, Canberra, 1977, 58 pp.
- Frisch, W., Meschede, M., Blakey, R., 2011. Plate Tectonics, Springer-Verlag, London, 213 pp.
- Hamilton, W.B., 1979. Tectonics of the Indonesian Region, USGS Professional Paper 1078.
- Hayes, G., 2018, Slab2 – A Comprehensive Subduction Zone Geometry Model: U.S. Geological Survey data release, https://doi.org/10.5066/F7PV6JNV.
- Holm, R. and Richards, S.W., 2013. A re-evaluation of arc-continent collision and along-arc variation in the Bismarck Sea region, Papua New Guinea in Australian Journal of Earth Sciences, v. 60, p. 605-619.
- Holm, R.J., Richards, S.W., Rosenbaum, G., and Spandler, C., 2015. Disparate Tectonic Settings for Mineralisation in an Active Arc, Eastern Papua New Guinea and the Solomon Islands in proceedings from PACRIM 2015 Congress, Hong Kong ,18-21 March, 2015, pp. 7.
- Holm, R.J., Rosenbaum, G., Richards, S.W., 2016. Post 8 Ma reconstruction of Papua New Guinea and Solomon Islands: Microplate tectonics in a convergent plate boundary setting in Eartth Science Reviews, v. 156, p. 66-81.
- Johnson, R.W., 1976, Late Cainozoic volcanism and plate tectonics at the southern margin of the Bismarck Sea, Papua New Guinea, in Johnson, R.W., ed., 1976, Volcanism in Australia: Amsterdam, Elsevier, p. 101-116
- Koulali, A., tregoning, P., McClusky, S., Stanaway, R., Wallace, L., and Lister, G., 2015. New Insights into the present-day kinematics of the central and western Papua New Guinea from GPS in GJI, v. 202, p. 993-1004, doi: 10.1093/gji/ggv200
- Meyer, B., Saltus, R., Chulliat, a., 2017. EMAG2: Earth Magnetic Anomaly Grid (2-arc-minute resolution) Version 3. National Centers for Environmental Information, NOAA. Model. https://doi.org/10.7289/V5H70CVX
- Müller, R.D., Sdrolias, M., Gaina, C. and Roest, W.R., 2008, Age spreading rates and spreading asymmetry of the world’s ocean crust in Geochemistry, Geophysics, Geosystems, 9, Q04006, https://doi.org/10.1029/2007GC001743
- Sapiie, B., and Cloos, M., 2004. Strike-slip faulting in the core of the Central Range of west New Guinea: Ertsberg Mining District, Indonesia in GSA Bulletin, v. 116; no. 3/4; p. 277–293
- Tregoning, P., McQueen, H., Lambeck, K., Jackson, R. Little, T., Saunders, S., and Rosa, R., 2000. Present-day crustal motion in Papua New Guinea, Earth Planets and Space, v. 52, pp. 727-730.
- Wells, D., l., and Coppersmith, K.J., 1994. New Empirical Relationships among Magnitude, Rupture Length, Rupture Width, Rupture Area, and Surface Displacement in BSSA, vol. 84, no. 4, pp. 974-1002
References:
Return to the Earthquake Reports page.