This morning my time there was a magnitude M 6.8 earthquake in Ecuador.
https://earthquake.usgs.gov/earthquakes/eventpage/pt23077000/executive
I got a notification that there would not be a tsunami to reach the west coast of the USA. Because of the depth and magnitude, there was a low chance for a local tsunami as well (but we have been surprised before). I could not identify a tsunami on the tide gages in the region.
However, the USGS One Pager PAGER alert suggests that there may be significant casualties. I hope this estimate is incorrect. I have seen some videos online of significant building damage.
The USGS prepares models to estimate the chance of earthquake triggered landslides and earthquake induced liquefaction. These models suggest that there is a low chance for landslides but a moderate chance for liquefaction. See the ground failure section of the USGS earthquake page for more information.
I don’t always have the time to write a proper Earthquake Report. However, I prepare interpretive posters for these events.
Because of this, I present Earthquake Report Lite. (but it is more than just water, like the adult beverage that claims otherwise). I will try to describe the figures included in the poster, but sometimes I will simply post the poster here.
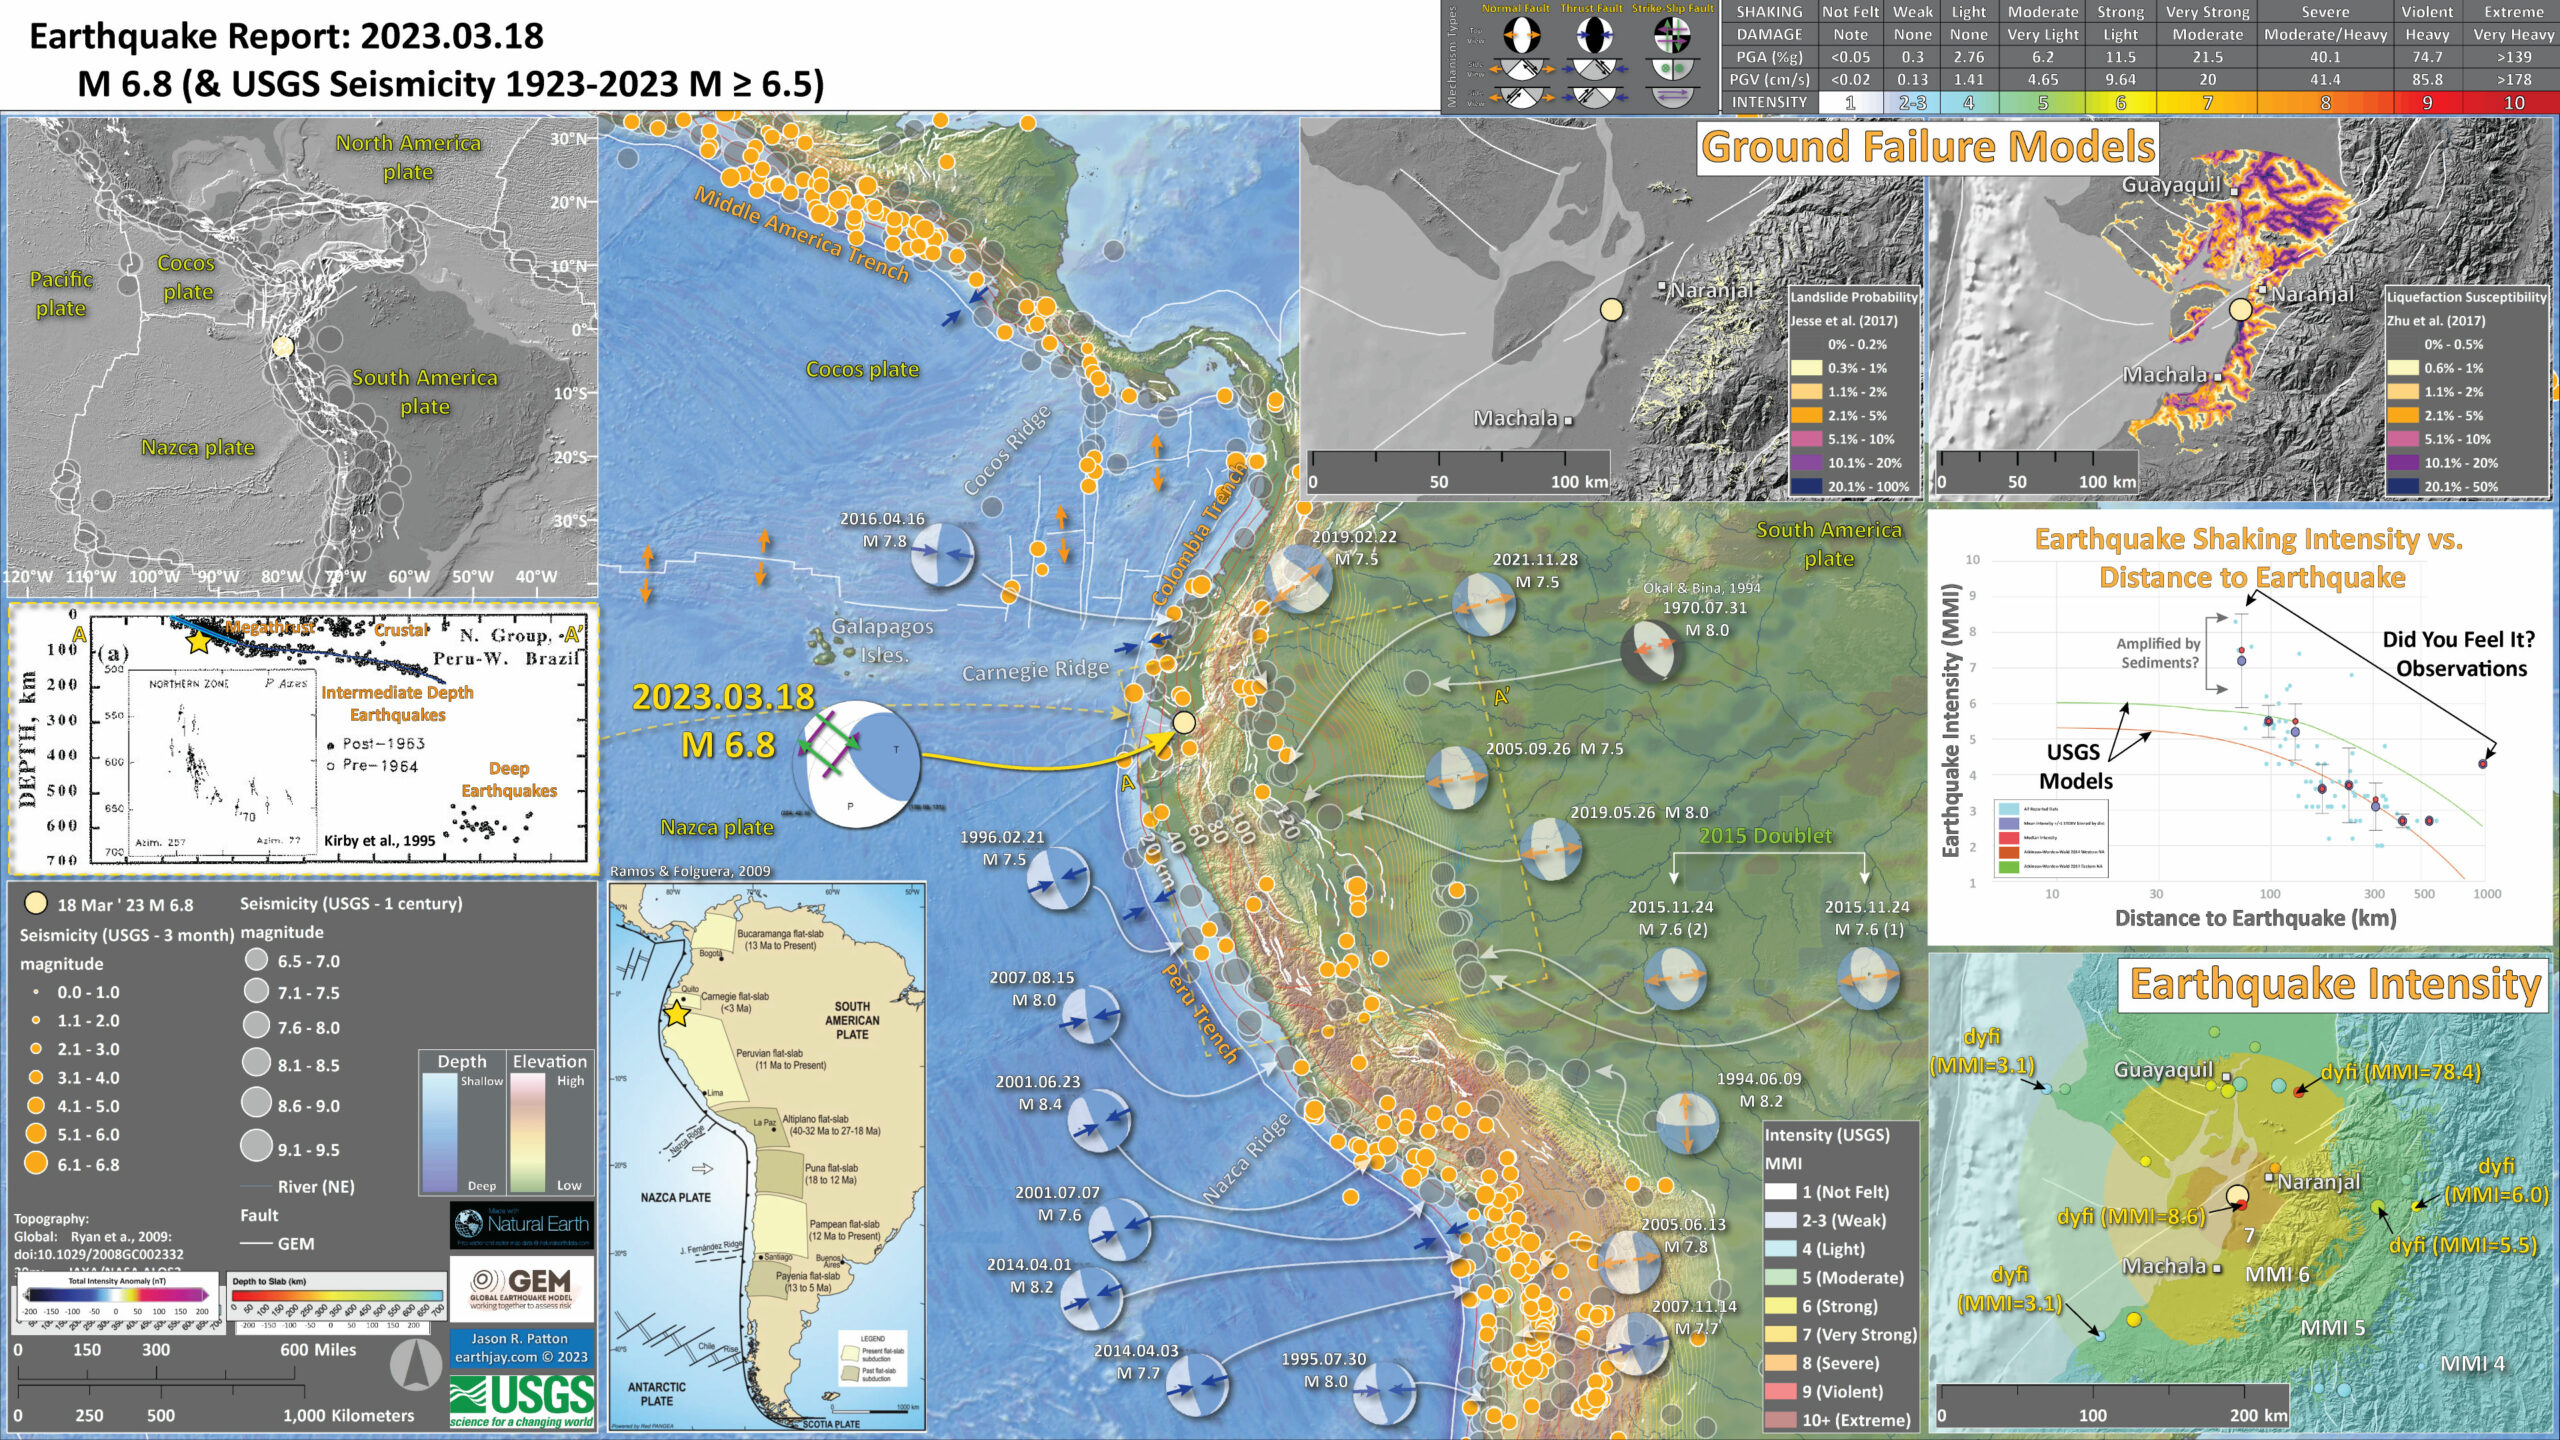
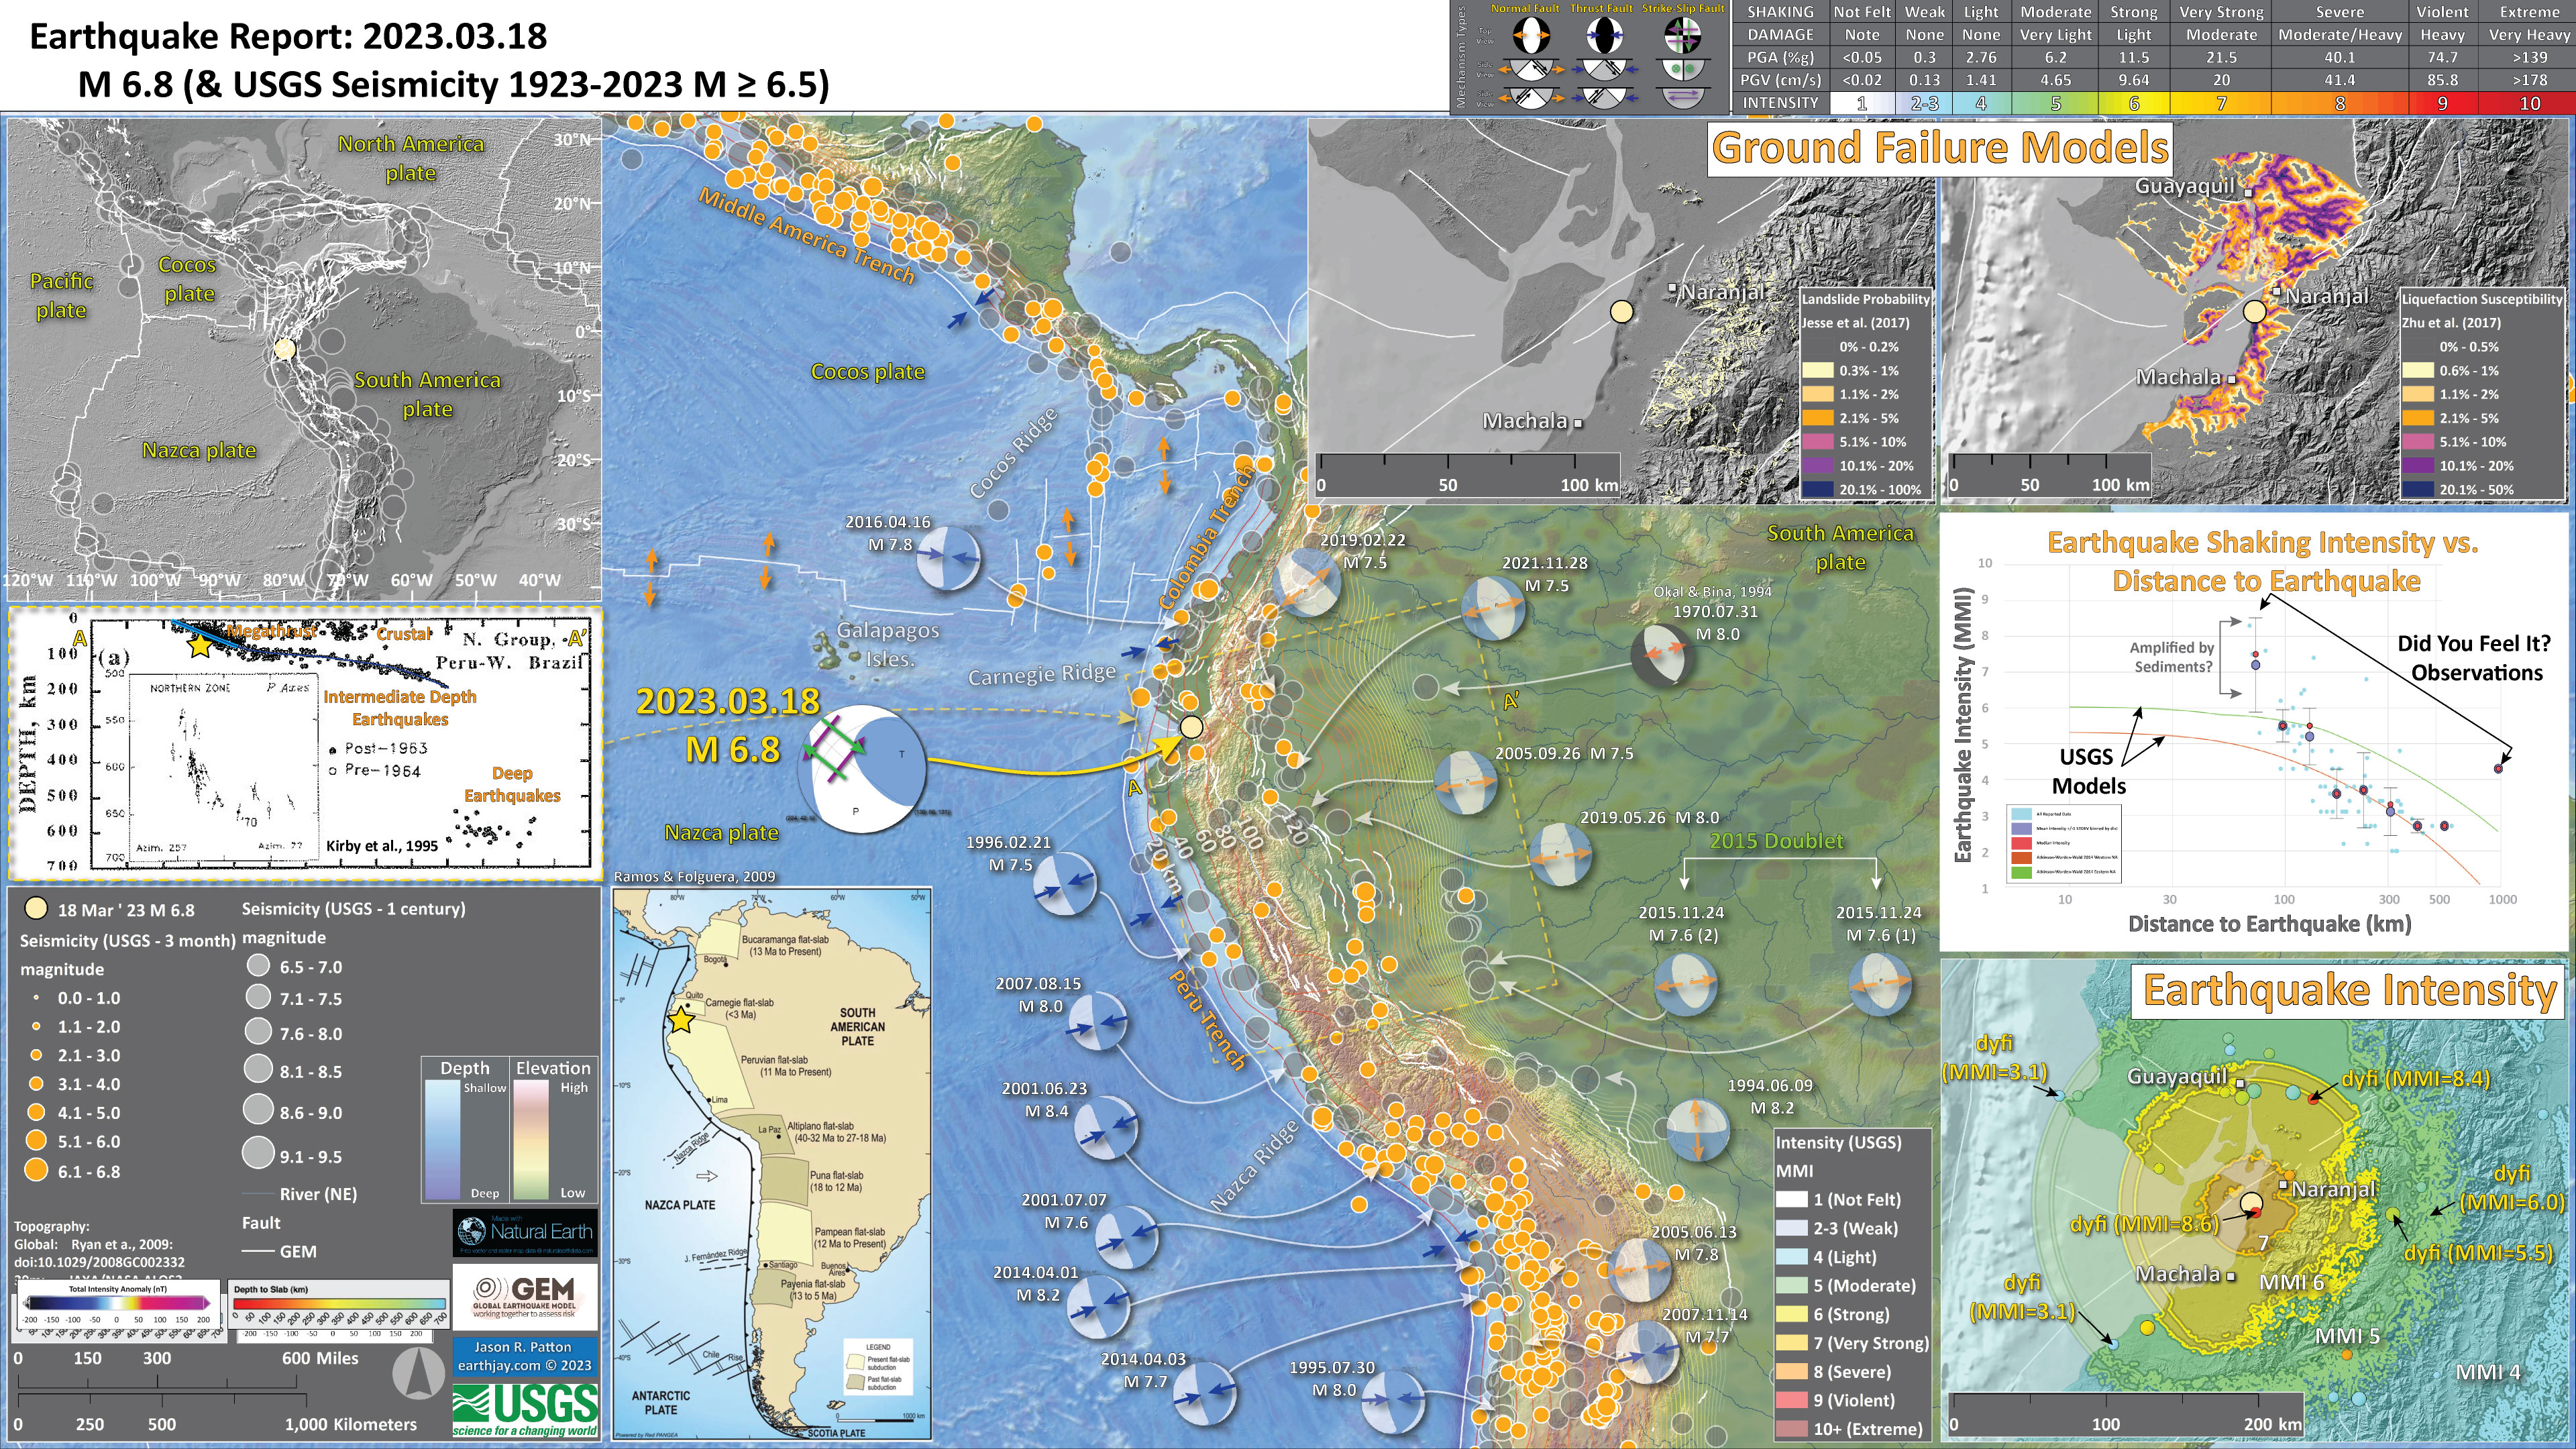
Below is my interpretive poster for this earthquake
- I plot the seismicity from the past month, with diameter representing magnitude (see legend). I include earthquake epicenters from 1923-2023 with magnitudes M ≥ 6.5.
- I plot the USGS fault plane solutions (moment tensors in blue and focal mechanisms in orange), possibly in addition to some relevant historic earthquakes.
- A review of the basic base map variations and data that I use for the interpretive posters can be found on the Earthquake Reports page. I have improved these posters over time and some of this background information applies to the older posters.
- Some basic fundamentals of earthquake geology and plate tectonics can be found on the Earthquake Plate Tectonic Fundamentals page.
- In the upper left corner is a large scale plate tectonic map showing the major plate boundary faults.
- In the lower left center is a map showing how the Nazca slab is configured in different locations (Ramos and Folguera, 2009).
- In the left center is a cross section showing seismicity in this region (Kirby et al., 1995). The source area for this plot is designated by a dashed yellow box on the map.
- In the upper right corner is a pair of maps that show the landslide probability (left) and the liquefaction susceptibility (right) for this M 6.8 earthquake. I spend more time describing these types of data here. Read more about these maps here.
- In the lower right corner I plot the USGS modeled intensity (Modified Mercalli Intensity scale, MMI) and the USGS “Did You Feel It?” observations (labeled in yellow). Above the map is a plot showing these same data plotted relative to distance from the earthquake. Read more about what these data sets are and what they represent in the report here.
I include some inset figures.
- Here is the map with 3 month’s seismicity plotted.
- 2010.02.27 M 8.8 Earthquake Review
- 2023.03.18 M 6.8 Ecuador
- 2021.11.28 M 7.5 Peru
- 2019.08.01 M 6.8 Chile
- 2019.06.14 M 6.4 Chile
- 2019.05.26 M 8.0 Peru
- 2019.05.12 M 6.1 Panama
- 2019.03.01 M 7.0 Peru
- 2019.02.22 M 7.5 Ecuador
- 2019.01.20 M 6.7 Chile
- 2018.08.21 M 7.3 Venezuela
- 2018.08.24 M 7.1 Peru
- 2018.04.02 M 6.8 Bolivia
- 2018.01.14 M 7.1 Peru
- 2018.01.15 M 7.1 Peru Update #1
- 2017.06.30 M 6.0 Ecuador
- 2017.04.24 M 6.9 Chile
- 2017.04.23 M 5.9 Chile
- 2016.12.25 M 7.6 Chile
- 2016.11.24 M 7.0 El Salvador
- 2016.11.04 M 6.4 Maule, Chile
- 2016.04.16 M 7.8 Ecuador
- 2016.04.16 M 7.8 Ecuador Update #1
- 2015.11.29 M 5.9 Argentina
- 2015.11.11 M 6.9 Chile
- 2015.11.24 M 7.6 Peru
- 2015.11.26 M 7.6 Peru Update
- 2015.09.16 M 8.3 Chile
- 2014.04.01 M 8.2 Chile
- 2010.02.27 M 8.8 Chile
- 1960.05.22 M 9.5 Chile
Chile | South America
General Overview
Earthquake Reports
Social Media
#EarthquakeReport for M6.7 #Sismo #Terremoto #Earthquake in #Ecuador
High felt intensity so far MMI 8
Probably in subducted Nazca plate based on depth
Read abt regional tectonics in 2026 report:https://t.co/oRoUsoAg9Nhttps://t.co/Yj2id26Hx0 pic.twitter.com/C5KOK6INZv
— Jason "Jay" R. Patton (@patton_cascadia) March 18, 2023
#EarthquakeReport for M6.7 #Sismo #Terremoto #Earthquake in #Ecuador@USGS_Quakes model suggests there's a good chance for earthquake induced liquefaction but low chance for landslides
Read abt regional tectonics in 2026 report:https://t.co/YtuvhYtJfWhttps://t.co/IqomwlFNwP pic.twitter.com/i0cxnA4nCP
— Jason "Jay" R. Patton (@patton_cascadia) March 18, 2023
#EarthquakeReport for M6.8 #Sismo #Terremoto #Earthquake in #Ecuador
High felt intensity exceeding MMI 8
High chance for significant damage and casualties :-(
Probably in subducted Nazca plate
observations of liquefactionposter/report for this event:https://t.co/0h3VIhOk79 pic.twitter.com/mdAWJ9hnAg
— Jason "Jay" R. Patton (@patton_cascadia) March 18, 2023
Mw=6.7, NEAR COAST OF ECUADOR (Depth: 65 km), 2023/03/18 17:12:53 UTC – Full details here: https://t.co/JUP39EWuRp pic.twitter.com/NaYScmwaCX
— Earthquakes (@geoscope_ipgp) March 18, 2023
The waves from the M6.8 earthquake in Ecuador are passing under the eastern US – you can seem them on this seismic station in VA. They are far too small to feel but not too small to be measured by sensitive seismic instruments. Data from @EarthScope_sci https://t.co/UGVApJ5ZzW pic.twitter.com/0rEVT37G2Y
— Wendy Bohon, PhD 🌏 (@DrWendyRocks) March 18, 2023
According to USGS PAGER, at least 6 million people experienced strong to very strong shaking and an additional 2 million people felt moderate shaking.
Unfortunately casualties are likely and damage may be widespread.
https://t.co/ozEi0E2Zlt pic.twitter.com/mrKOGB60b7
— Wendy Bohon, PhD 🌏 (@DrWendyRocks) March 18, 2023
Western South America, including Ecuador, is an area with high seismic hazard because this is where the Nazca Plate is diving down, or subducting, beneath the South American Plate. pic.twitter.com/Wz6xo5VmEb
— Wendy Bohon, PhD 🌏 (@DrWendyRocks) March 18, 2023
Some cases reported pic.twitter.com/tZmChNTiIe
— Willington Renteria 🇪🇨 (@wrenteria) March 18, 2023
Fuerte temblor en Tumbes🇵🇪
Un sismo de magnitud 7.0 ocurrió a las 12:12:52 p. m. del 18 de marzo de 2023, con el epicentro localizado en el mar, a 85 km al noreste de Zarumilla, Tumbes. Profundidad: 78 km.
Datos: IGP.
Origen: sismo intraplaca (Nasca).
No genera tsunami. pic.twitter.com/Xt3FNUJvuG— ASISMET (@Asismet_IF) March 18, 2023
The tectonic setting of this earthquake is actually pretty unusual – to the north, the Nazca plate subducts steadily. To the south, it dives to ~80 km depth, then flattens out for 400 km before sinking again. The earthquake occurred near the upper bend.
1/ https://t.co/2L23juB9Eb pic.twitter.com/FEn41itAD4
— Dr. Judith Hubbard (@JudithGeology) March 18, 2023
Today 6.7 Mw Southern #ECUADOR 🇪🇨, intermediate depth and strike-slip mechanism, suggests its association with the subducted "Alvarado 2 Ridge/Fracture Zone" (Nazca Slab tearing?). pic.twitter.com/9CBoL2AFWd
— Abel Seism🌏Sánchez (@EQuake_Analysis) March 18, 2023
Watch the earthquake waves from the M6.8 earthquake in #Ecuador cross over seismic stations in the US and parts of Canada. Data from @EarthScope_sci pic.twitter.com/UnP5QGyB64
— Wendy Bohon, PhD 🌏 (@DrWendyRocks) March 18, 2023
- Frisch, W., Meschede, M., Blakey, R., 2011. Plate Tectonics, Springer-Verlag, London, 213 pp.
- Hayes, G., 2018, Slab2 – A Comprehensive Subduction Zone Geometry Model: U.S. Geological Survey data release, https://doi.org/10.5066/F7PV6JNV.
- Holt, W. E., C. Kreemer, A. J. Haines, L. Estey, C. Meertens, G. Blewitt, and D. Lavallee (2005), Project helps constrain continental dynamics and seismic hazards, Eos Trans. AGU, 86(41), 383–387, , https://doi.org/10.1029/2005EO410002. /li>
- Jessee, M.A.N., Hamburger, M. W., Allstadt, K., Wald, D. J., Robeson, S. M., Tanyas, H., et al. (2018). A global empirical model for near-real-time assessment of seismically induced landslides. Journal of Geophysical Research: Earth Surface, 123, 1835–1859. https://doi.org/10.1029/2017JF004494
- Kreemer, C., J. Haines, W. Holt, G. Blewitt, and D. Lavallee (2000), On the determination of a global strain rate model, Geophys. J. Int., 52(10), 765–770.
- Kreemer, C., W. E. Holt, and A. J. Haines (2003), An integrated global model of present-day plate motions and plate boundary deformation, Geophys. J. Int., 154(1), 8–34, , https://doi.org/10.1046/j.1365-246X.2003.01917.x.
- Kreemer, C., G. Blewitt, E.C. Klein, 2014. A geodetic plate motion and Global Strain Rate Model in Geochemistry, Geophysics, Geosystems, v. 15, p. 3849-3889, https://doi.org/10.1002/2014GC005407.
- Meyer, B., Saltus, R., Chulliat, a., 2017. EMAG2: Earth Magnetic Anomaly Grid (2-arc-minute resolution) Version 3. National Centers for Environmental Information, NOAA. Model. https://doi.org/10.7289/V5H70CVX
- Müller, R.D., Sdrolias, M., Gaina, C. and Roest, W.R., 2008, Age spreading rates and spreading asymmetry of the world’s ocean crust in Geochemistry, Geophysics, Geosystems, 9, Q04006, https://doi.org/10.1029/2007GC001743
- Pagani,M. , J. Garcia-Pelaez, R. Gee, K. Johnson, V. Poggi, R. Styron, G. Weatherill, M. Simionato, D. Viganò, L. Danciu, D. Monelli (2018). Global Earthquake Model (GEM) Seismic Hazard Map (version 2018.1 – December 2018), DOI: 10.13117/GEM-GLOBAL-SEISMIC-HAZARD-MAP-2018.1
- Silva, V ., D Amo-Oduro, A Calderon, J Dabbeek, V Despotaki, L Martins, A Rao, M Simionato, D Viganò, C Yepes, A Acevedo, N Horspool, H Crowley, K Jaiswal, M Journeay, M Pittore, 2018. Global Earthquake Model (GEM) Seismic Risk Map (version 2018.1). https://doi.org/10.13117/GEM-GLOBAL-SEISMIC-RISK-MAP-2018.1
- Zhu, J., Baise, L. G., Thompson, E. M., 2017, An Updated Geospatial Liquefaction Model for Global Application, Bulletin of the Seismological Society of America, 107, p 1365-1385, https://doi.org/0.1785/0120160198
- Antonijevic, S.K., et a;l., 2015. The role of ridges in the formation and longevity of flat slabs in Nature, v. 524, p. 212-215, doi:10.1038/nature14648
- Bishop, B.T., Beck, S.L., Zandt, G., Wagner, L., Long, M., Knezevic Antonijevic, S., Kumar, A., and Tavera, H., 2017, Causes and consequences of flat-slab subduction in southern Peru: Geosphere, v. 13, no. 5, p. 1392–1407, doi:10.1130/GES01440.1.
- Chlieh, M. Mothes, P.A>, Nocquet, J-M., Jarrin, P., Charvis, P., Cisneros, D., Font, Y., Color, J-Y., Villegas-Lanza, J-C., Rolandone, F., Vallée, M., Regnier, M., Sogovia, M., Martin, X., and Yepes, H., 2014. Distribution of discrete seismic asperities and aseismic slip along the Ecuadorian megathrust in Earth and Planetary Science Letters, v. 400, p. 292–301
- Kumar, A., et al., 2016. Seismicity and state of stress in the central and southern Peruvian flat slab in EPSL, v. 441, p. 71-80. http://dx.doi.org/10.1016/j.epsl.2016.02.023
- Rhea, S., Hayes, G., Villaseñor, A., Furlong, K.P., Tarr, A.C., and Benz, H.M., 2010. Seismicity of the earth 1900–2007, Nazca Plate and South America: U.S. Geological Survey Open-File Report 2010–1083-E, 1 sheet, scale 1:12,000,000.
- Villegas-Lanza, J. C., M. Chlieh, O. Cavalié, H. Tavera, P. Baby, J. Chire-Chira, and J.-M. Nocquet (2016), Active tectonics of Peru: Heterogeneous interseismic coupling along the Nazca megathrust, rigid motion of the Peruvian Sliver, and Subandean shortening accommodation, J. Geophys. Res. Solid Earth, 121, 7371–7394, https://doi.org/10.1002/2016JB013080.
- Wagner, L.S., and Okal, E.A., 2019. The Pucallpa Nest and its constraints on the geometry of the Peruvian Flat Slab in Tectonophysics, v. 762, p. 97-108, https://doi.org/10.1016/j.tecto.2019.04.021
- Yepes,H., L. Audin, A. Alvarado, C. Beauval, J. Aguilar, Y. Font, and F. Cotton (2016), A new view for the geodynamics of Ecuador: Implication in seismogenic source definition and seismic hazard assessment, Tectonics, 35, 1249–1279, https://doi.org/10.1002/2015TC003941.
References:
Basic & General References
Specific References
Return to the Earthquake Reports page.
- Sorted by Magnitude
- Sorted by Year
- Sorted by Day of the Year
- Sorted By Region