We just had a large magnitude earthquake in the New Britain region, probably on the megathrust (subduction zone fault). There was a swarm of seismic activity in this region in July and August of 2010. Further to the southeast, there was a flurry of seismic activity in 2014. Here is a page I put together about that 2014 swarm. There were some other earthquakes even further to the south that I discuss here. Here is the USGS website for today’s earthquake of magnitude Mw = 7.5. The USGS put together an educational poster for the tectonics of this region here.
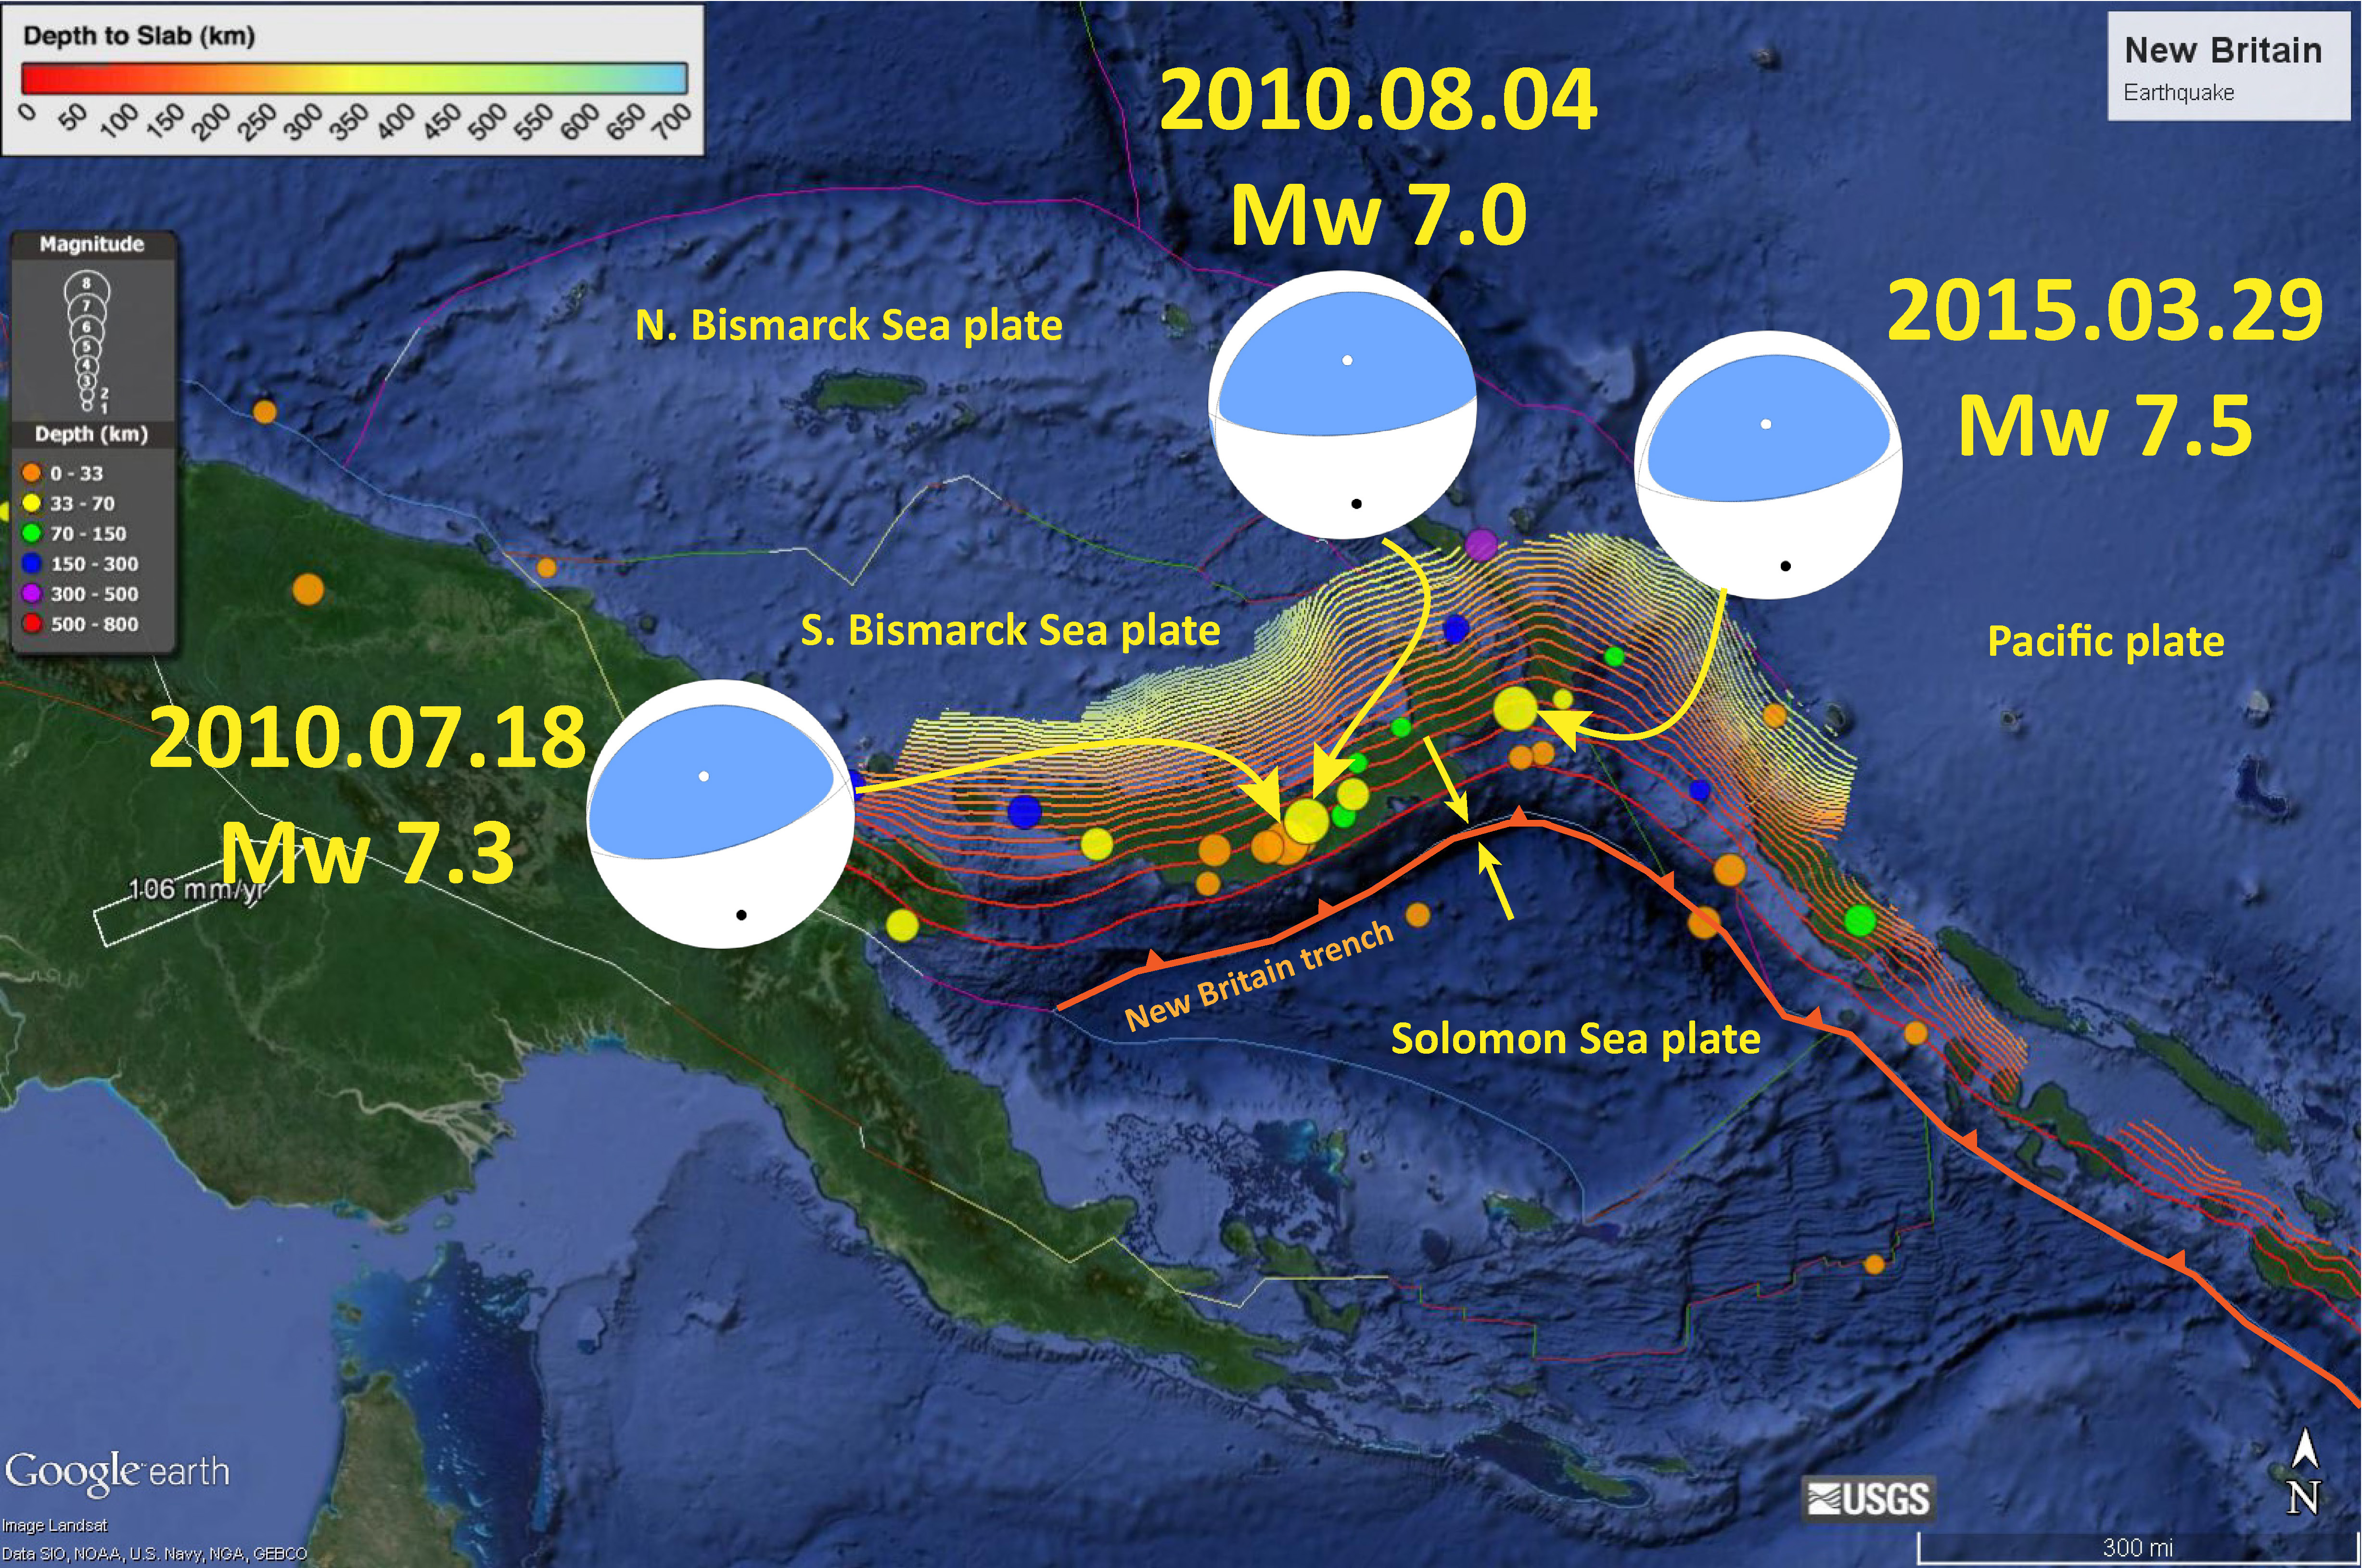
This is a map showing the region. I have plotted the suspect subduction zone fault in Orange (with triangles on the hanging wall side of the fault). The moment tensor for today’s earthquake is on the right and the moment tensors from two of the 2010 earthquakes are on the left. Depth contours for an estimate of the depth of the subduction zone fault (aka the slab depth) are plotted in colored lines (Hayes et al., 2012). These contours are based on seismicity, so have considerable uncertainty.
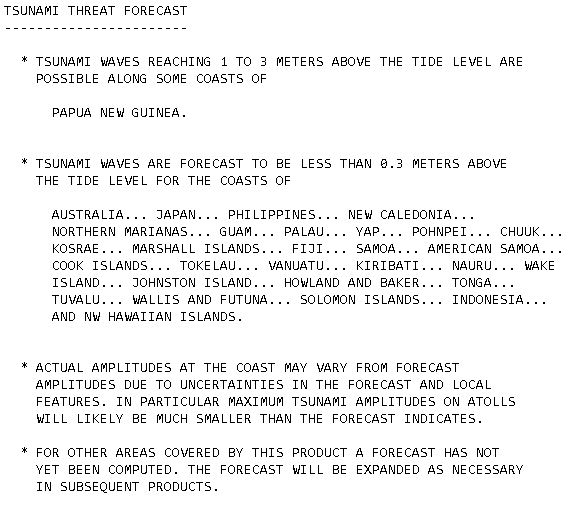
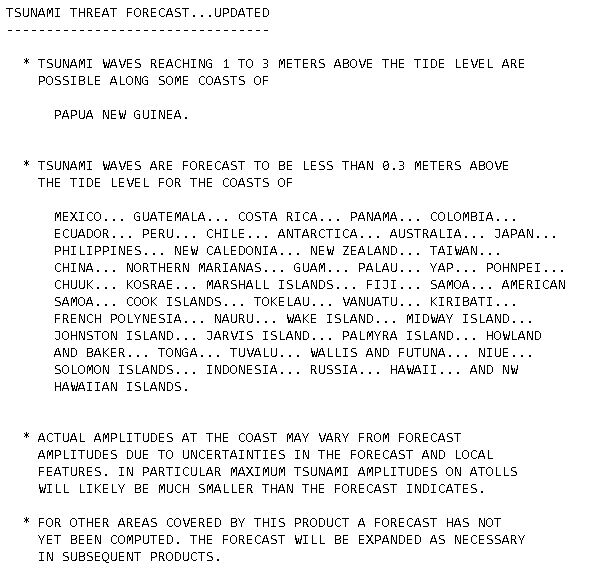
This is an earthquake that may generate deformation of the seafloor that may lead to a tsunami. The magnitude is small and the hypocentral depth is about 64 km, so if there were a tsunami, it would probably be very small. The Pacific Tsunami Warning Center in Hawaii issued a threat to the southwest Pacific. Here is their Tsunami Threat Forecast:
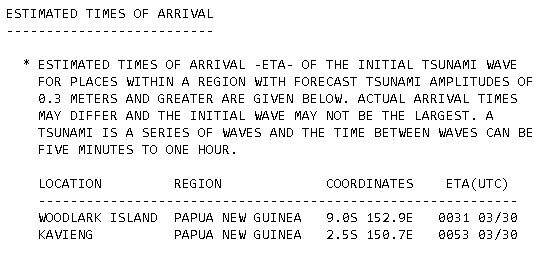
Here is their estimated time of arrival for a couple locations:
Here is a map modified from Hamilton (1979). This shows the relative motion between the Solomon Sea plate and the South Bismarck plate. There are some right-lateral transform faults in the South Bismarck plate (the upper plate), but today’s moment tensor and hypocentral depth support the hypothesis that this was on the megathrust.

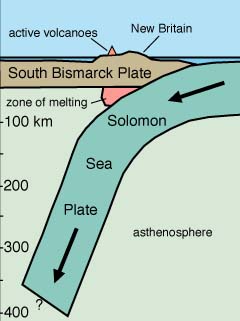
This is a cross section that goes along with the above map. This shows the configuration of the megathrust. I got both of the graphics from Oregon State University, CEOAS here.
The USGS put together a poster for the 2010 earthquake swarm here.
- Here is a series of links to the USGS web sites for the earthquakes in 2010.
- 2010-07-18 13:04:09 (UTC) M 6.9
- 2010-07-18 13:34:59 (UTC) M 7.3
- 2010-07-20 19:18:20 (UTC) M 6.3
- 2010-08-04 22:01:43 (UTC) M 7.0
Here is an update of the threat from the PTWC.
This shows a model estimate of ground motions (shaking intensity) using the Modified Mercalli Intensity scale. This is just a model and has many assumptions that may be, at least partially, incorrect. The MMI scale is shown on the “Pager” graphic below.

This shows the estimated threat to people and their belongings. This is based on the modeling of ground motions as represented in the map above.

For example, this is a map that shows the shaking intensity from real data (peoples’ observations using the USGS “Did You Feel It?” website).

Here is a primer for those who would like to understand focal mechanisms better (from the USGS). Normal earthquakes are extensional, reverse earthquakes are compressional, and strike-slip earthquakes are the result of shear.
-
References:
- Hayes, G. P., D. J. Wald, and R. L. Johnson (2012), Slab1.0: A three-dimensional model of global subduction zone geometries, J. Geophys. Res., 117, B01302, doi:10.1029/2011JB008524
- Hamilton, W., 1979, Tectonics of the Indonesian region: U.S. Geological Survey Prof. Paper 1078.
Love your info connections!!! Thank you for all of your work! :)