I am currently taking a break following an excellent Seismological Society of America Meeting in San Juan Puerto Rico.
I presented a couple posters and one talk on the results from our USGS Powell Center meeting where we developed a basic logic tree for probabilistic tsunami hazard assessment for the Cascadia subduction zone.
Last night (my time, in Arecibo) there was an earthquake along the subduction zone, a convergent plate boundary, that forms the Kermadec trench (a deep sea trench, much like the Mariana trench).
Initially, there was one M 7.3 earthquake. I received a text message from the National Tsunami Warning Center stating that there was no tsunami risk for California, Oregon, Washington, British Columbia, and Alaska.
https://earthquake.usgs.gov/earthquakes/eventpage/us6000k6mg/executive
Shortly after that, there were then two M7.3 earthquakes. One was located east of the trench (an earthquake within the Pacific plate, much like the March 2023 M 7.3 earthquake, which was also in a similar location). The other earthquake was located west of the trench and had a depth that suggested it was a megathrust subduction zone earthquake.
Because these earthquakes happened at nearly the same time and had the same magnitude, I suspected that they were actually the same earthquake but had been automatically located in two locations (possibly due to something about the seismic waves that complicated the automatic location algorithm). In a few minutes, this was all worked out and the two earthquake pages began to show the same information, a single M 7.3 that was a subduction zone interface earthquake (an earthquake that slipped the megathrust fault).
Within a few more minutes, the magnitude was revised to be M 7.1. This is a much smaller earthquake than a M 7.3 but still quite significant. People on Raoul Island, about 75 km from the epicenter, reported strong ground shaking (intensity MMI 8, though initially reported as MMI 9).
After a few tweets, I went over to the tide gage websites that I monitor when there are subduction zone earthquakes. I often look at the UNESCO Sea Level Monitoring Facility website first. There is a map and one may click on the dots that represent most of the tide gages around the globe.
This page provides basic information about water surface elevations. One may take a quick look to see if there are excursions in the sea level data, possibly related to tsunami.
Then, when I am ready to download some data so that I may plot these data I head over to the European Commission World Sea Levels website. This is also a map interface and it takes a little more effort to learn how to operate the website to obtain the data one likes. These data are in a better format than the UNESCO site since they provide the observations, the tide prediction, and the excursion (i.e., the tsunami with the tide data removed).
I prefer to prepare my own plots so that I can control their graphical composition, these organizations create plots automatically and they are not always the best looking; I download these data, open them in excel, plot, then place them in adobe illustrator so that I can annotate them.
OK, back to the earthquake.
There was a magnitude M8.1 subduction zone earthquake in this area on 4 March 2021. Here is my poster for that earthquake, where I show that several large earthquakes happened closely in space and in time. It was phenomenal that these 3 earthquakes also generated 3 tsunami that showed up on tide gages across the south Pacific.
Yesterday’s M 7.1 happened within the area of aftershocks from the M 8.1. So, I interpret this to be an aftershock of the M8.1. (Though I could easily be convinced that it was instead simply a triggered earthquake; it also followed the 15 March 2023 M 7.0 earthquake which was directly east of yesterday’s M 7.1.
The earlier M 8.1 and yesterday’s M 7.1 earthquakes were along the subduction zone, where the Pacific plate subducts beneath the Australia plate. This subduction zone is quite active with many analogical historical earthquakes of similar magnitude in this area and also further to the north and to the south.
We may recall the 15 January 2022 Hunga Tonga eruption that generated a large trans-Pacific tsunami. Here is my report on that event. Here is a web page that I put together for the California Geological Survey where I serve the public in the Seismic Hazards Program and Tsunami Unit (actually, I cannot share that page as it does not work outside of the USA, sadly; I will add a link once I am back home).
At the bottom of this report are a series of tweets that include some additional educational material. Check out the EarthScope Consortium tweets!
Below is my interpretive poster for this earthquake
- I plot the seismicity from the past month, with diameter representing magnitude (see legend). I include earthquake epicenters from 1923-2023 with magnitudes M ≥ 7.0 in one version.
- I plot the USGS fault plane solutions (moment tensors in blue and focal mechanisms in orange), possibly in addition to some relevant historic earthquakes.
- A review of the basic base map variations and data that I use for the interpretive posters can be found on the Earthquake Reports page. I have improved these posters over time and some of this background information applies to the older posters.
- Some basic fundamentals of earthquake geology and plate tectonics can be found on the Earthquake Plate Tectonic Fundamentals page.
- In the upper left corner is a map that shows the major plate tectonic boundaries.
- In the lower right corner is a map that shows the ground shaking from the earthquake, with color representing intensity using the Modified Mercalli Intensity (MMI) scale. The closer to the earthquake, the stronger the ground shaking. The colors on the map represent the USGS model of ground shaking. There is one location with a report from people who posted information on the USGS Did You Feel It? part of the website for this earthquake. There are things that affect the strength of ground shaking other than distance, which is why the reported intensities are different from the modeled intensities.
- In the upper right corner is a plot that includes the 2021 M 8.1 & M 7.4 and 2023 M 7.0 earthquakes. I include the aftershocks from about one week after the M 8.1 and outline these aftershocks to show how yesterday’s M 7.1 is within this area.
- To the left of the aftershock map I include the USGS earthquake fault slip model. The colors represent the amount of slip that this fault experienced during the earthquake. We can see that they think the fault slipped up to about 1.25 meters (about 4 feet).
- To the left are tide gage plots from the tide gages on Raoul Island (shown on map). Anthony Lomax and I debated on Twitter about whether these signals were tsunami or seismic waves. We concluded that these are most likely tsunami waves because of their arrival time (seismic waves would have arrived sooner), their duration (seismic waves would not have lasted as long in time), and their amplitude & wave heights (seismic waves would have been smaller in size). Twitter is such a helpful place to discuss our observations in real time! I learn so much from my colleagues. It really is such a wonderful community that we have developed over the years!
- In the lower right center is a map from Benz et al. (2011) that shows earthquakes with circles that represent magnitude (diameter) and depth (color). Deeper = blue & shallower = red. There is a cross section (cut into the earth) profile through this seismicity (the blue line J-J’). I plot the M 7.0 as a blue star.
- To the left of the map is cross section J-J’ that shows earthquake hypocenters (3-D locations) in the region of the M 7.0 earthquake.
I include some inset figures. Some of the same figures are located in different places on the larger scale map below.
- Here is the map with a month’s seismicity plotted.

Tsunami
- Here I present the tide gage data from this earthquake and tsunami.
- These two gages are located on opposite sides of Raoul Island. Can you tell which is on the north side and which is on the south side? Go to the tide gage websites I link to above to see if you are correct.
- The size of the wave is similar for both of these gages (about 20 cm wave height).
- In the legend, one may learn the difference between wave height and amplitude. Wave height is the vertical distance between the peak wave and the trough of the wave. The amplitude is the height of the wave peak above the ambient water surface (the ambient tide level).
- Here is the map from Timm et al., 2013.
- Here is the tectonic map from Ballance et al., 1999.
- Here is a great summary of the fault mechanisms for earthquakes along this plate boundary (Yu, 2013).
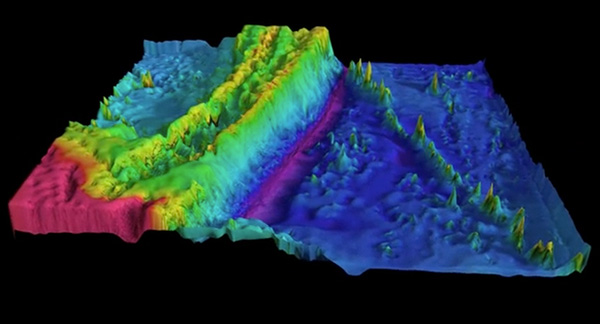
- Here is a great visualization of the Kermadec Trench from Woods Hole.
- Here is another map of the bathymetry in this region of the Kermadec trench. This was produced by Jack Cook at the Woods Hole Oceanographic Institution. The Lousiville Seamount Chain is clearly visible in this graphic.
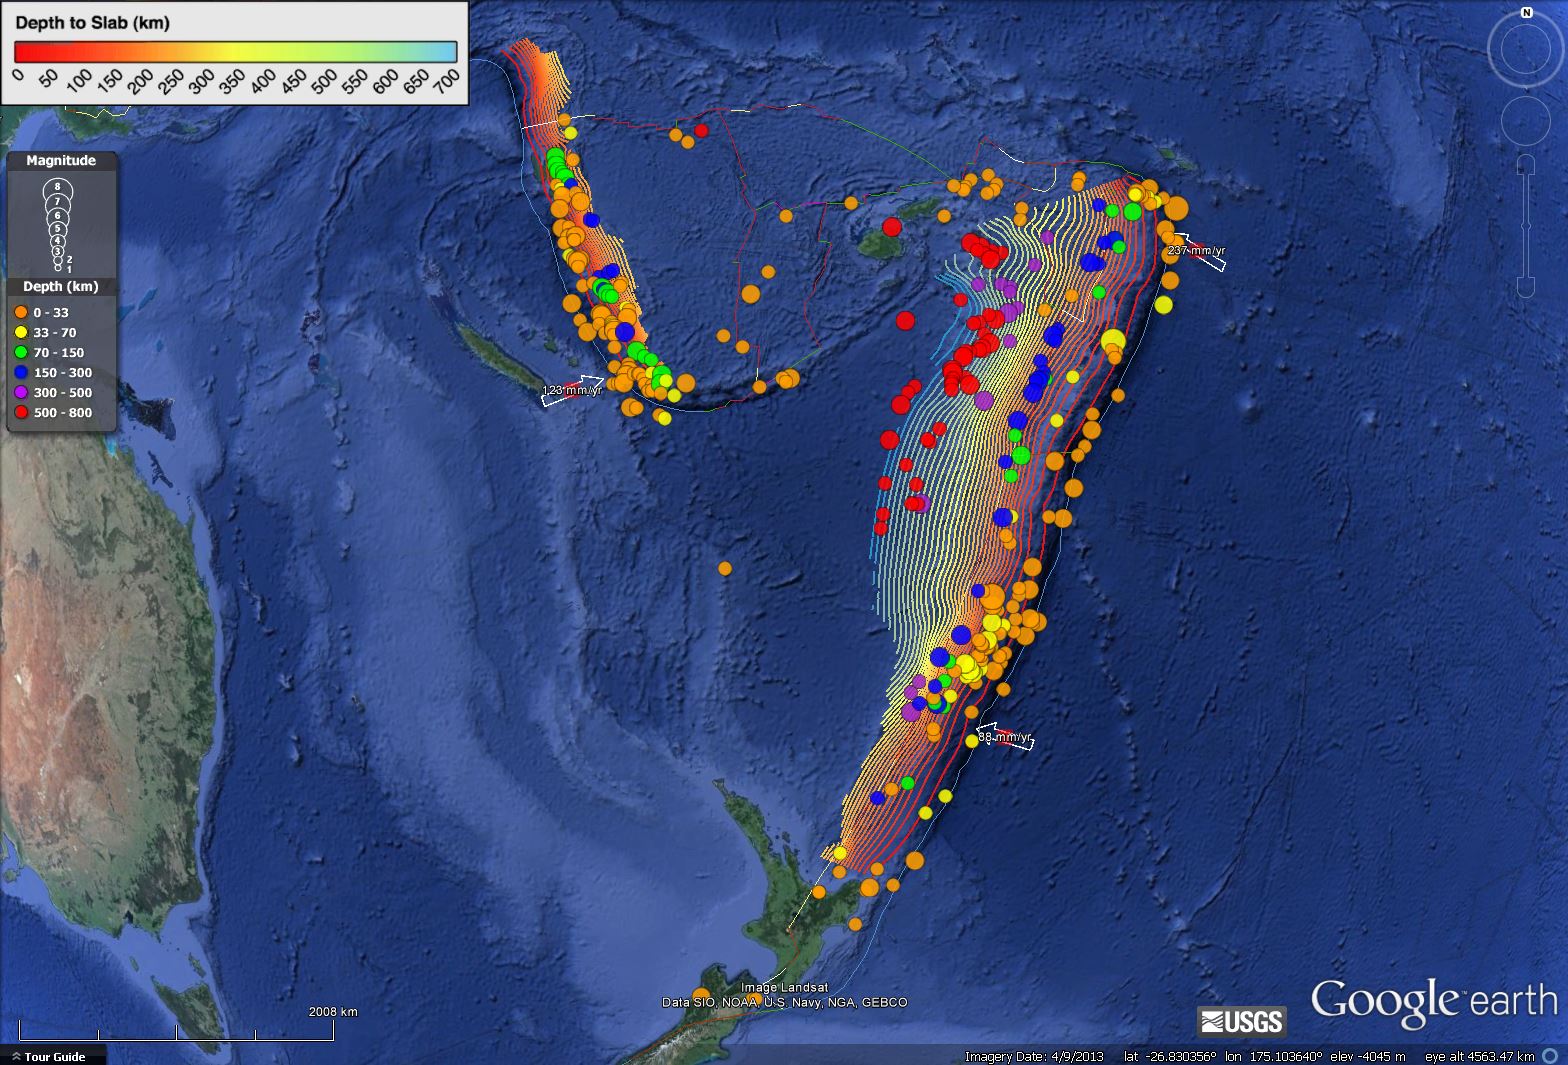
- I put together an animation of seismicity from 1965 – 2015 Sept. 7. Here is a map that shows the entire seismicity for this period. I plot the slab contours for the subduction zone here. These were created by the USGS (Hayes et al., 2012).
- Here is the animation. Download the mp4 file here. This animation includes earthquakes with magnitudes greater than M 6.5 and this is the kml file that I used to make this animation.
- Here is the oblique view of the slab from Green (2003). Some of the following figures are for the Tonga subduction zone, the same plate boundary as Kermadec, with some slightly different attributes.
- Here are figures from Richards et al. (2011) with their figure captions below in blockquote.
- The main tectonic map
- Here is the map showing the current configuration of the slabs in the region.
- This is the cross section showing the megathrust fault configuration based on seismic tomography and seismicity.
- Here is their time step interpretation of the slabs that resulted in the second figure above.
Some Relevant Discussion and Figures
Bathymetric map of the Tonga–Kermadec arc system. Map showing the depth of the subducted slab beneath the Tonga–Kermadec arc system. Louisville seamount ages are after Koppers et al.49 ELSC, eastern Lau-spreading centre; DSDP, Deep Sea Drilling Programme; NHT, Northern Havre Trough; OT, Osbourn Trough; VFR, Valu Fa Ridge. Arrows mark total convergence rates.
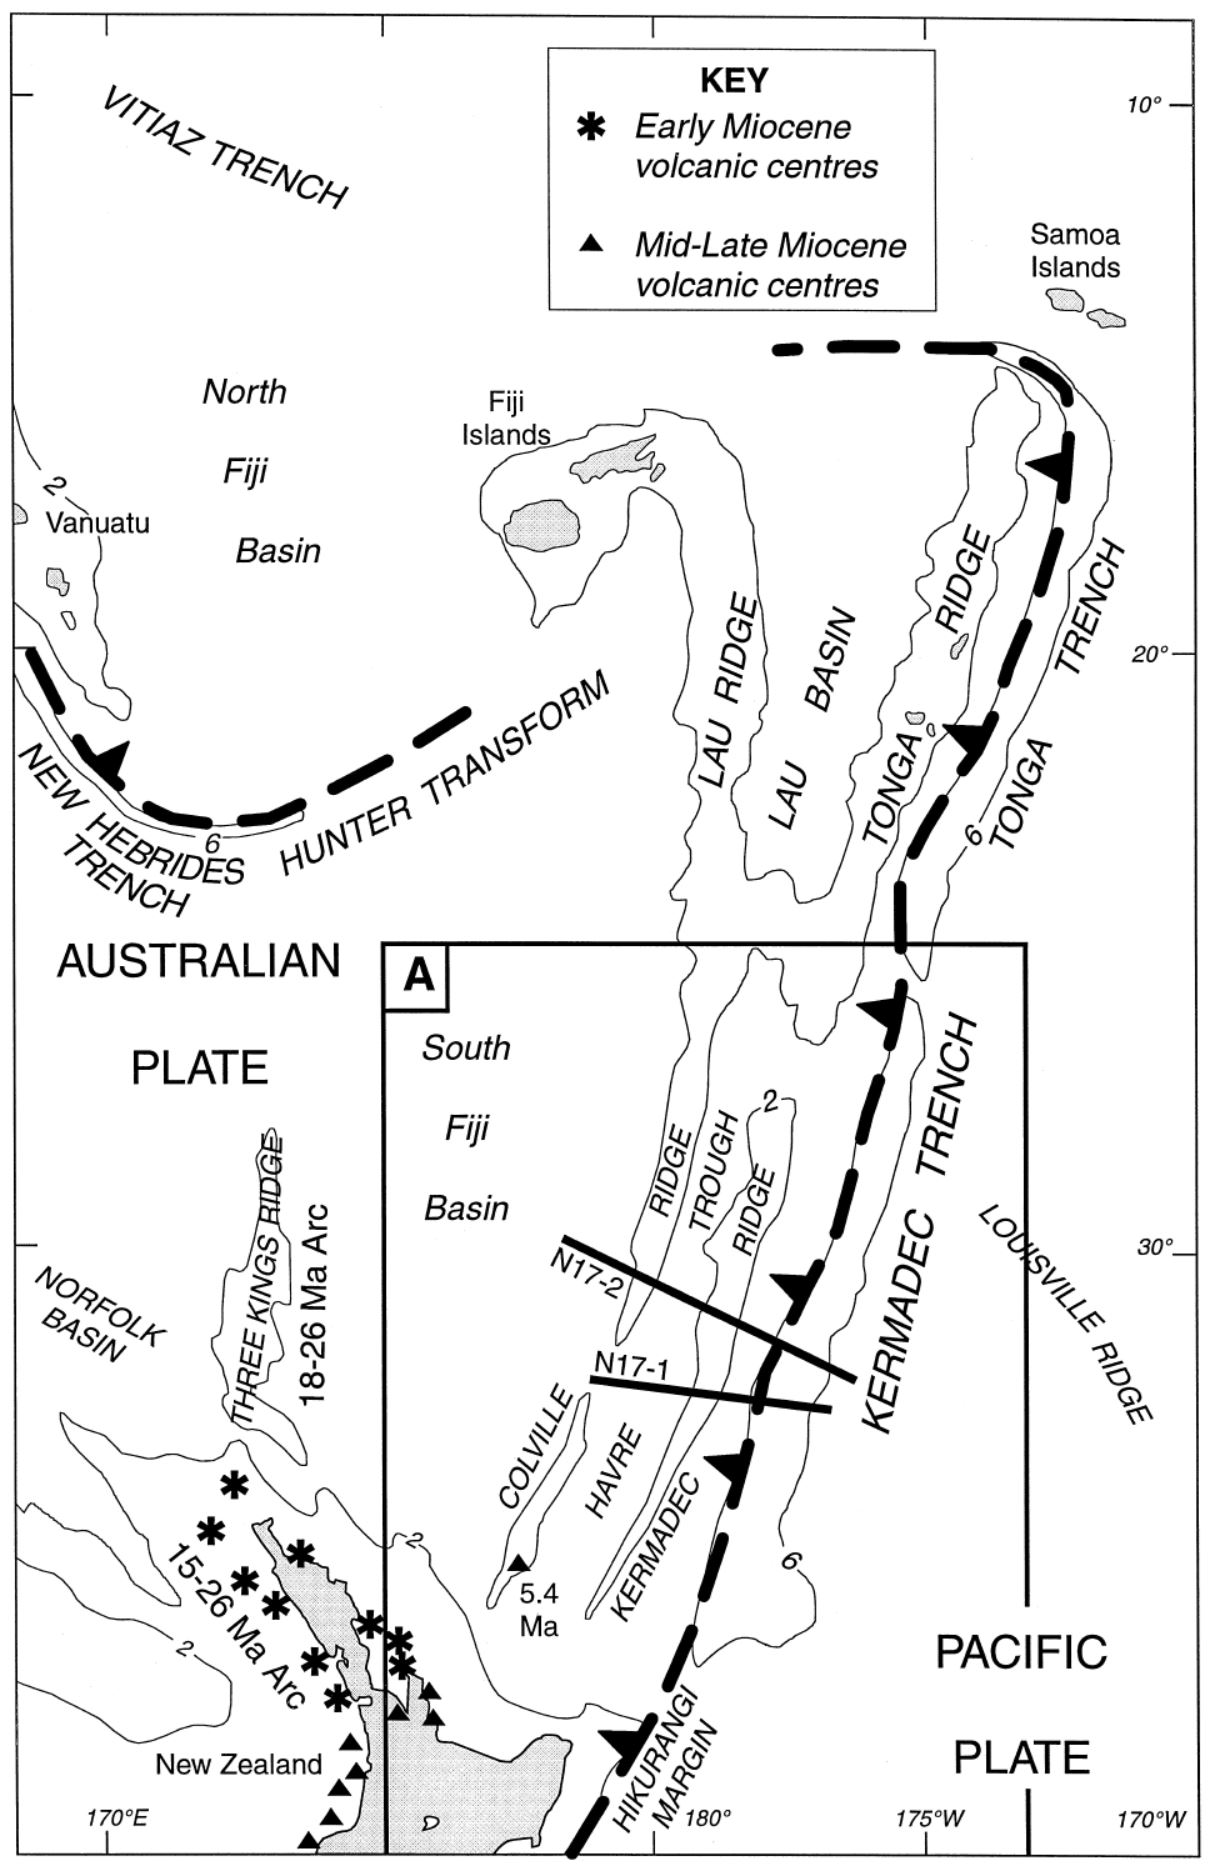
Map of the Southwest Pacific Ocean showing the regional tectonic setting and location of the two dredged profiles. Depth contours in kilometres. The presently active arcs comprise New Zealand–Kermadec Ridge–Tonga Ridge, linked with Vanuatu by transforms associated with the North Fiji Basin. Colville Ridge–Lau Ridge is the remnant arc. Havre Trough–Lau Basin is the active backarc basin. Kermadec–Tonga Trench marks the site of subduction of Pacific lithosphere westward beneath Australian plate lithosphere. North and South Fiji Basins are marginal basins of late Neogene and probable Oligocene age, respectively. 5.4sK–Ar date of dredged basalt sample (Adams et al., 1994).
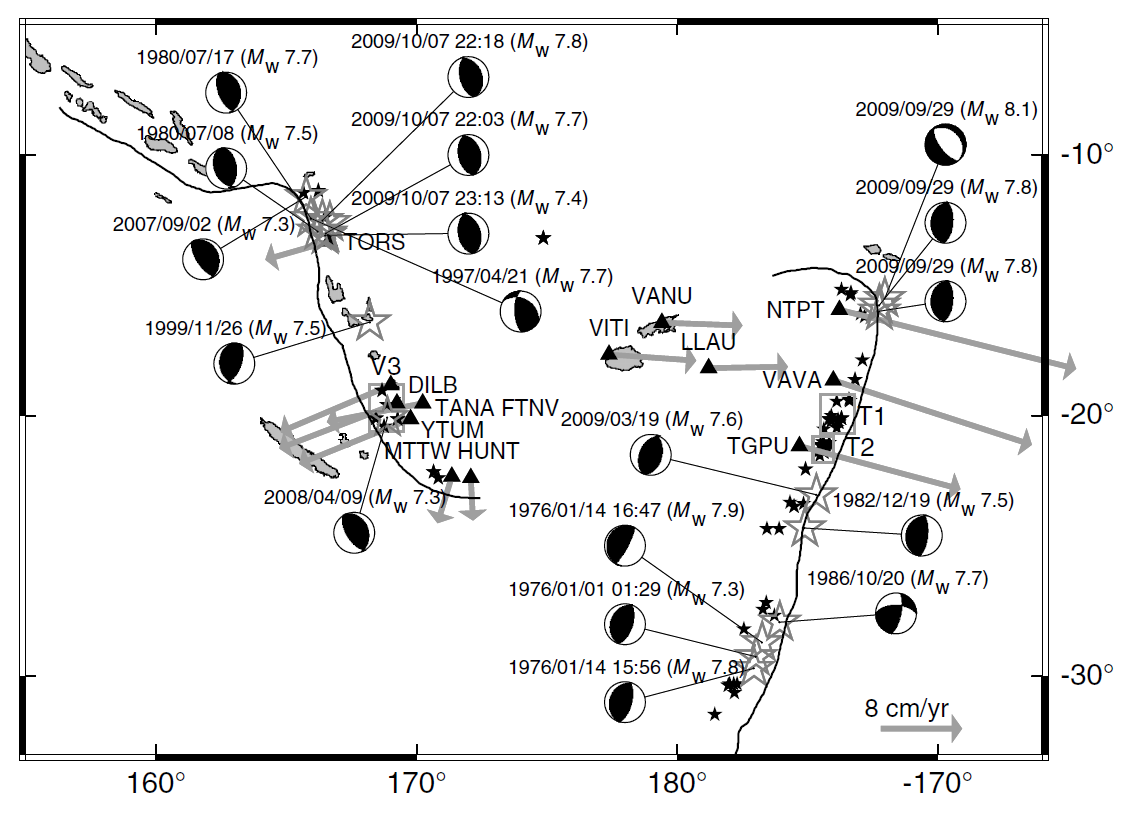
Large subduction-zone interplate earthquakes (large open gray stars) labeled with event date, Mw, GCMT focal mechanisms, and GPS velocity vectors (gray arrows and black triangles labeled with station name). GPS velocities are listed in Table 3. Black lines indicate the Tonga–Kermadec and Vanuatu trenches. Note that the 2009/09/29 Samoa–Tonga outer trench-slope event (Mw 8.1) triggered large interplate doublets (both of Mw 7.8; Lay et al., 2010). The Pacific plate subducts westward beneath the Australian plate along the Tonga–Kermadec trench, whereas the Australian plate subducts eastward beneath the Vanuatu arc and North Fiji basin. The opposite orientation between the Tonga–Kermadec and Vanuatu subduction systems is due to complex and broad back-arc extension in the Lau and North Fiji basins (Pelletier et al., 1998).
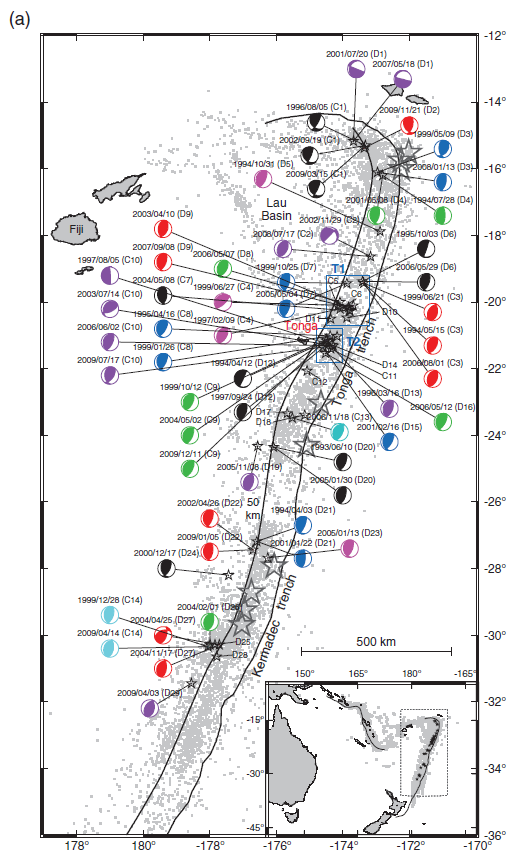
Regional map of moderate-sized (mb > 4:7) shallow-focus repeating earthquakes and background seismicity along the (a) Tonga–Kermadec and (b) Vanuatu (former New Hebrides) subduction zones. Shallow repeating earthquakes (black stars) and their available Global Centroid Moment Tensor (GCMT; Dziewoński et al., 1981; Ekström et al., 2003) are labeled with event date and doublet/cluster id where applicable. Colors of GCMT are used to distinguish nearby different repeaters. Source parameters for the clusters and doublets are listed in Tables 1 and 2. Background seismicity is shown as gray dots and large interplate earthquakes (moment magnitude, Mw > 7:3) since 1976 are shown as large open gray stars. Black lines indicate the trench (Bird, 2003) and slab contour at 50-km depth (Gudmundsson and Sambridge, 1998). Repeating earthquake clusters in the (a) T1 and T2 plate-interface regions in Tonga and (b) V3 plate-interface region in Vanuatu are used to study the fault-slip rate ( _d). A regional map of the Tonga–Kermadec–Vanuatu subduction zones is
shown in the inset figure, with the gray dotted box indicating the expanded region in the main figure.
Kermadec Trench from Woods Hole Oceanographic Inst. on Vimeo.

Earthquakes and subducted slabs beneath the Tonga–Fiji area. The subducting slab and detached slab are defined by the historic earthquakes in this region: the steeply dipping surface descending from the Tonga Trench marks the currently active subduction zone, and the surface lying mostly between 500 and 680 km, but rising to 300 km in the east, is a relict from an old subduction zone that descended from the fossil Vitiaz Trench. The locations of the mainshocks of the two Tongan earthquake sequences discussed by Tibi et al. are marked in yellow (2002 sequence) and orange (1986 series). Triggering mainshocks are denoted by stars; triggered mainshocks by circles. The 2002 sequence lies wholly in the currently subducting slab (and slightly extends the earthquake distribution in it),whereas the 1986 mainshock is in that slab but the triggered series is located in the detached slab,which apparently contains significant amounts of metastable olivine
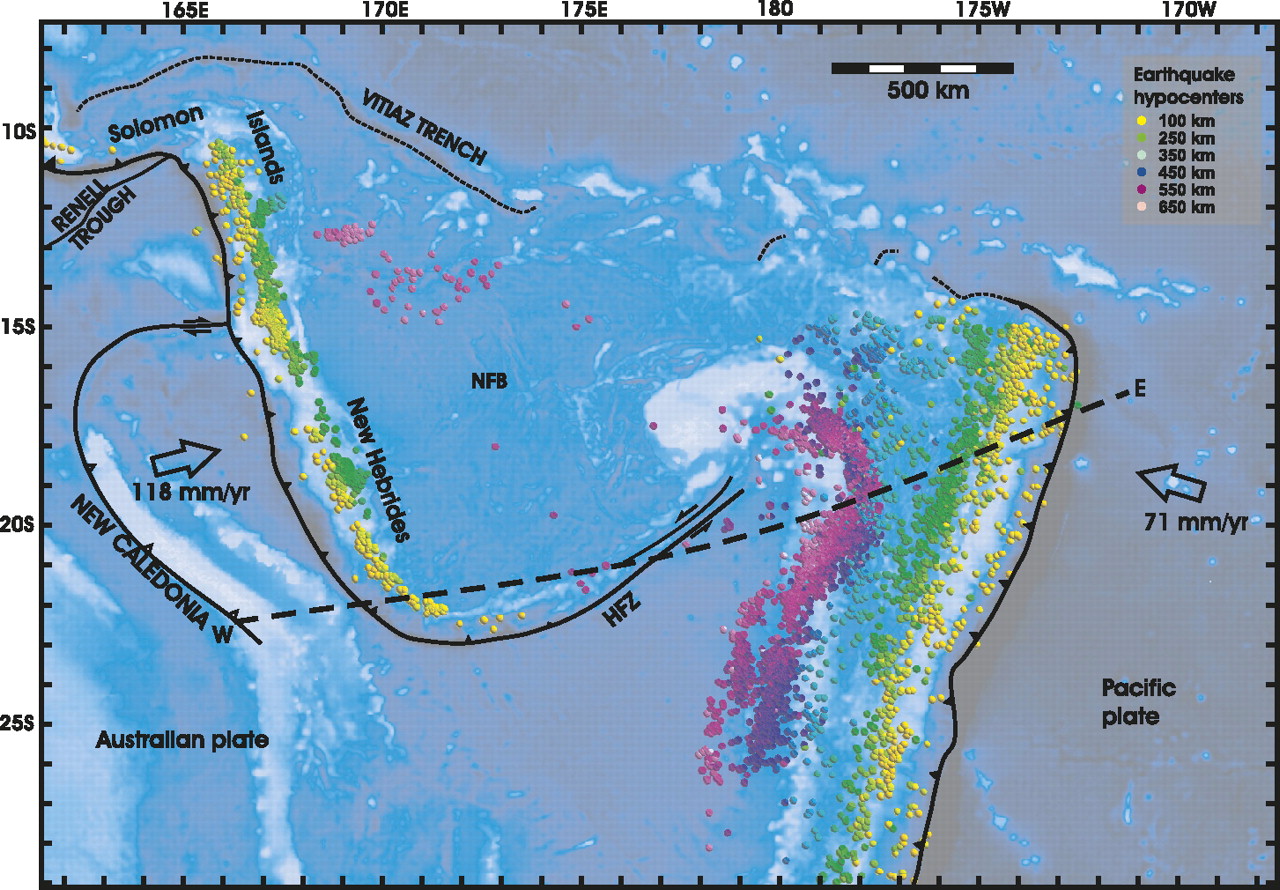
bathymetry, and major tectonic element map of the study area. The Tonga and Vanuatu subduction systems are shown together with the locations of earthquake epicenters discussed herein. Earthquakes between 0 and 70 km depth have been removed for clarity. Remaining earthquakes are color-coded according to depth. Earthquakes located at 500–650 km depth beneath the North Fiji Basin are also shown. Plate motions for Vanuatu are from the U.S. Geological Survey, and for Tonga from Beavan et al. (2002) (see text for details). Dashed line indicates location of cross section shown in Figure 3. NFB—North Fiji Basin; HFZ—Hunter Fracture Zone.
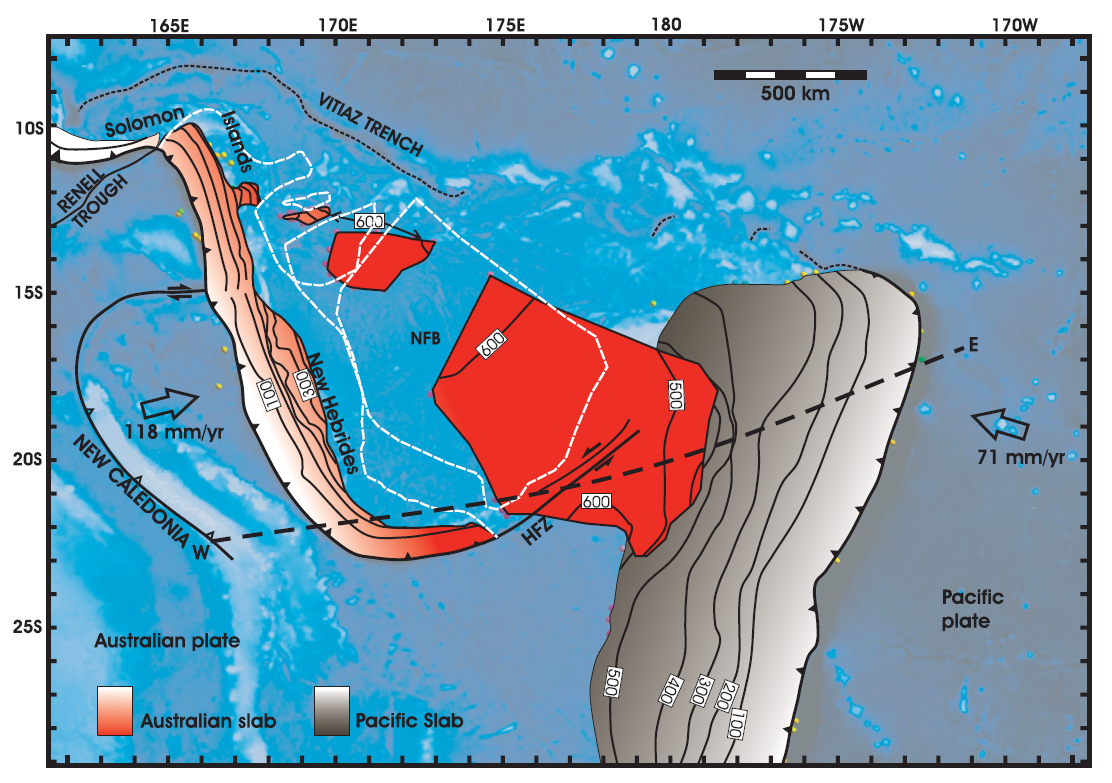
Map showing distribution of slab segments beneath the Tonga-Vanuatu region. West-dipping Pacifi c slab is shown in gray; northeast-dipping Australian slab is shown in red. Three detached segments of Australian slab lie below the North Fiji Basin (NFB). HFZ—Hunter Fracture Zone. Contour interval is 100 km. Detached segments of Australian plate form sub-horizontal sheets located at ~600 km depth. White dashed line shows outline of the subducted slab fragments when reconstructed from 660 km depth to the surface. When all subducted components are brought to the surface, the geometry closely approximates that of the North Fiji Basin.
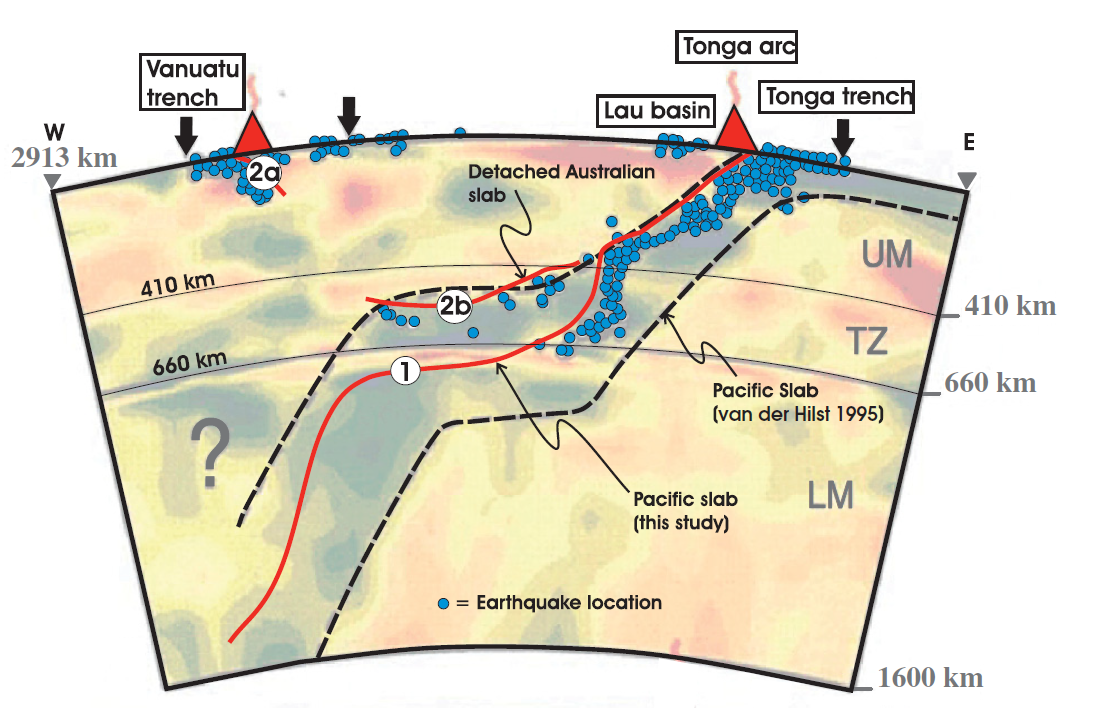
Previous interpretation of combined P-wave tomography and seismicity from van der Hilst (1995). Earthquake hypocenters are shown in blue. The previous interpretation of slab structure is contained within the black dashed lines. Solid red lines mark the surface of the Pacifi c slab (1), the still attached subducting Australian slab (2a), and the detached segment of the Australian plate (2b). UM—upper mantle;
TZ—transition zone; LM—lower mantle.
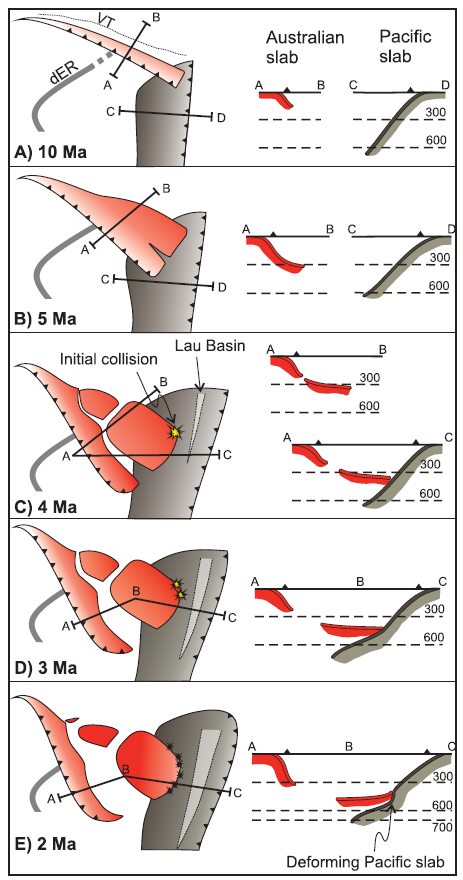
Simplified plate tectonic reconstruction showing the progressive geometric evolution of the Vanuatu and Tonga subduction systems in plan view and in cross section. Initiation of the Vanuatu subduction system begins by 10 Ma. Initial detachment of the basal part of the Australian slab begins at ca. 5–4 Ma and then sinking and collision between the detached segment and the Pacifi c slab occur by 3–4 Ma. Initial opening of the Lau backarc also occurred at this time. Between 3 Ma and the present, both slabs have been sinking progressively to their current position. VT—Vitiaz trench; dER—d’Entrecasteaux Ridge.
- 2023.04.24 M 7.1 Kermadec
- 2023.04.02 M 7.0 Papua New Guinea
- 2023.03.16 M 7.0 Kermadec
- 2023.01.08 M 7.0 Vanuatu Islands
- 2022.11.22 M 7.0 Solomon Isles
- 2022.11.11 M 7.3 Tonga
- 2022.09.10 M 7.6 Papua New Guinea
- 2021.03.04 M 8.1 Kermadec
- 2021.02.10 M 7.7 Loyalty Islands
- 2019.06.15 M 7.2 Kermadec
- 2019.05.14 M 7.5 New Ireland
- 2019.05.06 M 7.2 Papua New Guinea
- 2018.12.05 M 7.5 New Caledonia
- 2018.10.10 M 7.0 New Britain, PNG
- 2018.09.09 M 6.9 Kermadec
- 2018.08.29 M 7.1 Loyalty Islands
- 2018.08.18 M 8.2 Fiji
- 2018.03.26 M 6.9 New Britain
- 2018.03.26 M 6.6 New Britain
- 2018.03.08 M 6.8 New Ireland
- 2018.02.25 M 7.5 Papua New Guinea
- 2018.02.26 M 7.5 Papua New Guinea Update #1
- 2017.11.19 M 7.0 Loyalty Islands Update #1
- 2017.11.07 M 6.5 Papua New Guinea
- 2017.11.04 M 6.8 Tonga
- 2017.10.31 M 6.8 Loyalty Islands
- 2017.08.27 M 6.4 N. Bismarck plate
- 2017.05.09 M 6.8 Vanuatu
- 2017.03.19 M 6.0 Solomon Islands
- 2017.03.05 M 6.5 New Britain
- 2017.01.22 M 7.9 Bougainville
- 2017.01.03 M 6.9 Fiji
- 2016.12.17 M 7.9 Bougainville
- 2016.12.08 M 7.8 Solomons
- 2016.10.17 M 6.9 New Britain
- 2016.10.15 M 6.4 South Bismarck Sea
- 2016.09.14 M 6.0 Solomon Islands
- 2016.08.31 M 6.7 New Britain
- 2016.08.12 M 7.2 New Hebrides Update #2
- 2016.08.12 M 7.2 New Hebrides Update #1
- 2016.08.12 M 7.2 New Hebrides
- 2016.04.06 M 6.9 Vanuatu Update #1
- 2016.04.03 M 6.9 Vanuatu
- 2015.03.30 M 7.5 New Britain (Update #5)
- 2015.03.30 M 7.5 New Britain (Update #4)
- 2015.03.29 M 7.5 New Britain (Update #3)
- 2015.03.29 M 7.5 New Britain (Update #2)
- 2015.03.29 M 7.5 New Britain (Update #1)
- 2015.03.29 M 7.5 New Britain
- 2015.11.18 M 6.8 Solomon Islands
- 2015.05.24 M 6.8, 6.8, 6.9 Santa Cruz Islands
- 2015.05.05 M 7.5 New Britain
New Britain | Solomon | Bougainville | New Hebrides | Tonga | Kermadec Earthquake Reports
General Overview
Earthquake Reports
Social Media
#EarthquakeReport for at least 1 M7.3 #Earthquake along Kermadec trench
One M7.3 appears to be megathrust subduction interface earthquake maybe M8.1 aftershock
No tsunami likely in CA, OR, WA, BC, AK
Read earlier report for 8.1 https://t.co/57SWSkASPuhttps://t.co/Q6yHAqbrdR pic.twitter.com/3Qt9mqEwsB
— Jason "Jay" R. Patton (@patton_cascadia) April 24, 2023
#EarthquakeReport for M7.1 #Earthquake along the Kermadec trench north of #NewZealand south of #Fiji
report and interpretive poster#Tsunami plots from Raoul Island
read about the regional tectonics:https://t.co/FMza1rzeti pic.twitter.com/qe4kgEGrPl
— Jason "Jay" R. Patton (@patton_cascadia) April 24, 2023
Tsunami Info Stmt: M7.3 Kermadec Islands Region 1742PDT Apr 23: Tsunami NOT expected; CA,OR,WA,BC,and AK
— NWS Tsunami Alerts (@NWS_NTWC) April 24, 2023
#Earthquake confirmed by seismic data.⚠Preliminary info: M7.0 || 977 km NE of #Kerikeri (New Zealand) || 12 min ago (local time 12:41:52). Follow the thread for the updates👇 pic.twitter.com/ewrGObyPwb
— EMSC (@LastQuake) April 24, 2023
Mw=7.1, KERMADEC ISLANDS, NEW ZEALAND (Depth: 45 km), 2023/04/24 00:41:54 UTC – Full details here: https://t.co/rFPxkijKBP pic.twitter.com/iSHp9EU849
— Earthquakes (@geoscope_ipgp) April 24, 2023
No #tsunami threat to Australia from magnitude 7.2 #earthquake near the Kermadec Islands Region. Latest Advice at https://t.co/YzmlhRlr4V pic.twitter.com/ZQ7k8CjcPS
— Bureau of Meteorology, Australia (@BOM_au) April 24, 2023
Waves from the M7.1 Kermadec Islands earthquake shown using Station Monitor.
Use Station Monitor to see how the ground moved near you: https://t.co/Tir0KZELXN pic.twitter.com/sH1ktj0Kv4
— EarthScope Consortium (@EarthScope_sci) April 24, 2023
Seismic waves from the M7.3 Kermadec Islands earthquake are rolling under me here on the east coast of the US. These waves are far too small for people to feel but not too small to be detected by seismometers. Data from @EarthScope_sci Station Monitor. pic.twitter.com/yE1RkcWLyo
— Wendy Bohon, PhD 🌏 (@DrWendyRocks) April 24, 2023
The Kermadec Islands region experiences a very high degree of seismicity Here, the Pacific Plate subducts beneath the Australian Plate, and earthquakes increase in depth from east to west. pic.twitter.com/hCkvUMBgPg
— EarthScope Consortium (@EarthScope_sci) April 24, 2023
Good point about duration, looks like duration of long period seismic waves is only 1-2 min at (clipped) nearby seismic station at Raoul pic.twitter.com/JevcnqZjC6
— Anthony Lomax 🇪🇺🌍🇺🇦 (@ALomaxNet) April 24, 2023
Mw 7.1 earthquake near Raoul Island today. Reverse faulting at 50 km depth. Small tsunami (~20 cm peak-to-trough) recorded at Raoul Island. The earthquake was well recorded across the New Zealand seismic network. pic.twitter.com/gJfahJ6KAK
— John Ristau 🇨🇦 🇳🇿 (@SinistralSeismo) April 24, 2023
Watch the waves from the M7.1 Kermadec Islands earthquake roll across seismic stations in North America. pic.twitter.com/iERRx9v6Q2
— EarthScope Consortium (@EarthScope_sci) April 24, 2023
Recent Earthquake Teachable Moment for the M7.1 Kermadec Islands earthquake.
Teachable Moments presentations capture the opportunity to bring knowledge, insight, and critical thinking to the classroom following a newsworthy earthquake.https://t.co/Ltmp5G5EBu pic.twitter.com/gzHYlaCCX9
— EarthScope Consortium (@EarthScope_sci) April 24, 2023
1/3 – 2023-04-24 M7.1 #Kermadec #earthquake recorded in #Scotland & #Stornoway + historical seismicity & cross section.
Core waves clearly detected by all stations in the region.
Dist.: 16868km
Travel Time: 17m 42s
Depth: 49km#Python @raspishake @matplotlib #CitizenScience pic.twitter.com/eZvZEg03OJ— Giuseppe Petricca (@gmrpetricca) April 24, 2023
You can see the seismic action northeast of NZ, around the Kermadec Islands.
The brown (🟤) colouring indicates the strongest activity. https://t.co/97AgBb6gz8 pic.twitter.com/7GTHcViRmh
— NIWA Weather (@NiwaWeather) April 24, 2023
Section from a M7.1 earthquake in the Kermadec Islands, New Zealand at 2023-04-24 00:41:56UTC recorded on the global @raspishake network. See: https://t.co/75dBE7ppyG…. Uses @obspy & @matplotlib. PcP are reflections from the outer core, PKIKP pass through the inner core. pic.twitter.com/YgppoTV4xD
— Mark Vanstone (@wmvanstone) April 24, 2023
M7.1 earthquake from the Kermadec Islands, New Zealand at 2023-04-24 00:41:56UTC recorded 17 670 km away on the @raspishake and @BGSseismology networks in SW England and Brittany, France. See: https://t.co/75dBE7ppyG. Uses @obspy, @matplotlib & folium libraries. pic.twitter.com/wI3GUfIhnd
— Mark Vanstone (@wmvanstone) April 24, 2023
- Frisch, W., Meschede, M., Blakey, R., 2011. Plate Tectonics, Springer-Verlag, London, 213 pp.
- Hayes, G., 2018, Slab2 – A Comprehensive Subduction Zone Geometry Model: U.S. Geological Survey data release, https://doi.org/10.5066/F7PV6JNV.
- Holt, W. E., C. Kreemer, A. J. Haines, L. Estey, C. Meertens, G. Blewitt, and D. Lavallee (2005), Project helps constrain continental dynamics and seismic hazards, Eos Trans. AGU, 86(41), 383–387, , https://doi.org/10.1029/2005EO410002. /li>
- Jessee, M.A.N., Hamburger, M. W., Allstadt, K., Wald, D. J., Robeson, S. M., Tanyas, H., et al. (2018). A global empirical model for near-real-time assessment of seismically induced landslides. Journal of Geophysical Research: Earth Surface, 123, 1835–1859. https://doi.org/10.1029/2017JF004494
- Kreemer, C., J. Haines, W. Holt, G. Blewitt, and D. Lavallee (2000), On the determination of a global strain rate model, Geophys. J. Int., 52(10), 765–770.
- Kreemer, C., W. E. Holt, and A. J. Haines (2003), An integrated global model of present-day plate motions and plate boundary deformation, Geophys. J. Int., 154(1), 8–34, , https://doi.org/10.1046/j.1365-246X.2003.01917.x.
- Kreemer, C., G. Blewitt, E.C. Klein, 2014. A geodetic plate motion and Global Strain Rate Model in Geochemistry, Geophysics, Geosystems, v. 15, p. 3849-3889, https://doi.org/10.1002/2014GC005407.
- Meyer, B., Saltus, R., Chulliat, a., 2017. EMAG2: Earth Magnetic Anomaly Grid (2-arc-minute resolution) Version 3. National Centers for Environmental Information, NOAA. Model. https://doi.org/10.7289/V5H70CVX
- Müller, R.D., Sdrolias, M., Gaina, C. and Roest, W.R., 2008, Age spreading rates and spreading asymmetry of the world’s ocean crust in Geochemistry, Geophysics, Geosystems, 9, Q04006, https://doi.org/10.1029/2007GC001743
- Pagani,M. , J. Garcia-Pelaez, R. Gee, K. Johnson, V. Poggi, R. Styron, G. Weatherill, M. Simionato, D. Viganò, L. Danciu, D. Monelli (2018). Global Earthquake Model (GEM) Seismic Hazard Map (version 2018.1 – December 2018), DOI: 10.13117/GEM-GLOBAL-SEISMIC-HAZARD-MAP-2018.1
- Silva, V ., D Amo-Oduro, A Calderon, J Dabbeek, V Despotaki, L Martins, A Rao, M Simionato, D Viganò, C Yepes, A Acevedo, N Horspool, H Crowley, K Jaiswal, M Journeay, M Pittore, 2018. Global Earthquake Model (GEM) Seismic Risk Map (version 2018.1). https://doi.org/10.13117/GEM-GLOBAL-SEISMIC-RISK-MAP-2018.1
- Zhu, J., Baise, L. G., Thompson, E. M., 2017, An Updated Geospatial Liquefaction Model for Global Application, Bulletin of the Seismological Society of America, 107, p 1365-1385, https://doi.org/0.1785/0120160198
- Richards, S., Holm, R., and Barber, G., 2011. Skip Nav Destination When slabs collide: A tectonic assessment of deep earthquakes in the Tonga-Vanuatu region in Geology, c. 39, no. 8, p. 787-790, https://doi.org/10.1130/G31937.1
- Timm, C., Bassett, D., Graham, I. et al. Louisville seamount subduction and its implication on mantle flow beneath the central Tonga–Kermadec arc. Nat Commun 4, 1720 (2013). https://doi.org/10.1038/ncomms2702
References:
Basic & General References
Specific References
Return to the Earthquake Reports page.
- Sorted by Magnitude
- Sorted by Year
- Sorted by Day of the Year
- Sorted By Region