Early this morning I received some notifications of earthquakes along the Tonga trench (southwestern central Pacific Ocean). It was about 2am my local time.
I work on the tsunami program for the California state tsunami program (CTP) and we respond to tsunami to (1) help local communities do their first response activities so that they can help reduce suffering and to (2) document the impact of these tsunami.
Because of this work, our team is “at the ready” 24 hours a day, 7 days a week, to respond to these events. Luckily, this event was unlikely to generate a tsunami that would impact California. I went back to sleep.
This morning I put together a report and checked to see if there was a tsunami generated. Here is one place that I check for tsunami records as observed on tide gages http://www.ioc-sealevelmonitoring.org/map.php. I did not see anything convincing.
This earthquake, from last night my time, has a magnitude of M 7.3.
https://earthquake.usgs.gov/earthquakes/eventpage/us7000ip0l/executive
This area of the Earth has a plate boundary fault system called a subduction zone. A subduction zone is a convergent plate boundary, which means that the plates on either side of the boundary move towards each other.
Here, the Pacific plate dives westwards beneath the Australia plate, forming the Tonga trench. Below is a schematic illustration showing what these plates may look like if we cut into the Earth and viewed this subduction zone from the side. Note the Pacific plate on the right and the Australia plate on the left, with the megathrust subduction zone fault where they meet.
This illustration shows where earthquakes may happen along this plate boundary. There could be interface earthquakes along the megathrust fault (megathrust earthquakes). These are what most people are familiar with when they are thinking about tsunami (e.g., the 2011 Great East Japan Earthquake and Tsunami).
In the upper plate (the Australia plate), there can be crustal fault earthquakes. In the lower plate (the Pacific plate) there can be slab earthquakes (events within the crust, aka the slab), and there can be outer rise earthquakes).
The outer rise is a part of the plate that is warping up and down because of the forces adjacent to the subduction zone. This warping can cause extension in the upper part, and compression in the lower part, of this plate.
This 11 Nov 2022 M 7.3 earthquake was a compressional (reverse) earthquake in the outer rise region of this plate boundary. It was pretty deep (for oceanic crust) so fits nicely in the correct place in this illustration:
But megathrust earthquakes are not the only type of earthquake that can cause a tsunami. The 2009 magnitude M 8.1 extensional (normal) fault earthquake near Samoa and American Samoa caused a tsunami that inundated the nearby islands (causing lots of damage and human suffering). This tsunami also travelled across the Pacific Ocean to impact California! (This is why the California Tsunami Program monitors tsunami across the Pacific Basin, so that we can help reduce suffering through the evacuation of coastal areas. Remember, the entire coast of California is a Tsunami Hazard Area.)
Below is my interpretive poster for this earthquake
- I plot the seismicity from the past month, with diameter representing magnitude (see legend). I include earthquake epicenters from 1922-2022 with magnitudes M ≥ 7.0 in one version.
- I plot the USGS fault plane solutions (moment tensors in blue and focal mechanisms in orange), possibly in addition to some relevant historic earthquakes.
- A review of the basic base map variations and data that I use for the interpretive posters can be found on the Earthquake Reports page. I have improved these posters over time and some of this background information applies to the older posters.
- Some basic fundamentals of earthquake geology and plate tectonics can be found on the Earthquake Plate Tectonic Fundamentals page.
- In the upper left corner is a map that shows the plates, their boundaries, and a century of seismicity.
- In the lower right corner is a map that shows the ground shaking from the earthquake, with color representing intensity using the Modified Mercalli Intensity (MMI) scale. The closer to the earthquake, the stronger the ground shaking. The colors on the map represent the USGS model of ground shaking. The colored circles represent reports from people who posted information on the USGS Did You Feel It? part of the website for this earthquake. There are things that affect the strength of ground shaking other than distance, which is why the reported intensities are different from the modeled intensities.
- To the left is a plot that shows how the shaking intensity models and reports relate to each other. The horizontal axis is distance from the earthquake and the vertical axis is shaking intensity (using the MMI scale, just like in the map to the right: these are the same datasets).
- Further to the left is a diagram that shows the different types of earthquakes that can occur along a subduction zone.
- In the upper right corner is a map that shows some of the historic earthquakes in the region, with the earthquake mechanisms. I labeled these events for the type of event that I interpret them to be.
- In the upper left center is a map from Richards et al. (2011) that shows earthquake locations (epicenters) with color representing depth. I place a yellow star in the general location of today’s M 7.3 earthquake. These colors help us visualize how the Pacific plate dips deeper towards the left (yellow are shallow events and purple are deep events). The 2000.01.08 M 7.2 earthquake is an intermediate depth earthquake (see the map in the upper right corner).
- In the right center is a map from Timm et al (2013) that also shows the depth to the slab (the downgoing Pacific plate). I place a yellow star in the general location of today’s M 7.3 earthquake.
I include some inset figures. Some of the same figures are located in different places on the larger scale map below.
- Here is the map with 3 month’s seismicity plotted.

- Well, I just looked at Pago Pago and the record is clear. I am kinda surprised since this gage is on the nodal plane for this event. I will plot these data up.
- Here is a screenshot:
- Here are the two plots for the gages listed above. The Pago pago record is quite clear. However, the Nukualofa gage is pretty noisy. I don’t have much confidence in the measurements of the wave size.
- Data from both gages show a background wave sequence that makes it difficult to know when the tsunami ends. Someone who can filter out that wave series could probably do a better job at locating when the tsunami ends, at least for the Pago Pago data.
- Pago Pago (American Samoa) https://webcritech.jrc.ec.europa.eu/SeaLevelsDb/Device/959
- Nukualofa (Tonga Island) https://webcritech.jrc.ec.europa.eu/SeaLevelsDb/Device/950

Other Report Pages
Some Relevant Discussion and Figures
- Here is the map from Timm et al., 2013.
Bathymetric map of the Tonga–Kermadec arc system. Map showing the depth of the subducted slab beneath the Tonga–Kermadec arc system. Louisville seamount ages are after Koppers et al.49 ELSC, eastern Lau-spreading centre; DSDP, Deep Sea Drilling Programme; NHT, Northern Havre Trough; OT, Osbourn Trough; VFR, Valu Fa Ridge. Arrows mark total convergence rates.
- Here is the oblique view of the slab from Green (2003).

Earthquakes and subducted slabs beneath the Tonga–Fiji area. The subducting slab and detached slab are defined by the historic earthquakes in this region: the steeply dipping surface descending from the Tonga Trench marks the currently active subduction zone, and the surface lying mostly between 500 and 680 km, but rising to 300 km in the east, is a relict from an old subduction zone that descended from the fossil Vitiaz Trench. The locations of the mainshocks of the two Tongan earthquake sequences discussed by Tibi et al. are marked in yellow (2002 sequence) and orange (1986 series). Triggering mainshocks are denoted by stars; triggered mainshocks by circles. The 2002 sequence lies wholly in the currently subducting slab (and slightly extends the earthquake distribution in it),whereas the 1986 mainshock is in that slab but the triggered series is located in the detached slab,which apparently contains significant amounts of metastable olivine
- Here are figures from Richards et al. (2011) with their figure captions below in blockquote.
- The main tectonic map
- Here is the map showing the current configuration of the slabs in the region.
- This is the cross section showing the megathrust fault configuration based on seismic tomography and seismicity.
- Here is their time step interpretation of the slabs that resulted in the second figure above.
bathymetry, and major tectonic element map of the study area. The Tonga and Vanuatu subduction systems are shown together with the locations of earthquake epicenters discussed herein. Earthquakes between 0 and 70 km depth have been removed for clarity. Remaining earthquakes are color-coded according to depth. Earthquakes located at 500–650 km depth beneath the North Fiji Basin are also shown. Plate motions for Vanuatu are from the U.S. Geological Survey, and for Tonga from Beavan et al. (2002) (see text for details). Dashed line indicates location of cross section shown in Figure 3. NFB—North Fiji Basin; HFZ—Hunter Fracture Zone.
Map showing distribution of slab segments beneath the Tonga-Vanuatu region. West-dipping Pacifi c slab is shown in gray; northeast-dipping Australian slab is shown in red. Three detached segments of Australian slab lie below the North Fiji Basin (NFB). HFZ—Hunter Fracture Zone. Contour interval is 100 km. Detached segments of Australian plate form sub-horizontal sheets located at ~600 km depth. White dashed line shows outline of the subducted slab fragments when reconstructed from 660 km depth to the surface. When all subducted components are brought to the surface, the geometry closely approximates that of the North Fiji Basin.
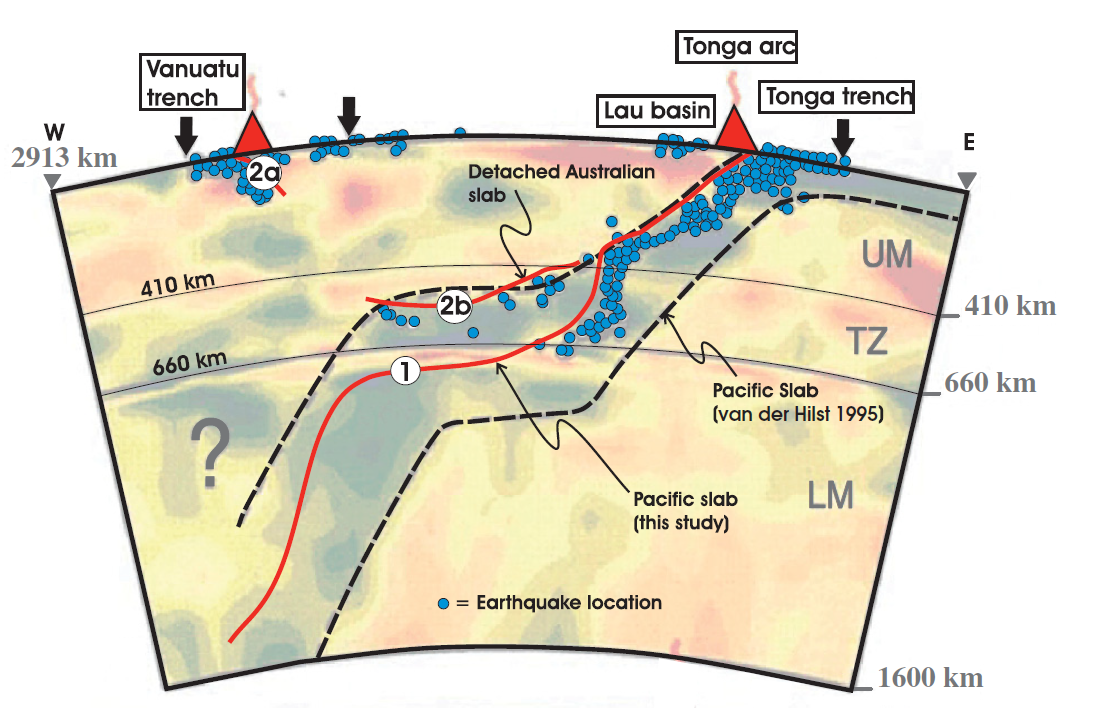
Previous interpretation of combined P-wave tomography and seismicity from van der Hilst (1995). Earthquake hypocenters are shown in blue. The previous interpretation of slab structure is contained within the black dashed lines. Solid red lines mark the surface of the Pacifi c slab (1), the still attached subducting Australian slab (2a), and the detached segment of the Australian plate (2b). UM—upper mantle;
TZ—transition zone; LM—lower mantle.
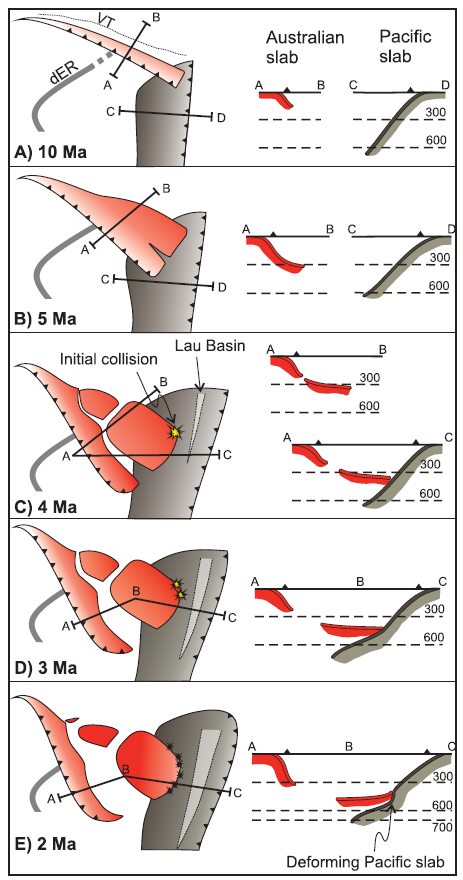
Simplified plate tectonic reconstruction showing the progressive geometric evolution of the Vanuatu and Tonga subduction systems in plan view and in cross section. Initiation of the Vanuatu subduction system begins by 10 Ma. Initial detachment of the basal part of the Australian slab begins at ca. 5–4 Ma and then sinking and collision between the detached segment and the Pacifi c slab occur by 3–4 Ma. Initial opening of the Lau backarc also occurred at this time. Between 3 Ma and the present, both slabs have been sinking progressively to their current position. VT—Vitiaz trench; dER—d’Entrecasteaux Ridge.
- Here is the tectonic map from Ballance et al., 1999.
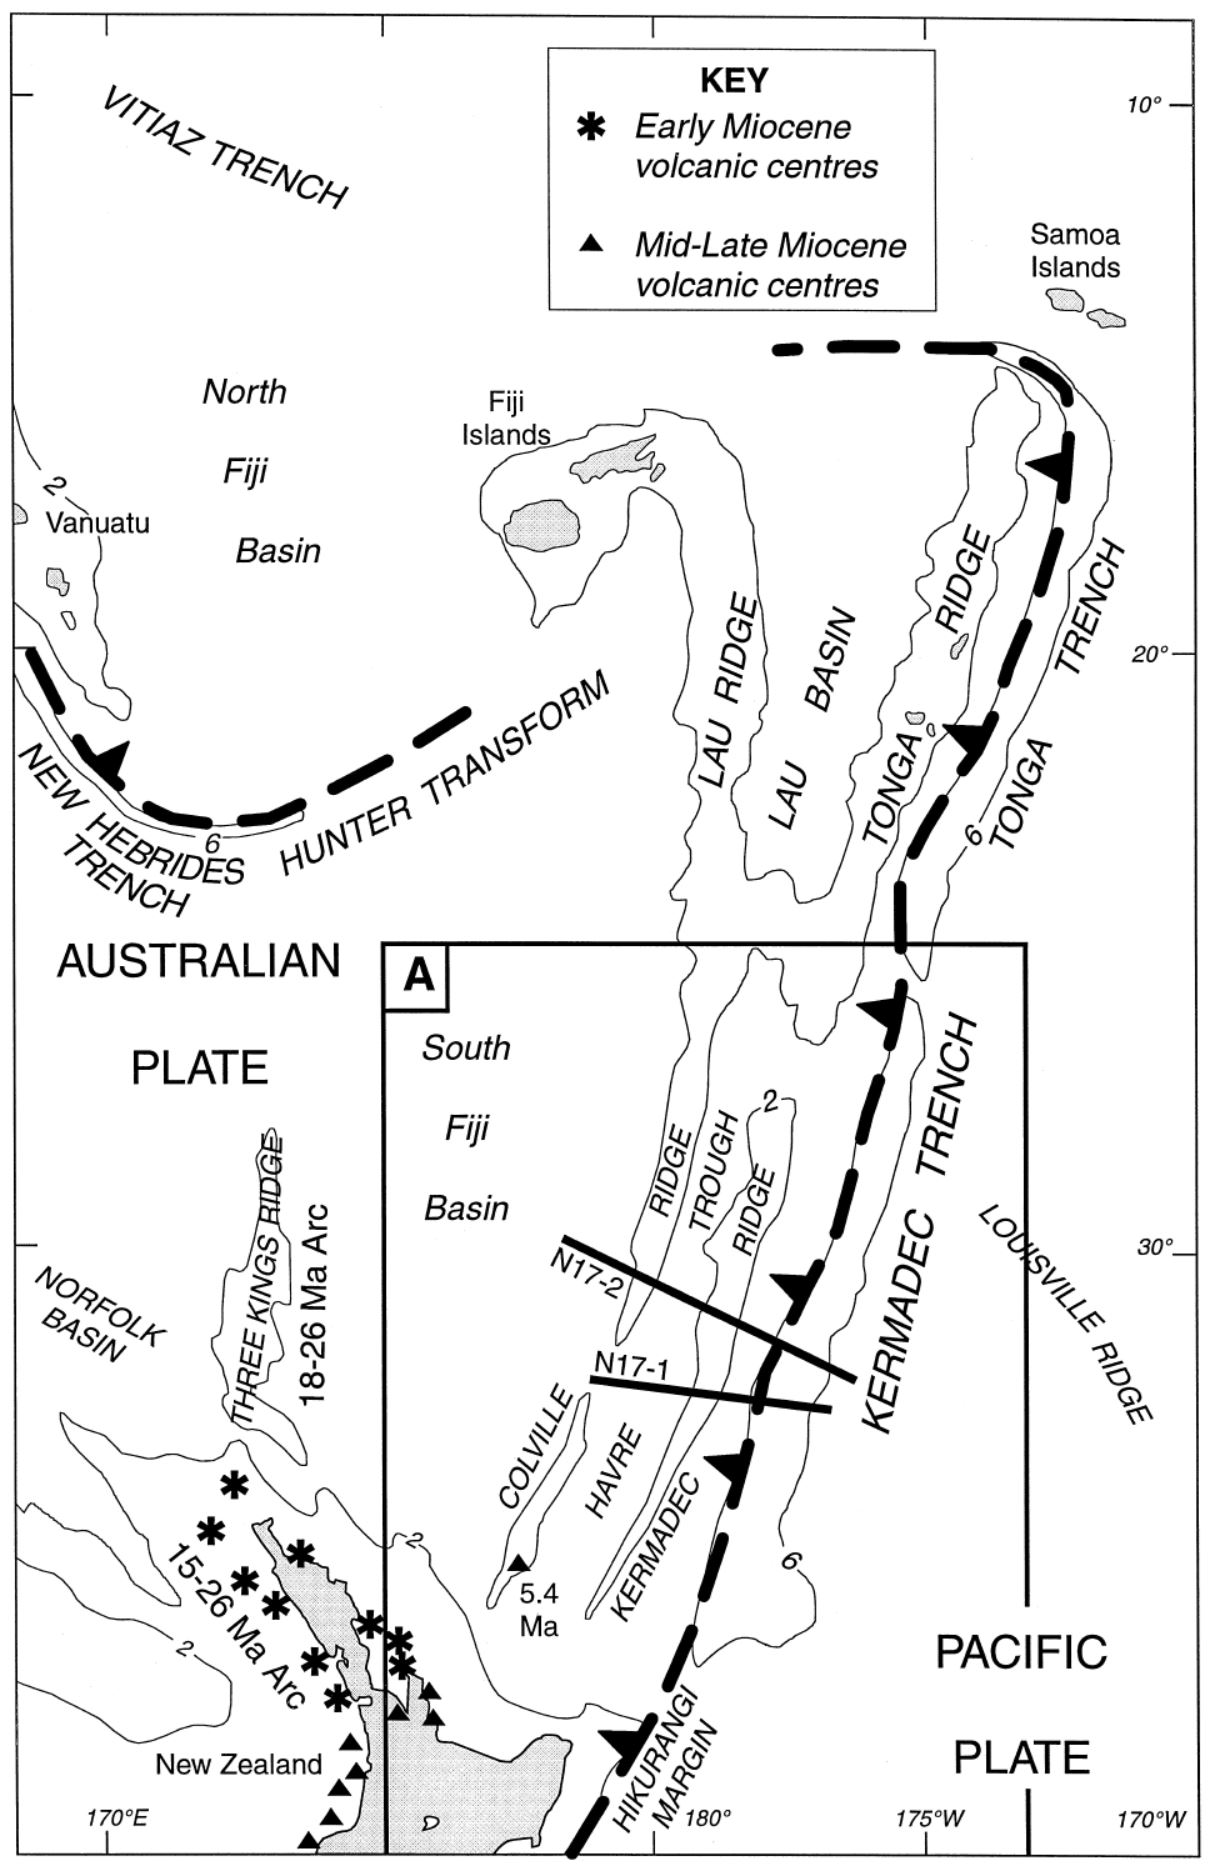
Map of the Southwest Pacific Ocean showing the regional tectonic setting and location of the two dredged profiles. Depth contours in kilometres. The presently active arcs comprise New Zealand–Kermadec Ridge–Tonga Ridge, linked with Vanuatu by transforms associated with the North Fiji Basin. Colville Ridge–Lau Ridge is the remnant arc. Havre Trough–Lau Basin is the active backarc basin. Kermadec–Tonga Trench marks the site of subduction of Pacific lithosphere westward beneath Australian plate lithosphere. North and South Fiji Basins are marginal basins of late Neogene and probable Oligocene age, respectively. 5.4sK–Ar date of dredged basalt sample (Adams et al., 1994).
- Here is a great summary of the fault mechanisms for earthquakes along this plate boundary (Yu, 2013).
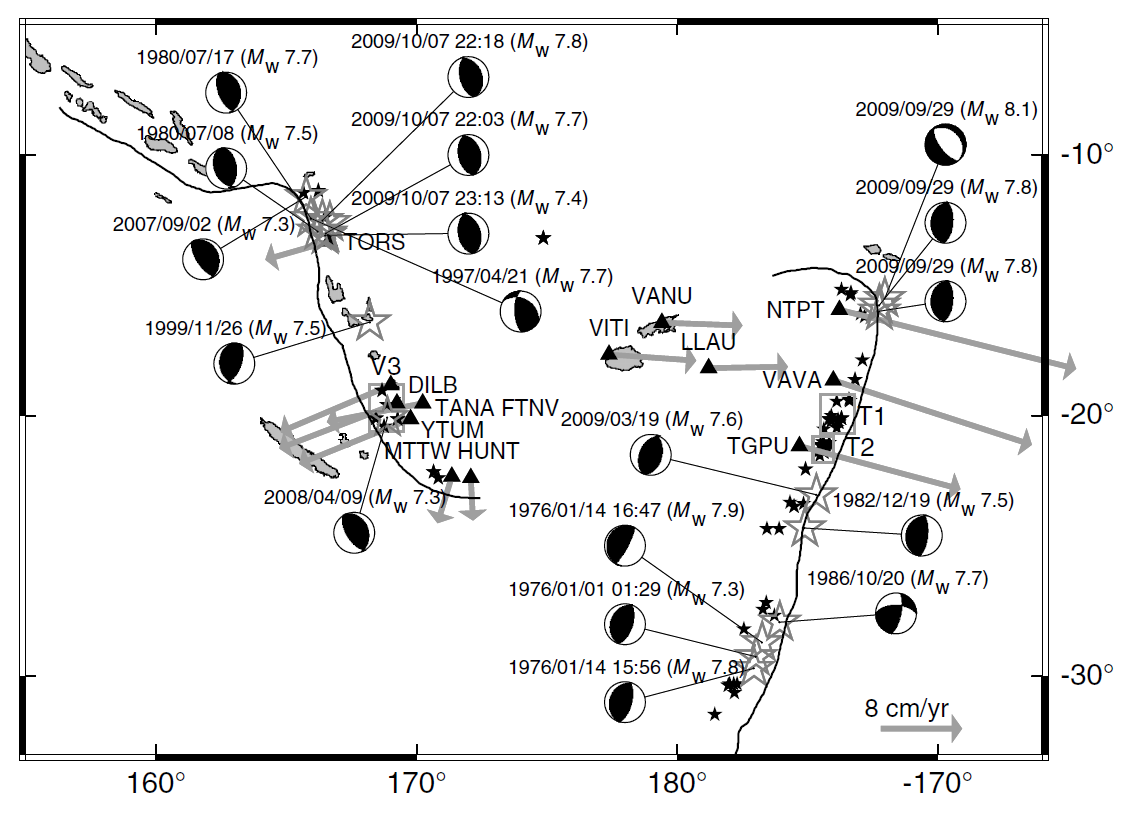
Large subduction-zone interplate earthquakes (large open gray stars) labeled with event date, Mw, GCMT focal mechanisms, and GPS velocity vectors (gray arrows and black triangles labeled with station name). GPS velocities are listed in Table 3. Black lines indicate the Tonga–Kermadec and Vanuatu trenches. Note that the 2009/09/29 Samoa–Tonga outer trench-slope event (Mw 8.1) triggered large interplate doublets (both of Mw 7.8; Lay et al., 2010). The Pacific plate subducts westward beneath the Australian plate along the Tonga–Kermadec trench, whereas the Australian plate subducts eastward beneath the Vanuatu arc and North Fiji basin. The opposite orientation between the Tonga–Kermadec and Vanuatu subduction systems is due to complex and broad back-arc extension in the Lau and North Fiji basins (Pelletier et al., 1998).
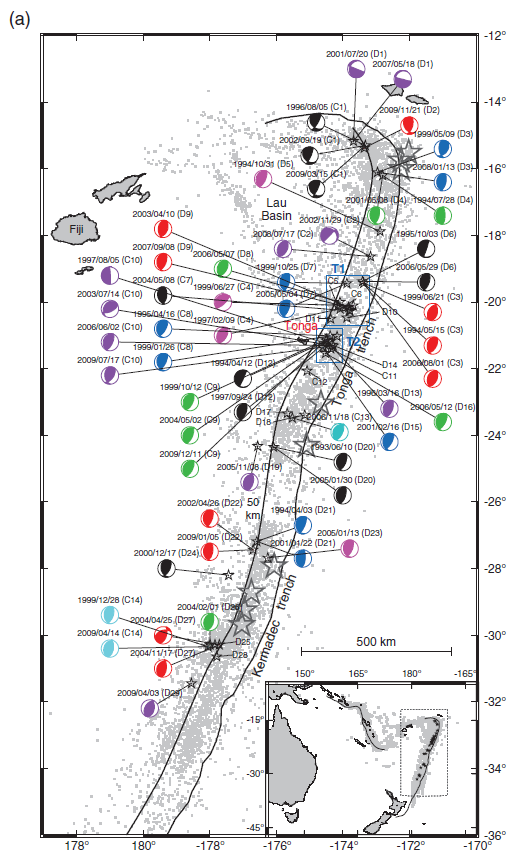
Regional map of moderate-sized (mb > 4:7) shallow-focus repeating earthquakes and background seismicity along the (a) Tonga–Kermadec and (b) Vanuatu (former New Hebrides) subduction zones. Shallow repeating earthquakes (black stars) and their available Global Centroid Moment Tensor (GCMT; Dziewoński et al., 1981; Ekström et al., 2003) are labeled with event date and doublet/cluster id where applicable. Colors of GCMT are used to distinguish nearby different repeaters. Source parameters for the clusters and doublets are listed in Tables 1 and 2. Background seismicity is shown as gray dots and large interplate earthquakes (moment magnitude, Mw > 7:3) since 1976 are shown as large open gray stars. Black lines indicate the trench (Bird, 2003) and slab contour at 50-km depth (Gudmundsson and Sambridge, 1998). Repeating earthquake clusters in the (a) T1 and T2 plate-interface regions in Tonga and (b) V3 plate-interface region in Vanuatu are used to study the fault-slip rate ( _d). A regional map of the Tonga–Kermadec–Vanuatu subduction zones is
shown in the inset figure, with the gray dotted box indicating the expanded region in the main figure.
- 2022.11.11 M 7.3 Tonga
- 2022.09.10 M 7.6 Papua New Guinea
- 2021.03.04 M 8.1 Kermadec
- 2021.02.10 M 7.7 Loyalty Islands
- 2019.06.15 M 7.2 Kermadec
- 2019.05.14 M 7.5 New Ireland
- 2019.05.06 M 7.2 Papua New Guinea
- 2018.12.05 M 7.5 New Caledonia
- 2018.10.10 M 7.0 New Britain, PNG
- 2018.09.09 M 6.9 Kermadec
- 2018.08.29 M 7.1 Loyalty Islands
- 2018.08.18 M 8.2 Fiji
- 2018.03.26 M 6.9 New Britain
- 2018.03.26 M 6.6 New Britain
- 2018.03.08 M 6.8 New Ireland
- 2018.02.25 M 7.5 Papua New Guinea
- 2018.02.26 M 7.5 Papua New Guinea Update #1
- 2017.11.19 M 7.0 Loyalty Islands Update #1
- 2017.11.07 M 6.5 Papua New Guinea
- 2017.11.04 M 6.8 Tonga
- 2017.10.31 M 6.8 Loyalty Islands
- 2017.08.27 M 6.4 N. Bismarck plate
- 2017.05.09 M 6.8 Vanuatu
- 2017.03.19 M 6.0 Solomon Islands
- 2017.03.05 M 6.5 New Britain
- 2017.01.22 M 7.9 Bougainville
- 2017.01.03 M 6.9 Fiji
- 2016.12.17 M 7.9 Bougainville
- 2016.12.08 M 7.8 Solomons
- 2016.10.17 M 6.9 New Britain
- 2016.10.15 M 6.4 South Bismarck Sea
- 2016.09.14 M 6.0 Solomon Islands
- 2016.08.31 M 6.7 New Britain
- 2016.08.12 M 7.2 New Hebrides Update #2
- 2016.08.12 M 7.2 New Hebrides Update #1
- 2016.08.12 M 7.2 New Hebrides
- 2016.04.06 M 6.9 Vanuatu Update #1
- 2016.04.03 M 6.9 Vanuatu
- 2015.03.30 M 7.5 New Britain (Update #5)
- 2015.03.30 M 7.5 New Britain (Update #4)
- 2015.03.29 M 7.5 New Britain (Update #3)
- 2015.03.29 M 7.5 New Britain (Update #2)
- 2015.03.29 M 7.5 New Britain (Update #1)
- 2015.03.29 M 7.5 New Britain
- 2015.11.18 M 6.8 Solomon Islands
- 2015.05.24 M 6.8, 6.8, 6.9 Santa Cruz Islands
- 2015.05.05 M 7.5 New Britain
New Britain | Solomon | Bougainville | New Hebrides | Tonga | Kermadec Earthquake Reports
General Overview
Earthquake Reports
Social Media
#EarthquakeReport for M 7.3 #Earthquake along outer rise near the Tonga trench
reverse (compressional) mechanism
south of analogues incl tsunamigenic 2009 M 8.1 (tho that was extensional)https://t.co/gQEdISt9eD
learn more abt regional tectonics herehttps://t.co/eDsUON2Mly pic.twitter.com/DvMnY4rWck
— Jason "Jay" R. Patton (@patton_cascadia) November 11, 2022
#EarthquakeReport for M 7.3 #Earthquake near the Tonga trench
thrust (compressional) earthquake along the outer rise
no #Tsunami observed on tide gages
report here includes my interpretation and a regional tectonic summary:https://t.co/ze2s3bb7Vn pic.twitter.com/2M3SZaYE19
— Jason "Jay" R. Patton (@patton_cascadia) November 11, 2022
The region near todays M7.3 earthquake is incrediblely active due to the high rates of convergence between the Australian and Pacific Plates. Since 1900, 40 M7.5+ earthquakes have been recorded, as well as at least 3 M8+ events. https://t.co/avVOX0LcGH pic.twitter.com/dN9mIrwgwN
— Wendy Bohon, PhD 🌏 (@DrWendyRocks) November 11, 2022
Fri Nov 11 10:48:00 2022 UTC
Mag: 7.5 Depth: 33
Coords: 19.322 S 172.01 W
Location: TONGA ISLANDS REGION* HAZARDOUS TSUNAMI WAVES FROM THIS EARTHQUAKE ARE POSSIBLE WITHIN 300 KM OF THE EPICENTER ALONG THE COASTS OF
NIUE AND TONGA pic.twitter.com/lm1RMEJ0o8— よっしみ~☆🌏 (@yoshimy_s) November 11, 2022
Seismic waves from the Tonga 7.3 #earthquake, as arriving at a @raspishakEQ station of the @GEO3BCN_CSIC educational network in NE Iberia pic.twitter.com/K6YZPQf1JU
— Jordi Diaz Cusi (@JDiazCusi) November 11, 2022
Recent Earthquake Teachable Moment for the M7.3 Tonga earthquake https://t.co/PJBT5jgOTy pic.twitter.com/h0kTCejygS
— IRIS Earthquake Sci (@IRIS_EPO) November 11, 2022
Global surface and body wave sections from the M7.3 earthquake near Tongahttps://t.co/mz6A6vgD9F pic.twitter.com/0psyiRcDum
— IRIS Earthquake Sci (@IRIS_EPO) November 11, 2022
Mw=7.3, TONGA ISLANDS REGION (Depth: 43 km), 2022/11/11 10:48:42 UTC – Full details here: https://t.co/vqxit49tby pic.twitter.com/m16qoCB5wK
— Earthquakes (@geoscope_ipgp) November 11, 2022
Watch the waves from the M7.3 earthquake near Tonga roll across seismic stations in North America (THREAD 🧵) pic.twitter.com/hupVx0WfpQ
— IRIS Earthquake Sci (@IRIS_EPO) November 11, 2022
Section from today's M7.3 earthquake in the Tonga region at 2022-11-11 10:48:45UTC recorded on the worldwide @raspishake network. See: https://t.co/LS1S4JlAqX. Uses @obspy and @matplotlib. pic.twitter.com/Jdz1FlEZN2
— Mark Vanstone (@wmvanstone) November 11, 2022
A cross-section of seismicity, with the focal mechanisms projected into the vertical plane, shows the three deep quakes with purple outlines. These events were close to the deepest quakes in this area, where the subducted slab possibly is deflected by the 670 km discontinuity. pic.twitter.com/V09EYGWJRd
— Jascha Polet (@CPPGeophysics) November 11, 2022
- Frisch, W., Meschede, M., Blakey, R., 2011. Plate Tectonics, Springer-Verlag, London, 213 pp.
- Hayes, G., 2018, Slab2 – A Comprehensive Subduction Zone Geometry Model: U.S. Geological Survey data release, https://doi.org/10.5066/F7PV6JNV.
- Holt, W. E., C. Kreemer, A. J. Haines, L. Estey, C. Meertens, G. Blewitt, and D. Lavallee (2005), Project helps constrain continental dynamics and seismic hazards, Eos Trans. AGU, 86(41), 383–387, , https://doi.org/10.1029/2005EO410002. /li>
- Jessee, M.A.N., Hamburger, M. W., Allstadt, K., Wald, D. J., Robeson, S. M., Tanyas, H., et al. (2018). A global empirical model for near-real-time assessment of seismically induced landslides. Journal of Geophysical Research: Earth Surface, 123, 1835–1859. https://doi.org/10.1029/2017JF004494
- Kreemer, C., J. Haines, W. Holt, G. Blewitt, and D. Lavallee (2000), On the determination of a global strain rate model, Geophys. J. Int., 52(10), 765–770.
- Kreemer, C., W. E. Holt, and A. J. Haines (2003), An integrated global model of present-day plate motions and plate boundary deformation, Geophys. J. Int., 154(1), 8–34, , https://doi.org/10.1046/j.1365-246X.2003.01917.x.
- Kreemer, C., G. Blewitt, E.C. Klein, 2014. A geodetic plate motion and Global Strain Rate Model in Geochemistry, Geophysics, Geosystems, v. 15, p. 3849-3889, https://doi.org/10.1002/2014GC005407.
- Meyer, B., Saltus, R., Chulliat, a., 2017. EMAG2: Earth Magnetic Anomaly Grid (2-arc-minute resolution) Version 3. National Centers for Environmental Information, NOAA. Model. https://doi.org/10.7289/V5H70CVX
- Müller, R.D., Sdrolias, M., Gaina, C. and Roest, W.R., 2008, Age spreading rates and spreading asymmetry of the world’s ocean crust in Geochemistry, Geophysics, Geosystems, 9, Q04006, https://doi.org/10.1029/2007GC001743
- Pagani,M. , J. Garcia-Pelaez, R. Gee, K. Johnson, V. Poggi, R. Styron, G. Weatherill, M. Simionato, D. Viganò, L. Danciu, D. Monelli (2018). Global Earthquake Model (GEM) Seismic Hazard Map (version 2018.1 – December 2018), DOI: 10.13117/GEM-GLOBAL-SEISMIC-HAZARD-MAP-2018.1
- Silva, V ., D Amo-Oduro, A Calderon, J Dabbeek, V Despotaki, L Martins, A Rao, M Simionato, D Viganò, C Yepes, A Acevedo, N Horspool, H Crowley, K Jaiswal, M Journeay, M Pittore, 2018. Global Earthquake Model (GEM) Seismic Risk Map (version 2018.1). https://doi.org/10.13117/GEM-GLOBAL-SEISMIC-RISK-MAP-2018.1
- Zhu, J., Baise, L. G., Thompson, E. M., 2017, An Updated Geospatial Liquefaction Model for Global Application, Bulletin of the Seismological Society of America, 107, p 1365-1385, https://doi.org/0.1785/0120160198
- Richards, S., Holm, R., and Barber, G., 2011. Skip Nav Destination When slabs collide: A tectonic assessment of deep earthquakes in the Tonga-Vanuatu region in Geology, c. 39, no. 8, p. 787-790, https://doi.org/10.1130/G31937.1
- Timm, C., Bassett, D., Graham, I. et al. Louisville seamount subduction and its implication on mantle flow beneath the central Tonga–Kermadec arc. Nat Commun 4, 1720 (2013). https://doi.org/10.1038/ncomms2702
References:
Basic & General References
Specific References
Return to the Earthquake Reports page.
- Sorted by Magnitude
- Sorted by Year
- Sorted by Day of the Year
- Sorted By Region