Well, I was just getting ready for bed and saw the PTWC email notification. It took a couple minutes before the USGS email notification came through, but the earthquake was already listed on the website. By the time the ENS email came in, the magnitude was adjusted, as well as the location.
This M 6.8 earthquake was originally reported as a deep earthquake at 80 km, but after real people took a look at the data, the depth was also adjusted.
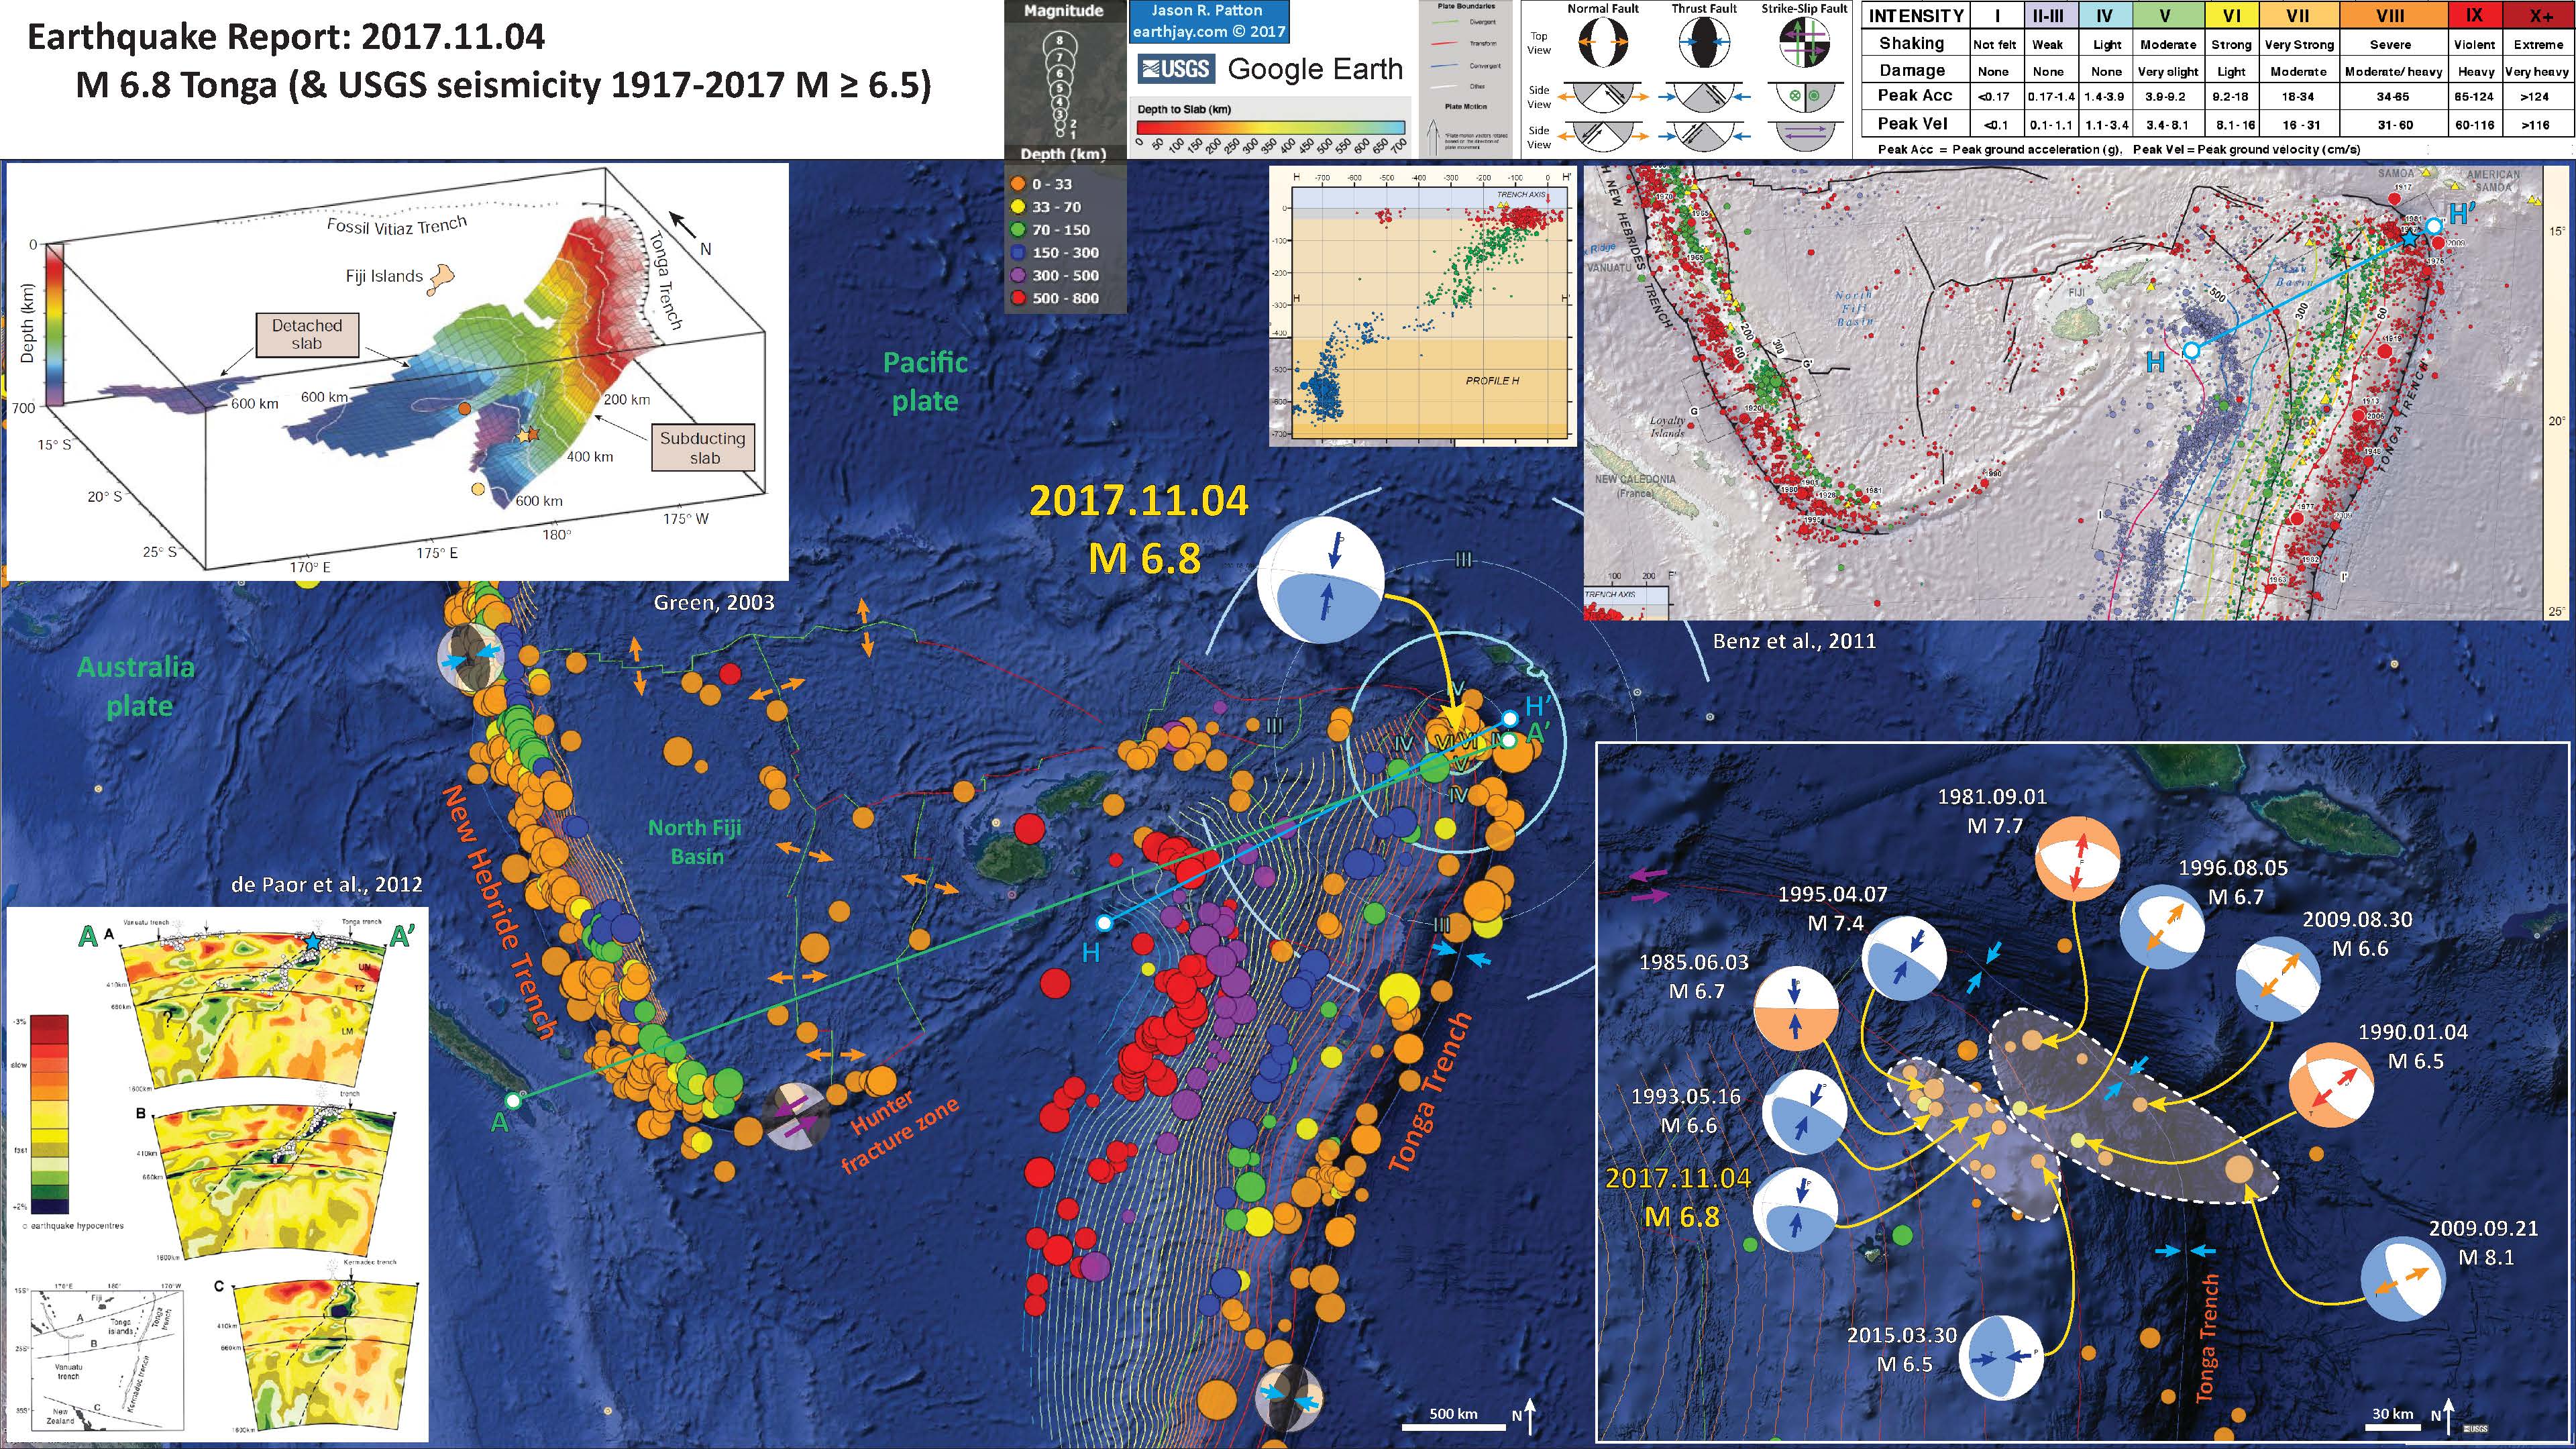
It is interesting that this earthquake happened just a few days after the sequence to the west, though these earthquakes are probably too far away to be related. Here is my report from a couple days ago. I include the interpretive poster from that earthquake below today’s interpretive poster. I use some of the same figures for both of these posters since they are each in a similar region of the world. Then, moments later, there was an M 5.5 in the Loyalty Islands region. Hmmmmm.
Today’s M 6.8 earthquake did occur near the earthquake from 2009 (almost immediately down-dip of the 2009 earthquake), an M 8.1 earthquake in the downgoing slab, that caused a large and damaging tsunami in the Samoa Islands.
- Here are the USGS websites for the M 6.8 earthquake.
- 2017.11.04 M 6.8 Tonga
- Here are the USGS earthquake pages for the earthquakes for which I plot fault plane solutions in the inset figure below.
- 1981-09-01 M 7.7
- 1985-06-03 M 6.7
- 1990-01-04 M 6.5
- 1993-05-16 M 6.6
- 1995-04-07 M 7.4
- 1996-08-05 M 6.7
- 2009-08-30 M 6.6
- 2009-09-29 M 8.1
- 2015-03-30 M 6.5
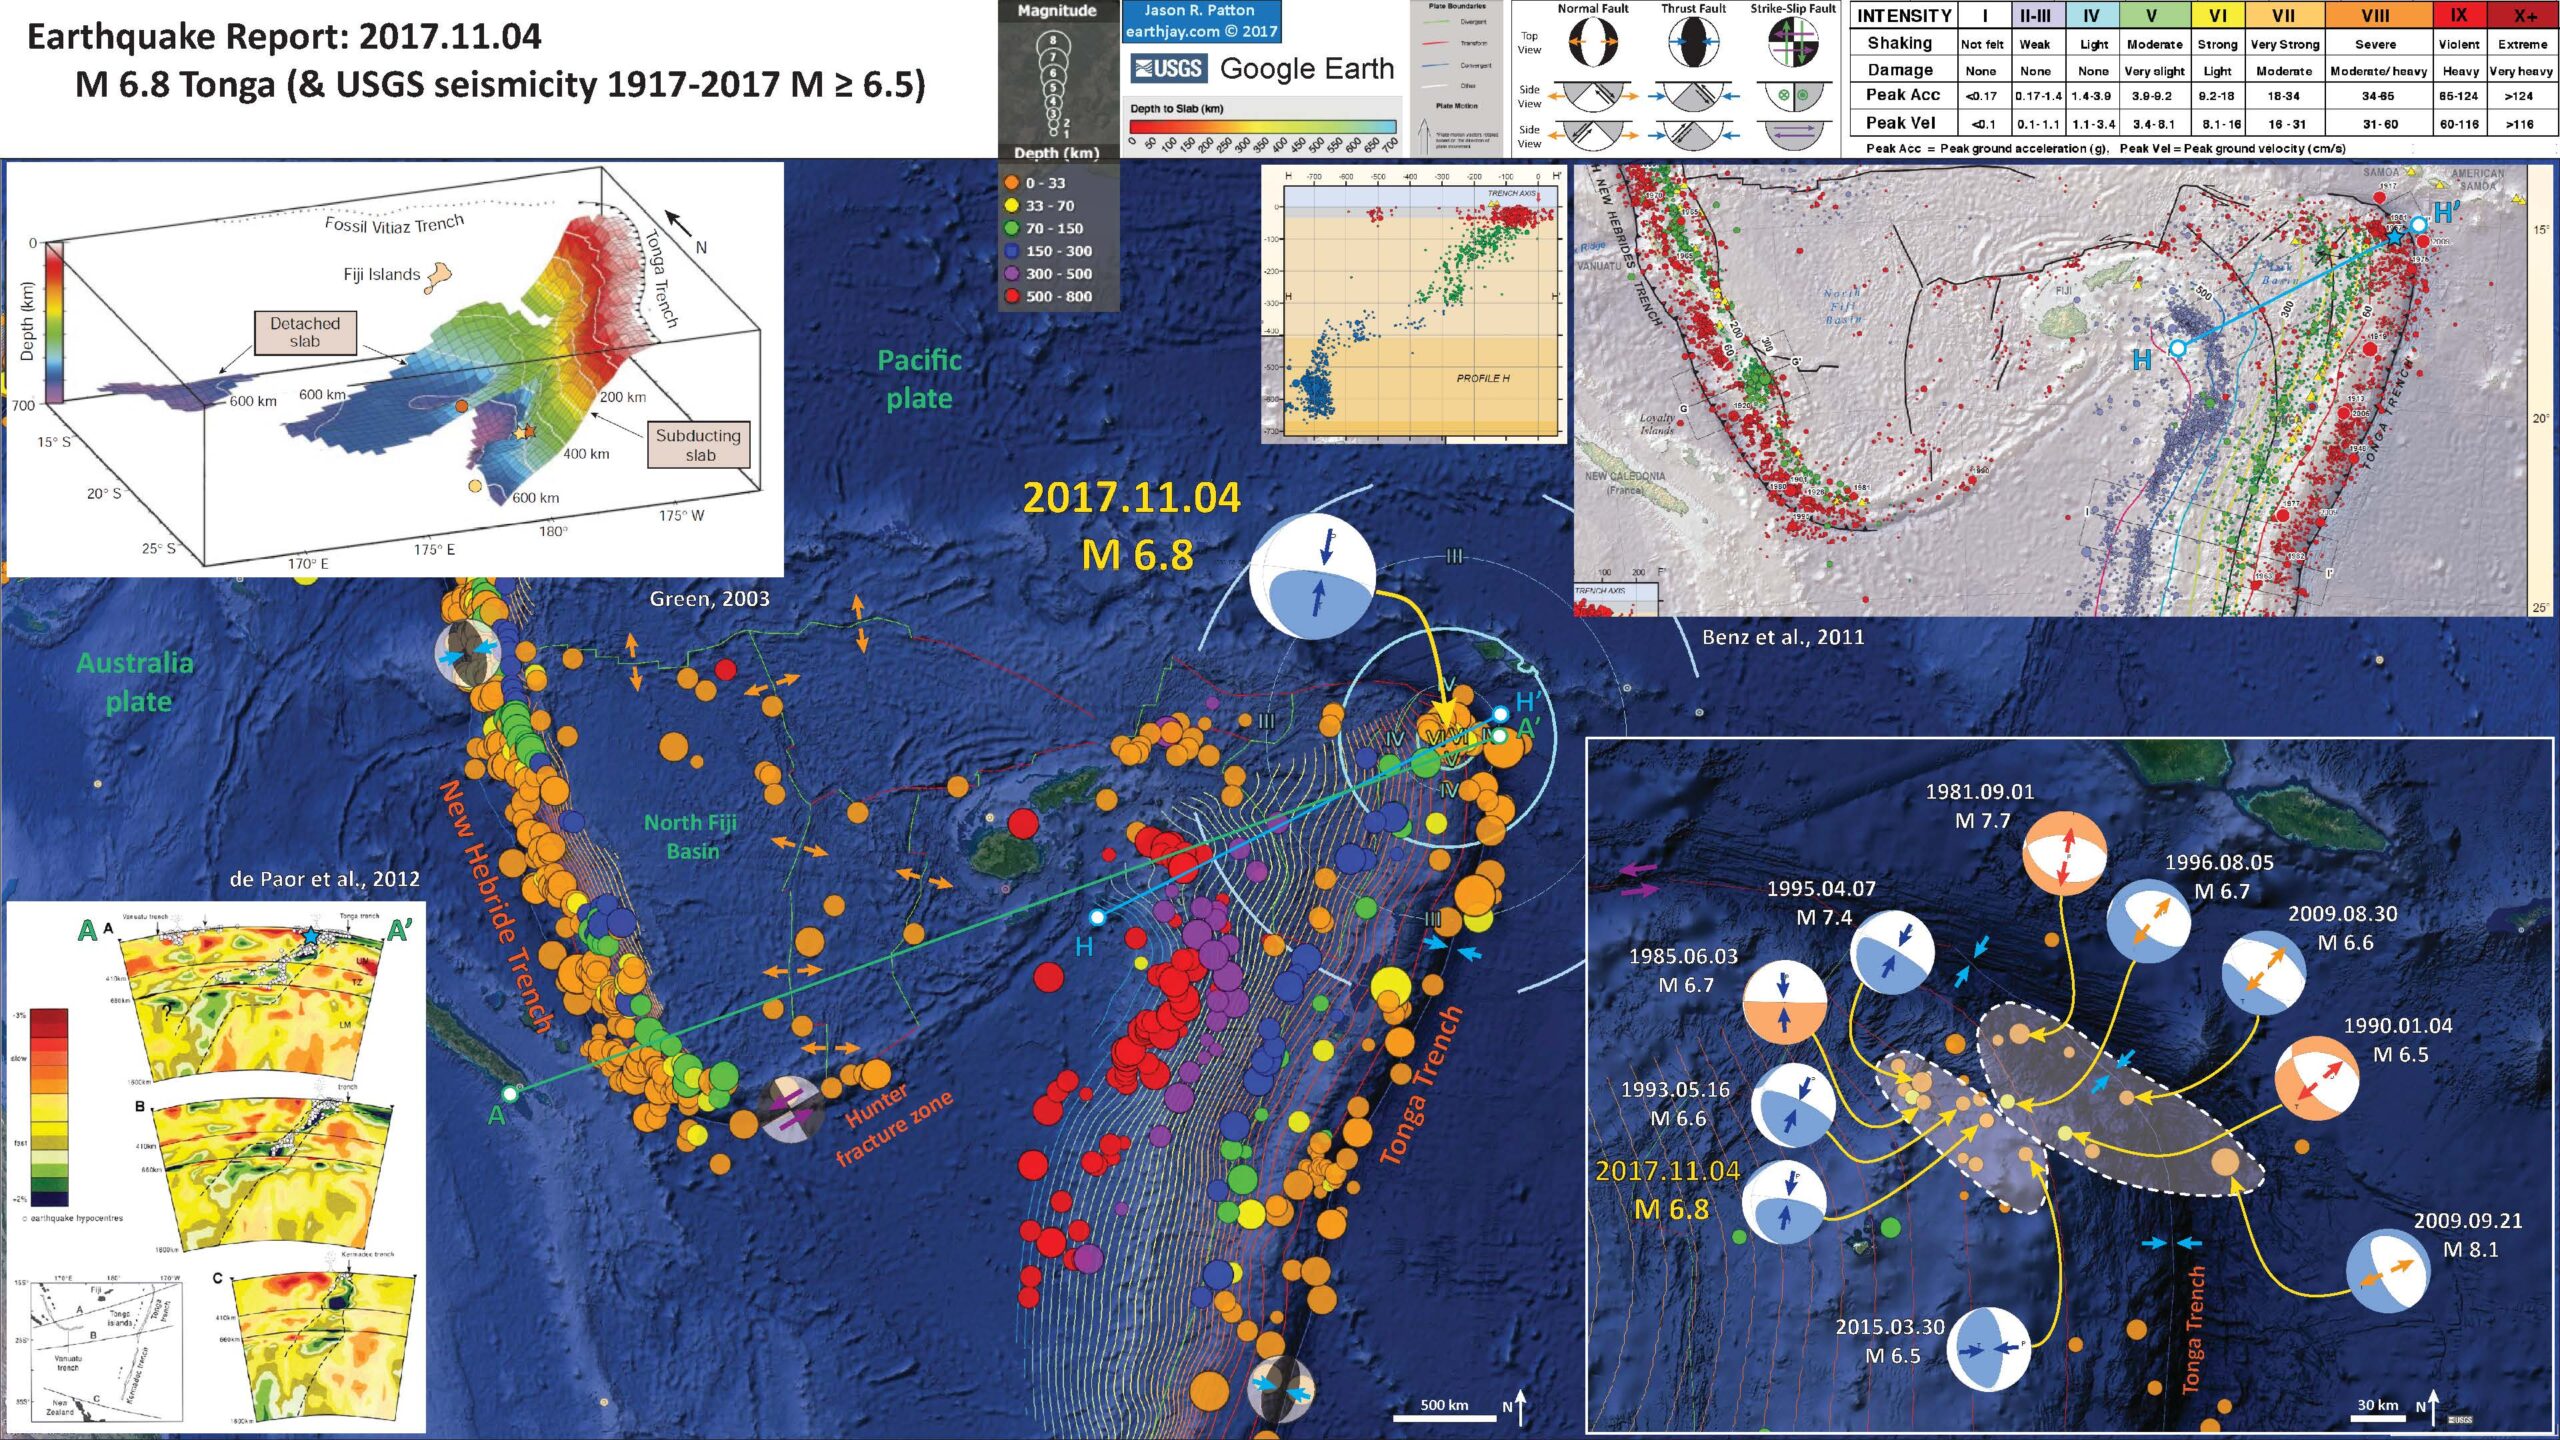
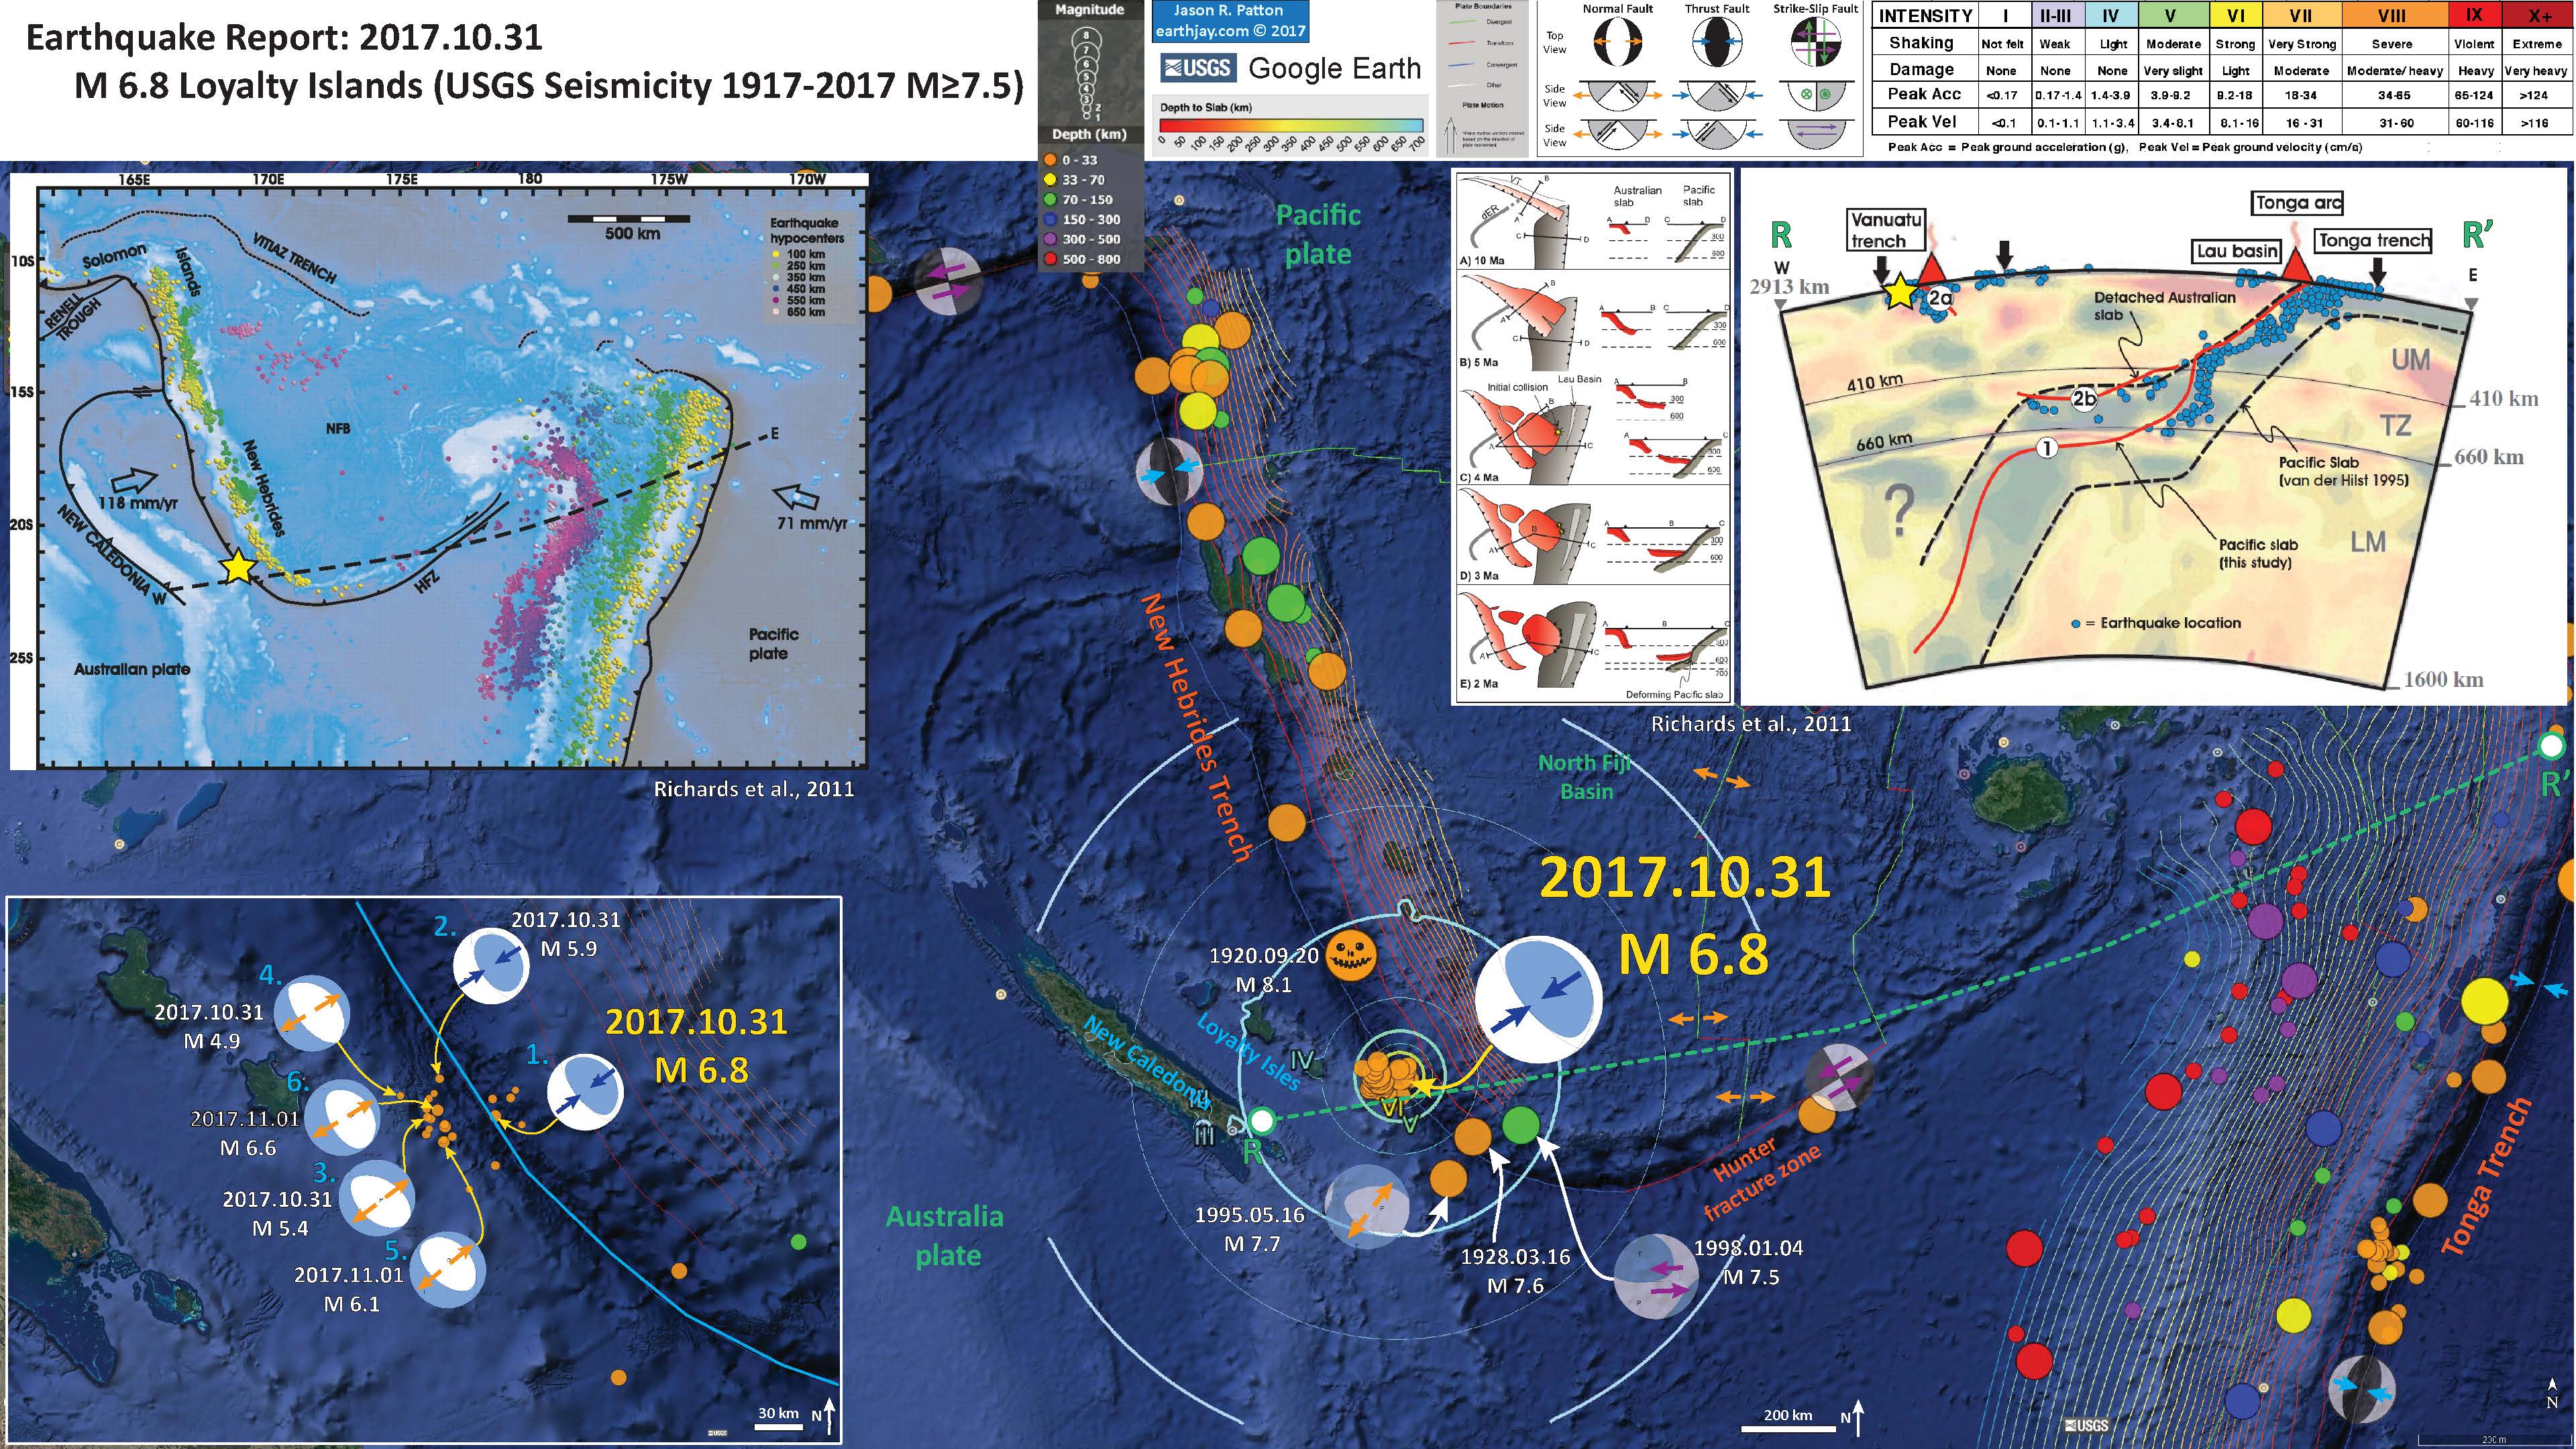
Below is my interpretive poster for this earthquake.
I plot the seismicity from the past month, with color representing depth and diameter representing magnitude (see legend). I include earthquake epicenters from 1917-2017 with magnitudes M ≥ 6.5.
- I placed a moment tensor / focal mechanism legend on the poster. There is more material from the USGS web sites about moment tensors and focal mechanisms (the beach ball symbols). Both moment tensors and focal mechanisms are solutions to seismologic data that reveal two possible interpretations for fault orientation and sense of motion. One must use other information, like the regional tectonics, to interpret which of the two possibilities is more likely.
- I also include the shaking intensity contours on the map. These use the Modified Mercalli Intensity Scale (MMI; see the legend on the map). This is based upon a computer model estimate of ground motions, different from the “Did You Feel It?” estimate of ground motions that is actually based on real observations. The MMI is a qualitative measure of shaking intensity. More on the MMI scale can be found here and here. This is based upon a computer model estimate of ground motions, different from the “Did You Feel It?” estimate of ground motions that is actually based on real observations.
- I include the slab contours plotted (Hayes et al., 2012), which are contours that represent the depth to the subduction zone fault. These are mostly based upon seismicity. The depths of the earthquakes have considerable error and do not all occur along the subduction zone faults, so these slab contours are simply the best estimate for the location of the fault.
-
I include some inset figures.
- In the upper right corner is a map from Benz et al. (2011) that shows seismicity with color representing depth and circle diameter representing magnitude. This report is available online for more information. I include the general location of this M 6.8 earthquake as a blue star. Cross section H-H’ is plotted on the left of the map. I include the location of this x-sec on the main map as a blue line.
- In the lower left corner are several more cross sections as determined from seismic tomography (de Paor et al., 2012). Seismic tomography is basically an X-ray of Earth’s interior that uses seismic waves rather than X-rays. More on seismic tomography can be found here or here. The cross section A-A’ is shown on the main map as a green line.
- In the upper left corner is a low-angle oblique view of the megathrust fault (the slab). This is from Green (2003).
- In the lower left corner I plot the USGS moment tensors (blue) and focal mechanisms (orange) for earthquakes in this region. These earthquakes fit two distinct domains (outlined in dashed white).
The easternmost quakes are in the downgoing Pacific plate and are the result of extension (either slab tension or due to bending in the upper part of the plate). The westernmost quakes are either near the megathrust (subduction zone) or in the upper plate (most appear to be in the upper plate). Something that all earthquakes share is that their principal strain direction (the orientation of maximum or minimum stress) rotates with the orientation of the subduction zone fault. This may represent strain partitioning at this plate boundary. Basically, thrust earthquakes tend to be oriented perpendicular to the megathrust fault strike, and there are other strike-slip earthquakes that accommodate the non-perpendicular plate motion. There are no examples of these strike-slip earthquakes here. The subduction zone here is quite complicated as there is backarc spreading and a complex interaction between mantle flow at the edge of the subduction zone and a hotspot plume.
- Here is the oblique view of the slab from Green (2003).

Earthquakes and subducted slabs beneath the Tonga–Fiji area. The subducting slab and
detached slab are defined by the historic earthquakes in this region: the steeply dipping surface descending from the Tonga Trench marks the currently active subduction zone, and the surface lying mostly between 500 and 680 km, but rising to 300 km in the east, is a relict from an old subduction zone that descended from the fossil Vitiaz Trench. The locations of the mainshocks of the two Tongan earthquake sequences discussed by Tibi et al. are marked in yellow (2002 sequence) and orange (1986 series). Triggering mainshocks are denoted by stars; triggered mainshocks by circles. The 2002 sequence lies wholly in the currently subducting slab (and slightly extends the earthquake distribution in it),whereas the 1986 mainshock is in that slab but the triggered series is located in the detached slab,which apparently contains significant amounts of metastable olivine
- Here is a great figure showing an interpretation of how the mantle flow and hotspot plume may interact here (Chang et al., 2015).

Illustrated time history of the plume–slab interaction and a cartoon for summarizing current features. (a) The Samoan plume is generated at the Mega ULVZ19 at the core–mantle boundary and is ascending to the surface. (b) The Samoan plume collided with the Tonga slab at the transition zone at about 10 Myr. (c) The upward stress by the collision has caused the stagnant slab and intense seismicity (cross marks), which is further enhanced by fast slab retreat (red arrow) due to the subduction of the Hikurangi plateau. (d) A schematic diagram illustrating the slab–plume interaction beneath the Tonga–Kermadec arc. Cyan lines on the surface show trenches, as shown in Fig. 1. HP, Hikurangi Plateau; KT, Kermadec Trench; NHT, New Hebrides Trench; TT, Tonga Trench; VT, Vitiaz Trench. The Samoan plume originates from a Mega ULVZ at the core–mantle boundary (CMB). The buoyancy caused by large
stress from the plume at the bottom of the Tonga slab may contribute to the slab stagnation within the mantle transition zone, while the Kermadec slab is penetrating into the lower mantle directly. At the northern end of the Tonga slab, plume materials migrate into the mantle wedge, facilitated by strong toroidal flow around the slab edge induced by fast slab retreat.
- Here are figures from Richards et al. (2011) with their figure captions below in blockquote.
- The main tectonic map
- Here is the map showing the current configuration of the slabs in the region.
- This is the cross section showing the megathrust fault configuration based on seismic tomography and seismicity.
- Here is their time step interpretation of the slabs that resulted in the second figure above.
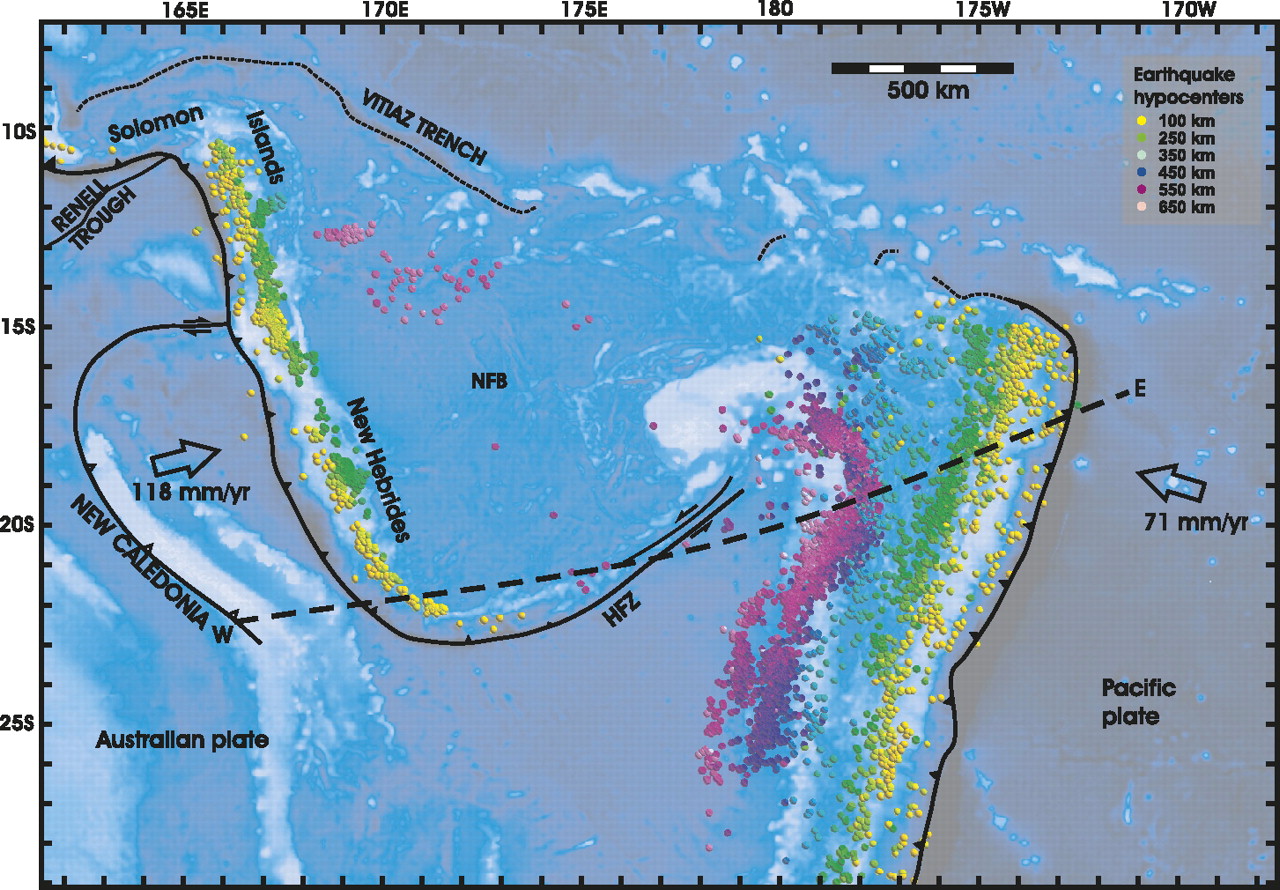
bathymetry, and major tectonic element map of the study area. The Tonga and Vanuatu subduction systems are shown together with the locations of earthquake epicenters discussed herein. Earthquakes between 0 and 70 km depth have been removed for clarity. Remaining earthquakes are color-coded according to depth. Earthquakes located at 500–650 km depth beneath the North Fiji Basin are also shown. Plate motions for Vanuatu are from the U.S. Geological Survey, and for Tonga from Beavan et al. (2002) (see text for details). Dashed line indicates location of cross section shown in Figure 3. NFB—North Fiji Basin; HFZ—Hunter Fracture Zone.
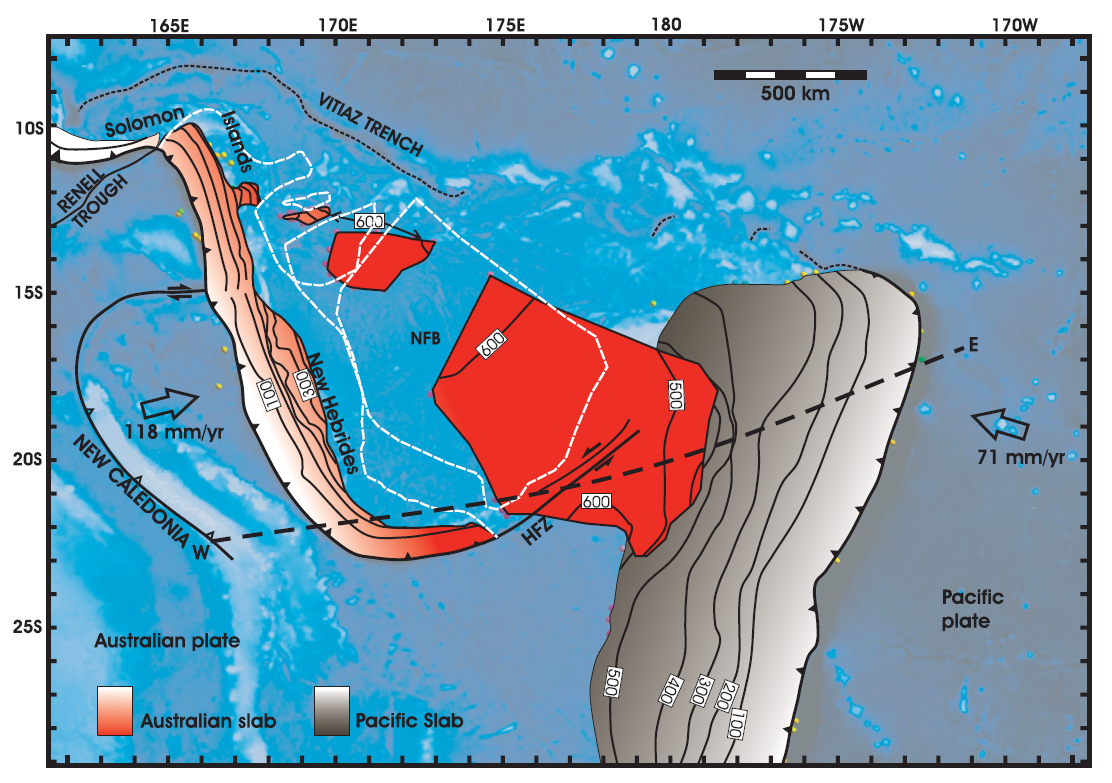
Map showing distribution of slab segments beneath the Tonga-Vanuatu region. West-dipping Pacifi c slab is shown in gray; northeast-dipping Australian slab is shown in red. Three detached segments of Australian slab lie below the North Fiji Basin (NFB). HFZ—Hunter Fracture Zone. Contour interval is 100 km. Detached segments of Australian plate form sub-horizontal sheets located at ~600 km depth. White dashed line shows outline of the subducted slab fragments when reconstructed from 660 km depth to the surface. When all subducted components are brought to the surface, the geometry closely approximates that of the North Fiji Basin.
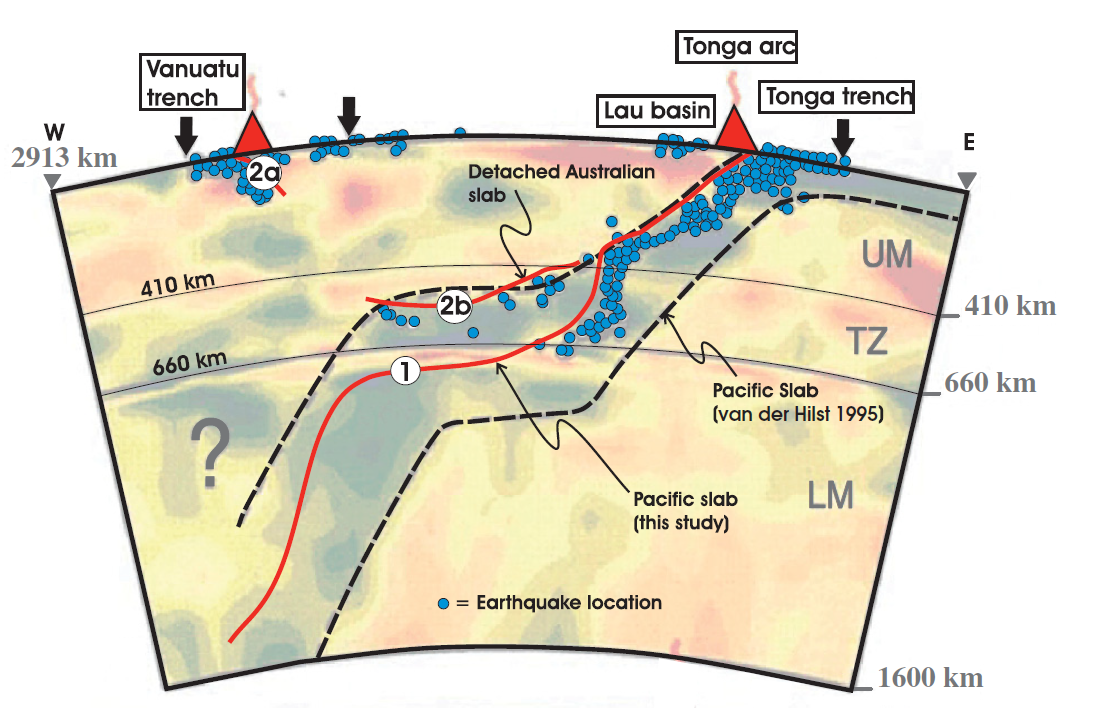
Previous interpretation of combined P-wave tomography and seismicity from van der Hilst (1995). Earthquake hypocenters are shown in blue. The previous interpretation of slab structure is contained within the black dashed lines. Solid red lines mark the surface of the Pacifi c slab (1), the still attached subducting Australian slab (2a), and the detached segment of the Australian plate (2b). UM—upper mantle;
TZ—transition zone; LM—lower mantle.
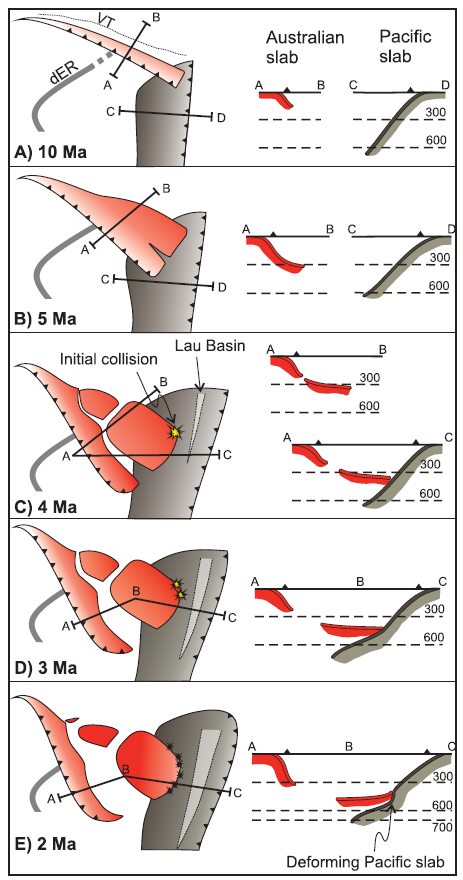
Simplified plate tectonic reconstruction showing the progressive geometric evolution of the Vanuatu and Tonga subduction systems in plan view and in cross section. Initiation of the Vanuatu subduction system begins by 10 Ma. Initial detachment of the basal part of the Australian slab begins at ca. 5–4 Ma and then sinking and collision between the detached segment and the Pacifi c slab occur by 3–4 Ma. Initial opening of the Lau backarc also occurred at this time. Between 3 Ma and the present, both slabs have been sinking progressively to their current position. VT—Vitiaz trench; dER—d’Entrecasteaux Ridge.
- Here is my interpretive poster for the 2017.10.31 earthquake.
- 2017.11.04 M 6.8 Tonga
- 2017.10.31 M 6.8 Loyalty Islands
- 2017.08.27 M 6.4 N. Bismarck plate
- 2017.05.09 M 6.8 Vanuatu
- 2017.03.19 M 6.0 Solomon Islands
- 2017.03.05 M 6.5 New Britain
- 2017.01.22 M 7.9 Bougainville
- 2017.01.03 M 6.9 Fiji
- 2016.12.17 M 7.9 Bougainville
- 2016.12.08 M 7.8 Solomons
- 2016.10.17 M 6.9 New Britain
- 2016.10.15 M 6.4 South Bismarck Sea
- 2016.09.14 M 6.0 Solomon Islands
- 2016.08.31 M 6.7 New Britain
- 2016.08.12 M 7.2 New Hebrides Update #2
- 2016.08.12 M 7.2 New Hebrides Update #1
- 2016.08.12 M 7.2 New Hebrides
- 2016.04.06 M 6.9 Vanuatu Update #1
- 2016.04.03 M 6.9 Vanuatu
- 2015.03.30 M 7.5 New Britain (Update #5)
- 2015.03.30 M 7.5 New Britain (Update #4)
- 2015.03.29 M 7.5 New Britain (Update #3)
- 2015.03.29 M 7.5 New Britain (Update #2)
- 2015.03.29 M 7.5 New Britain (Update #1)
- 2015.03.29 M 7.5 New Britain
- 2015.11.18 M 6.8 Solomon Islands
- 2015.05.24 M 6.8, 6.8, 6.9 Santa Cruz Islands
- 2015.05.05 M 7.5 New Britain
New Britain | Solomon | Bougainville | New Hebrides | Tonga | Kermadec
General Overview
Earthquake Reports
-
References:
- Benz, H.M., Herman, Matthew, Tarr, A.C., Furlong, K.P., Hayes, G.P., Villaseñor, Antonio, Dart, R.L., and Rhea, Susan, 2011, Seismicity of the Earth 1900–2010 eastern margin of the Australia plate: U.S. Geological Survey Open-File Report 2010–1083-I, scale 1:8,000,000.
- Bird, P., 2003. An updated digital model of plate boundaries in Geochemistry, Geophysics, Geosystems, v. 4, doi:10.1029/2001GC000252, 52 p.
- Chang, S-J., Ferreira, A.M.G., and Faccenda, M., 2015. Upper- and mid-mantle interaction between the Samoan plume and the Tonga–Kermadec slabs in Nature Comms, DOI: 10.1038/ncomms10799
- de Paor, D.G., Wild, S.C., and Dordevic, M.M., 2012. Emergent and animated COLLADA models of the Tonga Trench and Samoa Archipelago: Implications for geoscience modeling, education, and research in Geosphere, v. 8, no. 2, p. 491-506.
- Green, H. W. III., 2003. Earth science: Tiny triggers deep down in Nature, v. 424, p. 893-894
- Hayes, G. P., D. J. Wald, and R. L. Johnson (2012), Slab1.0: A three-dimensional model of global subduction zone geometries, J. Geophys. Res., 117, B01302, doi:10.1029/2011JB008524.
- Lay, T., and Kanamori, H., 1980, Earthquake doublets in the Solomon Islands: Physics of the Earth and Planetary Interiors, v. 21, p. 283-304.
- Richards, S., Holm, R., Barber, G., 2011. When slabs collide: A tectonic assessment of deep earthquakes in the Tonga-Vanuatu region in Geology, v. 39, no. 8., p. 787-790
- Schwartz, S.Y., 1999, Noncharacteristic behavior and complex recurrence of large subduction zone earthquakes: Journal of Geophysical Research, v. 104, p. 23,111-123,125.
- Schwartz, S.Y., Lay, T., and Ruff, L.J., 1989, Source process of the great 1971 Solomon Islands doublet: Physics of the Earth and Planetary Interiors, v. 56, p. 294-310.