I am catching up with this today as I have been busy with other things.
I am still behind on those things, but wanted to get this put together since I am currently working on a project that includes tsunami sources in this region.
There was a magnitude M 7.7 earthquake on 19 May 2023 offshore of New Caledonia.
https://earthquake.usgs.gov/earthquakes/eventpage/at00ruvxj7/executive
This earthquake happened in the Australia plate, west of the deep sea trench.
The deep sea trench owes its existence to the plate boundary fault system there, a convergent plate boundary where plates move towards each other. The plate boundary here is formed by the subduction of the Australia plate beneath the North Fiji Basin.
The largest earthquakes that happen on Earth happen on these subduction zone faults.
At first I thought that this was an interface earthquake along the megathrust subduction zone fault. These are called interface events because they happen along the fault interface between the two plates. They are also called interplate earthquakes.
However, the location showed this to be west of the subduction zone. Also, as the earthquake mechanisms (e.g., focal mechanism or moment tensor) were calculated and posted online, it was clear that this was not a megathrust earthquake.
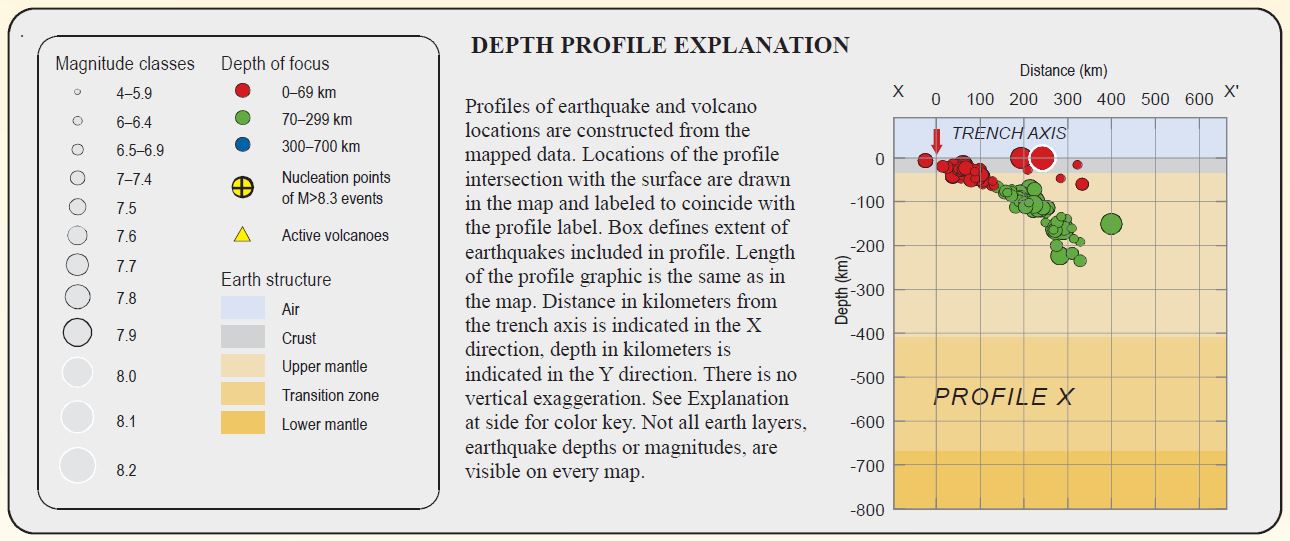
Here is an illustration that shows a cross section of a subduction zone. I show hypothetical locations for different types of earthquakes. I include earthquake mechanisms (as they would be viewed from map view) for these different types of earthquakes.
Here is a legend for these different mechanisms. We can see what the mechanisms look like from map view (from looking down onto Earth from outer space or from flying in an airplane) and what they look like from the side.
The mechanism for the M 7.7 Loyalty Isles earthquake is an extensional (normal) type of an earthquake that happened in the slab of the Australia plate.
Typically, the extension in these slab events is perpendicular to the plate boundary fault because that is the direction that the plate is pulling down (slab pull) due to gravity or that is the orientation of bending of the plate that causes this extension.
There are also records of tsunami and seismic waves on water level sensors in this region. A tsunami was observed on the Ouinne (New Caledonia) tide gage.
Here are the tide gage data from https://webcritech.jrc.ec.europa.eu/SeaLevelsDb/Home.
This M 7.7 earthquake is having lots of aftershocks and the largest was a M 7.1.
https://earthquake.usgs.gov/earthquakes/eventpage/us6000kdce/executive
Not only did the M 7.7 generate a tsunami but so did the M 7.1 earthquake. The plot below shows both earthquake times relative to the tsunami produced by those events.
These tsunami were recorded on other gages as well but this was the best record I saw.
My initial tweet called this normal faulting event a tensional earthquake. Dr. Harold Tobin provided an excellent overview of the difference between tension and extension.
In the Earth, all 3 principal stresses are (nearly) always compressional or inward-directed. A tensional stress state is a rare condition indeed. If the biggest principal stress is vertical, then high-angle (but not vertical!) extensional normal faults are the result. pic.twitter.com/cvYar2f010
— Harold Tobin (@Harold_Tobin) May 20, 2023
Below is my interpretive poster for this earthquake
- I plot the seismicity from the past month, with diameter representing magnitude (see legend). I include earthquake epicenters from 1923-2023 with magnitudes M ≥ 7.5 in one version.
- I plot the USGS fault plane solutions (moment tensors in blue and focal mechanisms in orange), possibly in addition to some relevant historic earthquakes.
- A review of the basic base map variations and data that I use for the interpretive posters can be found on the Earthquake Reports page. I have improved these posters over time and some of this background information applies to the older posters.
- Some basic fundamentals of earthquake geology and plate tectonics can be found on the Earthquake Plate Tectonic Fundamentals page.
- In the lower center is a tectonic map from Patriat et al. (2019). I place a yellow star in the general location of this M 7.7 earthquake.
- In the upper left corner shows the tectonic plates and seismicity from the past century for events with magnitudes larger than M 7.5.
- Below this map is a figure from the USGS that shows their estimate of how much the fault slipped during this M 7.7 earthquake. Dark red shows where the fault may have slipped as much as 3 meters.
- In the lower right corner is a map that shows the earthquake intensity using the modified Mercalli intensity scale. Earthquake intensity is a measure of how strongly the Earth shakes during an earthquake, so gets smaller the further away one is from the earthquake epicenter. The map colors represent a model of what the intensity may be. The USGS has a system called “Did You Feel It?” (DYFI) where people enter their observations from the earthquake and the USGS calculates what the intensity was for that person. The transparent colors with yellow labels show what people actually felt in those different locations.
- in the lower left is the tide gage plot from Ouinne, New Caledonia (location shown on the map).
- In the upper right is a map that shows earthquakes and their aftershock sequences for three events in the past 3 years. There is some overlap, but mostly, these three sequences have aftershocks in different areas. The 2021 and 2022 earthquakes are probably (?) subduction zone earthquakes based on their mechanisms. it sure seems like these two events may have changed the stresses in the Australia plate (i.e., they may have triggered the 2023 earthquake).
- 2021 M 7.7 (green)
- 2022 M 7.0 (blue)
- 2023 M 7.7 (orange)
- Here is the map with a month’s seismicity plotted.
I include some inset figures. Some of the same figures are located in different places on the larger scale map below.

Other Report Pages
Want to read more about this quake and its tectonic setting? Read my new blog article about it – and the other weird earthquakes in the area, with all kinds of interactions between quakes in the outer rise and on the megathrust.
Find the link in my bio! pic.twitter.com/NpBRDv40BU
— Dr. Judith Hubbard (@JudithGeology) May 20, 2023
- Here is the plate tectonic map from Patriat et al. (2019).
- This is the plate tectonic map from de Alteriis et al. (1993) that shows the major fault systems in the region.
- Here is a figure from Schellart et al. (2002) that shows their model of tectonic development of the North Fiji Basin. Schellart et al. (2002) include a long list of references for the tectonics in this region here. Below I include the text from the original figure caption in blockquote.
- This is the plate tectonic history map from Begg and Gray (1993) that shows how they interpret the Fiji Plateau to have formed.
- (a) Map of the Fiji platform and north end of the Lau Ridge showing the major islands in the Fiji area, the major early Pliocene volcanoes of Viti Levu, the major seafloor fracture zones, and part of the spreading center of the Fiji Basin (adapted from Gill and Whelan [1989]). Shoshonitic volcanoes, including the Tavua Volcano (T), are shown by squares and calc-alkaline volcanoes by circles.
- (b) Tectonic features of the northeastern segment of the plate boundary between the Australian and Pacific plates showing the Outer Melanesian Arc of the southwest Pacific, trenches and ridge systems, and oceanic plateaus (adapted from Kroenke [1984]). Fiji, as part of the Fiji Platform, consists of a series of islands at the north end of the Lau Ridge, with the North Fiji Basin formed as part of a spreading center.
- (c) Present plate configuration.
- (d) Reconstruction at 5.5 Ma.
- (e) Reconstruction at 10 Ma. In Figures 1a–1e the Australian plate is fixed and the east-west convergence rate between plates was assumed to be 9–10 cm yr-1. Shading represents submarine depths <2000 m.
- Abbreviations are as follows: VT, Vitiaz trench; VAT, Vanuatu trench; LR, Lau Ridge; LB, Lau Basin; TR, Tonga Ridge; FFZ, Fiji Fracture Zone; LL, Lomaiviti lineament; V-BL, Vatulele-Beqa lineament. Long dashes denote southern margin of the Melanesian Border Plateau (MBP). The open square (Figures 1b and 1c) denotes the location of the Tavua Volcano.
- Here are figures from Richards et al. (2011) with their figure captions below in blockquote.
- The main tectonic map
- Here is the map showing the current configuration of the slabs in the region.
- This is the cross section showing the megathrust fault configuration based on seismic tomography and seismicity.
- Here is their time step interpretation of the slabs that resulted in the second figure above.
- Here is a map from the USGS report (Benz et al., 2011). Read more about this map on the USGS website. Earthquakes are plotted with color related to depth and circle diameter related to magnitude. Today’s M 6.8 earthquake occurred south of cross section G-G’.
- This is the legend.
-
Here is a cross section showing the seismicity along swatch profile G-G’.
- Craig et al. (2014) evaluated the historic record of seismicity for subduction zones globally. In particular, the evaluated the relations between upper and lower plate stresses and earthquake types (cogent for the southern New Hebrides trench). Below is a figure from their paper for this part of the world. I include their figure caption below in blockquote.
- Here is a summary figure from Craig et al. (2014) that shows different stress configurations possibly existing along subduction zones.
- Here is an animation that shows the seismicity for this region from 1960 – 2016 for earthquakes with magnitudes greater than or equal to 7.0.
- I include some figures mentioned in my report from 2016.04.28 for a sequence of earthquakes in the same region as today’s earthquake (albeit shallower hypocentral depths), in addition to a plot from Cleveland et al. (2014). In the upper right corner, Cleveland et al. (2014) on the left plot a map showing earthquake epicenters for the time period listed below the plot on the right. On the right is a plot of earthquakes (diameter = magnitude) of earthquakes with latitude on the vertical axis and time on the horizontal axis. Cleveland et al (2014) discuss these short periods of seismicity that span a certain range of fault length along the New Hebrides Trench in this area. Above is a screen shot image and below is the video. To see more about the tectonics in the Vanuatu region, head over to a report from January 2023.
- Here is a link to the embedded video below (6 MB mp4)
- Here is a great overview map from Schellart et al. (2006).
- There is a cross section in subsequent figures and the location of this section is shown on the map on the left.
- Below is a series of cross sections (location on above map) through time.
- The panels start at 85 million years ago (Ma) and proceed to the present time (panel H).
- Here is a reconstruction that Schellart et al. (2006) prepared for the past 10 Ma.
- Here is an interesting paper where van de Lagemaat et al. (2018) work out the tectonic history of the region between New Zealand, Australia, and the Loyalty Islands.
- They prepare a tectonic model to reconstruct the tectonic history and compare their model with seismic tomography models.
- Here we see some tomographic cross sections from van de Lagemaat et al. (2018). The colder/denser crust is shown in blue (an oversimplification). We can identify the subducted plates as the blue regions that have a downward going shape.
- This is a summary of their plate tectonic reconstruction.
- Here is a great figure from here, the New Caledonian Seismologic Network. This shows how geologists have recorded uplift rates along dip (“perpendicular” to the subduction zone fault). On the left is a map and on the right is a vertical profile showing how these rates of uplift change east-west. This is the upwards flexure related to the outer rise, which causes extension in the upper part of the downgoing/subducting plate.
Some Relevant Discussion and Figures
The U.S. Geological Survey (USGS) has a spectacular web page that helps us learn about the plate tectonics (seismotectonics) of the eastern margin of the Australia plate. Check out their webpage here.
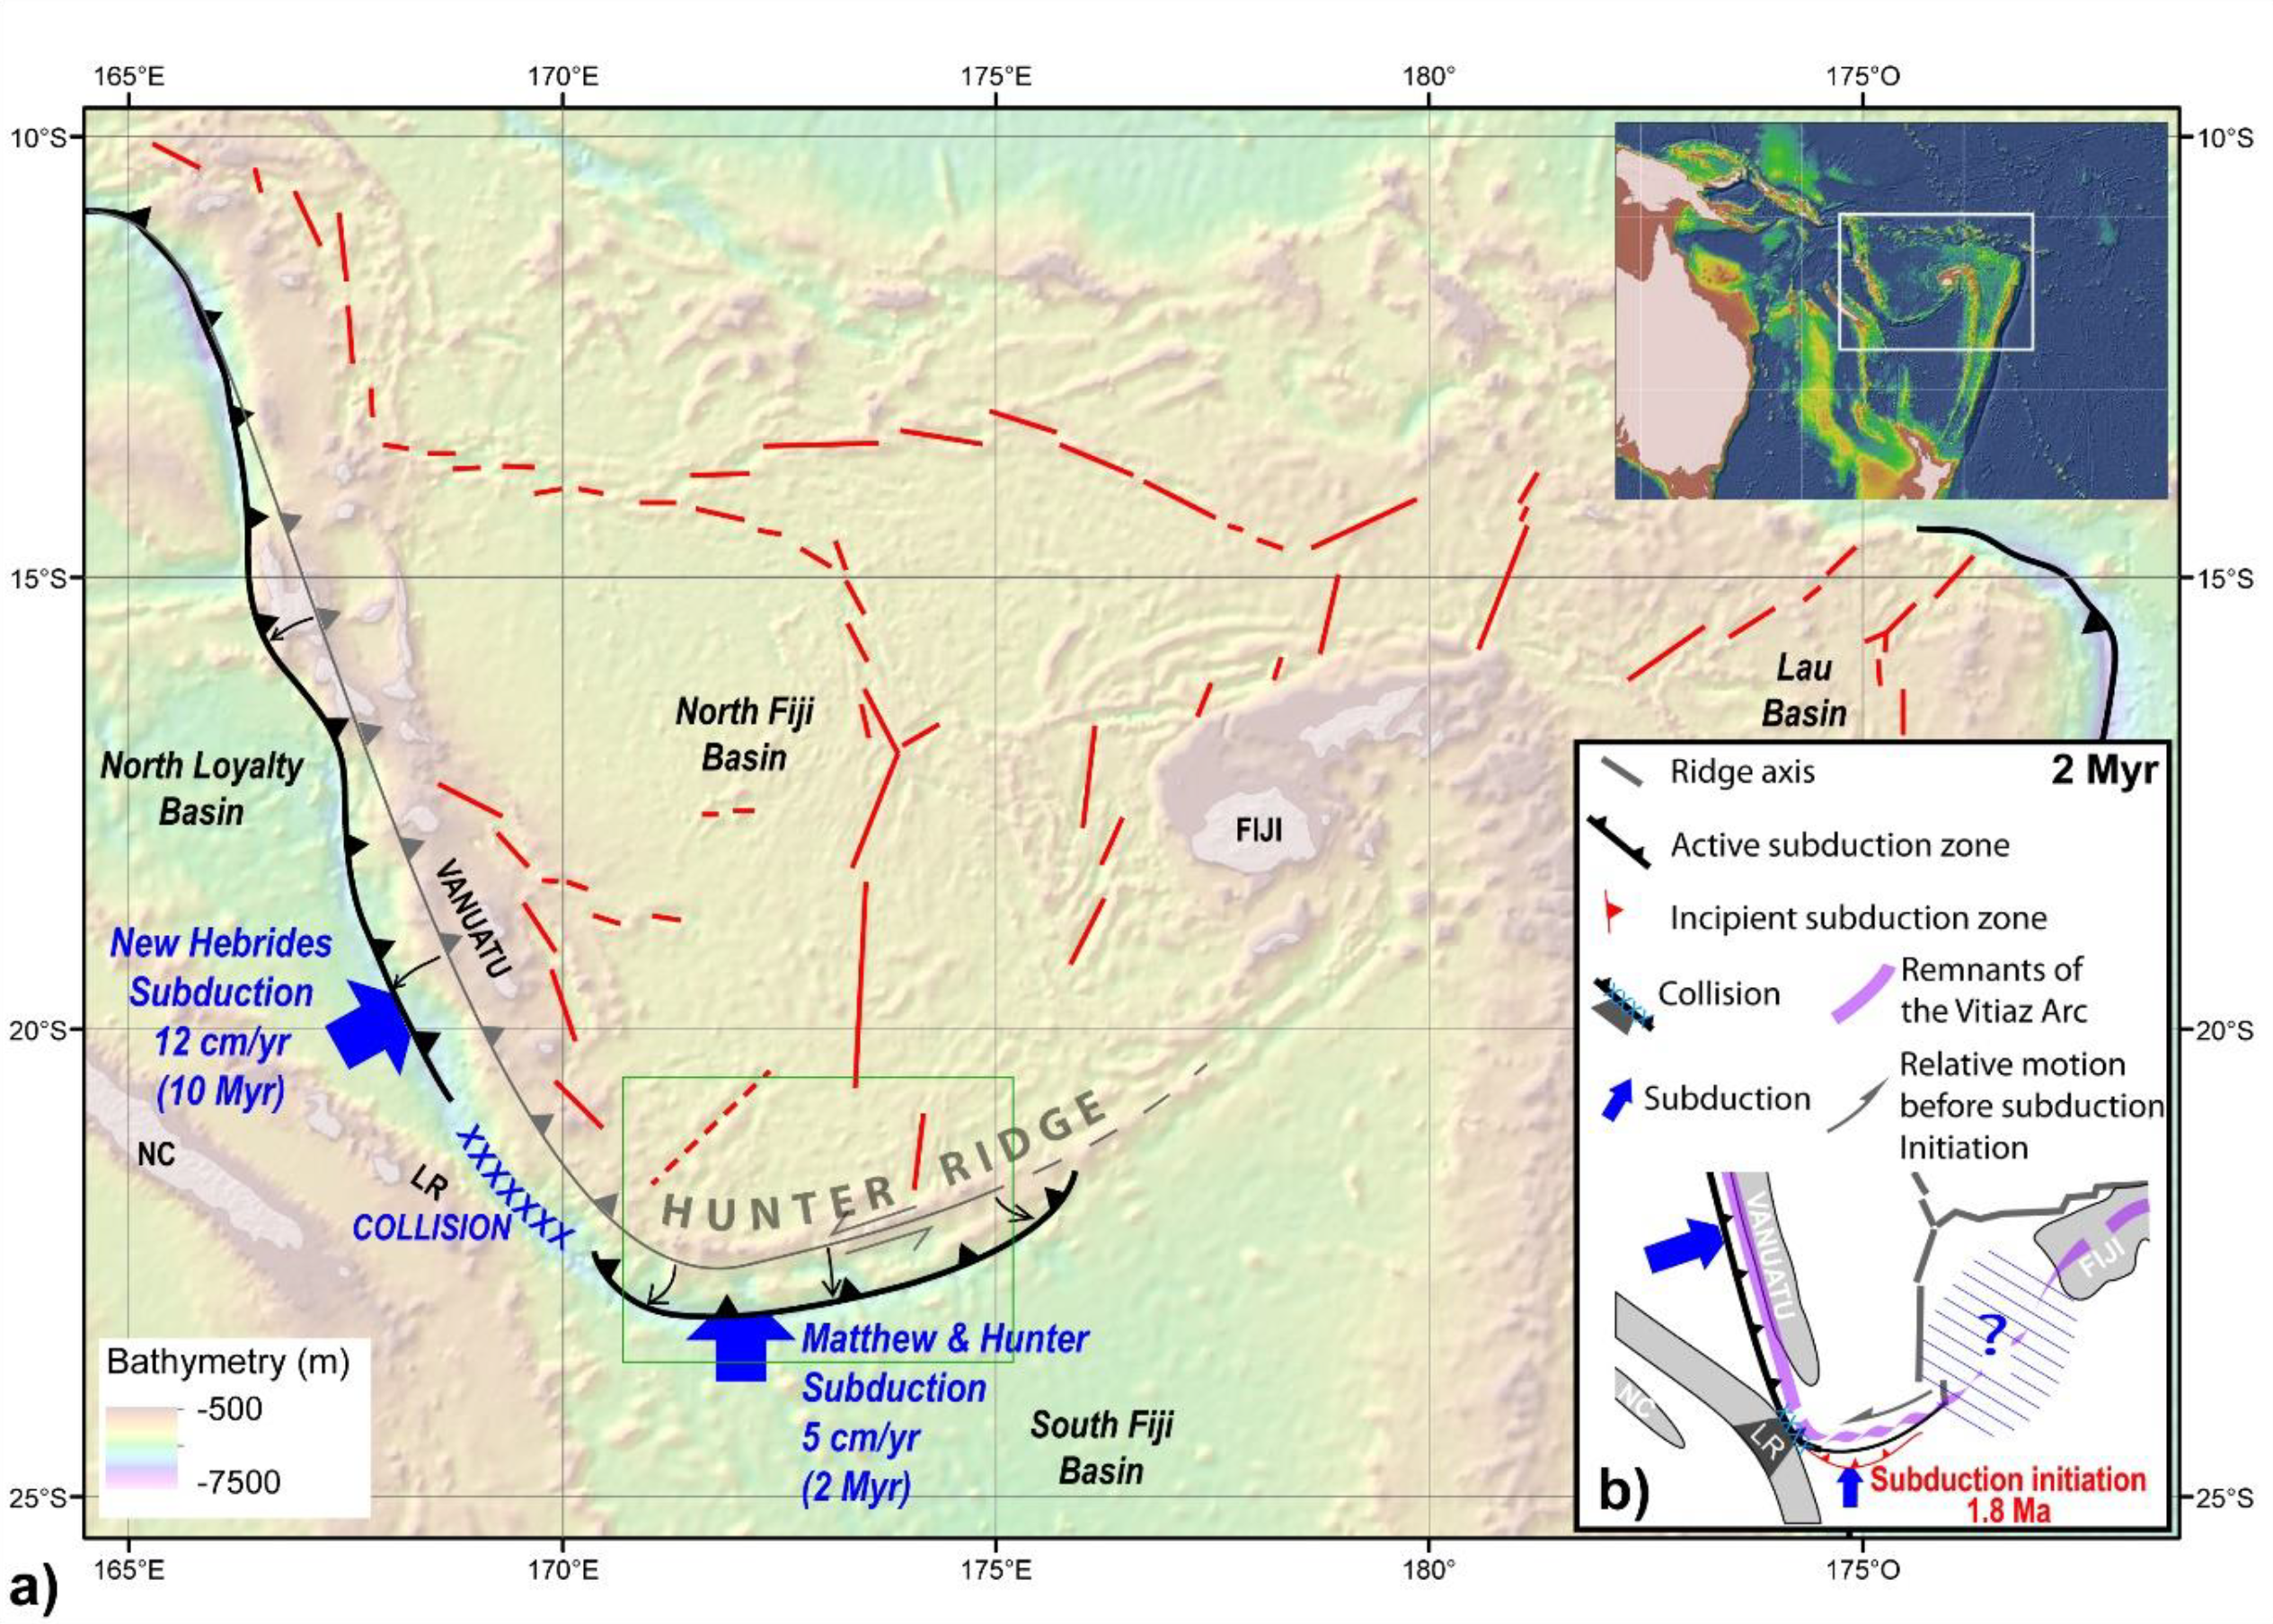
A) Simplified present-day geodynamic map of the New Hebrides and Matthew-Hunter subduction systems (modern trenches shown in black). Inferred location of the New Hebrides subduction and its termination as a STEP fault before 2 Ma shown in light grey. Inset map shows the regional bathymetry. B) Schematic evolution of the North Fiji Basin when the system shifted from a STEP fault to subduction initiation at 2 Ma (after Patriat et al., 2015). LR, Loyalty Ridge; NC, New Caledonia.

Location map of North Fiji Basin ridge; box indicates full multibeam covered area of Figure 2. Heavy lines denote north-south, N15°, and N160° main segments of ridge axis; dashed lines are pseudofaults indicating double propagation. F. Z.— fracture zone.

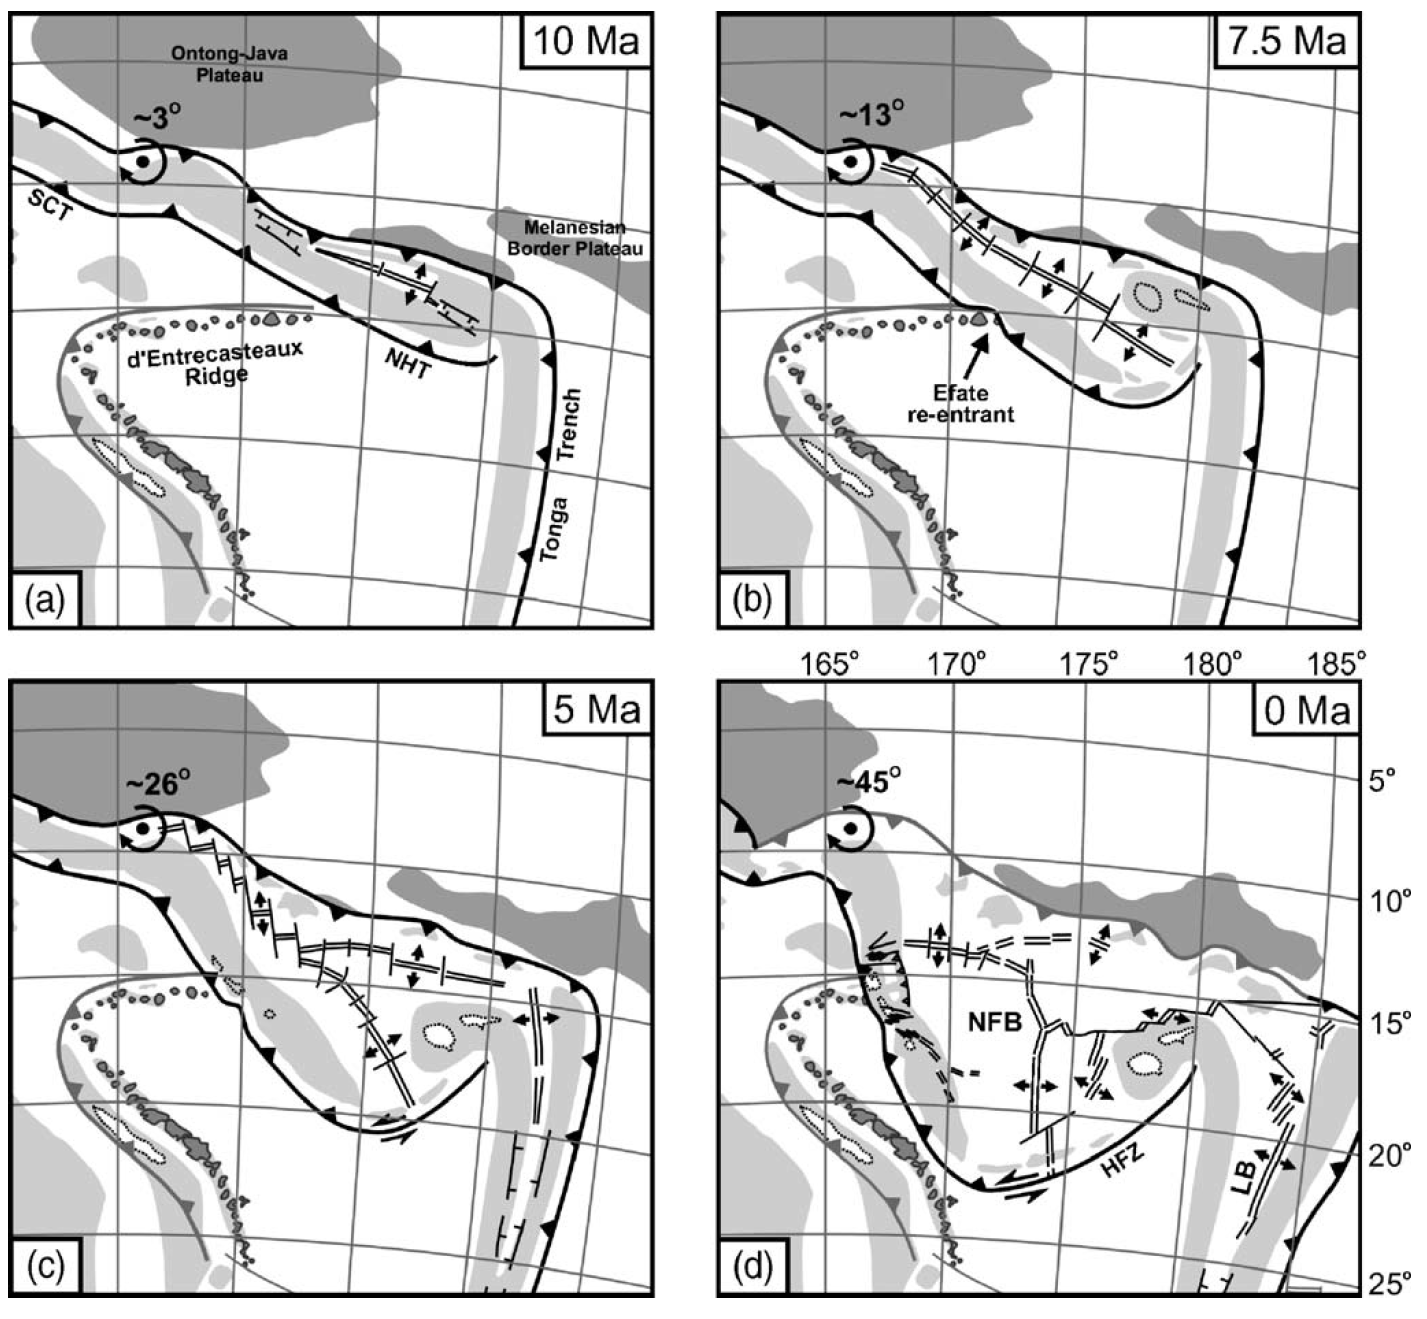
Tectonic reconstruction of the New Hebrides – Tonga region (modified and interpreted from Auzende et al. [1988], Pelletier et al. [1993], Hathway [1993] and Schellart et al.(2002a)) at (a) ~ 13 Ma, (b) ~ 9 Ma, (c) 5 Ma and (d) Present. The Indo-Australian plate is fixed. DER = d’Entrcasteaux Ridge, HFZ = Hunter Fracture Zone, NHT = New Hebrides Trench, TT = Tonga Trench, WTP = West Torres Plateau. Arrows indicate direction of arc migration. During opening of the North Fiji Basin, the New Hebrides block has rotated some 40-50° clockwise [Musgrave and Firth 1999], while the Fiji Plateau has rotated some 70-115° anticlockwise [Malahoff et al. 1982]. During opening of the Lau Basin, the Tonga Ridge has rotated ~ 20° clockwise [Sager et al. 1994]. (Click for enlargement)

Tectonic setting (Figures 1a–1c) and tectonic reconstructions (Figures 1d and 1e) of the Outer Melanesian region (adapted from Hathway [1993]; reprinted with permission from the Geological Society of London).
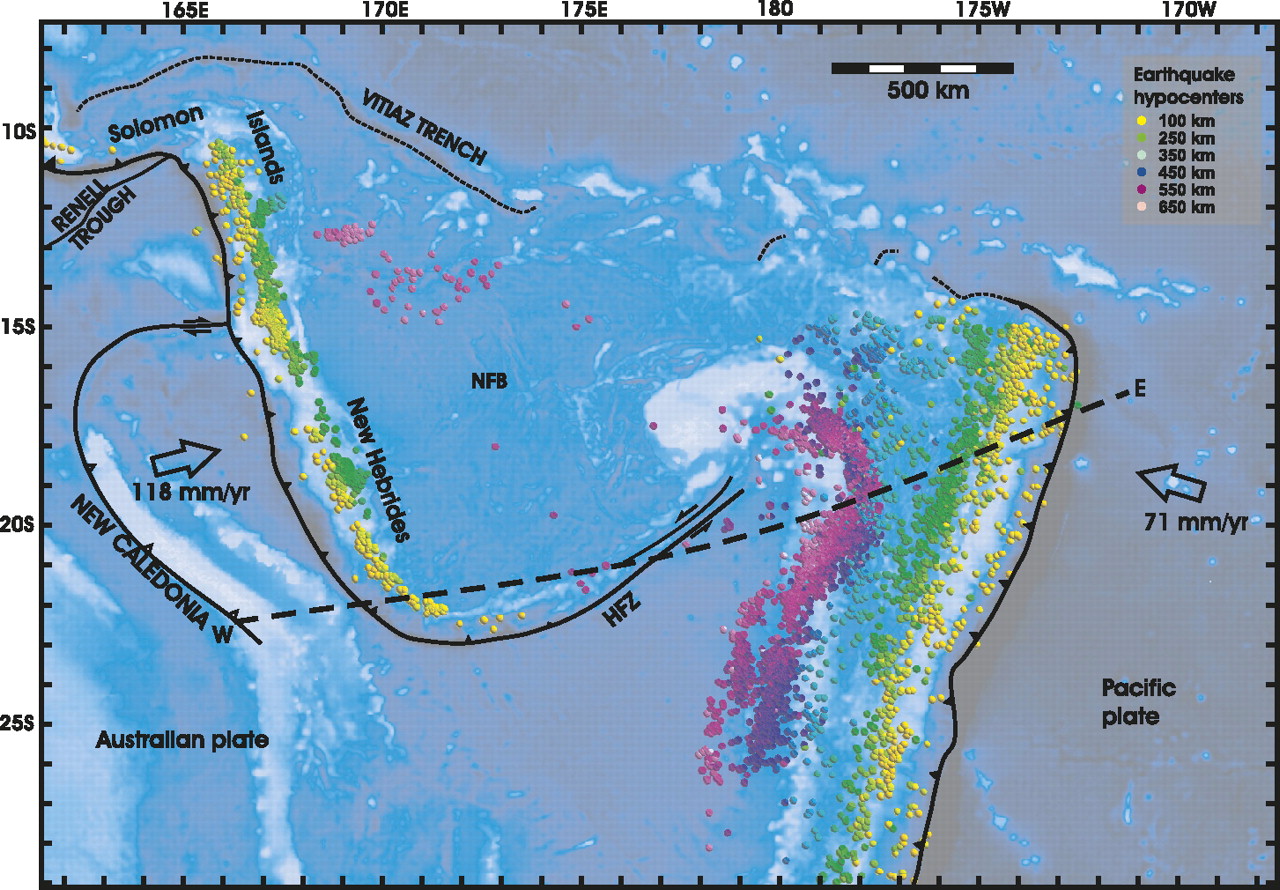
bathymetry, and major tectonic element map of the study area. The Tonga and Vanuatu subduction systems are shown together with the locations of earthquake epicenters discussed herein. Earthquakes between 0 and 70 km depth have been removed for clarity. Remaining earthquakes are color-coded according to depth. Earthquakes located at 500–650 km depth beneath the North Fiji Basin are also shown. Plate motions for Vanuatu are from the U.S. Geological Survey, and for Tonga from Beavan et al. (2002) (see text for details). Dashed line indicates location of cross section shown in Figure 3. NFB—North Fiji Basin; HFZ—Hunter Fracture Zone.
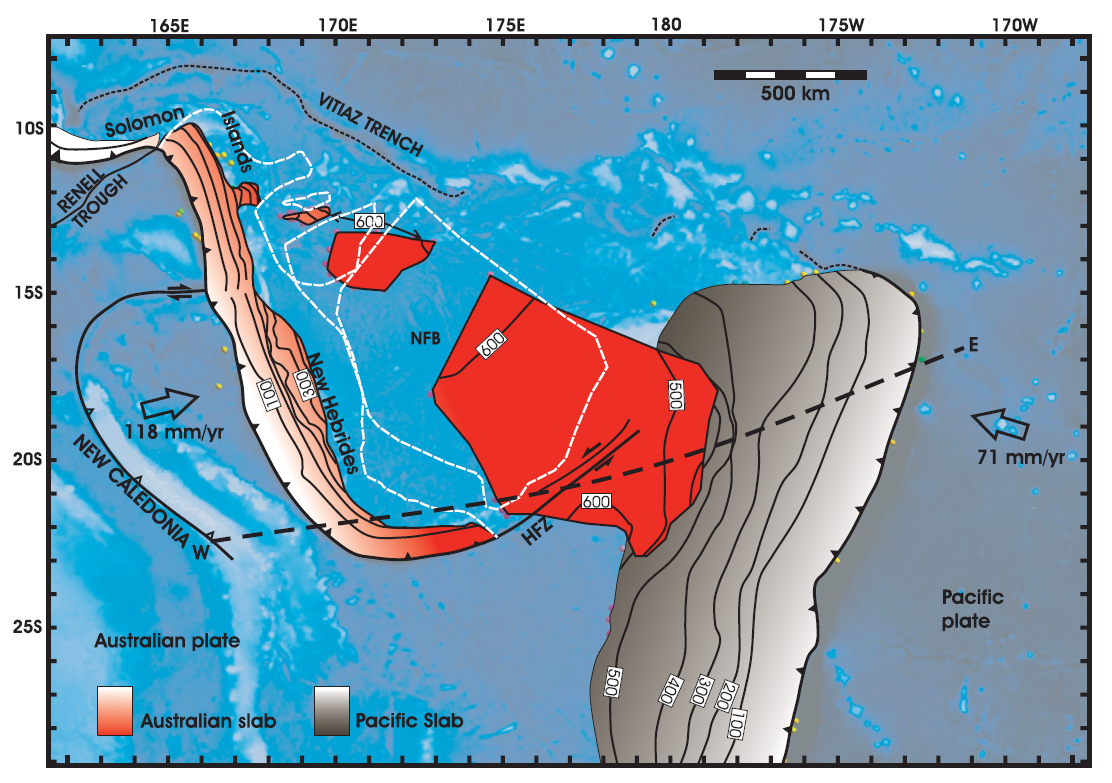
Map showing distribution of slab segments beneath the Tonga-Vanuatu region. West-dipping Pacifi c slab is shown in gray; northeast-dipping Australian slab is shown in red. Three detached segments of Australian slab lie below the North Fiji Basin (NFB). HFZ—Hunter Fracture Zone. Contour interval is 100 km. Detached segments of Australian plate form sub-horizontal sheets located at ~600 km depth. White dashed line shows outline of the subducted slab fragments when reconstructed from 660 km depth to the surface. When all subducted components are brought to the surface, the geometry closely approximates that of the North Fiji Basin.
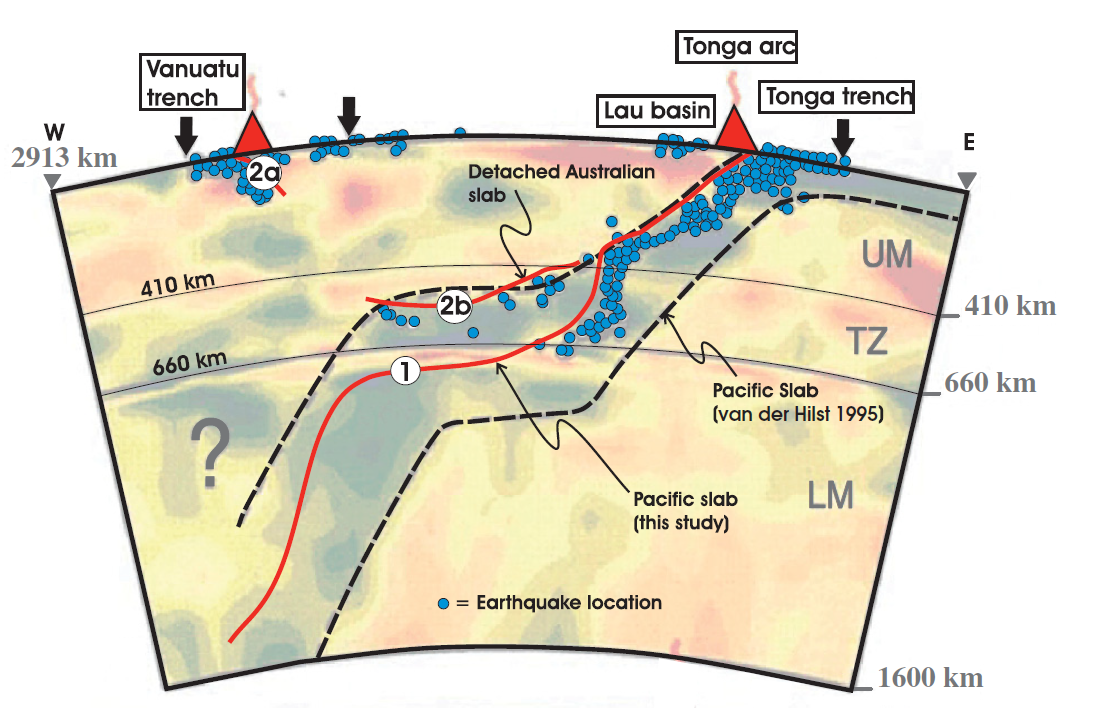
Previous interpretation of combined P-wave tomography and seismicity from van der Hilst (1995). Earthquake hypocenters are shown in blue. The previous interpretation of slab structure is contained within the black dashed lines. Solid red lines mark the surface of the Pacifi c slab (1), the still attached subducting Australian slab (2a), and the detached segment of the Australian plate (2b). UM—upper mantle;
TZ—transition zone; LM—lower mantle.
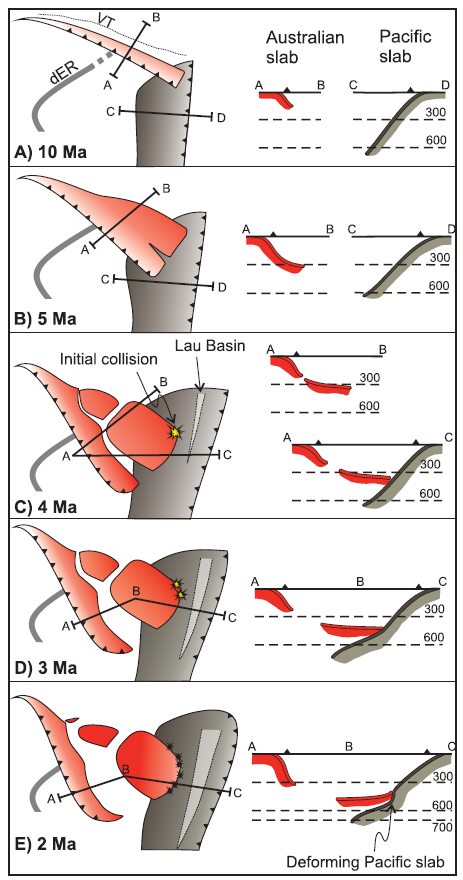
Simplified plate tectonic reconstruction showing the progressive geometric evolution of the Vanuatu and Tonga subduction systems in plan view and in cross section. Initiation of the Vanuatu subduction system begins by 10 Ma. Initial detachment of the basal part of the Australian slab begins at ca. 5–4 Ma and then sinking and collision between the detached segment and the Pacifi c slab occur by 3–4 Ma. Initial opening of the Lau backarc also occurred at this time. Between 3 Ma and the present, both slabs have been sinking progressively to their current position. VT—Vitiaz trench; dER—d’Entrecasteaux Ridge.


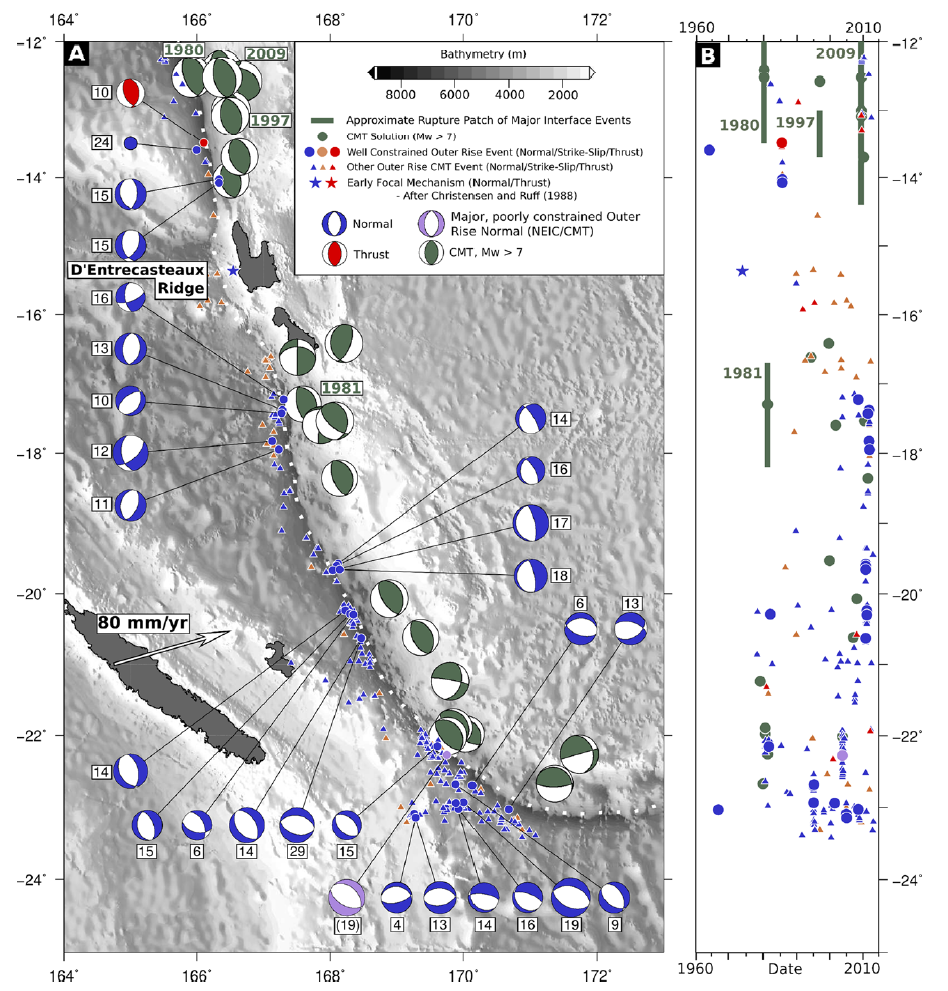
Outer-rise seismicity along the New Hebrides arc. (a) Seismicity and focal mechanisms. Seismicity at the southern end of the arc is dominated by two major outer-rise normal faulting events, and MW 7.6 on 1995 May 16 and an MW 7.1 on 2004 January 3. Earthquakes are included from Chapple & Forsyth (1979); Chinn & Isacks (1983); Liu & McNally (1993). (b) Time versus latitude plot.
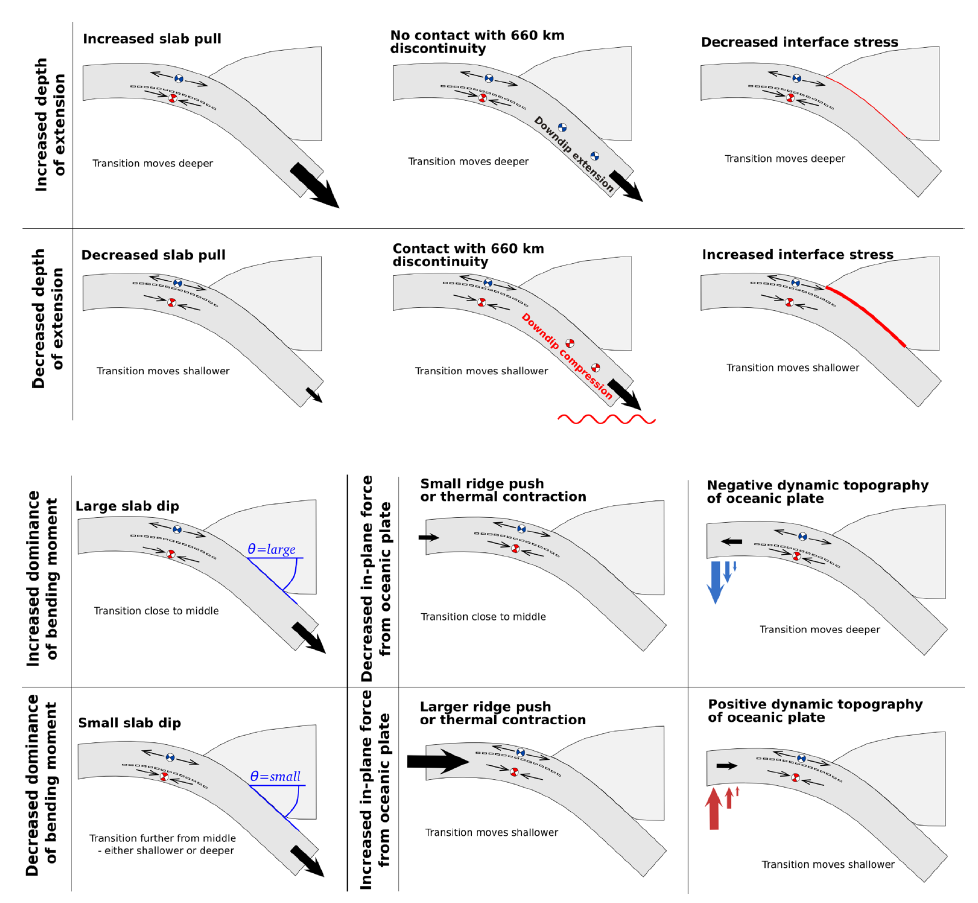
Schematic diagram for the factors influencing the depth of the transition from horizontal extension to horizontal compression beneath the outer rise. Slab pull, the interaction of the descending slab with the 660 km discontinuity (or increasing drag from the surround mantle), and variations in the interface stress influence both the bending moment and the in-plane stress. Increases in the angle of slab dip increases the dominance of the bending moment relative to the in-plane stress, and hence moves the depth of transition towards the middle of the mechanical plate from either an shallower or a deeper position. A decrease in slab dip enhances the influence of the in-plane stress, and hence moves the transition further from the middle of the mechanical plate, either deeper for an extensional in-plane stress, or shallower for a compressional in-plane stress. Increased plate age of the incoming plate leads to increases in the magnitude of ridge push and intraplate thermal contraction, increasing the in-plane compressional stress in the plate prior to bending. Dynamic topography of the oceanic plate seawards of the trench can result in either in-plane extension or compression prior to the application of the bending stresses.

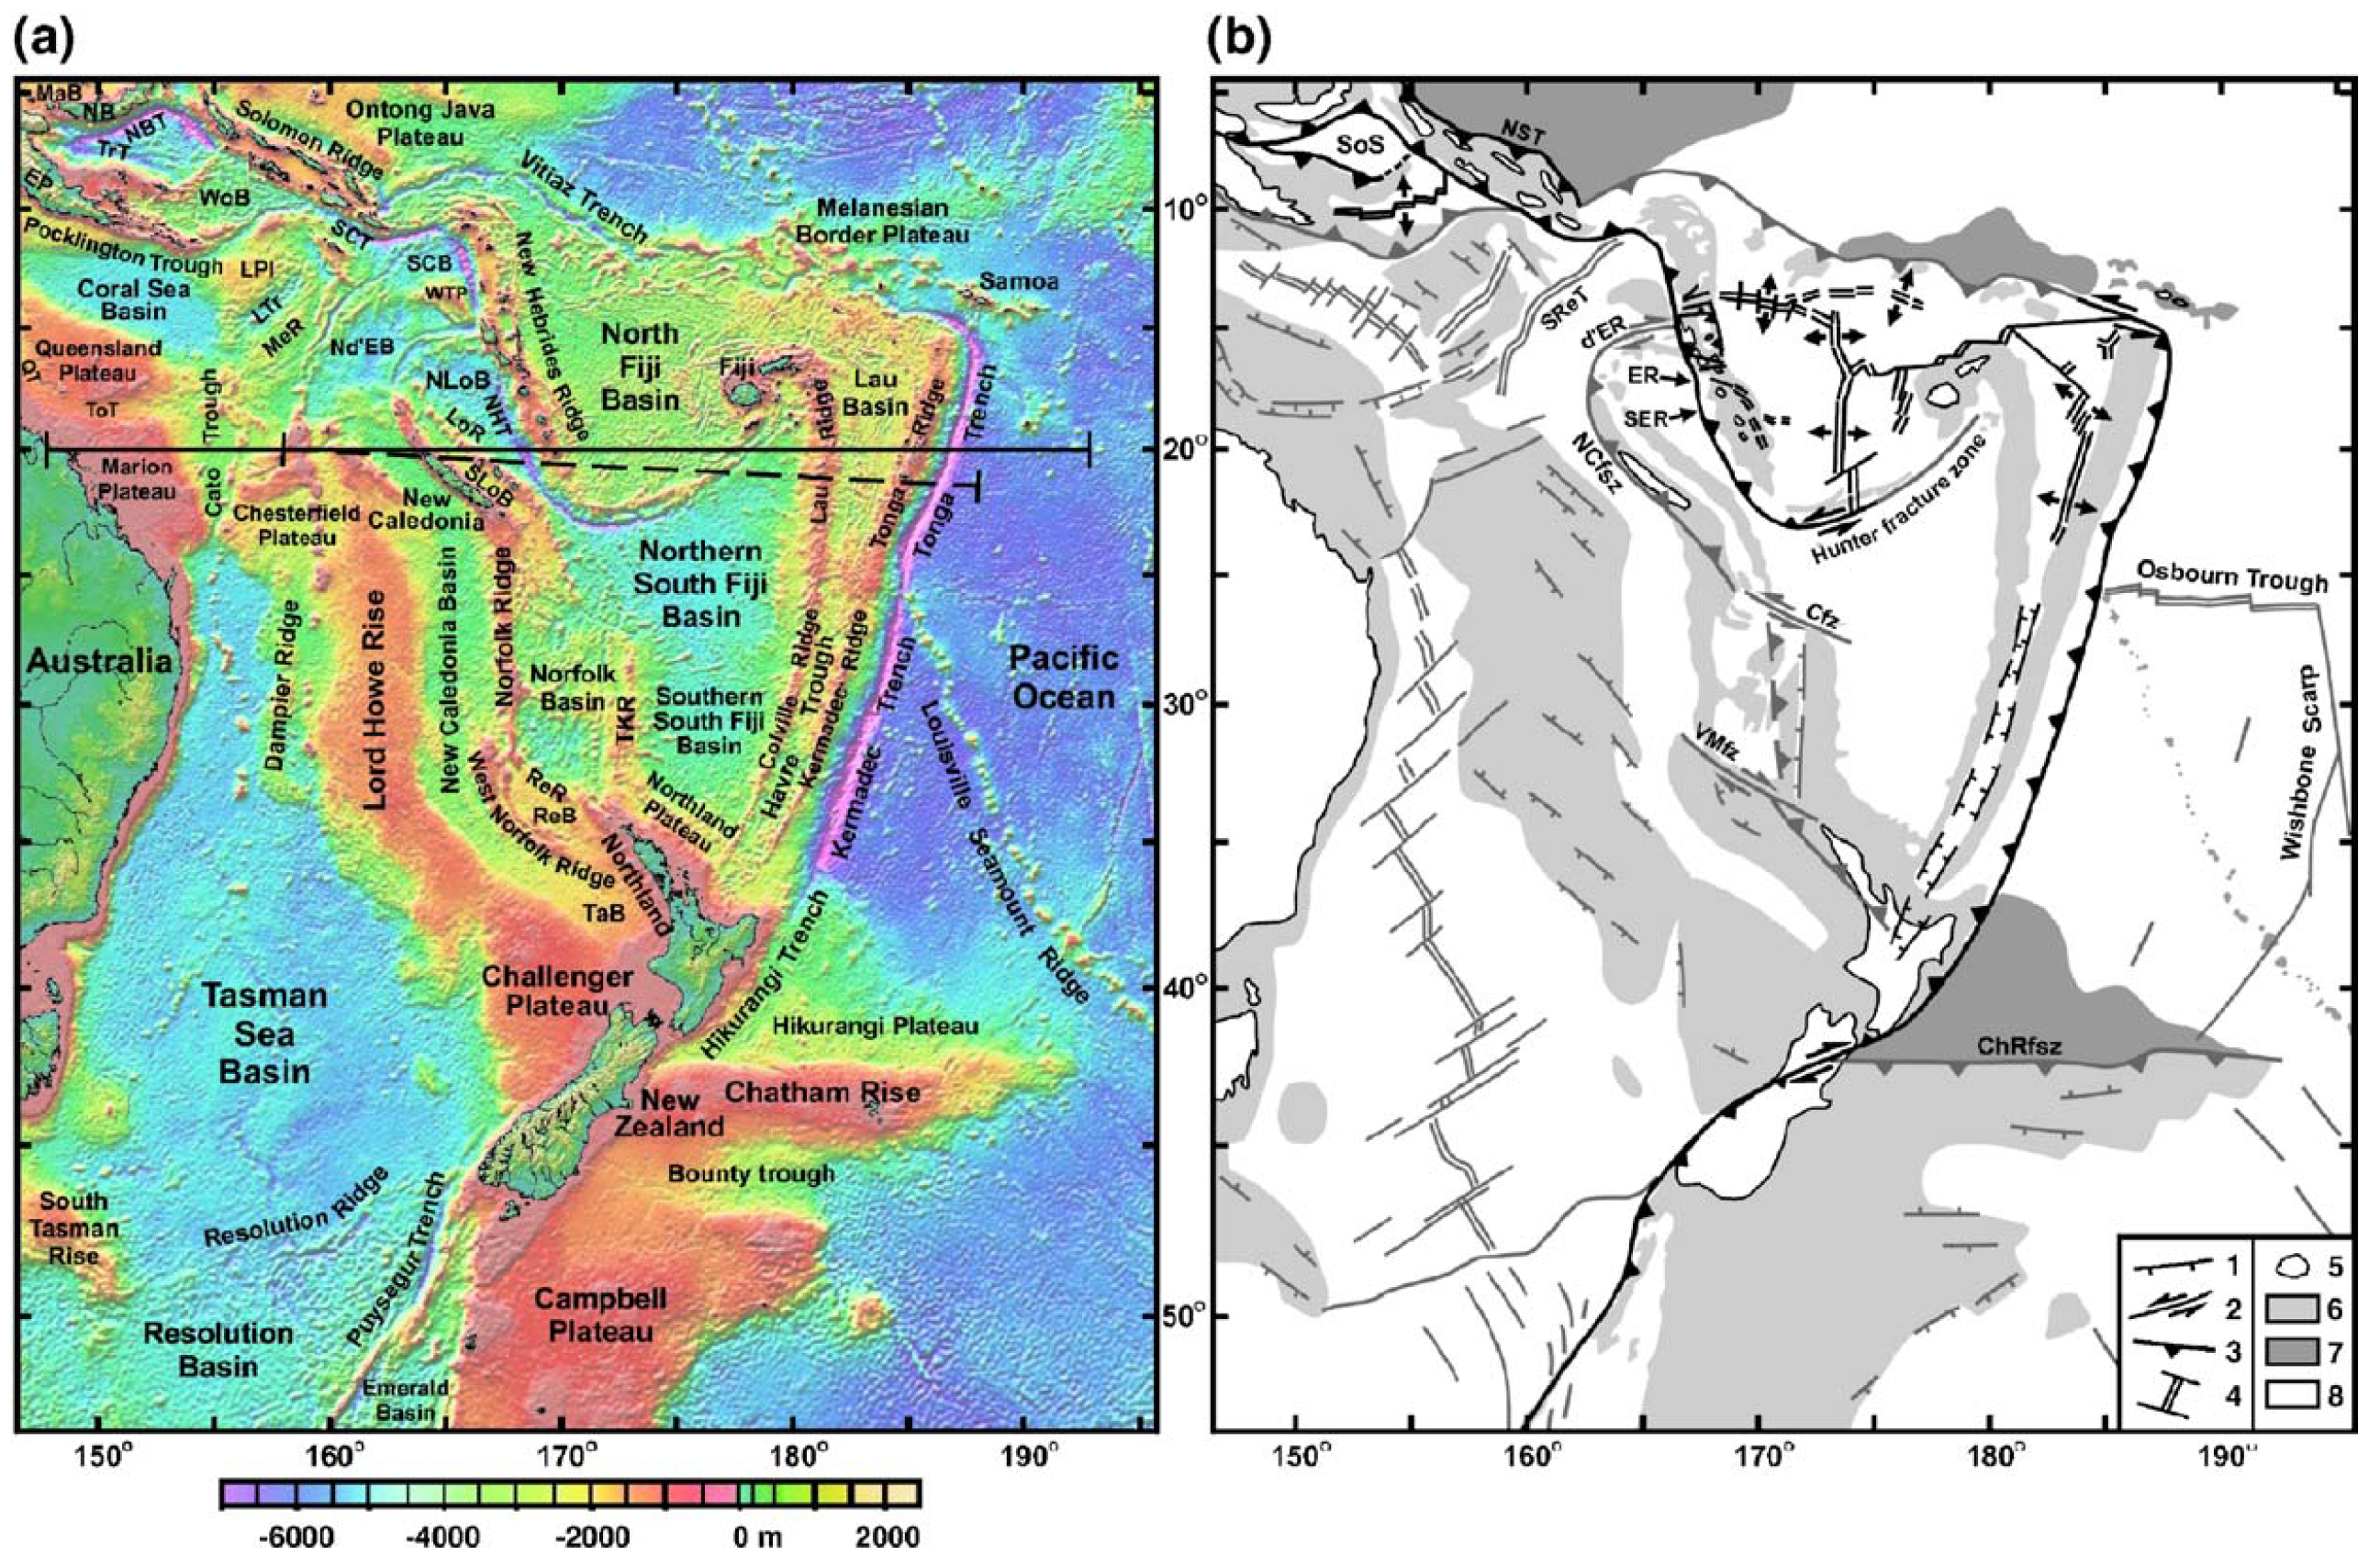
(a) Topography and bathymetry of the Southwest Pacific region (from Smith and Sandwell (1997)) and (b) regional tectonic setting of (a). Cfz, Cook fracture zone; ChRfsz, Chatham Rise fossil subduction zone; d’ER, d’Entrecasteaux Ridge; EP, East Papua; ER, Efate Re-entrant; LPl, Louisiade Plateau; LoR, Loyalty Ridge; LTr, Louisiade Trough; MaB, Manus Basin; MeR, Melish Rise; NB, New Britain; NBT, New Britain Trench; NCfsz, New Caledonia fossil subduction zone; Nd’EB, North d’Entrecasteaux Basin; NHT, New Hebrides Trench; NLoB, North Loyalty Basin; NST, North Solomon Trough; QT, Queensland Trough; ReB, Reinga Basin, ReR, Reinga Ridge; SCB, Santa Cruz Basin; SCT, San Cristobal Trench; SER, South Efate Re-entrant; SLoB, South Loyalty Basin; SoS, Solomon Sea; SReT, South Rennell Trough; TaB, Taranaki Basin; TKR, Three Kings Ridge; ToT, Townsville Trough; TrT, Trobriand Trough; VMfz, Vening Meinesz fracture zone;WoB,Woodlark Basin; WTP,West Torres Plateau. 1, normal fault; 2, strike-slip fault; 3, subduction zone; 4, spreading ridge (double line) and transform faults (single lines); 5, land; 6–8, sea, with 6, continental or arc crust; 7, oceanic plateau; and 8, basin/ocean floor. Structures in light grey indicate that they are inactive. Thick continuous east–west line at latitude 20° S in panel (a) shows location of cross-section plotted in Fig. 4h. Thick dashed line in panel (a) shows location of cross-section plotted in Fig. 5.
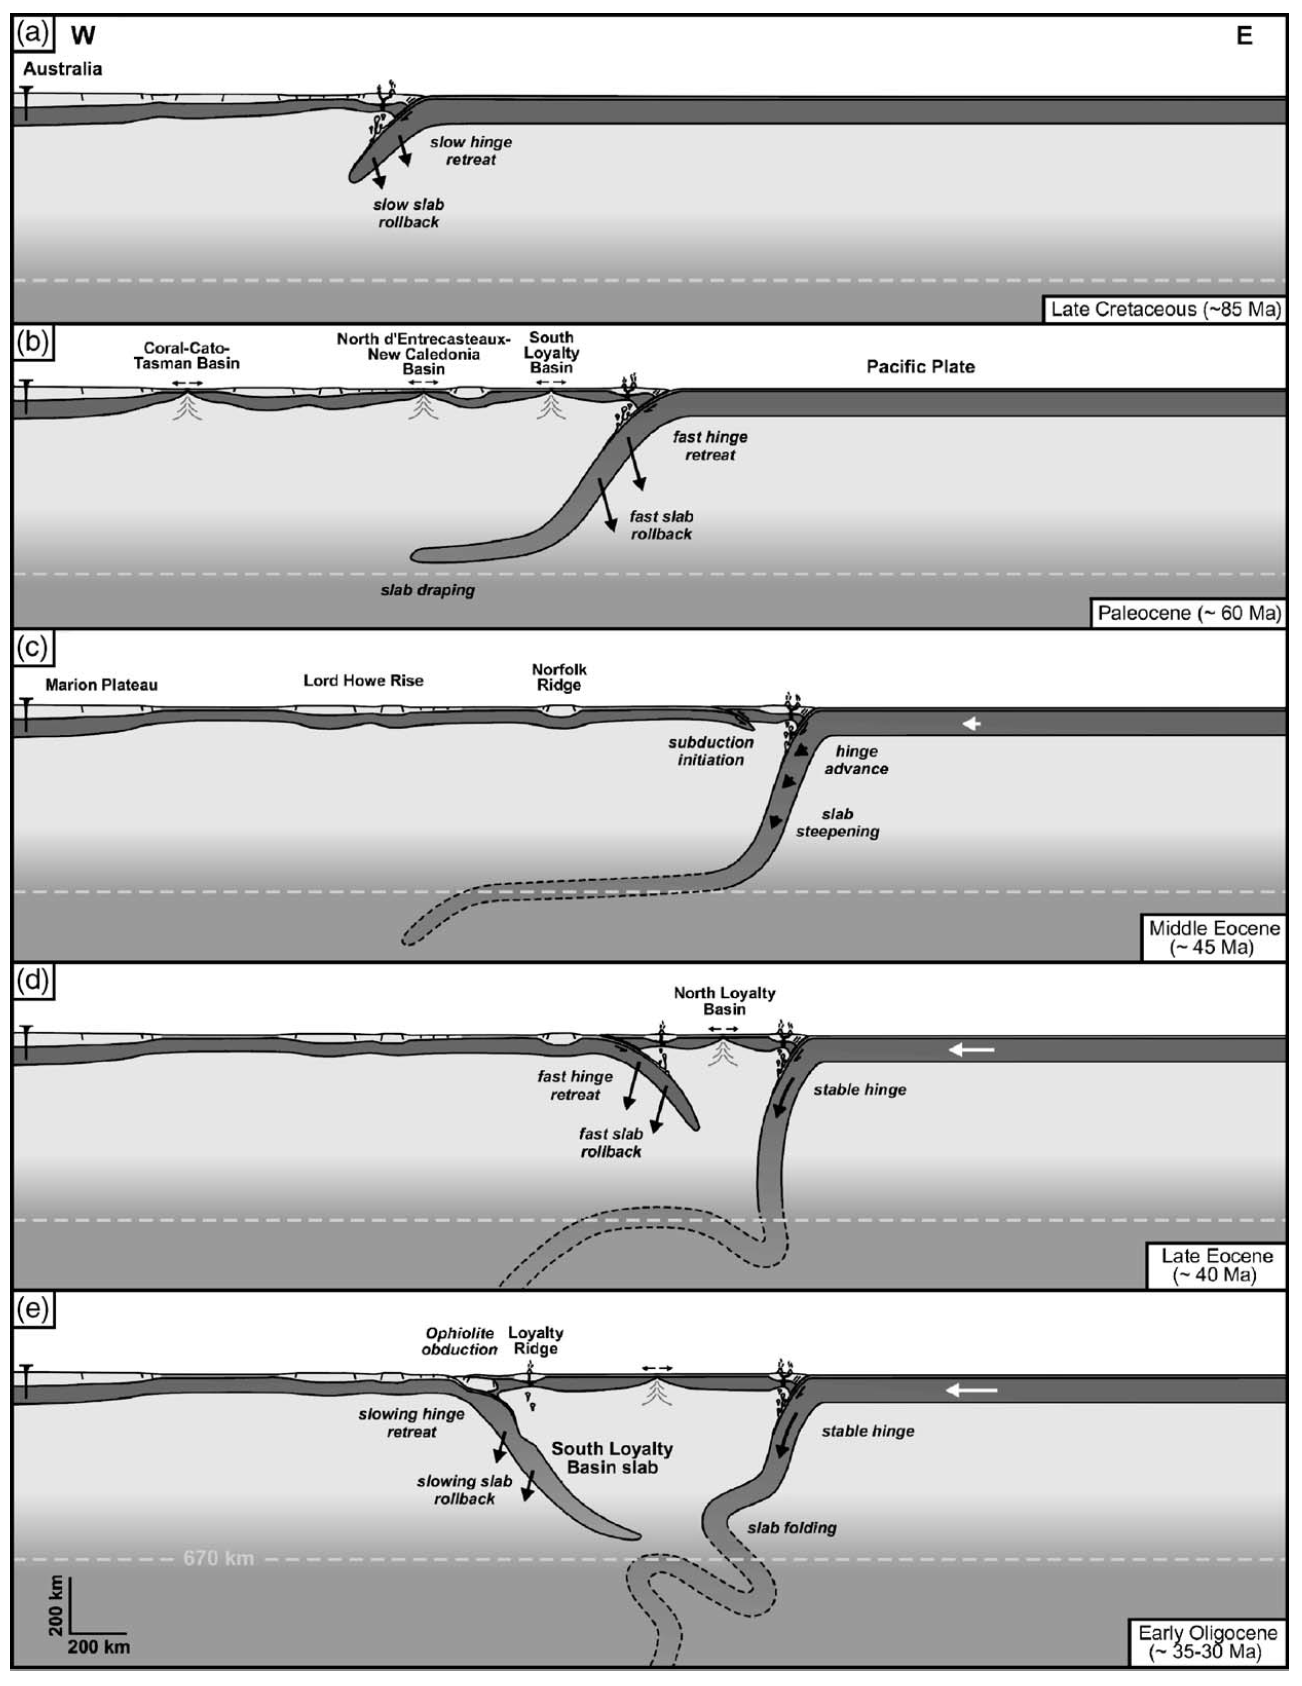
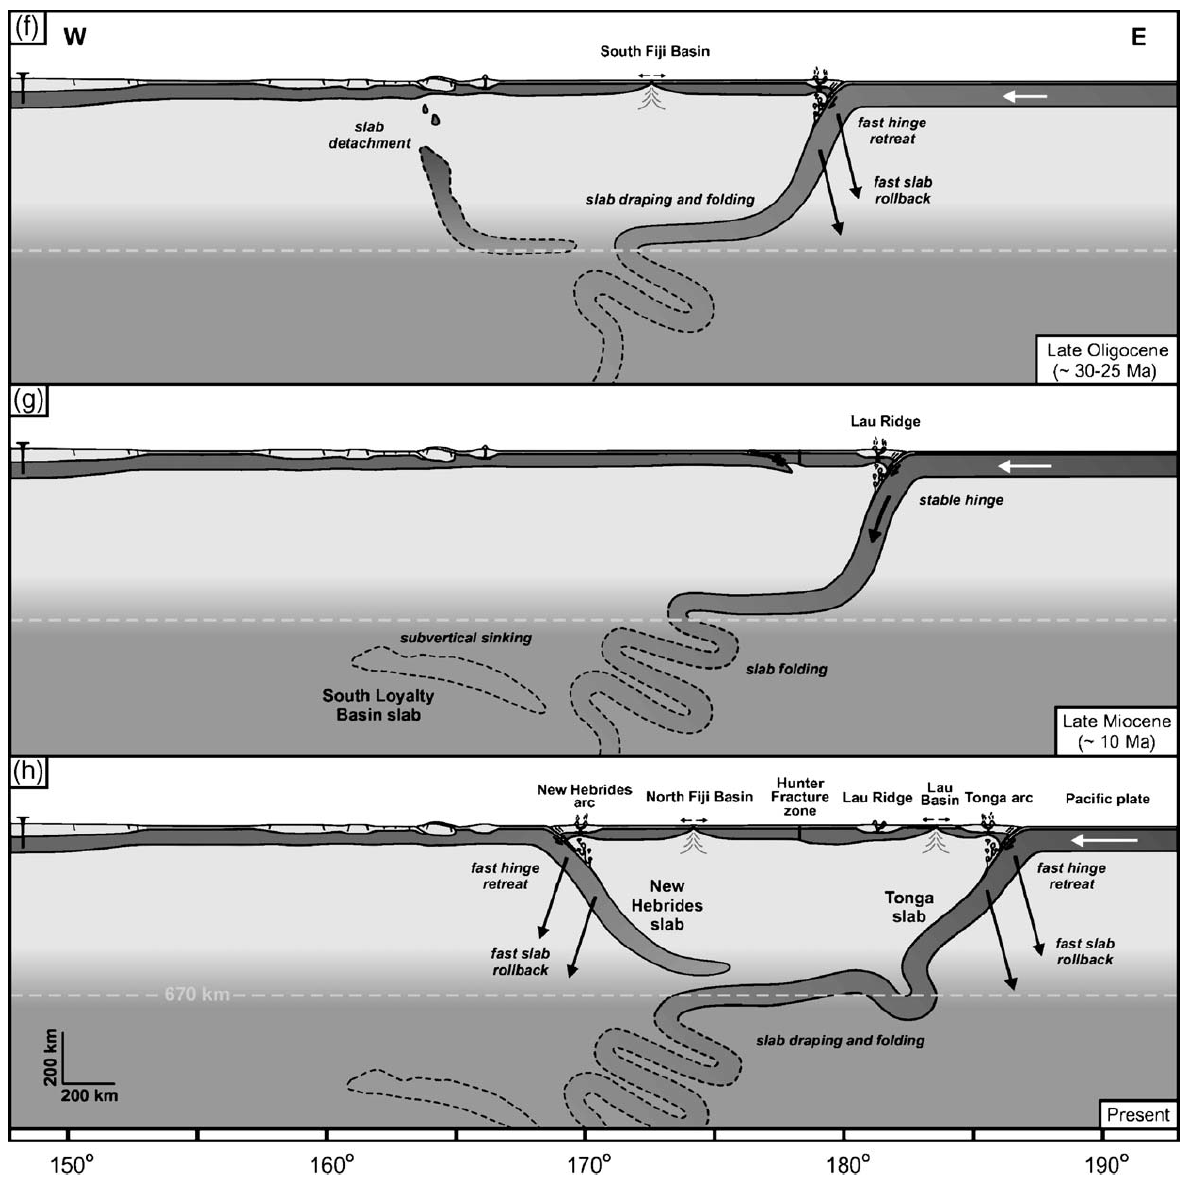
East–west cross-sections illustrating the evolution of the Southwest Pacific region since the Cretaceous in an Australia-fixed reference frame. For location of final cross-section in Fig. 4h see Fig. 1. White arrows indicate convergence between Pacific plate and Australia. Black arrows illustrate the sinking kinematics of a slab. Diagrams illustrate that subduction of Pacific lithosphere from the Late Cretaceous to Paleocene and subduction of backarc lithosphere (e.g. South Loyalty slab) results primarily from slab rollback (i.e. negligible convergence between overriding and subducting plate), leading to a simple slab geometry with draping of the slab over the upper–lower mantle discontinuity. subduction of the Pacific plate from the Eocene to Present results from both slab rollback and convergence, leading to a more complex slab geometry with slab draping (due to rollback) and folding (due to convergence). Slab kinematics was inspired by subduction models from Guillou-Frottier et al. (1995), Griffiths et al. (1995), Funiciello et al. (2003) and Schellart (2004a, 2005).
Reconstruction of the clockwise rotation of the New Hebrides arc during opening of the North Fiji backarc Basin, resulting in collision of the arc with the d’Entrecasteaux Ridge and formation of the Efate re-entrant during initial collision. Location of the initial collision site provides an estimate of the eastward continuation of the d’Entrecasteaux Ridge, and therefore an estimate of the east–west width of the South Loyalty Basin (∼750km). Location of the rotation pole is indicated by the black dot and the curved arrow. Numbers indicate approximate amount of rotation of the New Hebrides arc since opening of the North Fiji Basin at ∼12–11Ma. Australia is fixed. Hfz, Hunter fracture zone; LB, Lau Basin; NFB, North Fiji Basin; NHT, New Hebrides Trench; SCT, San Cristobal Trench.
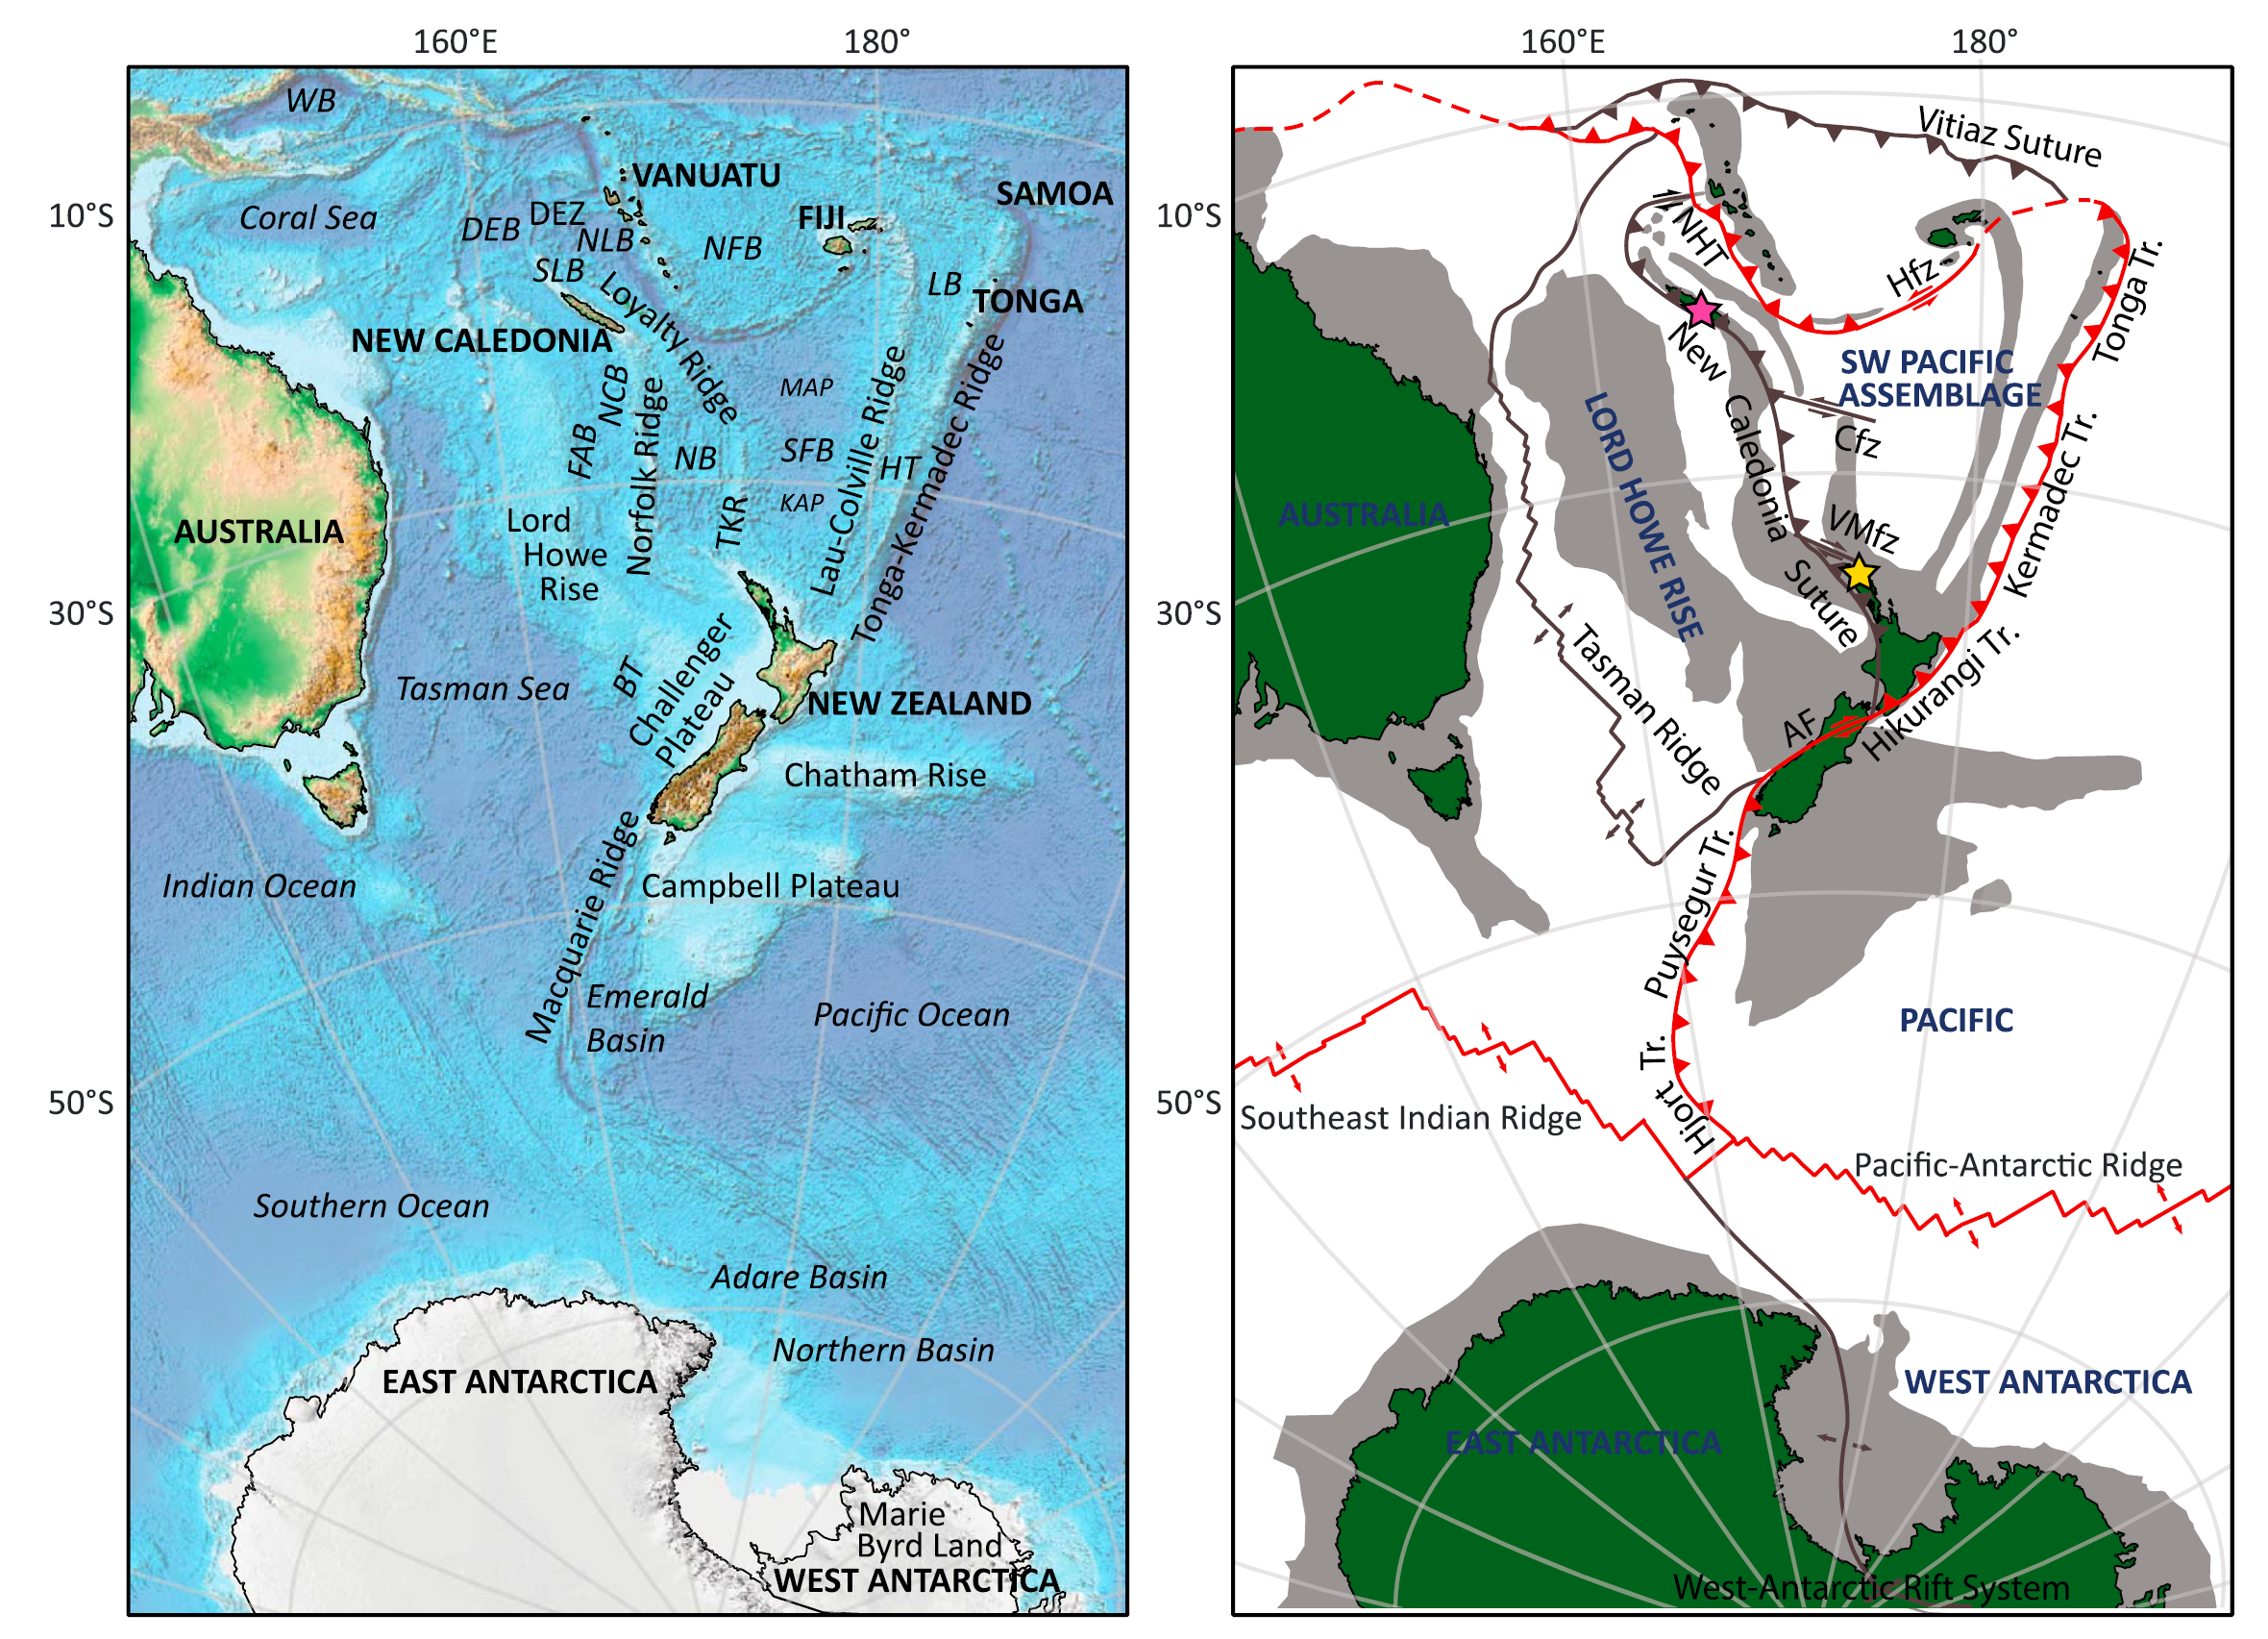
Topography and bathymetry (left) and tectonic map (right) of the SW Pacific. Tectonic map is based on our model (see Table 3 and the supporting information): continents in green, submerged continental fragments and volcanic arcs in gray. Present-day plate boundaries in red, former plate boundaries in dark gray. Pink and yellow stars are locations of New Caledonia and Northland ophiolites, respectively. (Former) plate names in dark blue. SW Pacific assemblage consists of multiple smaller plates. BT = Bellona Trough; DEB = D’Entrecasteaux Basin; DEZ = D’Entrecasteaux Zone; FAB = Fairway- Aotea Basin; HT = Havre Trough; KAP = Kupe Abyssal Plain; MAP = Minerva Abyssal Plain = NB, Norfolk Basin; NCB = New Caledonia Basin; NFB = North Fiji Basin; NLB = North Loyalty Basin; LB = Lau Basin; SFB = South Fiji Basin; SLB = South Loyalty Basin; WB = Woodlark Basin; NHT = New Hebdrides Trench; Cfz = Cook fracture zone; Hfz = Hunter fracture zone; VMfz = Vening Meinesz fracture zone; Tr = Trench.
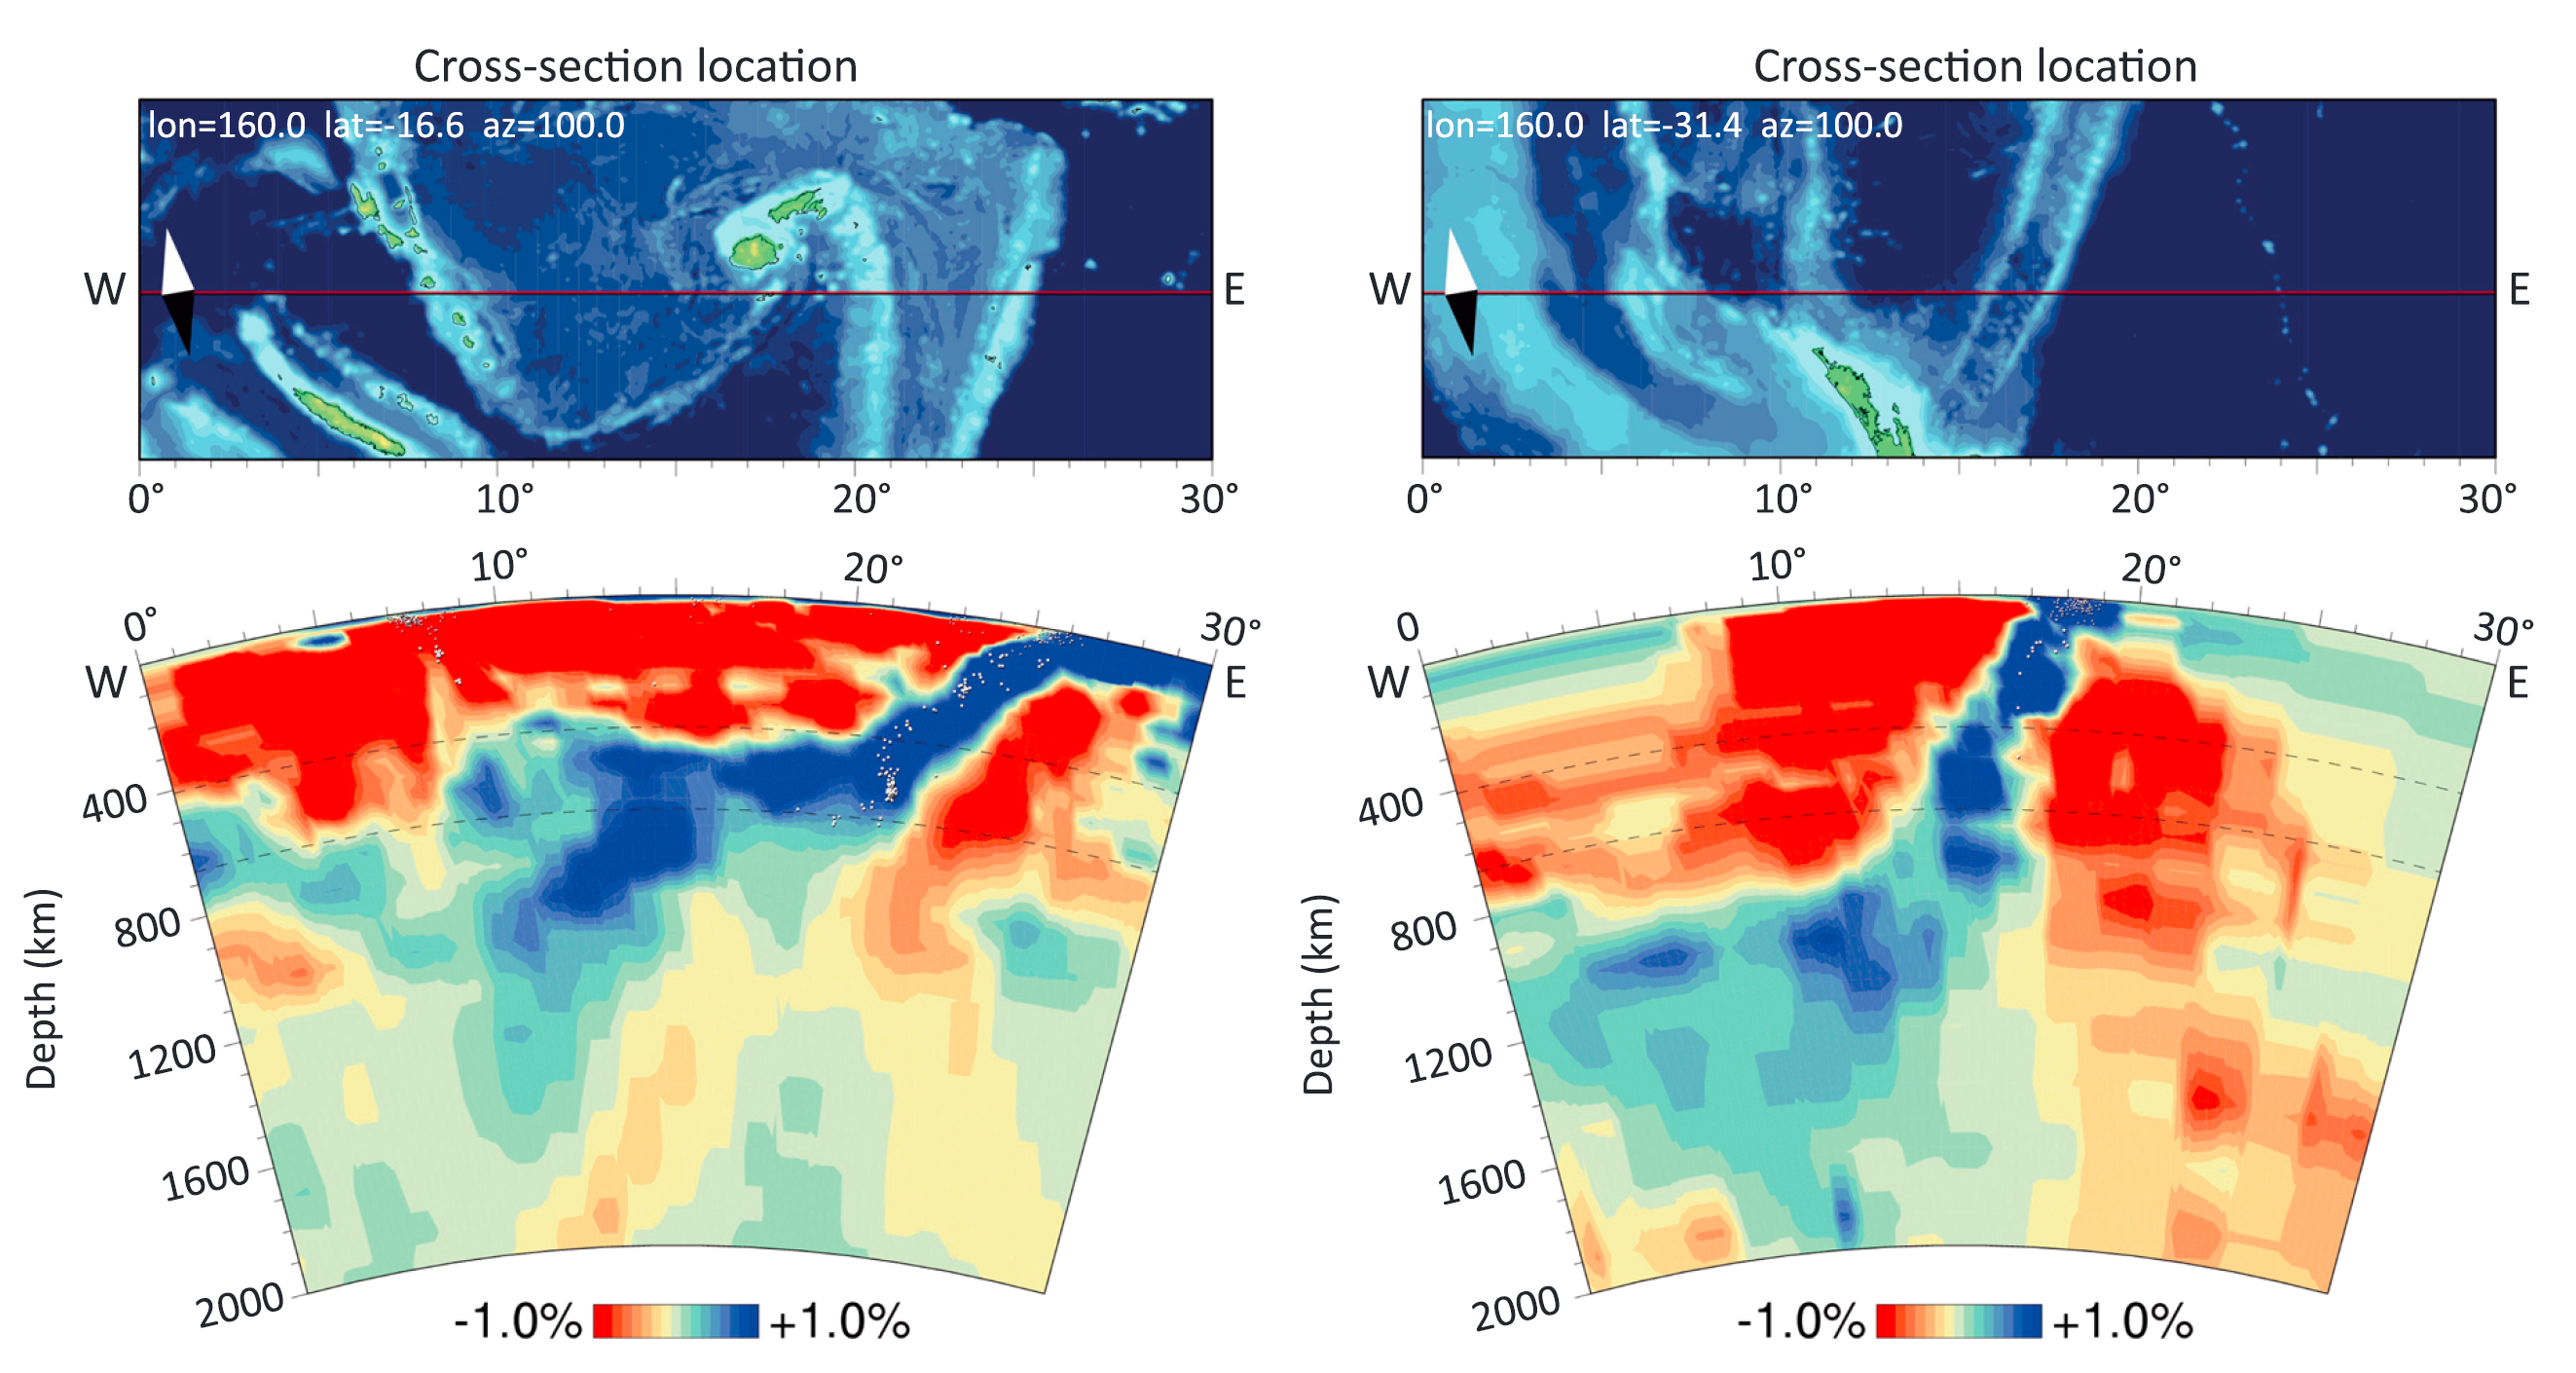
W-E tomographic cross sections of the Tonga-Kermadec slab at the northern (left) and southern (right) ends of the trench, based on the UU-P07 tomographic model (Amaru, 2007). In the north, a significant portion of the slab is flat lying before it continues into the upper mantle, whereas in the south the slab penetrates straight into the upper mantle.
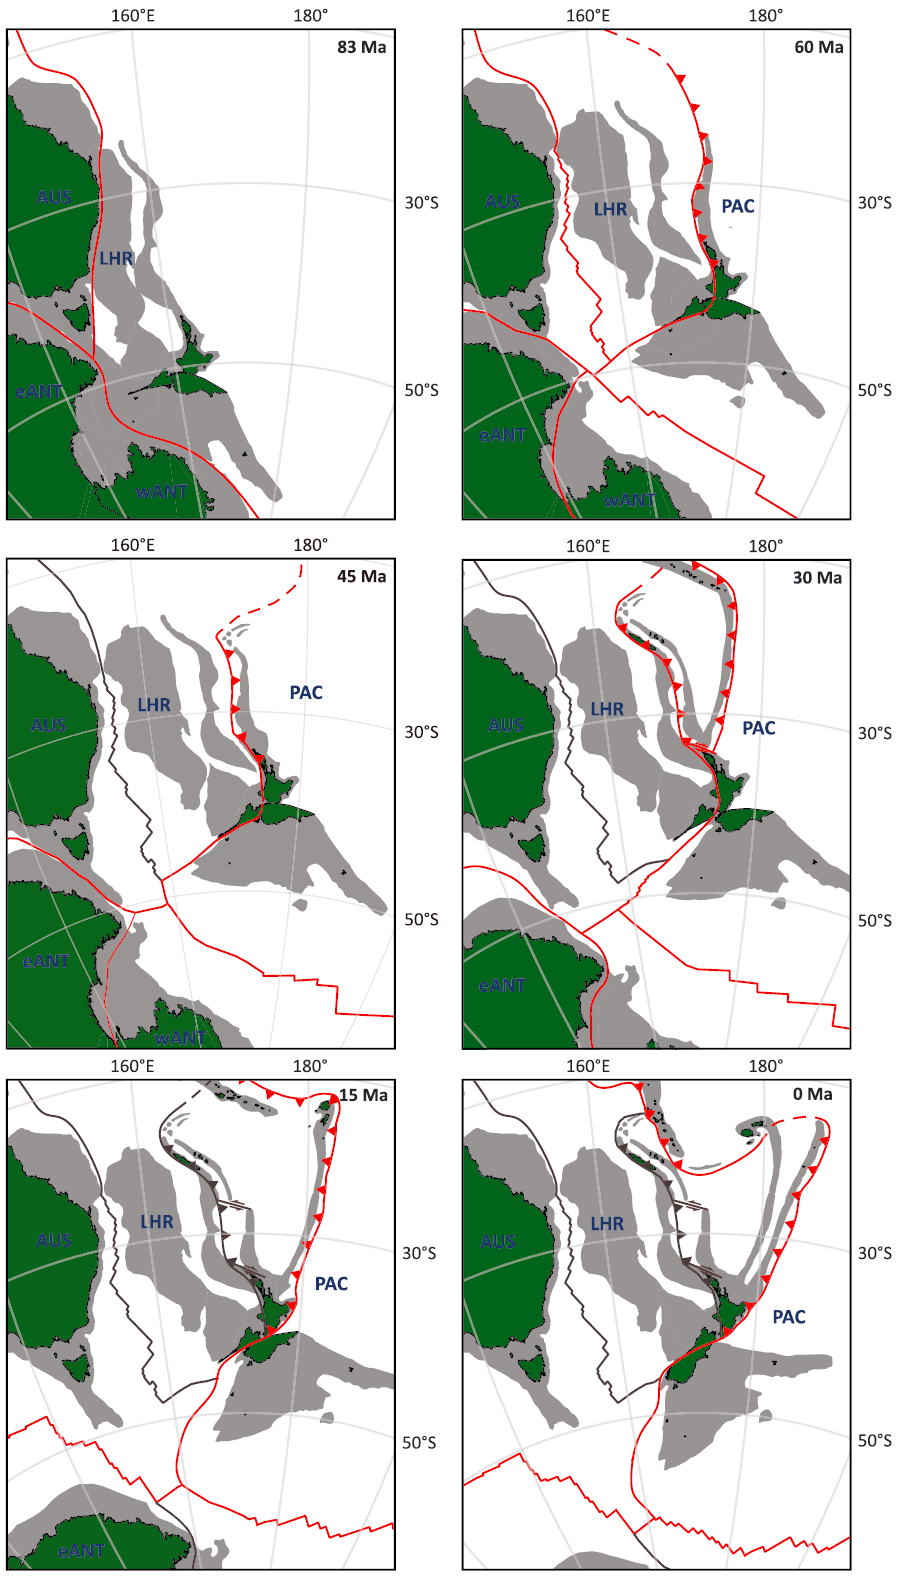
Paleogeographic snapshots of the kinematic reconstruction at selected time slices in an Australia fixed frame. 83 Ma: Start of the reconstruction; 60 Ma: start of New Caledonia subduction; 45 Ma: oldest possible, and frequently mentioned, age of Tonga-Kermadec subduction zone; 30 Ma: end of New Caledonia subduction, youngest possible age of Tonga-Kermadec subduction zone initiation and start of Norfolk and South Fiji Basin back-arc spreading; and 15 Ma: end of Norfolk and South Fiji Basin back-arc spreading.
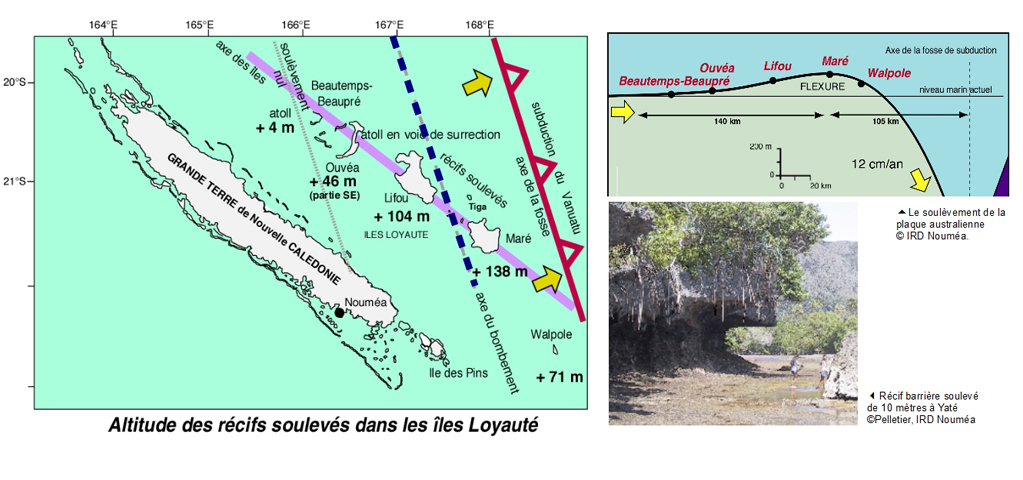
The subduction of the Australian plate under the Vanuatu arc is also accompanied by vertical movements of the lithosphere. Thus, the altitudes recorded by GPS at the level of the Quaternary reef formations that cover the Loyalty Islands (Ouvéa altitude: 46 m, Lifou: 104 m and Maré 138 m) indicate that the Loyalty Islands accompany a bulge of the Australian plate. just before his subduction. Coral reefs that have “recorded” the high historical levels of the sea serve as a reference marker for geologists who map areas in uprising or vertical depression (called uplift and subsidence). Thus, the various studies have shown that the Loyalty Islands, the Isle of Pines but alsothe south of Grande Terre (Yaté region) rise at speeds between 1.2 and 2.5 millimeters per decade.
- 2023.05.19 M 7.7 Loyalty Islands
- 2023.04.24 M 7.1 Kermadec
- 2023.04.02 M 7.0 Papua New Guinea
- 2023.03.16 M 7.0 Kermadec
- 2023.01.08 M 7.0 Vanuatu Islands
- 2022.11.22 M 7.0 Solomon Isles
- 2022.11.11 M 7.3 Tonga
- 2022.09.10 M 7.6 Papua New Guinea
- 2021.03.04 M 8.1 Kermadec
- 2021.02.10 M 7.7 Loyalty Islands
- 2019.06.15 M 7.2 Kermadec
- 2019.05.14 M 7.5 New Ireland
- 2019.05.06 M 7.2 Papua New Guinea
- 2018.12.05 M 7.5 New Caledonia
- 2018.10.10 M 7.0 New Britain, PNG
- 2018.09.09 M 6.9 Kermadec
- 2018.08.29 M 7.1 Loyalty Islands
- 2018.08.18 M 8.2 Fiji
- 2018.03.26 M 6.9 New Britain
- 2018.03.26 M 6.6 New Britain
- 2018.03.08 M 6.8 New Ireland
- 2018.02.25 M 7.5 Papua New Guinea
- 2018.02.26 M 7.5 Papua New Guinea Update #1
- 2017.11.19 M 7.0 Loyalty Islands Update #1
- 2017.11.07 M 6.5 Papua New Guinea
- 2017.11.04 M 6.8 Tonga
- 2017.10.31 M 6.8 Loyalty Islands
- 2017.08.27 M 6.4 N. Bismarck plate
- 2017.05.09 M 6.8 Vanuatu
- 2017.03.19 M 6.0 Solomon Islands
- 2017.03.05 M 6.5 New Britain
- 2017.01.22 M 7.9 Bougainville
- 2017.01.03 M 6.9 Fiji
- 2016.12.17 M 7.9 Bougainville
- 2016.12.08 M 7.8 Solomons
- 2016.10.17 M 6.9 New Britain
- 2016.10.15 M 6.4 South Bismarck Sea
- 2016.09.14 M 6.0 Solomon Islands
- 2016.08.31 M 6.7 New Britain
- 2016.08.12 M 7.2 New Hebrides Update #2
- 2016.08.12 M 7.2 New Hebrides Update #1
- 2016.08.12 M 7.2 New Hebrides
- 2016.04.06 M 6.9 Vanuatu Update #1
- 2016.04.03 M 6.9 Vanuatu
- 2015.03.30 M 7.5 New Britain (Update #5)
- 2015.03.30 M 7.5 New Britain (Update #4)
- 2015.03.29 M 7.5 New Britain (Update #3)
- 2015.03.29 M 7.5 New Britain (Update #2)
- 2015.03.29 M 7.5 New Britain (Update #1)
- 2015.03.29 M 7.5 New Britain
- 2015.11.18 M 6.8 Solomon Islands
- 2015.05.24 M 6.8, 6.8, 6.9 Santa Cruz Islands
- 2015.05.05 M 7.5 New Britain
New Britain | Solomon | Bougainville | New Hebrides | Tonga | Kermadec Earthquake Reports
General Overview
Earthquake Reports
Social Media
#EarthquakeReport for M7.7 #Earthquake offshore of #NewCaledonia #LoyaltyIslands
Looks like maybe outer rise tensional event
No tsunami threat in coast of USA
Possible tsunami in Vanuatu Fiji New CaledoniaRead abt regional tectonics in earlier reporthttps://t.co/Ocv4yZXEAn pic.twitter.com/H5v4B78Ypp
— Jason "Jay" R. Patton (@patton_cascadia) May 19, 2023
#EarthquakeReport for M7.7 #Earthquake offshore of #NewCaledonia
Felt intensity MMI2
Tensional mechanism supports interpretation of outer rise event in Australia plateSimilar event in 2017:https://t.co/2w0qDMoGy0https://t.co/7fid7EahHX pic.twitter.com/3J4ZITrcI6
— Jason "Jay" R. Patton (@patton_cascadia) May 19, 2023
#EarthquakeReport for M7.7 #Earthquake offshore of #NewCaledonia
check out the @USGS_Quakes website about the eastern margin of the Australia plate:https://t.co/yB8OayIAsy
analogue M7.7 event in 1995 shown on 2017 poster:https://t.co/KFiR3Z6NVghttps://t.co/Ocv4yZXEAn pic.twitter.com/ZvEYKULXdD
— Jason "Jay" R. Patton (@patton_cascadia) May 19, 2023
#EarthquakeReport #TsunamiReport for M7.7 #Earthquake and #Tsunami offshore of #NewCaledonia
initial waves arriving at Maré (New Caledonia, Loyalty Islands)https://t.co/9kPJP1Lyrdhttps://t.co/Ocv4yZXEAn pic.twitter.com/ctbW4cnj4L
— Jason "Jay" R. Patton (@patton_cascadia) May 19, 2023
#EarthquakeReport #TsunamiReport for M7.7 #Earthquake offshore of #NewCaledonia #LoyaltyIslands
head to https://t.co/wM2UgCJSGQ for tsunami information
message #4 shows the following https://t.co/sXS7cA9ixDhttps://t.co/Ocv4yZXEAn pic.twitter.com/h6clNtT2jB
— Jason "Jay" R. Patton (@patton_cascadia) May 19, 2023
#EarthquakeReport #TsunamiReport for M7.7 #Earthquake #Tsunami offshore of #NewCaledonia
tsunami observations
numbers in the table are actually the tsunami amplitude, the water surface elevation measured above the ambient water level
5th PTWC reporthttps://t.co/NBnD0OQir8 pic.twitter.com/cG7PYPv9Aj
— Jason "Jay" R. Patton (@patton_cascadia) May 19, 2023
#EarthquakeReport for M7.7 #Earthquake offshore of #NewCaledonia #LoyaltyIslands
the @USGS_Quakes fault slip model shows fault dipping to the south with slip up to about 3metershttps://t.co/oV1IvPqAbp pic.twitter.com/rgoitvjkvQ
— Jason "Jay" R. Patton (@patton_cascadia) May 19, 2023
#EarthquakeReport #TsunamiReport for M7.7 #Earthquake #Tsunami offshore of #NewCaledonia #LoyaltyIslands
Maré (New Caledonia, Loyalty Islands) tide gage shows continued oscillation
max wave height (peak to trough) about 38.6 cmhttps://t.co/vv78U0QFonhttps://t.co/Ocv4yZXEAn pic.twitter.com/pmHxWbiLHK
— Jason "Jay" R. Patton (@patton_cascadia) May 19, 2023
#EarthquakeReport #TsunamiReport for M7.7 #Earthquake #Tsunami offshore of #NewCaledonia #LoyaltyIslands
for official tsunami information: https://t.co/rEduVDLBBc
these wave heights are what we call tsunami amplitudes: height of water above ambient levelhttps://t.co/xIGgD9MeFr pic.twitter.com/uD6CztlvtK
— Jason "Jay" R. Patton (@patton_cascadia) May 19, 2023
#EarthquakeReport #TsunamiReport for M7.1 #Earthquake offshore #LoyaltyIslands
Aftershock also tensional outer rise event in Australia plate
Original and ongoing threadhttps://t.co/sDW4ZAzE4jhttps://t.co/ugD9uKip91 pic.twitter.com/pTkeI8YY34
— Jason "Jay" R. Patton (@patton_cascadia) May 20, 2023
A M 7.7 earthquake just now in the ocean off the east coast of Australia. At the moment, Vanuatu, Fiji, and New Caldonia are cautioned for possible tsunami. #earthquake pic.twitter.com/YMTsCxG8RE
— Brian Olson (@mrbrianolson) May 19, 2023
Tsunami Info Stmt: M7.7 Loyalty Islands Region 1957PDT May 18: Tsunami NOT expected; CA,OR,WA,BC,and AK
— NWS Tsunami Alerts (@NWS_NTWC) May 19, 2023
The waveforms of the M7.7 SE of Loyalty Islands and ~400 km E of New Caledonia, arriving at our seismic network in southeast Australia ~5 min later. pic.twitter.com/Zfi9NS4Q7F
— Dr. Dee Ninis (@DeeNinis) May 19, 2023
Mw=7.7, SOUTHEAST OF LOYALTY ISLANDS (Depth: 12 km), 2023/05/19 02:57:06 UTC – Full details here: https://t.co/53ZfsFdYoe pic.twitter.com/lmwQfhgyOC
— Earthquakes (@geoscope_ipgp) May 19, 2023
Waves from the M7.7 earthquake southeast of the Loyalty Islands shown on a seismic station in Fiji. https://t.co/Tir0KZELXN pic.twitter.com/XO9Sflv6Ol
— EarthScope Consortium (@EarthScope_sci) May 19, 2023
JMA also warning of “sea level changes” along entire south / east coast of Japan from Okinawa to Hokkaido in response to the M7.8 #earthquake in the S Pacific #tsunami pic.twitter.com/5KqZPNu7Af
— James Reynolds (@EarthUncutTV) May 19, 2023
Australia on #Tsunami Watch after magnitude 7.6 #earthquake near Southeast of Loyalty Islands. Potential threat for #LordHoweIsland. Latest info here: https://t.co/Tynv3ZQpEq. pic.twitter.com/RlP5ntbfKS
— Bureau of Meteorology, Australia (@BOM_au) May 19, 2023
#EarthquakeReport #TsunamiReport for M7.7 #Earthquake #Tsunami offshore of #NewCaledonia #LoyaltyIsles@EU_Commission World Sea Level wave height observed at Mare tide gage (measured from peak to trough) is now up to 38.4cmhttps://t.co/vv78U0QFonhttps://t.co/Ocv4yZXEAn pic.twitter.com/LKCwFbWQbq
— Jason "Jay" R. Patton (@patton_cascadia) May 19, 2023
The M7.7 earthquake southeast of the Loyalty Islands occurred in a highly seismically active region. The direction of subduction changes in this region, and the Australian Plate subducts beneath the Pacific Plate across the New Hebrides Trench. pic.twitter.com/bXI7ZobSwf
— EarthScope Consortium (@EarthScope_sci) May 19, 2023
A prelim M7.7 earthquake has occurred in the Loyalty Islands region at 2:57pm FJT, southwest of Fiji. According to PTWC there is a “potential tsunami threat” to Fiji. Follow advice from local authorities as the situation is assessed. Recorded on my @raspishake. pic.twitter.com/L2srDZ86Cr
— Fiji Earthquakes & Weather (@FijiEarthquakes) May 19, 2023
NO tsunami threat to Hawai'i is expected from the 7.7 magnitude earthquake detected at 4:57 p.m. HST southeast of the Loyalty Islands. There MAY be tsunami waves affecting coasts within about 600 miles of the epicenter, possibly including Vanuatu, Fiji and New Caledonia. pic.twitter.com/Nr7EK6xWSe
— Hawaii EMA (@Hawaii_EMA) May 19, 2023
#EarthquakeReport #TsunamiReport for M7.7 #Earthquake #Tsunami offshore of #NewCaledonia #LoyaltyIslands
largest wave so far at Lenakel, Tanna, Vanuatu, but the tide gage seems to be malfunctioning at times
about 45.5 cm wave height (peak to trough)https://t.co/2yp00Srpua pic.twitter.com/yexJnYLVhO— Jason "Jay" R. Patton (@patton_cascadia) May 19, 2023
#Earthquake (#séisme) confirmed by seismic data.⚠Preliminary info: M7.7 || 347 km SE of #Tadine (New Caledonia) || 9 min ago (local time 13:57:07). Follow the thread for the updates👇 pic.twitter.com/ASriuls86Q
— EMSC (@LastQuake) May 19, 2023
This map shows affected areas. Strong currents and surges can injure and drown people. People in or near the sea in these areas should move out of the water, off beaches and shore areas and away from harbours, marinas, rivers and estuaries. More info at https://t.co/ccVFYR8001 pic.twitter.com/klTgDFHh4C
— National Emergency Management Agency (@NZcivildefence) May 19, 2023
Two hours ago, Mw7.7 #earthquake located southeast of New Caledonia, felt in Nouméa (Mainland) and in the Loyalty islands.https://t.co/rBNyghV7WM
The biggest earthquake this year since the M7.8 of Feb. 6 in Türkiye. pic.twitter.com/dFju1n6MCx— José R. Ribeiro (@JoseRodRibeiro) May 19, 2023
ird2023jtocoa Southeast of Loyalty Islands mb 6.9 2023/05/19 02:57:07 – Event has not yet been reviewed by a seismologist. For subsequent updates and details, please see https://t.co/ZNvz6pXLuu #earthquake #séisme #terremoto #지진 #地震 pic.twitter.com/dA59YhVLdI
— New Caledonia Seismic Observatory – RT quake alert (@NCseismicobserv) May 19, 2023
Section from today's 37.7 km deep M7.7 earthquake in the Loyalty Islands, recorded on the global @raspishake network. See: https://t.co/dlC4hZ9mNA. Uses @obspy and @matplotlib. pic.twitter.com/xnhU6tXQm9
— Mark Vanstone (@wmvanstone) May 19, 2023
#BREAKING: Tsunami warning for Fiji, Vanuatu and #NewCaledonia after 7.7 magnitude quake#earthquake
Stay Safe pic.twitter.com/x1NfIMSxFf— kiran joshi (100% Follow Back) (@kiranjoshi235) May 19, 2023
M7.7 earthquake in the South Pacific about 6 hours ago. It was a relatively shallow, normal-mechanism earthquake (38 km depth). The quake seems to have only triggered a minor tsunami (most observations <0.2m, one 0.6 m). pic.twitter.com/8dMTRRQvrr
— Dr. Judith Hubbard (@JudithGeology) May 19, 2023
In the Earth, all 3 principal stresses are (nearly) always compressional or inward-directed. A tensional stress state is a rare condition indeed. If the biggest principal stress is vertical, then high-angle (but not vertical!) extensional normal faults are the result. pic.twitter.com/cvYar2f010
— Harold Tobin (@Harold_Tobin) May 20, 2023
The activity after the major M7.7 & M7.1 SE of #LoyaltyIslands #earthquakes as detected by the @raspishake network.
The infographic shows their area distribution with daily & magnitude data. Events in the latest 24h are circled in white.#Python @matplotlib #CitizenScience pic.twitter.com/uePZm9g2R1
— Giuseppe Petricca (@gmrpetricca) May 20, 2023
2023-05-20 M6.5 SE #LoyaltyIslands #earthquake recorded in #Scotland & #Stornoway + historical seismicity & cross section.
3rd largest event after yesterday's M7.7, clear core waves.
Dist: 16125km
Travel Time: 17m 17s
Depth: 10km#Python @raspishake @matplotlib #CitizenScience pic.twitter.com/MNRoPVa3Rp— Giuseppe Petricca (@gmrpetricca) May 20, 2023
A few days ago there was a M7.7 earthquake in the Pacific Ocean.
Hours later, a tweet ‘predicted’ that “a strong aftershock of M6 is possible”.
An aftershock of ~M6 did occur 👀
Was this some remarkable prediction?
(Spoiler: No!)
Let’s talk about the Gutenberg-Richter Law 🤓
🧵/5 pic.twitter.com/bVJBuxuQzN— Dr. Dee Ninis (@DeeNinis) May 21, 2023
Mw=6.0, SOUTHEAST OF LOYALTY ISLANDS (Depth: 9 km), 2023/05/23 06:41:58 UTC – Full details here: https://t.co/OfX7rMC4ss pic.twitter.com/tN09r3ggHA
— Earthquakes (@geoscope_ipgp) May 23, 2023
Tsunamis can reach to great heights on land, but the waves themselves aren’t necessarily that tall. The featured tsunami animation from last week’s magnitude 7.7 Loyalty Island earthquake can be found at @geonet pic.twitter.com/lBX6zyule8
— Adam Pascale (@SeisLOLogist) May 26, 2023
- Frisch, W., Meschede, M., Blakey, R., 2011. Plate Tectonics, Springer-Verlag, London, 213 pp.
- Hayes, G., 2018, Slab2 – A Comprehensive Subduction Zone Geometry Model: U.S. Geological Survey data release, https://doi.org/10.5066/F7PV6JNV.
- Holt, W. E., C. Kreemer, A. J. Haines, L. Estey, C. Meertens, G. Blewitt, and D. Lavallee (2005), Project helps constrain continental dynamics and seismic hazards, Eos Trans. AGU, 86(41), 383–387, , https://doi.org/10.1029/2005EO410002. /li>
- Jessee, M.A.N., Hamburger, M. W., Allstadt, K., Wald, D. J., Robeson, S. M., Tanyas, H., et al. (2018). A global empirical model for near-real-time assessment of seismically induced landslides. Journal of Geophysical Research: Earth Surface, 123, 1835–1859. https://doi.org/10.1029/2017JF004494
- Kreemer, C., J. Haines, W. Holt, G. Blewitt, and D. Lavallee (2000), On the determination of a global strain rate model, Geophys. J. Int., 52(10), 765–770.
- Kreemer, C., W. E. Holt, and A. J. Haines (2003), An integrated global model of present-day plate motions and plate boundary deformation, Geophys. J. Int., 154(1), 8–34, , https://doi.org/10.1046/j.1365-246X.2003.01917.x.
- Kreemer, C., G. Blewitt, E.C. Klein, 2014. A geodetic plate motion and Global Strain Rate Model in Geochemistry, Geophysics, Geosystems, v. 15, p. 3849-3889, https://doi.org/10.1002/2014GC005407.
- Meyer, B., Saltus, R., Chulliat, a., 2017. EMAG2: Earth Magnetic Anomaly Grid (2-arc-minute resolution) Version 3. National Centers for Environmental Information, NOAA. Model. https://doi.org/10.7289/V5H70CVX
- Müller, R.D., Sdrolias, M., Gaina, C. and Roest, W.R., 2008, Age spreading rates and spreading asymmetry of the world’s ocean crust in Geochemistry, Geophysics, Geosystems, 9, Q04006, https://doi.org/10.1029/2007GC001743
- Pagani,M. , J. Garcia-Pelaez, R. Gee, K. Johnson, V. Poggi, R. Styron, G. Weatherill, M. Simionato, D. Viganò, L. Danciu, D. Monelli (2018). Global Earthquake Model (GEM) Seismic Hazard Map (version 2018.1 – December 2018), DOI: 10.13117/GEM-GLOBAL-SEISMIC-HAZARD-MAP-2018.1
- Silva, V ., D Amo-Oduro, A Calderon, J Dabbeek, V Despotaki, L Martins, A Rao, M Simionato, D Viganò, C Yepes, A Acevedo, N Horspool, H Crowley, K Jaiswal, M Journeay, M Pittore, 2018. Global Earthquake Model (GEM) Seismic Risk Map (version 2018.1). https://doi.org/10.13117/GEM-GLOBAL-SEISMIC-RISK-MAP-2018.1
- Zhu, J., Baise, L. G., Thompson, E. M., 2017, An Updated Geospatial Liquefaction Model for Global Application, Bulletin of the Seismological Society of America, 107, p 1365-1385, https://doi.org/0.1785/0120160198
- Baillard, C., W. C. Crawford, V. Ballu, M. Régnier, B. Pelletier, and E. Garaebiti (2015), Seismicity and shallow slab geometry in the central Vanuatu subduction zone, J. Geophys. Res. Solid Earth,120,5606–5623, https://doi.org/10.1002/2014JB011853
- Begg, G. and Gray, D.R., 2002. Arc dynamics and tectonic history of Fiji based on stress and kinematic analysis of dikes and faults of the Tavua Volcano, Viti Levu Island, Fiji in Tectonics, v. 21, no. 4, DOI: 10.1029/2000TC001259
- Benz, H.M., Herman, Matthew, Tarr, A.C., Furlong, K.P., Hayes, G.P., Villaseñor, Antonio, Dart, R.L., and Rhea, Susan, 2011. Seismicity of the Earth 1900–2010 eastern margin of the Australia plate: U.S. Geological Survey Open-File Report 2010–1083-I, scale 1:8,000,000.
- Bergeot, N., M. N. Bouin, M. Diament, B. Pelletier, M. Re´gnier, S. Calmant, and V. Ballu (2009), Horizontal and vertical interseismic velocity fields in the Vanuatu subduction zone from GPS measurements: Evidence for a central Vanuatu locked zone, J. Geophys. Res., 114, B06405, https://doi.org/10.1029/2007JB005249
- Cleveland, K.M., Ammon, C.J., and Lay, T., 2014. Large earthquake processes in the northern Vanuatu subduction zone in Journal of Geophysical Research: Solid Earth, v. 119, p. 8866-8883, doi:10.1002/2014JB011289.
- Craig, T.J., Copley, A., and Jackson, J., 2014. A reassessment of outer-rise seismicity and its implications for the mechanics of oceanic lithosphere in Geophyscial Journal International, v. 1974, no. 1, p. 63-89, https://doi.org/10.1093/gji/ggu013
- de Alterris, G. et al., 1993. Propagating rifts in the North Fiji Basin southwest Pacific in Geology, v. 21, p. 583-586.
- Deng, C., Jenner, F. E., Wan, B., & Li, J.-L. (2022). The influence of ridge subduction on the geochemistry of Vanuatu arc magmas. Journal of Geophysical Research: Solid Earth, 127, e2021JB022833. https://doi.org/10.1029/2021JB022833
- Hayes, G. P., D. J. Wald, and R. L. Johnson, 2012. Slab1.0: A three-dimensional model of global subduction zone geometries, J. Geophys. Res., 117, B01302, doi:10.1029/2011JB008524.
- Patriat, M., Tervor, F., Danyushevsky, L., Callot, J., Jean, M.M., Hoernle, J., Hauff, F., Maas, R., Woodhead, J.D., and Feig, S.T., 2019. Subduction initiation terranes exposed at the front of a 2 Ma volcanically-active subduction zone in EPSL, v. 508, p. 30-40, https://doi.org/10.1016/j.epsl.2018.12.011
- Richards, S., Holm., R., Barber, G., 2011. When slabs collide: A tectonic assessment of deep earthquakes in the Tonga-Vanuatu region, Geology, v. 39, pp. 787-790.
- Schellart, W., Lister, G. and Jessell, M. 2002. Analogue modelling of asymmetrical back-arc extension. In: (Ed.) Wouter Schellart, and Cees W. Passchier, Analogue modelling of large-scale tectonic processes, Journal of the Virtual Explorer, Electronic Edition, ISSN 1441-8142, volume 7, paper 3, doi:10.3809/jvirtex.2002.00046
- Schellart, W.P., Lister, G.S., and Toy, V.B., 2006. A Late Cretaceous and Cenozoic reconstruction of the Southwest Pacific region: Tectonics controlled by subduction and slab rollback processes in Earth Science Reviews, v. 76, p. 191-233, http://dx.doi.org/10.1016/j.earscirev.2006.01.002
- van de Lagemaat, S. H. A., van Hinsbergen, D. J. J., Boschman, L. M., Kamp, P. J. J., & Spakman, W. (2018). Southwest Pacific absolute plate kinematic reconstruction reveals major Cenozoic Tonga-Kermadec slab dragging. Tectonics, 37, 2647–2674. https://doi.org/10.1029/2017TC004901
References:
Basic & General References
Specific References
Oceanic-Oceanic Subduction Zone Figure
Music Reference (in 1900-2016 seismicity video)
Return to the Earthquake Reports page.
- Sorted by Magnitude
- Sorted by Year
- Sorted by Day of the Year
- Sorted By Region