Here I summarize Earth’s significant seismicity for 2017. I limit this summary to earthquakes with magnitude greater than or equal to M 6.5. There were only 6 earthquakes greater than or equal to M 7.0 in 2017 (compared to 17 for 2016) and only one earthquake larger than M 8.0. I am sure that there is a possibility that your favorite earthquake is not included in this review. Happy New Year.
However, our historic record is very short, so any thoughts about whether this year (or last, or next) has smaller (or larger) magnitude earthquakes than “normal” are limited by this small data set.
- Here are all the annual summaries:
- Here are the annual summaries for the Cascadia region.
Below is my summary poster for this earthquake year
- I include moment tensors for the earthquakes included in the reports below.
- Click on the map to see a larger version.
2017 Earthquake Report Pages
- 2017.12.15 M 6.5 Java
- 2017.12.08 M 6.5 Caroline Ridge
- 2017.12.01 M 6.1 Iran
- 2017.11.19 M 6.8 Loyalty Islands Update #1
- 2017.11.12 M 7.3 Iran
- 2017.11.07 M 6.5 Papua New Guinea
- 2017.11.04 M 6.8 Tonga
- 2017.10.31 M 6.8 Loyalty Islands
- 2017.09.19 M 7.1 Puebla, Mexico
- 2017.09.19 M 7.1 Puebla, Mexico Update #1
- 2017.09.08 M 8.1 Chiapas, Mexico
- 2017.09.08 M 8.1 Chiapas, Mexico Update #1
- 2017.09.23 M 8.1 Chiapas, Mexico Update #2
- 2017.08.08 M 6.5 China
- 2017.07.20 M 6.7 Turkey
- 2017.07.17 M 7.7 Aleutians
- 2017.07.17 M 7.7 Aleutians UPDATE #1
- 2017.06.22 M 6.8 Guatemala
- 2017.06.14 M 6.9 Guatemala
- 2017.06.02 M 6.8 Aleutians
- 2017.05.29 M 6.8 Sulawesi, Indonesia
- 2017.05.09 M 6.8 Vanuatu
- 2017.04.28 M 6.9 Philippines
- 2017.04.24 M 6.9 Chile
- 2017.04.03 M 6.5 Botswana
- 2017.03.29 M 6.6 Kamchatka
- 2017.03.05 M 6.5 New Britain
- 2017.01.22 M 7.9 Bougainville
- 2017.01.10 M 7.3 Celebes Sea
- 2017.01.03 M 6.9 Fiji
2017 Subsidiary Earthquake Report Pages
- 2017.11.30 M 4.1 Delaware
- 2017.09.02 M 5.3 Idaho
- 2017.05.01 M 6.3 British Columbia
- 2017.03.29 M 5.7 Gulf of California
- 2017.01.08 M 5.8 Arctic
Other Annual Summaries
- Here is the USGS website listing the significant earthquakes for 2017.
- Here is the USGS website listing the earthquake posters for 2017.
- Here are some tweets:
Another way of looking at the year’s earthquakes: a heat map scaled to moment magnitude, with darker colours indicating more energy release. pic.twitter.com/7NIJYQAZ7G
— Chris Rowan (@Allochthonous) December 29, 2017
Overall, 2017 seems to have been quiet year on the seismic front: a (low) Magnitude 8 in Mexico, but M6 and 7 quakes are towards the low end of annual totals in the last ~50 years. pic.twitter.com/vOg8aHrR3N
— Chris Rowan (@Allochthonous) December 29, 2017
110. Assuming no excitement in next 4 hrs, the 8 September M8.2 Mexico quake and the 12 November M7.3 Iran quake will be, respectively, the biggest and the most deadly earthquakes of 2017. A light global death toll this year: barely over 1000 EQ fatalities, total. #200EQFacts.
— Susan Hough (@SeismoSue) December 31, 2017
162 regional moment tensor solutions calculated for the New Zealand region in 2017. Mw 3.4 – 6.5 and depth 2 – 195 km. 2/3 with Mw 3.8 – 4.5. pic.twitter.com/yenMlxcIcy
— John Ristau (@SinistralSeismo) January 3, 2018
Earthquake Background Materials
- There are three types of earthquakes, strike-slip, compressional (reverse or thrust, depending upon the dip of the fault), and extensional (normal). Here is are some animations of these three types of earthquake faults. Many of the earthquakes people are familiar with in the Mendocino triple junction region are either compressional or strike slip. The following three animations are from IRIS.
Strike Slip:
Compressional:
Extensional:
- Here is a primer that helps people learn how to interpret focal mechanisms and moment tensors. Moment tensors are calculated differently from focal mechanisms, but the interpretation of their graphical solution is similar. This is from the USGS.
- For more on the graphical representation of moment tensors and focal mechnisms, check this IRIS video out:
- Here is a fantastic infographic from Frisch et al. (2011). This figure shows some examples of earthquakes in different plate tectonic settings, and what their fault plane solutions are. There is a cross section showing these focal mechanisms for a thrust or reverse earthquake. The upper right corner includes my favorite figure of all time. This shows the first motion (up or down) for each of the four quadrants. This figure also shows how the amplitude of the seismic waves are greatest (generally) in the middle of the quadrant and decrease to zero at the nodal planes (the boundary of each quadrant).

2017 Earthquake Reports
- Click on the earthquake “magnitude and location” label (e.g. “M 6.9 Fiji”) to go to the Earthquake Report website for any given earthquake. Click on the map to open a high resolution pdf version of the interpretive poster. More information about the poster is found on the Earthquake Report website.
- We just had a large earthquake along the West Fiji Ridge, one of the spreading ridges that forms the North Fiji Basin. Here is the USGS website for this M 7.2 earthquake.
- This earthquake was relatively shallow and, probably since it was an extensional earthquake with a relatively low magnitude, did not pose a tsunami hazard or risk. There was a tsunami with a height of ~10 cm recorded in Fiji. Here is the final tsunami threat message from the Pacific Tsunami Warning Center in Hawaii.
2017.01.03 M 6.9 Fiji

- Catching up on some earthquake reports on a Friday night. This earthquake happened on 2017.01.10 in a region to the west of the Molluca Strait. I have reported on Molucca Strait earthquakes several times before as this is a very seismically active region. To the north and east of the Molucca Strait is a subduction zone, where the Philippine Sea plate (PSP) subducts westward beneath the Sunda plate (SP), forming the Philippine Trench. This M 7.3 earthquake is within the PSP at a depth of about 600 km. Here is the USGS web page for this earthquake.
- This is the same poster, but includes earthquakes since 1900 with magnitudes M ≥ 6.5.
2017.01.10 M 7.3 Celebes Sea
- Last night (my time) we had a large earthquake along a plate boundary that is one of the most tectonically active regions in the world. There was an earthquake with a magntude of M 7.9 along the San Cristobal Trench (north of the South Solomon Trench). Here is the USGS website for this M 7.9 earthquake. This earthquake seems to be related to a series of earthquakes that started (at least) in December of 2016. This M 7.9 has a similar depth as the 12/17 M 7.9 further to the north. However, today’s earthquake is about 40+- km deeper than the subduction zone fault as suggested by Hayes et al. (2012).
- There have been several observations of tsunami in the region. This table comes from the Pacific Tsunami Warning Center. There was no likelihood for a tsunami to hit the west coast of the continental USA.
- Here is my interpretive poster from the 12/17 M 7.9 Bougainville Earthquake, possibly (probably) related to today’s M 7.9 earthquake. This is my Earthquake Report for the 12/17 earthquake.
- Here is my interpretive poster from the 12/08 earthquake along the South Solomon Trench. This is my Earthquake Report for this M 7.8 earthquake.
2017.01.22 M 7.9 Bougainville
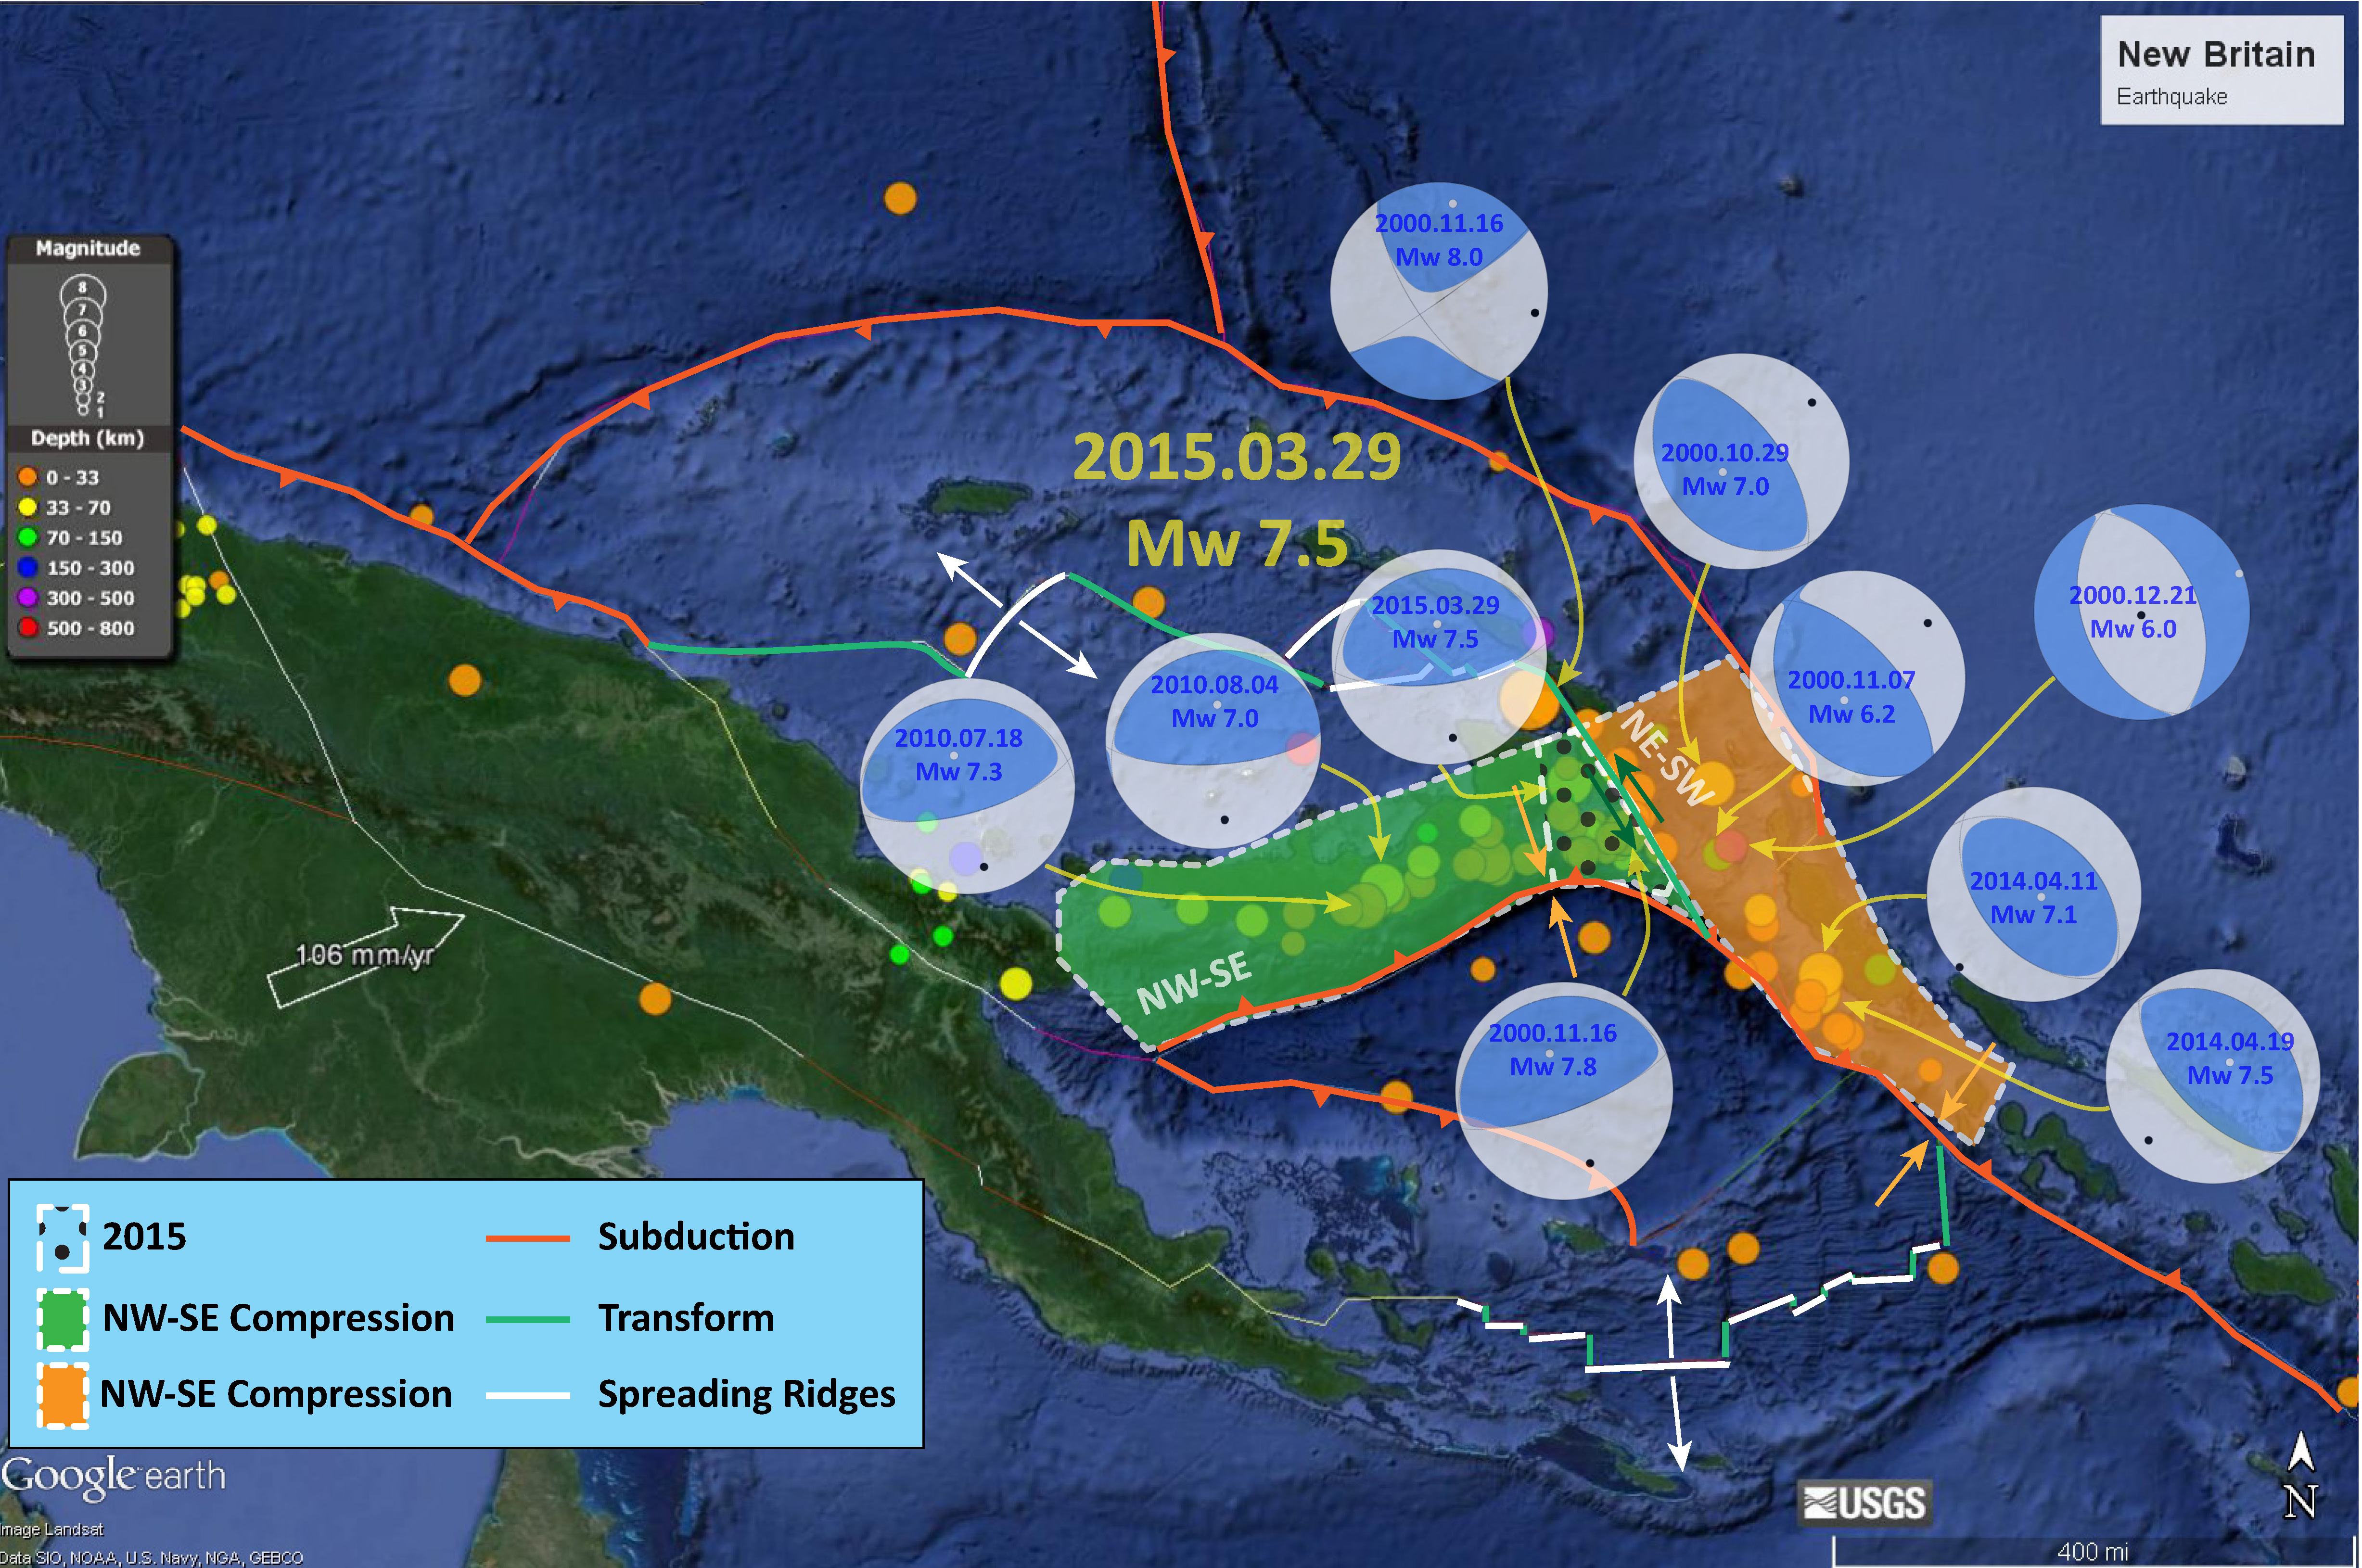
- We just had an earthquake with a USGS magnitude of M 6.5 along the subduction zone formed by the convergence of the Solomon Sea plate on the south and the South Bismarck plate on the north.
- Here is the USGS website for this M 6.5 earthquake.

- Earlier, I discussed seismicity from 2000-2015 here. The seismicity on the west of this region appears aligned with north-south shortening along the New Britain trench, while seismicity on the east of this region appears aligned with more east-west shortening. Here is a map that I put together where I show these two tectonic domains with the seismicity from this time period (today’s earthquakes are not plotted on this map, but one may see where they might plot).
2017.03.05 M 6.5 New Britain
Hot off the press for #AGU17: distribution of earthquakes in the subduction zone beneath north-east Papua New Guinea pic.twitter.com/sHI9s4HXb8
— Stephen Hicks (@seismo_steve) December 10, 2017
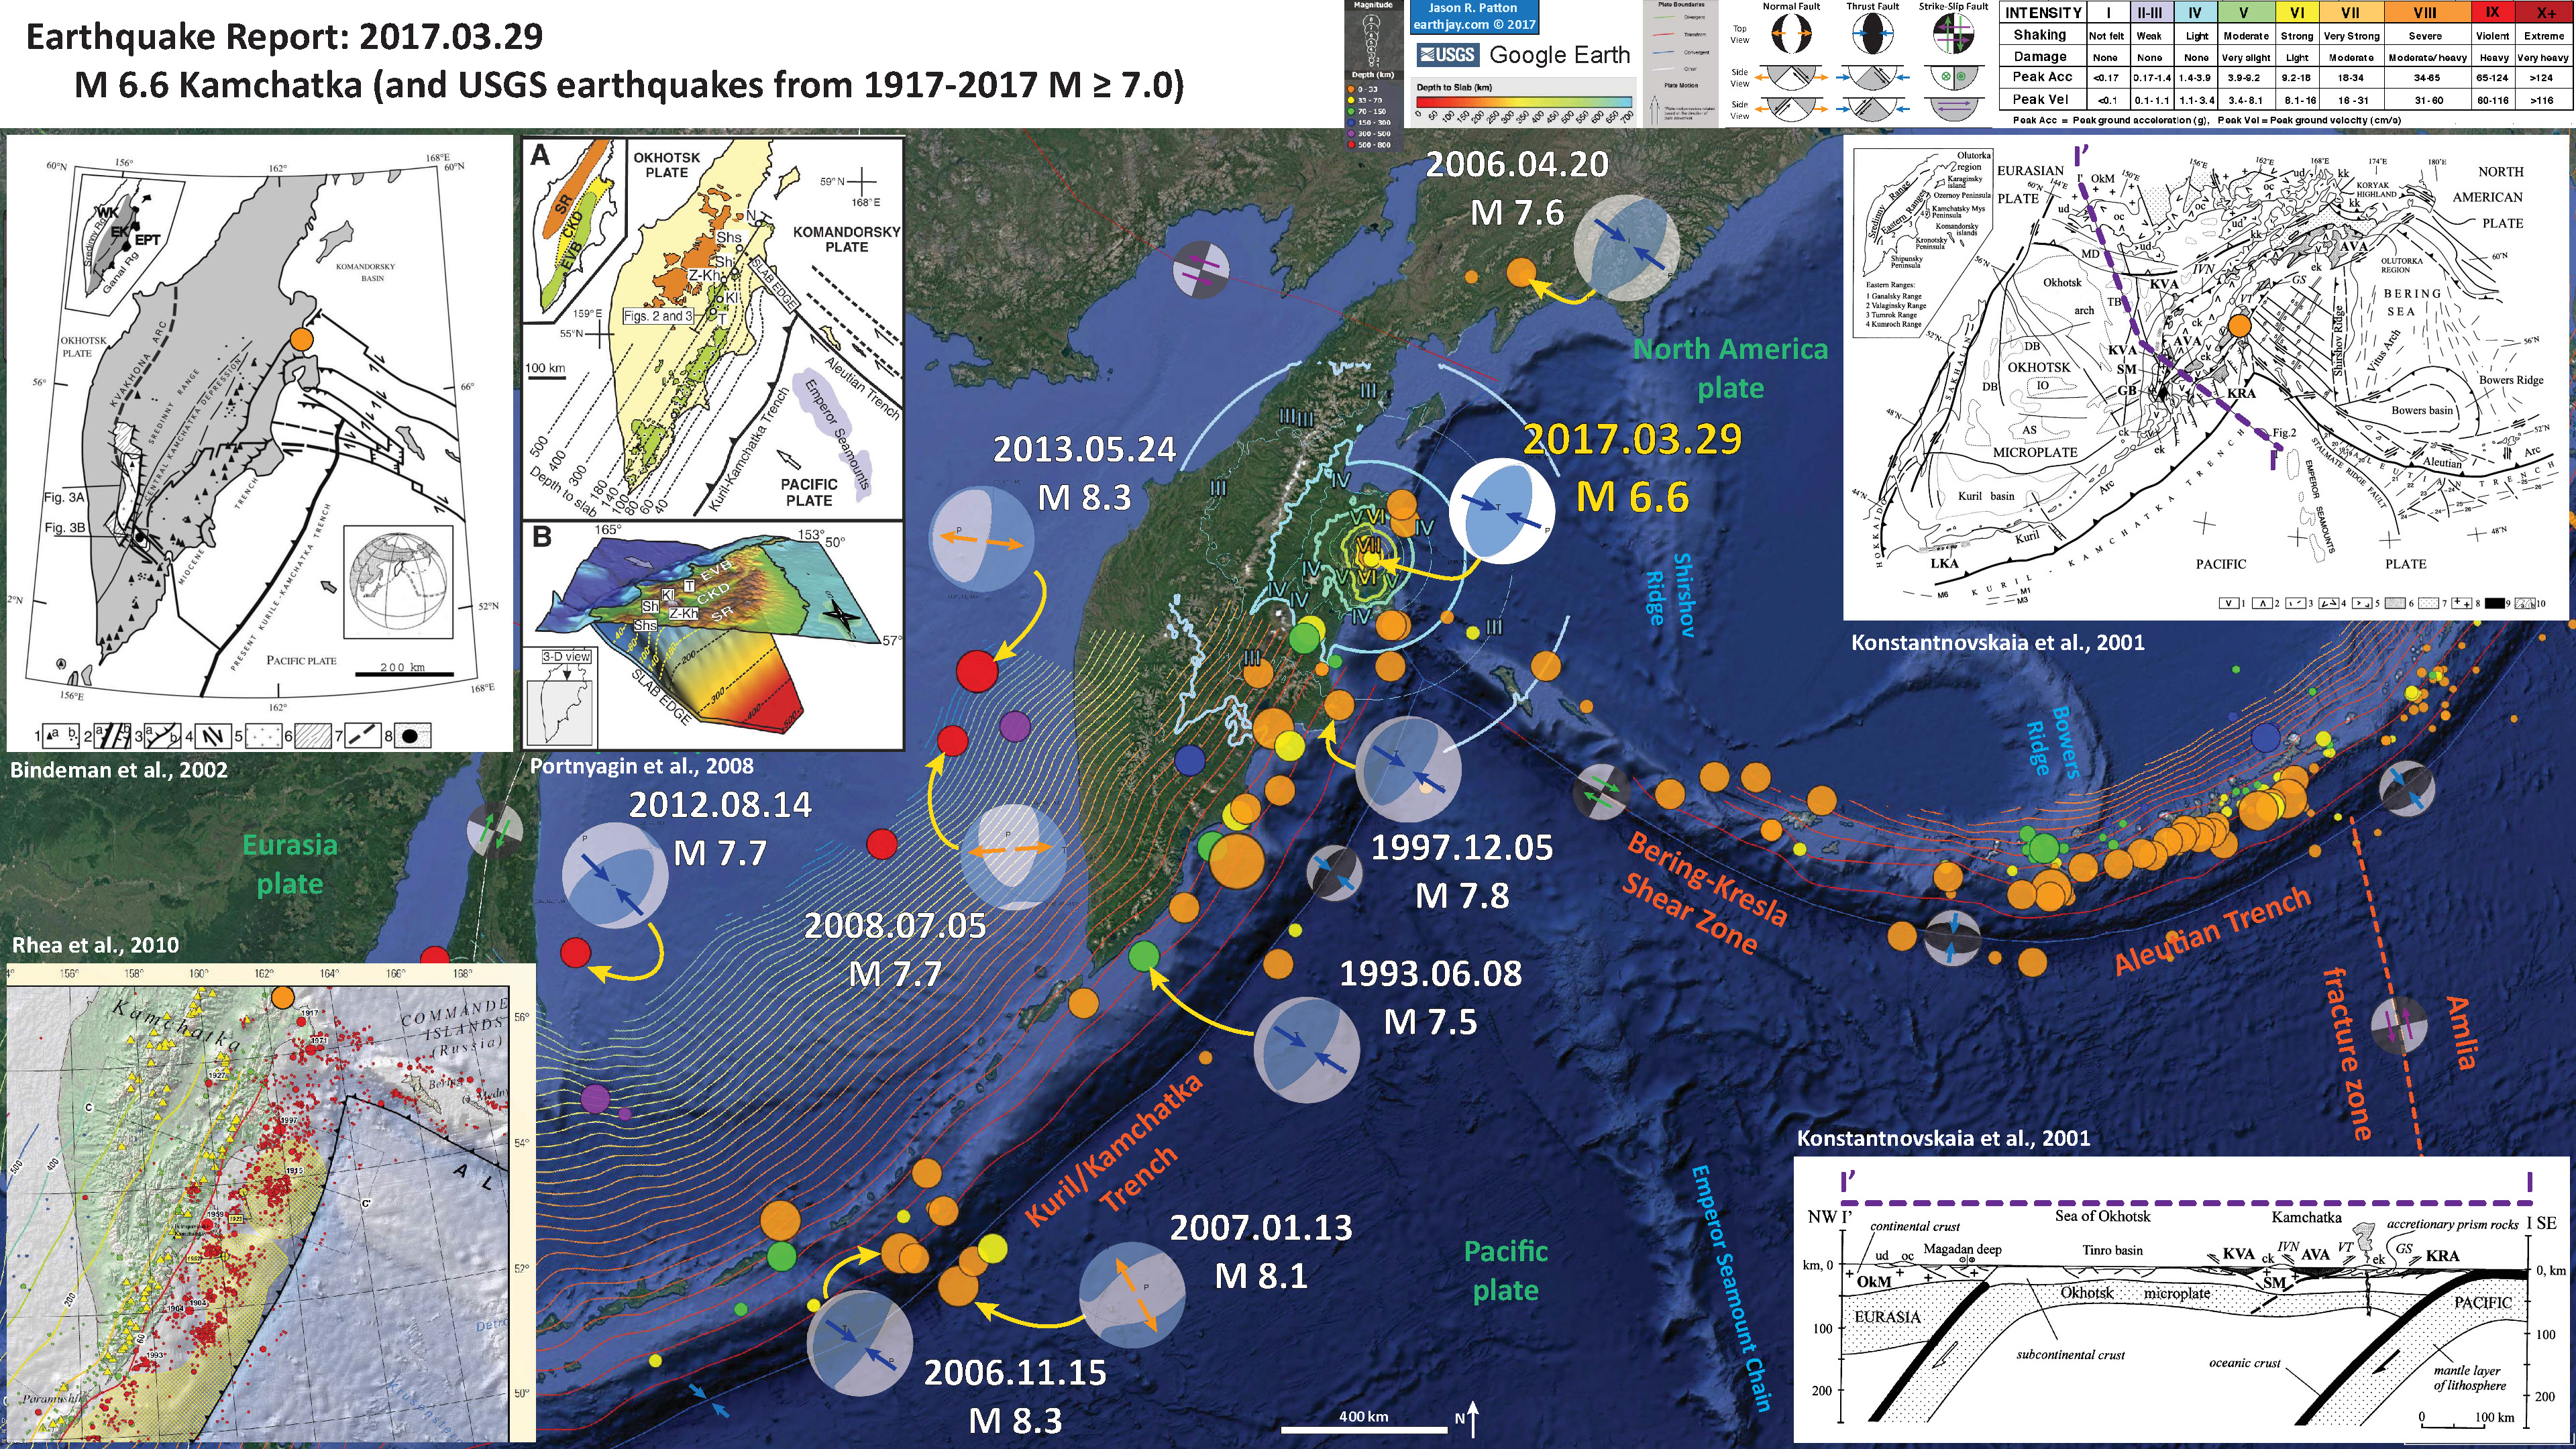
- This earthquake happened last night as I was preparing course materials for this morning. Initially it was a magnitude 6.9, but later modified to be M 6.6.
- This earthquake happened in an interesting region of the world where there is a junction between two plate boundaries, the Kamchatka subduction zone with the Aleutian subduction zone / Bering-Kresla Shear Zone. The Kamchatka Trench (KT) is formed by the subduction (a convergent plate boundary) beneath the Okhtosk plate (part of North America). The Aleutian Trench (AT) and Bering-Kresla Shear Zone (BKSZ) are formed by the oblique subduction of the Pacific plate beneath the Pacific plate. There is a deflection in the Kamchatka subduction zone north of the BKSZ, where the subduction trench is offset to the west. Some papers suggest the subduction zone to the north is a fossil (inactive) plate boundary fault system. There are also several strike-slip faults subparallel to the BKSZ to the north of the BKSZ. These are shown in two of the inset maps below.
2017.03.29 M 6.6 Kamchatka
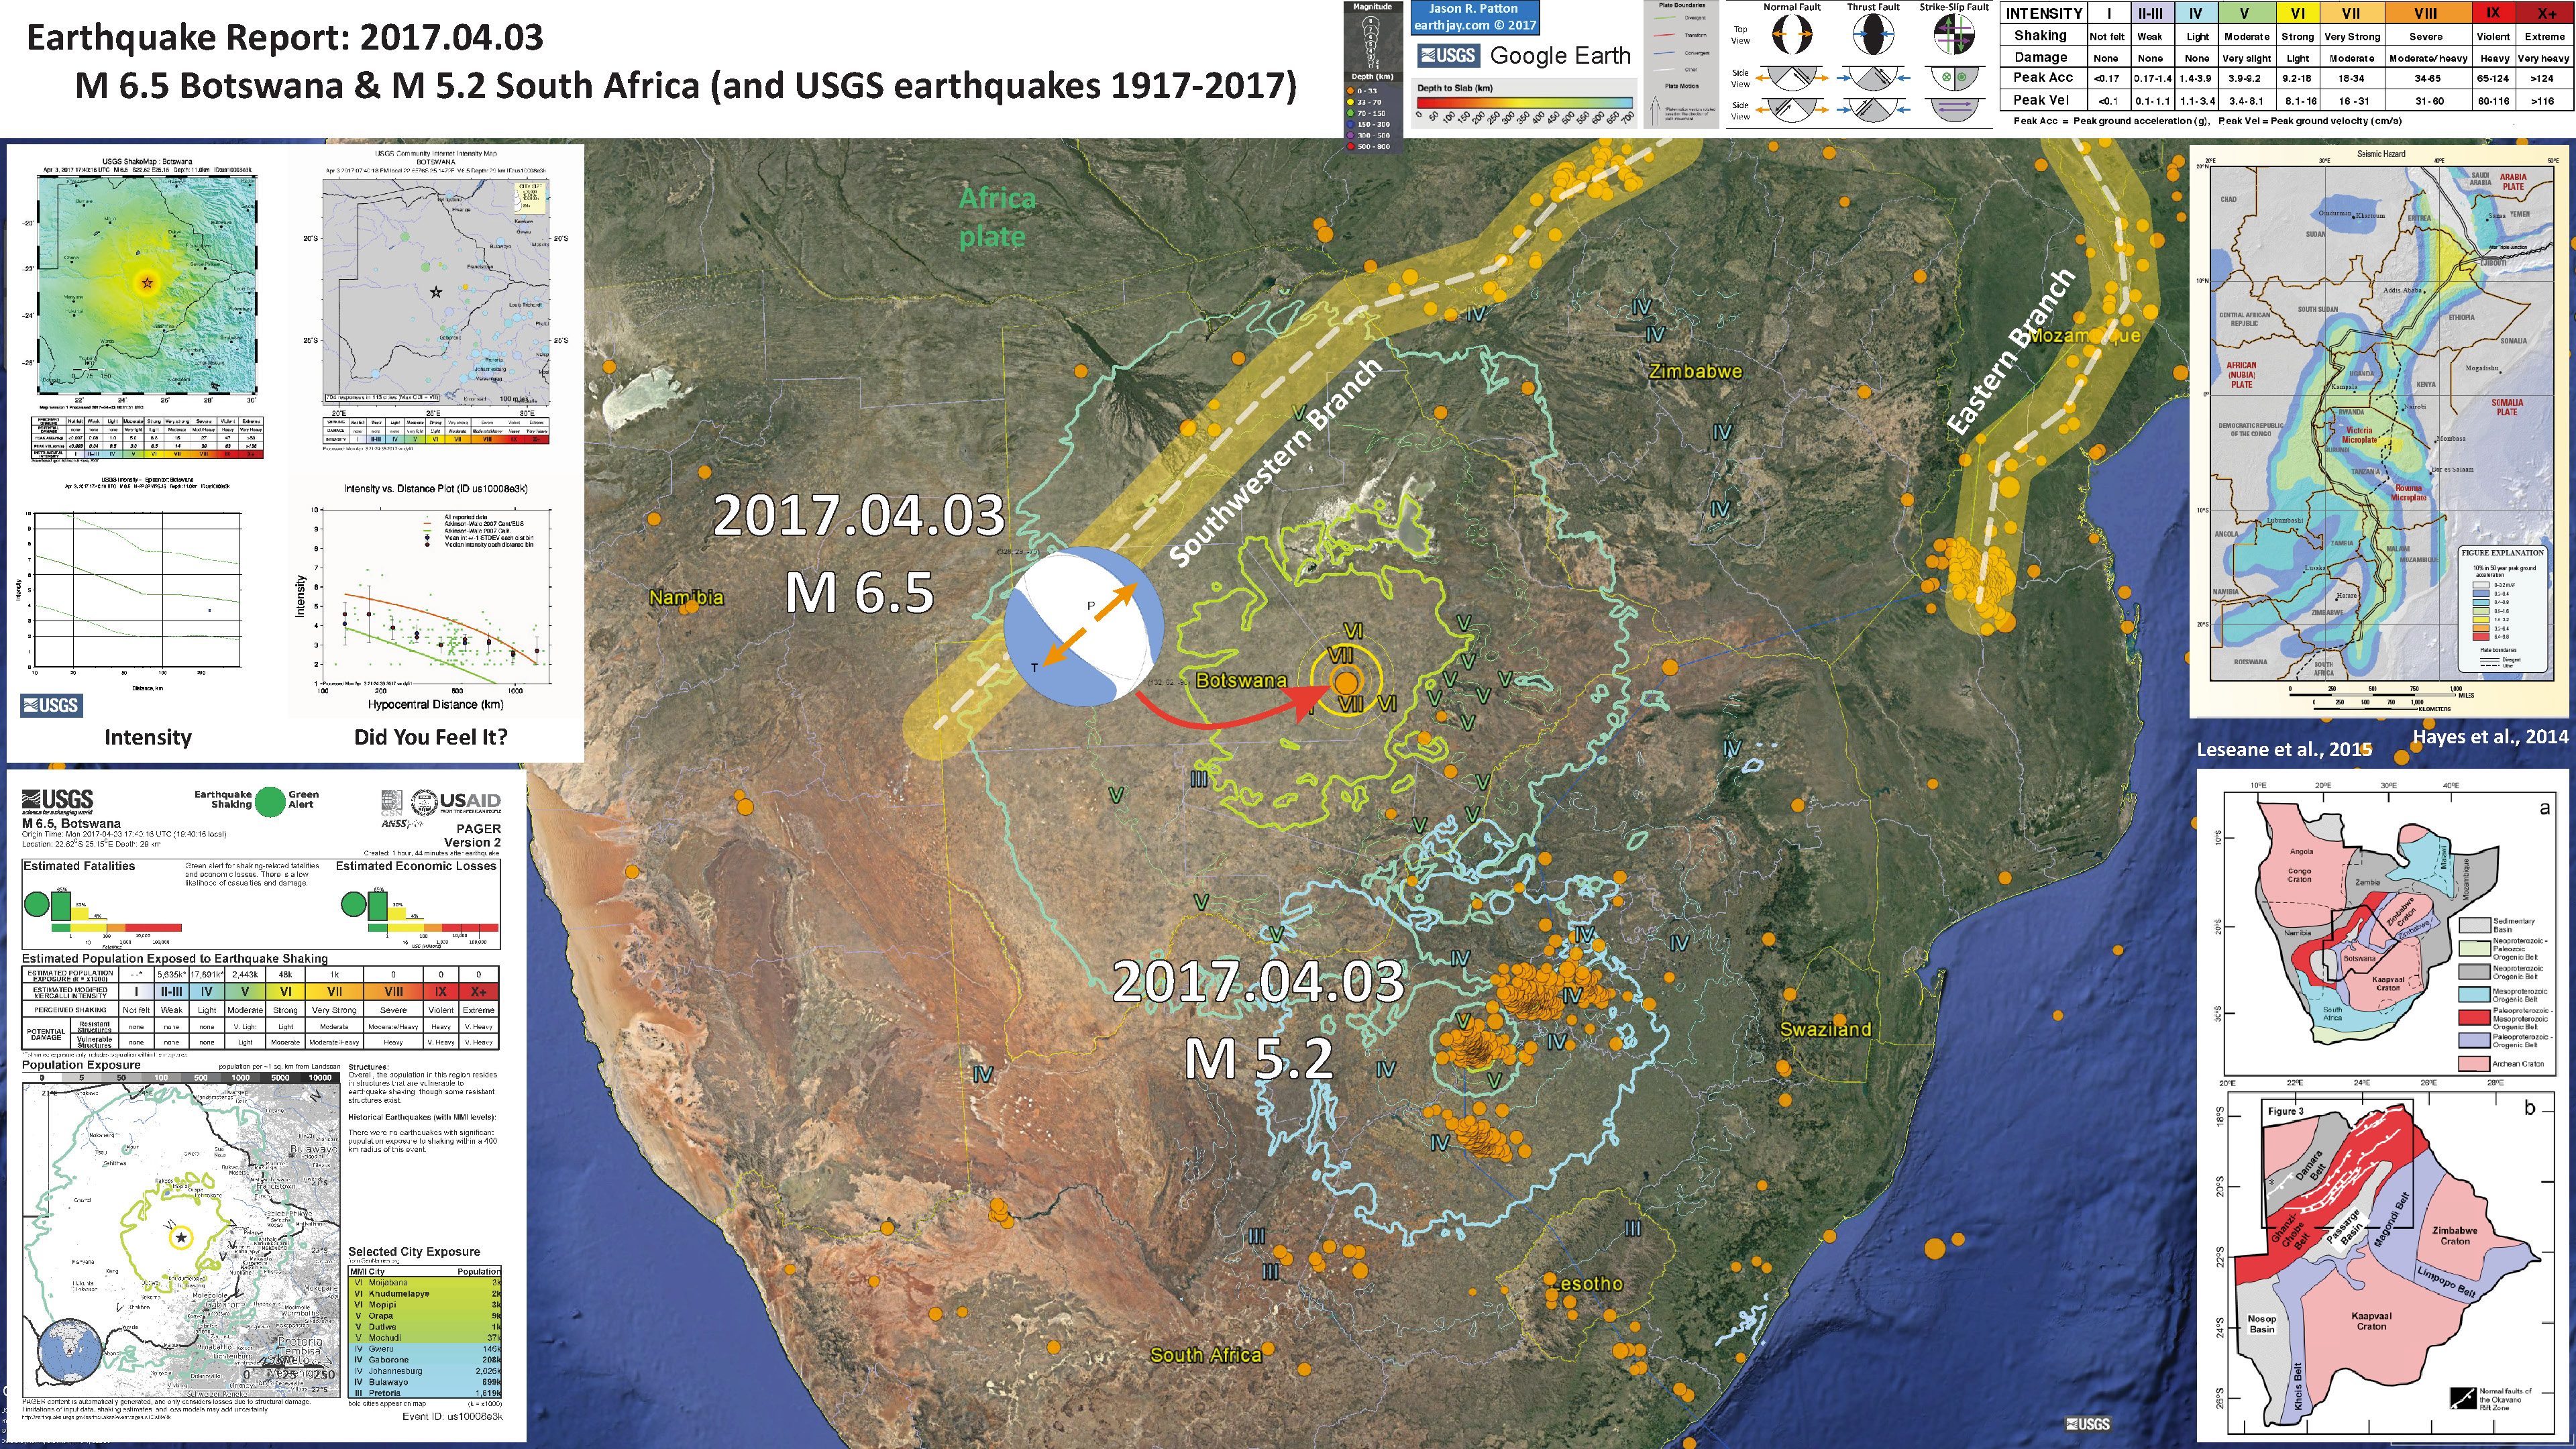
- This is a very interesting M 6.5 earthquake, which was preceded by a probably unrelated M 5.2 earthquake. Last September, there was an M 5.7 earthquake in Tanzania along the western shores of Lake Victoria. Here is my report for that earthquake.
2017.04.03 M 6.5 Botswana
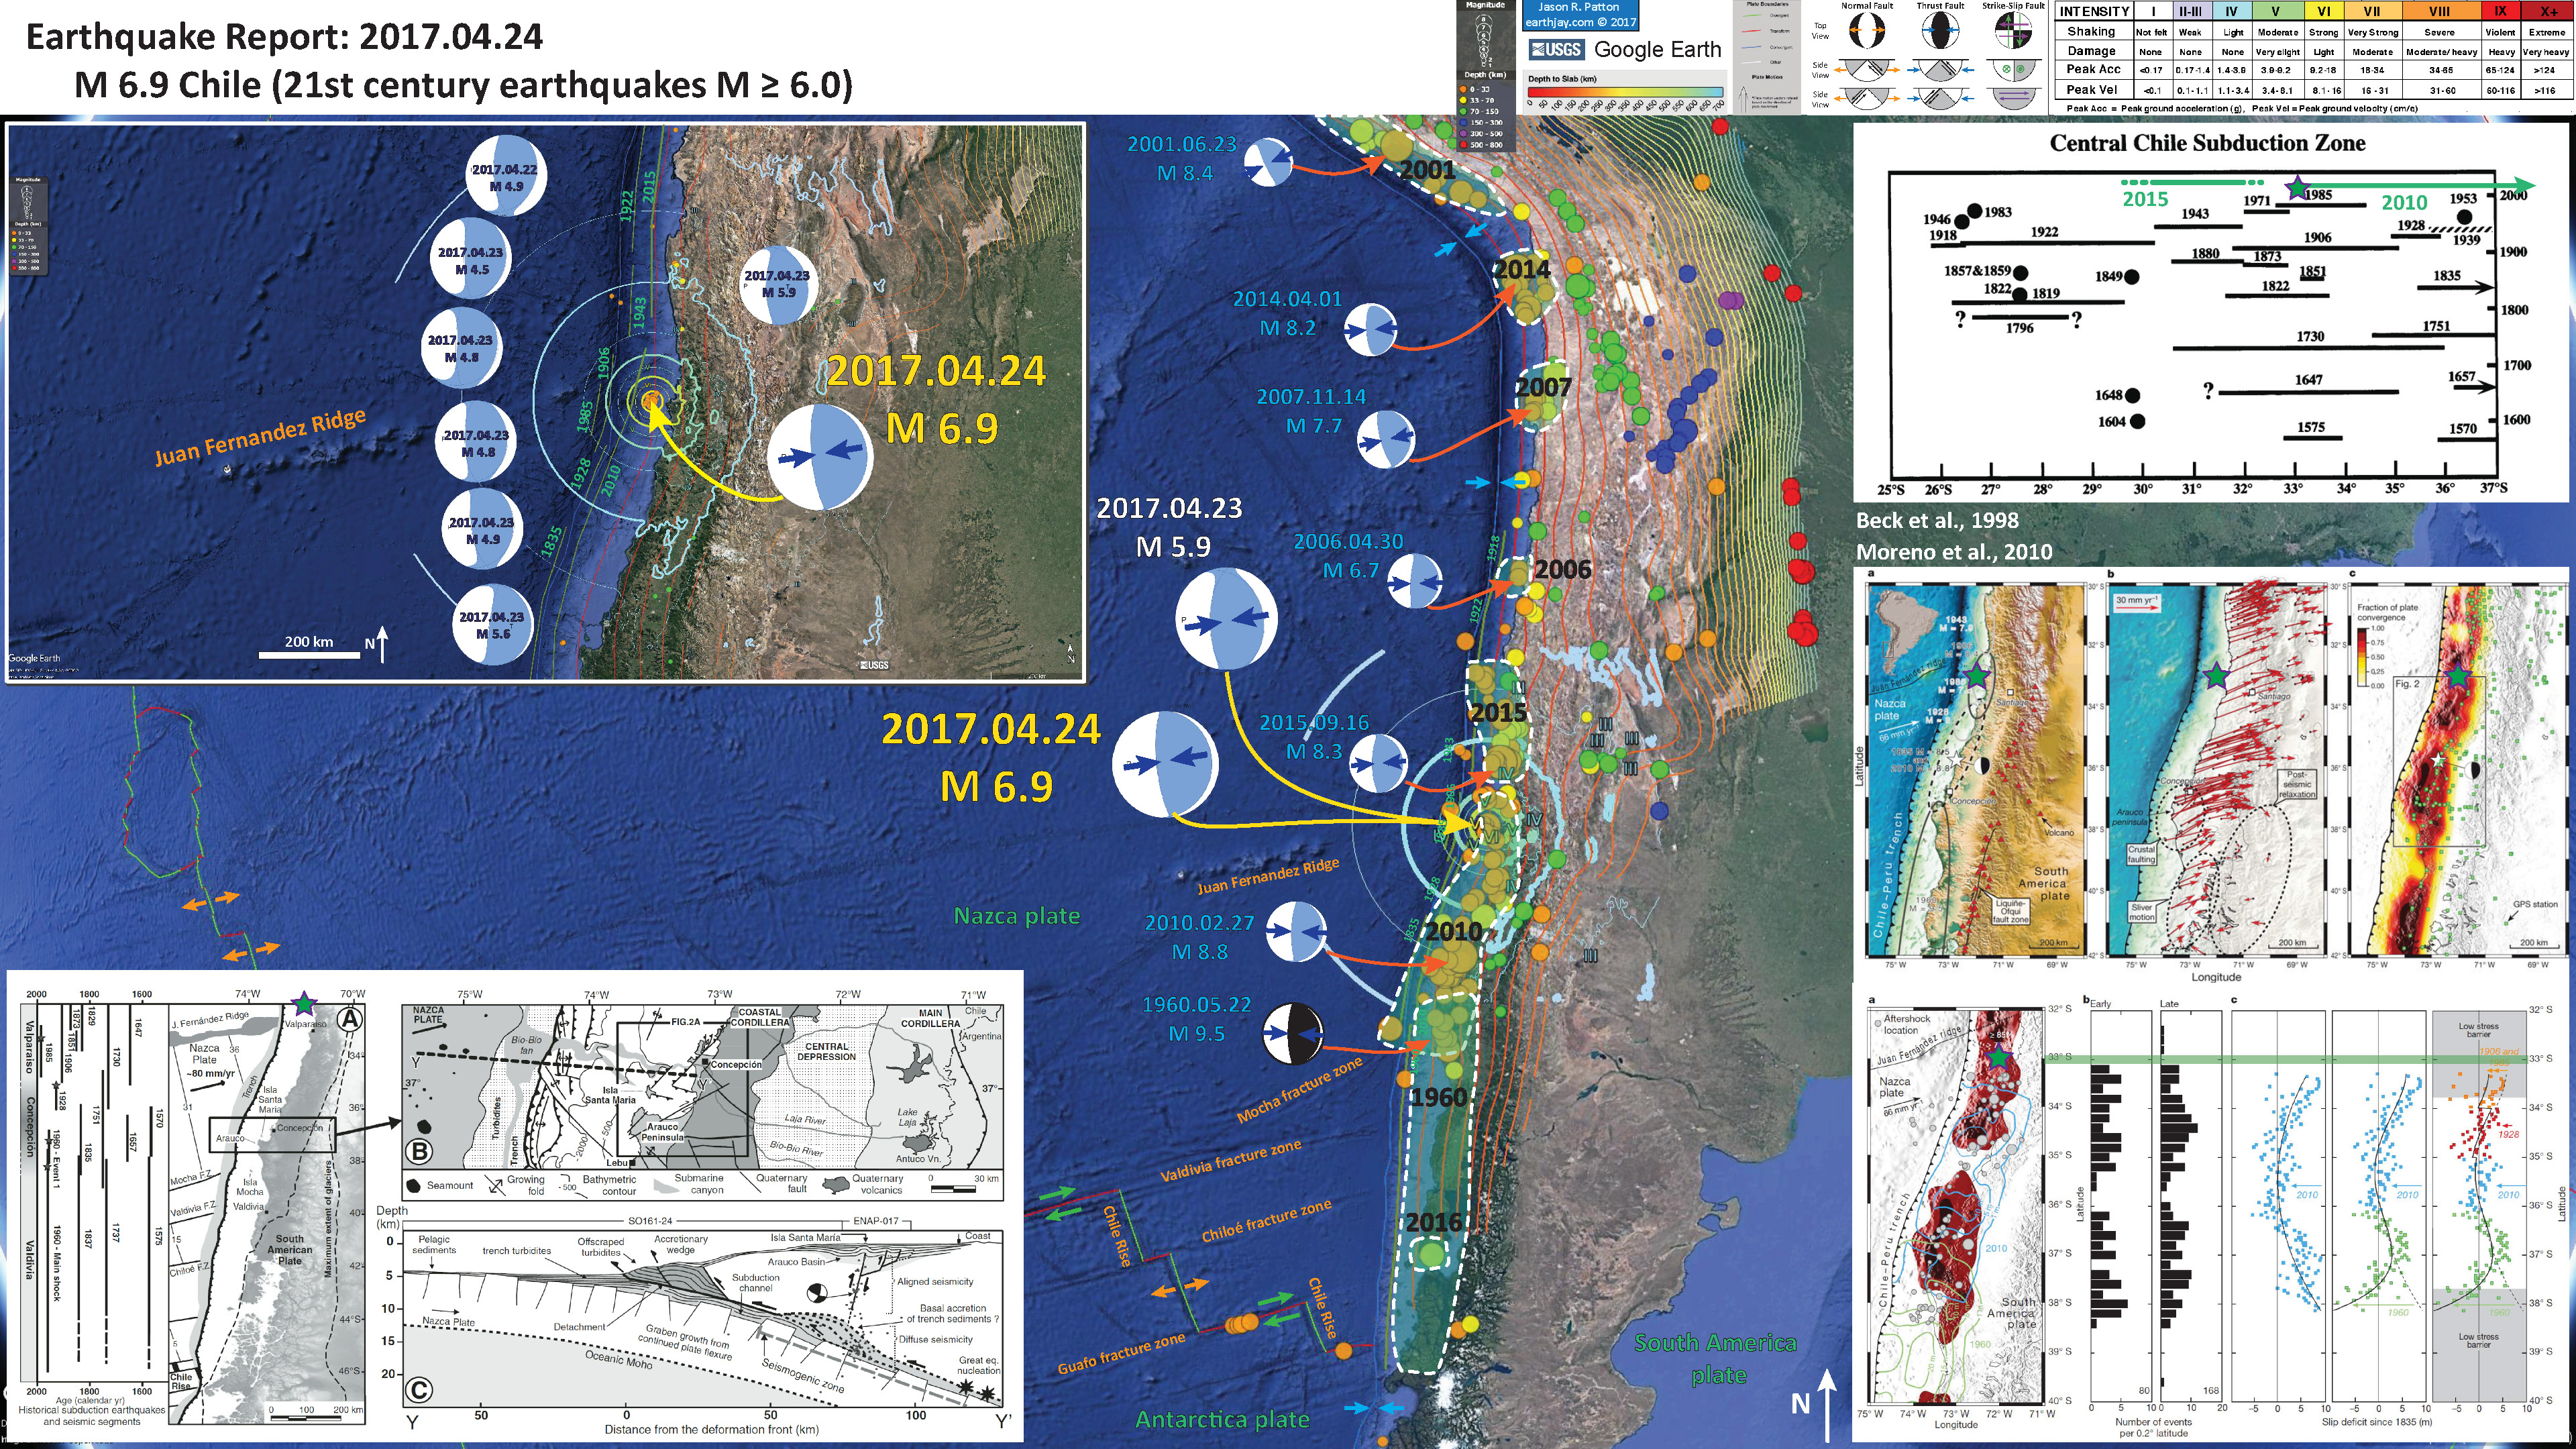
- Well, we had another earthquake in the region of a recent (yesterday and the day before) swarm offshore of Valparaiso, Chile (almost due west of Santiago, one of the largest cities in Chile). My previous report on the M 4-5 earthquakes can be found here. The earlier swarm was a series of shallower earthquakes (though some were of intermediate depth and some were deeper). The M 6.9 earthquake, in contrast, is deeper and likely on the megathrust. The slab contours are at 20 km and the hypocentral depth is 25 km (pretty good match considering the uncertainty with the location of the megathrust). Another difference is that the M 6.9 has a greater potential (likelihood, or chance) to damage people or their belongings.
- Below are some observations of the tsunami. This comes from the Pacific Tsunami Warning Center.
2017.04.24 M 6.9 Chile
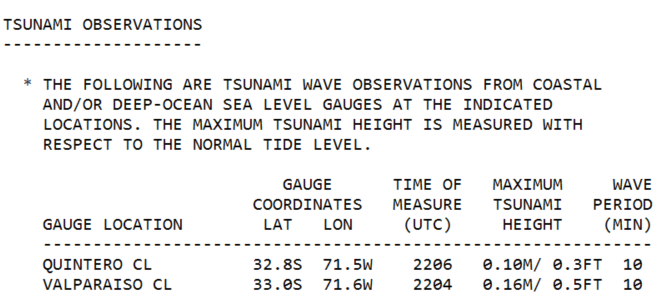
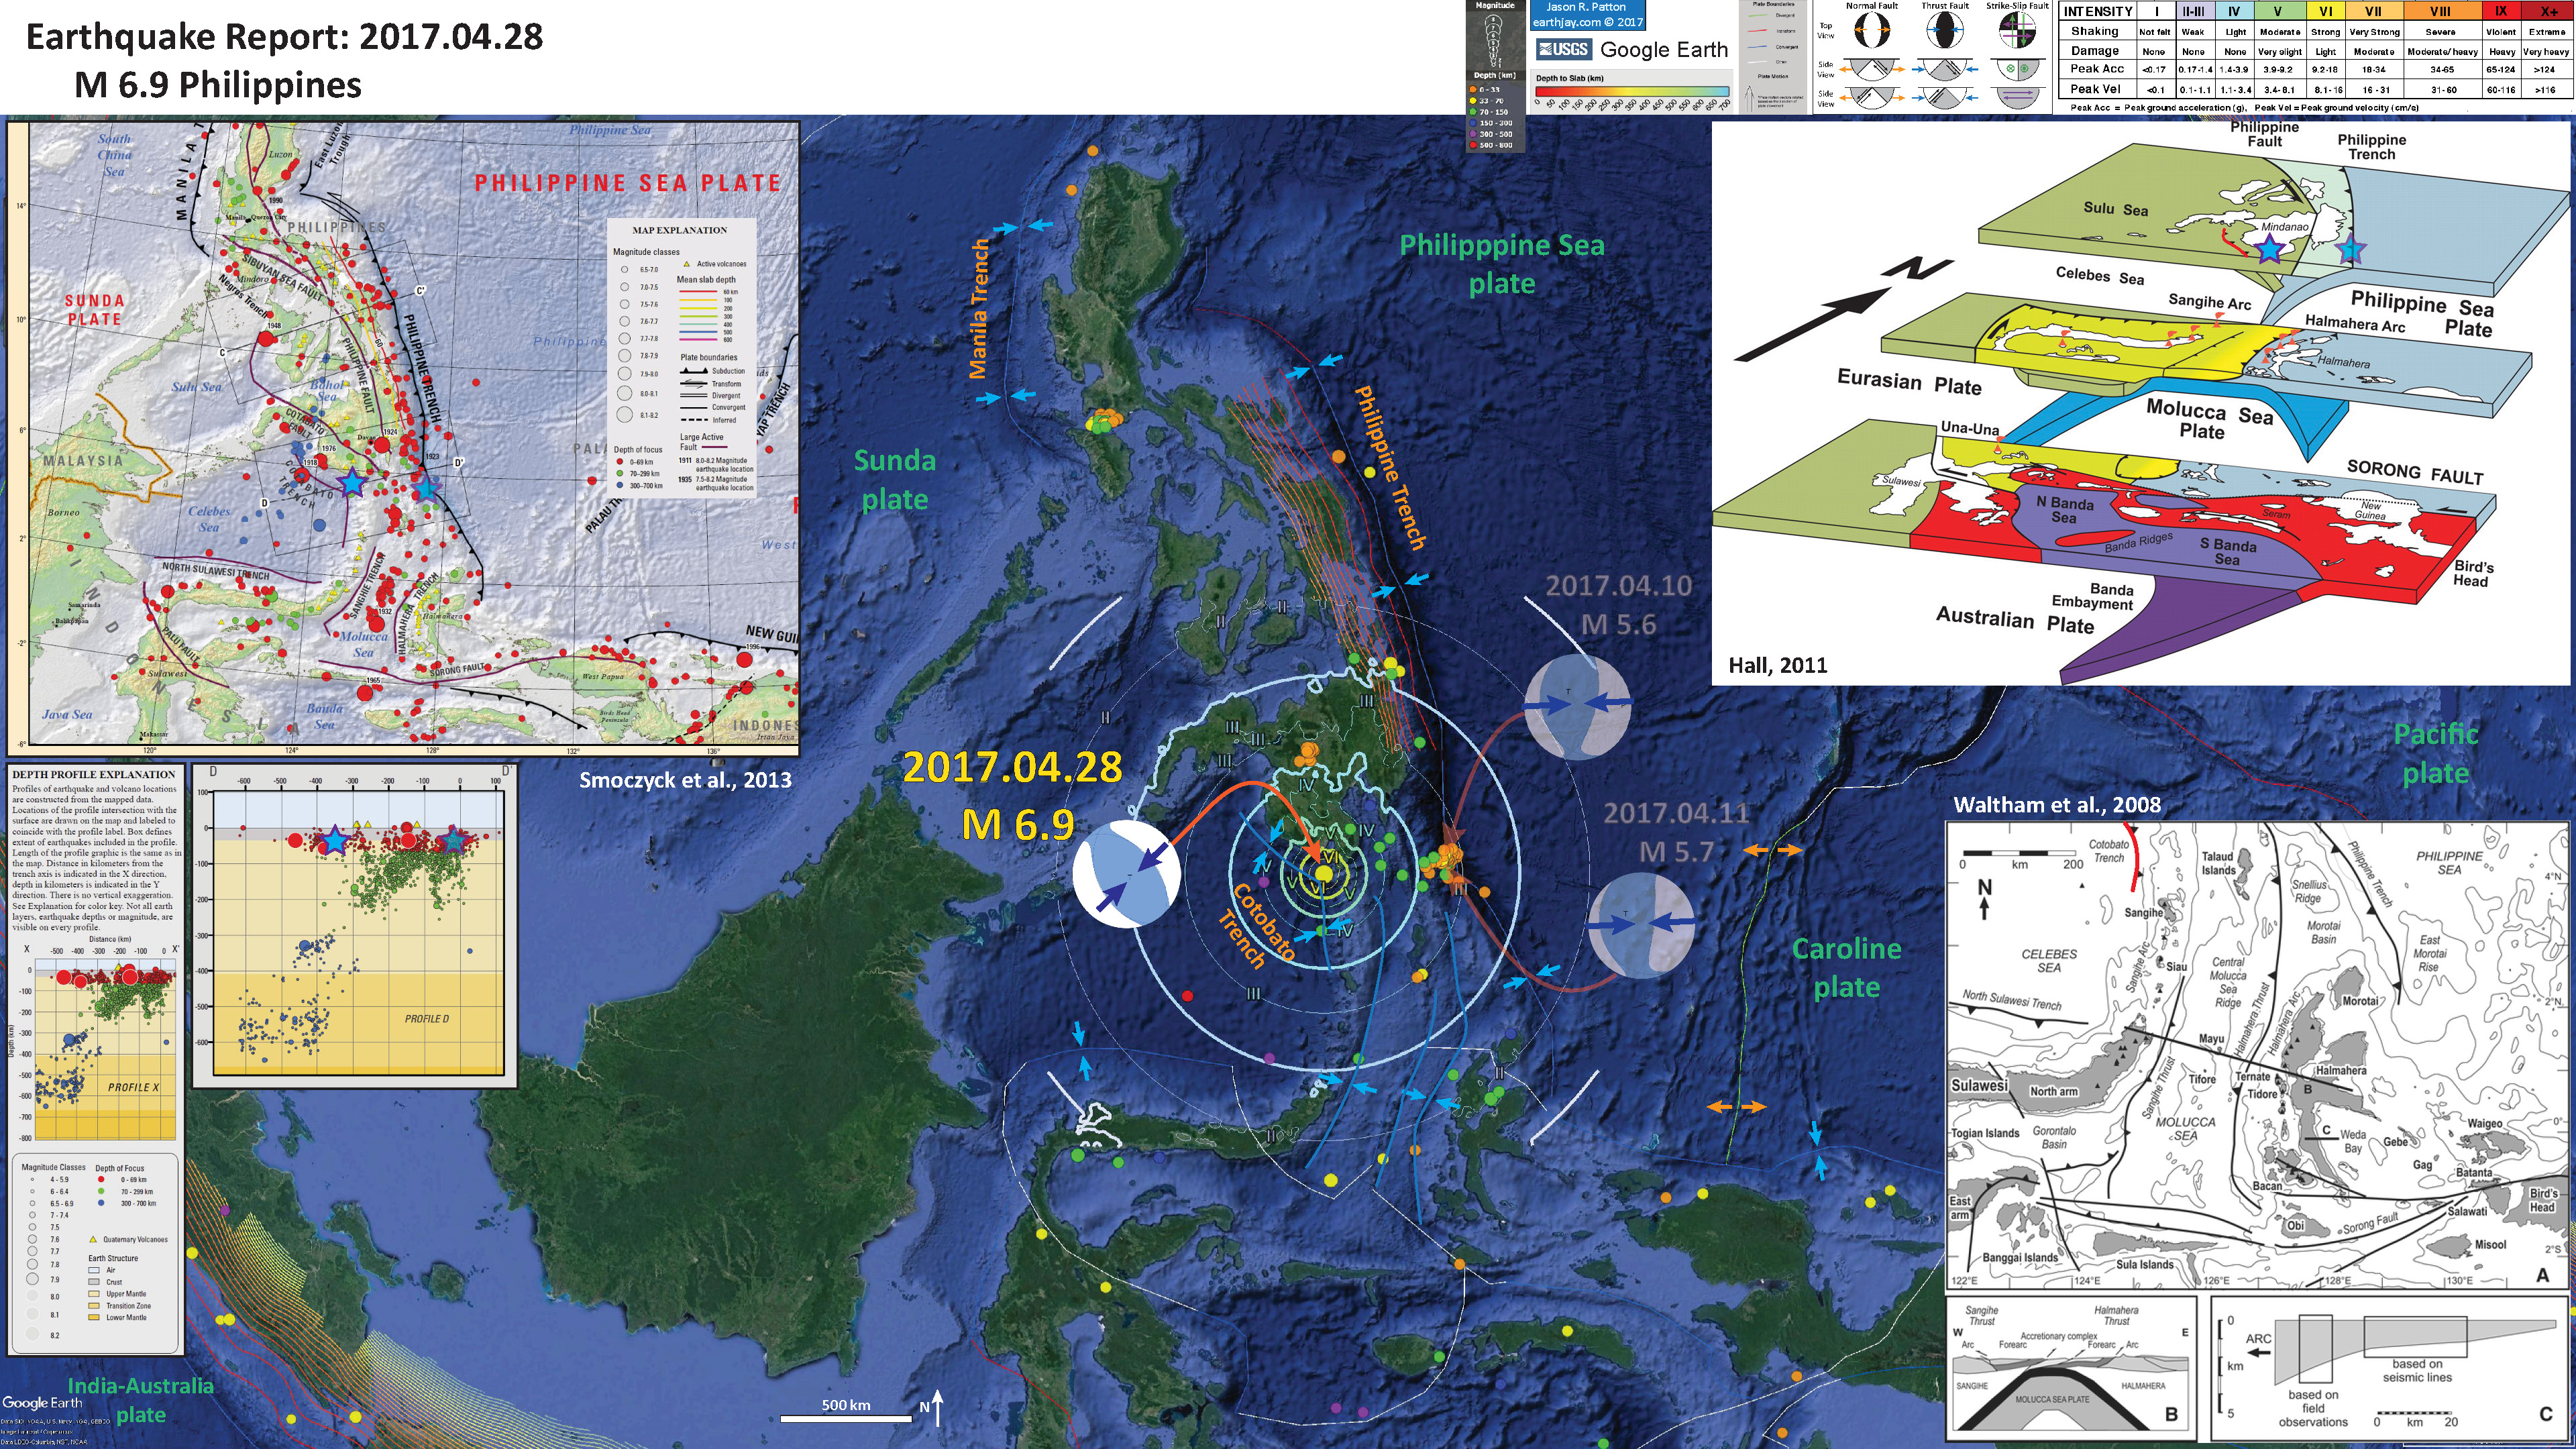
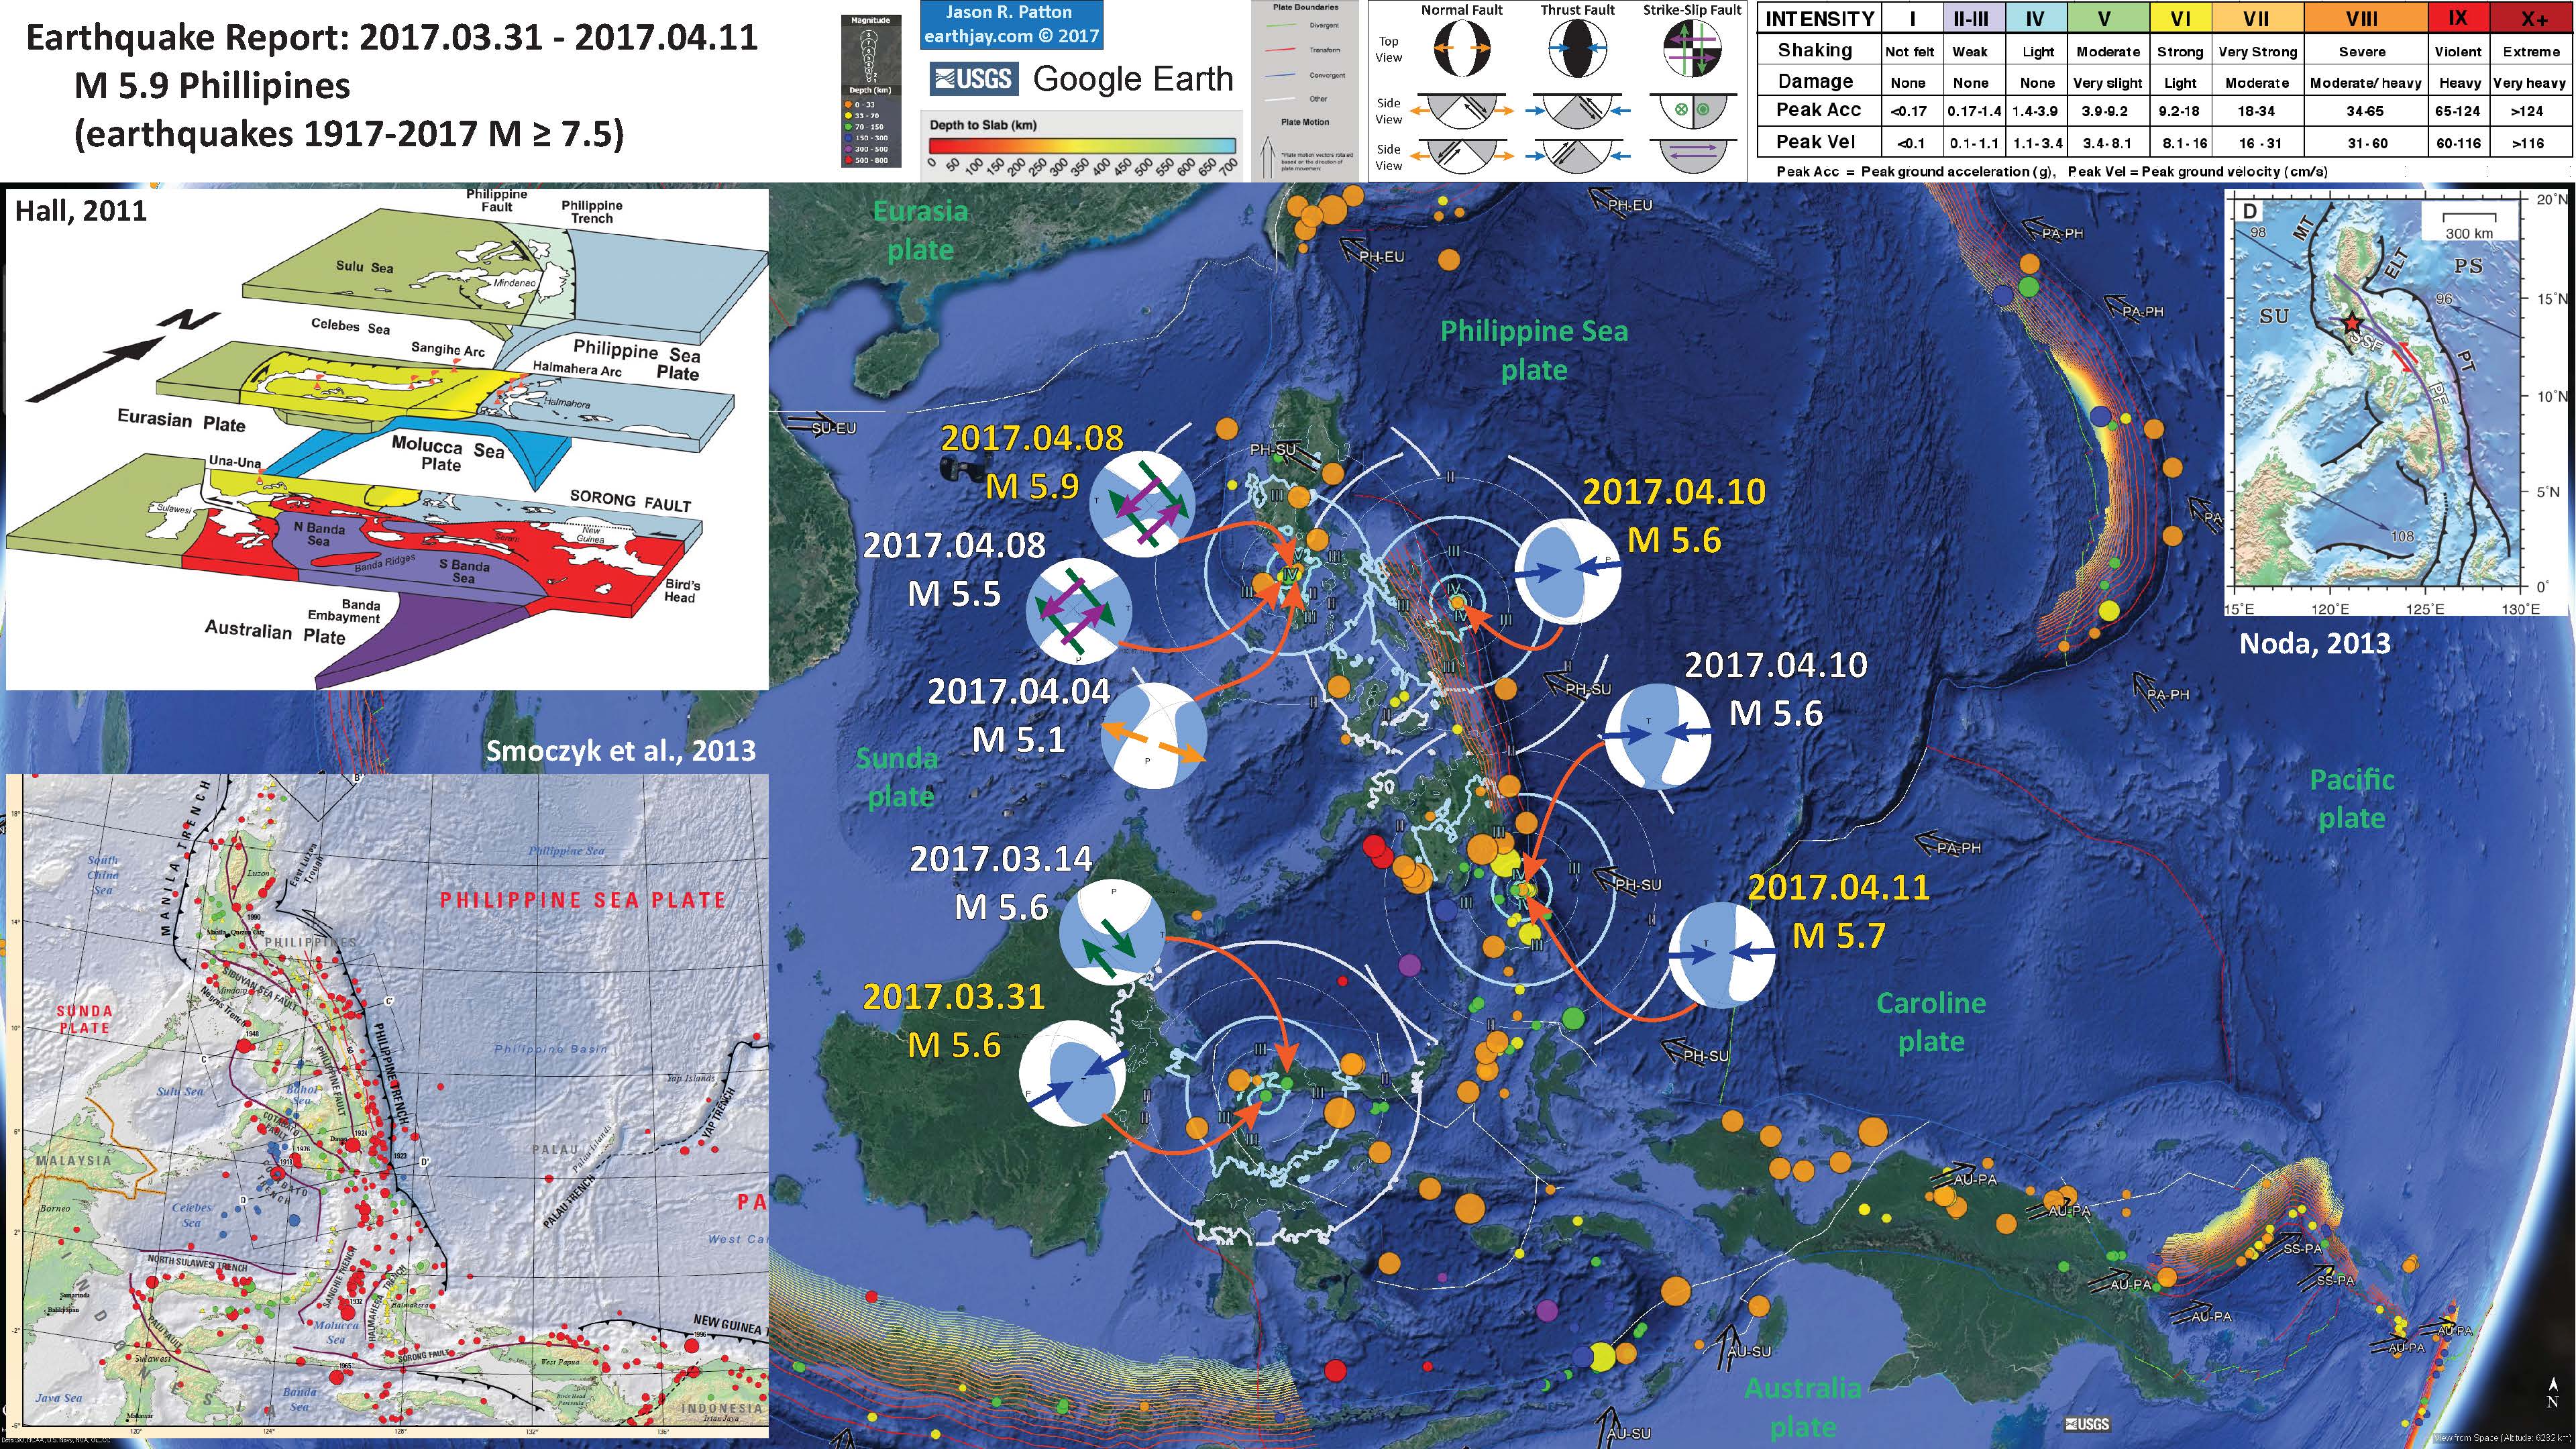
- Earlier in April (2017) there was some activity in 4 different regions of the Philippines. Based upon the low magnitudes and large epicentral distances, these earthquakes were most unlikely to be directly related to each other. A couple days ago, there was an earthquake along-dip from one of these earlier swarms. Here is the USGS web page for this M 6.9 earthquake. There does not appear to have been an observed tsunami based upon a quick look at gages posted to this IOC site (though the closest 2 gages seem to have intermittent records). The along dip seismicity earlier this month was along the Philippine trench subduction zone fault. The M 6.9 earthquake appears to be related to subduction along the Cotobato trench.
- These earthquakes are ~300 km from each other. Also, the Philippine trench swarm appears to possibly have reduced stress on the Cotobato trench, but I might be wrong. Regardless, it is probably a coincidence that these earthquakes are along dip to each other. Another coincidence is another earthquake along-dip to these earthquakes, a deep M 7.3 earthquake in the Celebes Sea in January 2017. Here is my earthquake report for this earthquake.
- Here is my poster for the earthquakes earlier this month.
2017.04.28 M 6.9 Philippines
- There was an earthquake along the New Hebrides Trench this morning (my time in northern California). This earthquake is located deep, possibly below the subduction zone megathrust (but probably is a subduction zone earthquake). The hypocentral depth is 169 km, while the subducting slab is mapped at between 100-120 km in this location. While the slab location has some inherent uncertainty, today’s earthquake is within the range. We probably will never really know, until there is a movie made about this earthquake (surely Hollywood will know).
- There was an earthquake on 2015.10.20 that has a similar moment tensor with a slightly larger magnitude (M 7.1). There was also a sequence of earthquakes in this region in April 2016 (here is my report from 2016.04.28).
2017.05.09 M 6.8 Vanuatu

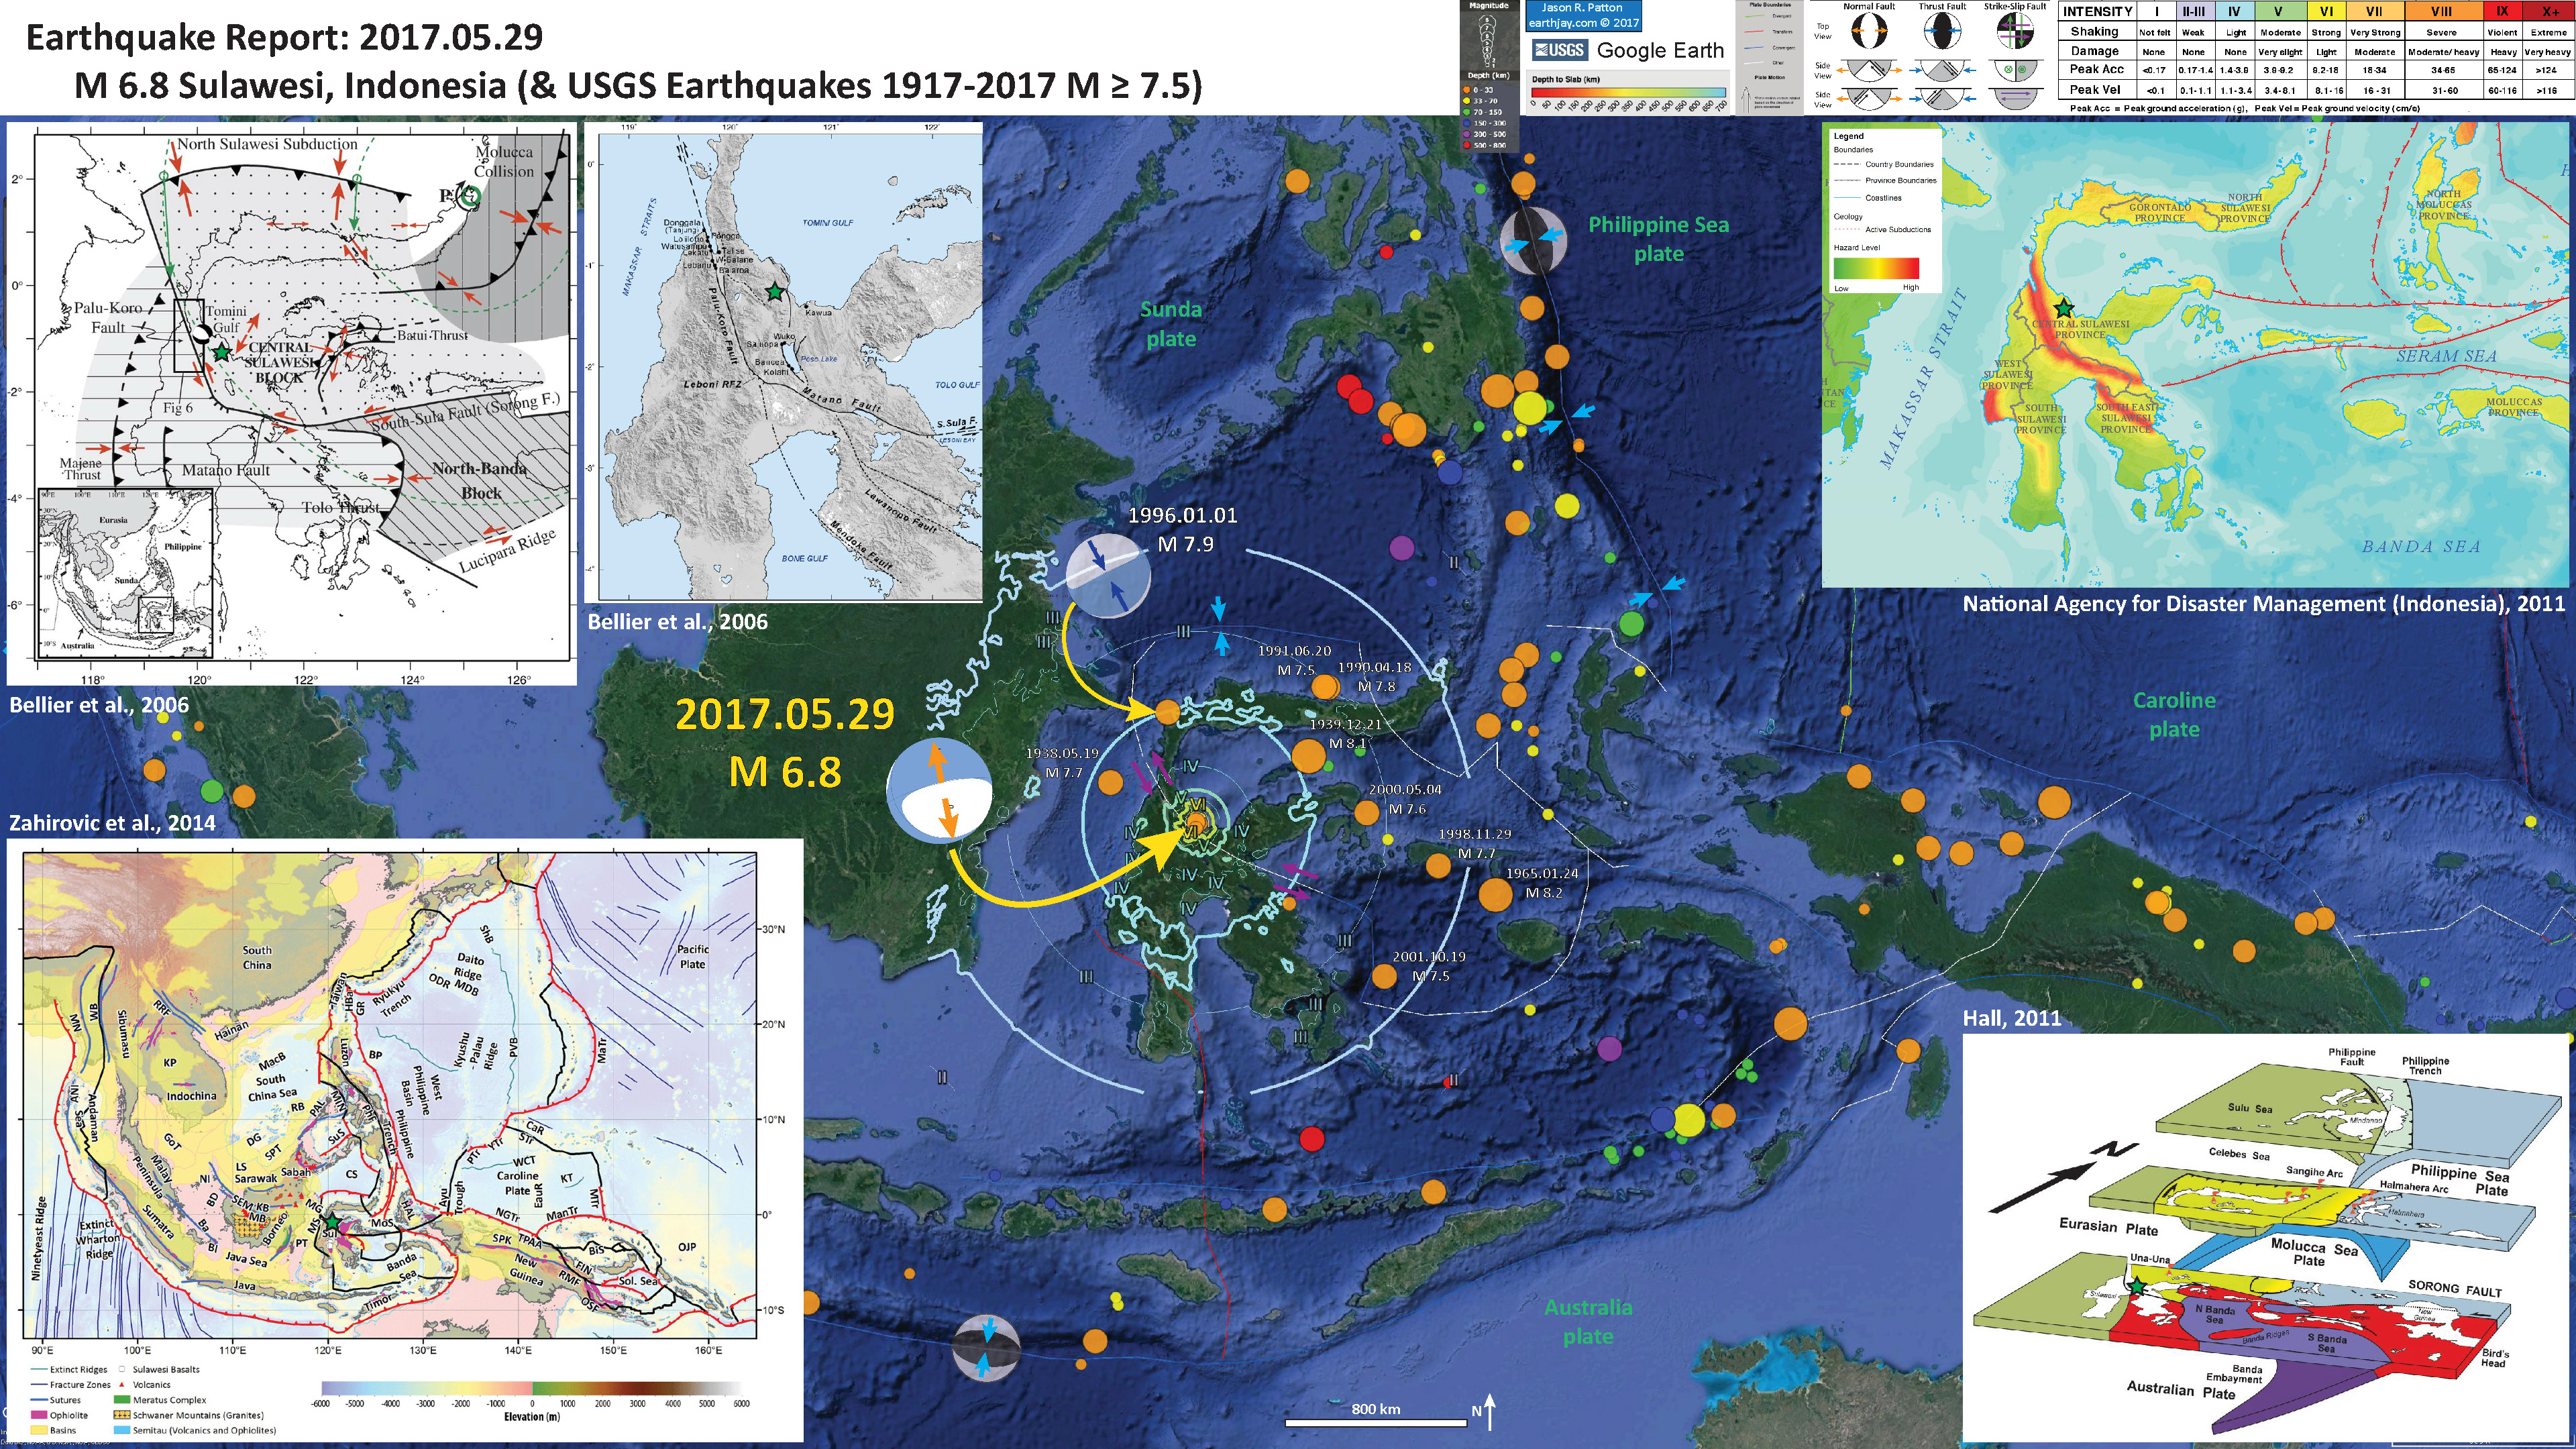
- There was a series of earthquakes in Sulawesi, Indonesia earlier today, with a mainshock having a magnitude of M 6.8. This series of earthquakes is interesting as it does not occur on the main plate boundary fault, but on upper plate faults in the region. There is a major left-lateral strike-slip fault system to the west of these earthquakes (the Palu-Koro fault).
- Part of this being interesting is that the orientation of the earthquake is oblique to some estimates of the orientation of extension in this region. The M 6.8 earthquake shows an extensional earthquake with extension oriented ~north-south. Some estimate extension in the upper plate to be northeast-southwest (Bellier et al., 2006), while others estimate extension in the upper plate to be oriented parallel to the M 6.8 earthquake (e.g. Walpersdorf et al., 1998). Spencer (2010) also documented normal faults in the upper plate that may also be correctly oriented for this M 6.8 earthquake. However, looking at the SRTM topographic data using the GeoMapApp, there is a structural grain that appears oriented to the extension estimated by Bellier et al., 2006.
2017.05.29 M 6.8 Sulawesi, Indonesia
- This earthquake happened a couple weeks ago, but was interesting and I have been looking forward to following up on this with a report. Here is the USGS website for this M 6.8 earthquake.
- The M 6.8 earthquake happened in a region where the Pacific-North America plate boundary transitions from a subduction zone to a shear zone. To the east of this region, the Pacific plate subducts beneath the North America plate to form the Alaska-Aleutian subduction zone. As a result of this subduction, a deep oceanic trench is formed. To the west of this earthquake, the plate boundary is in the form of a shear zone composed of several strike-slip faults. The main fault that is positioned in the trench is the Bering-Kresla shear zone (BKSZ), a right-lateral strike-slip fault. In the oceanic basin to the north of the BKSZ there are a series of parallel fracture zones, also right-lateral strike-slip faults.
- My initial thought is that the entire Aleutian trench was a subduction zone prior to about 47 million years ago (Wilson, 1963; Torsvik et al., 2017). Prior to 47 Ma, the relative plate motion in the region of the BKSZ would have been more orthogonal (possibly leading to subduction there). After 47 Ma, the relative plate motion in the region of the BKSZ has been parallel to the plate boundary, owing to the strike-slip motion here. However, Konstantinovskaia (2001) used paleomagnetic data for a plate motion reconstruction through the Cenozoic and they have concluded that there is a much more complicated tectonic history here (with strike-slip faults in the region prior to 47 Ma and other faults extending much farther east into the plate boundary). When considering this, I was reminded that the relative plate motion in the central Aleutian subduction zone is oblique. This results in strain partitioning where the oblique motion is partitioned into fault-normal fault movement (subduction) and fault-parallel fault movement (strike-slip, along forearc sliver faults). The magmatic arc in the central Aleutian subduction zone has a forearc sliver fault, but also appears to have blocks that rotate in response to this shear (Krutikov, 2008).
- There have been several other M ~6 earthquakes to the west that are good examples of this strike-slip faulting in this area. On 2003.12.05 there was a M 6.7 earthquake along the Bering fracture zone (the first major strike-slip fault northeast of the BKSZ). On 2016.09.05 there was a M 6.3 earthquake also on the Bering fracture zone. Here is my earthquake report for the 2016 M 6.3 earthquake. The next major strike-slip fault, moving away from the BKSZ, is the right-lateral Alpha fracture zone. The M 6.8 earthquake may be related to this northwest striking fracture zone. However, aftershocks instead suggest that this M 6.8 earthquake is on a fault oriented in the northeast direction. There is no northeast striking strike-slip fault mapped in this area and the Shirshov Ridge is mapped as a thrust fault (albeit inactive). There is a left-lateral strike-slip fault that splays off the northern boundary of Bowers Ridge. If this fault strikes a little more counter-slockwise than is currently mapped at, the orientation would match the fault plane solution for this M 6.8 earthquake (and also satisfies the left-lateral motion for this orientation). The bathymetry used in Google Earth does not reveal the orientation of this fault, but the aftershocks sure align nicely with this hypothesis.
- Here is the interpretive poster from the 2016.09.05 M 6.3 #EarthquakeReport.
- On 2017.05.08 there was an earthquake further to the east, with a magnitude M 6.2. Here is my interpretive poster for this earthquake, which includes fault plane solutions for several historic earthquakes in the region. These fault plane solutions reveal the complicated intersection of these two different types of faulting along this plate boundary. Here is my earthquake report for this earthquake sequence.
2017.06.02 M 6.8 Aleutians
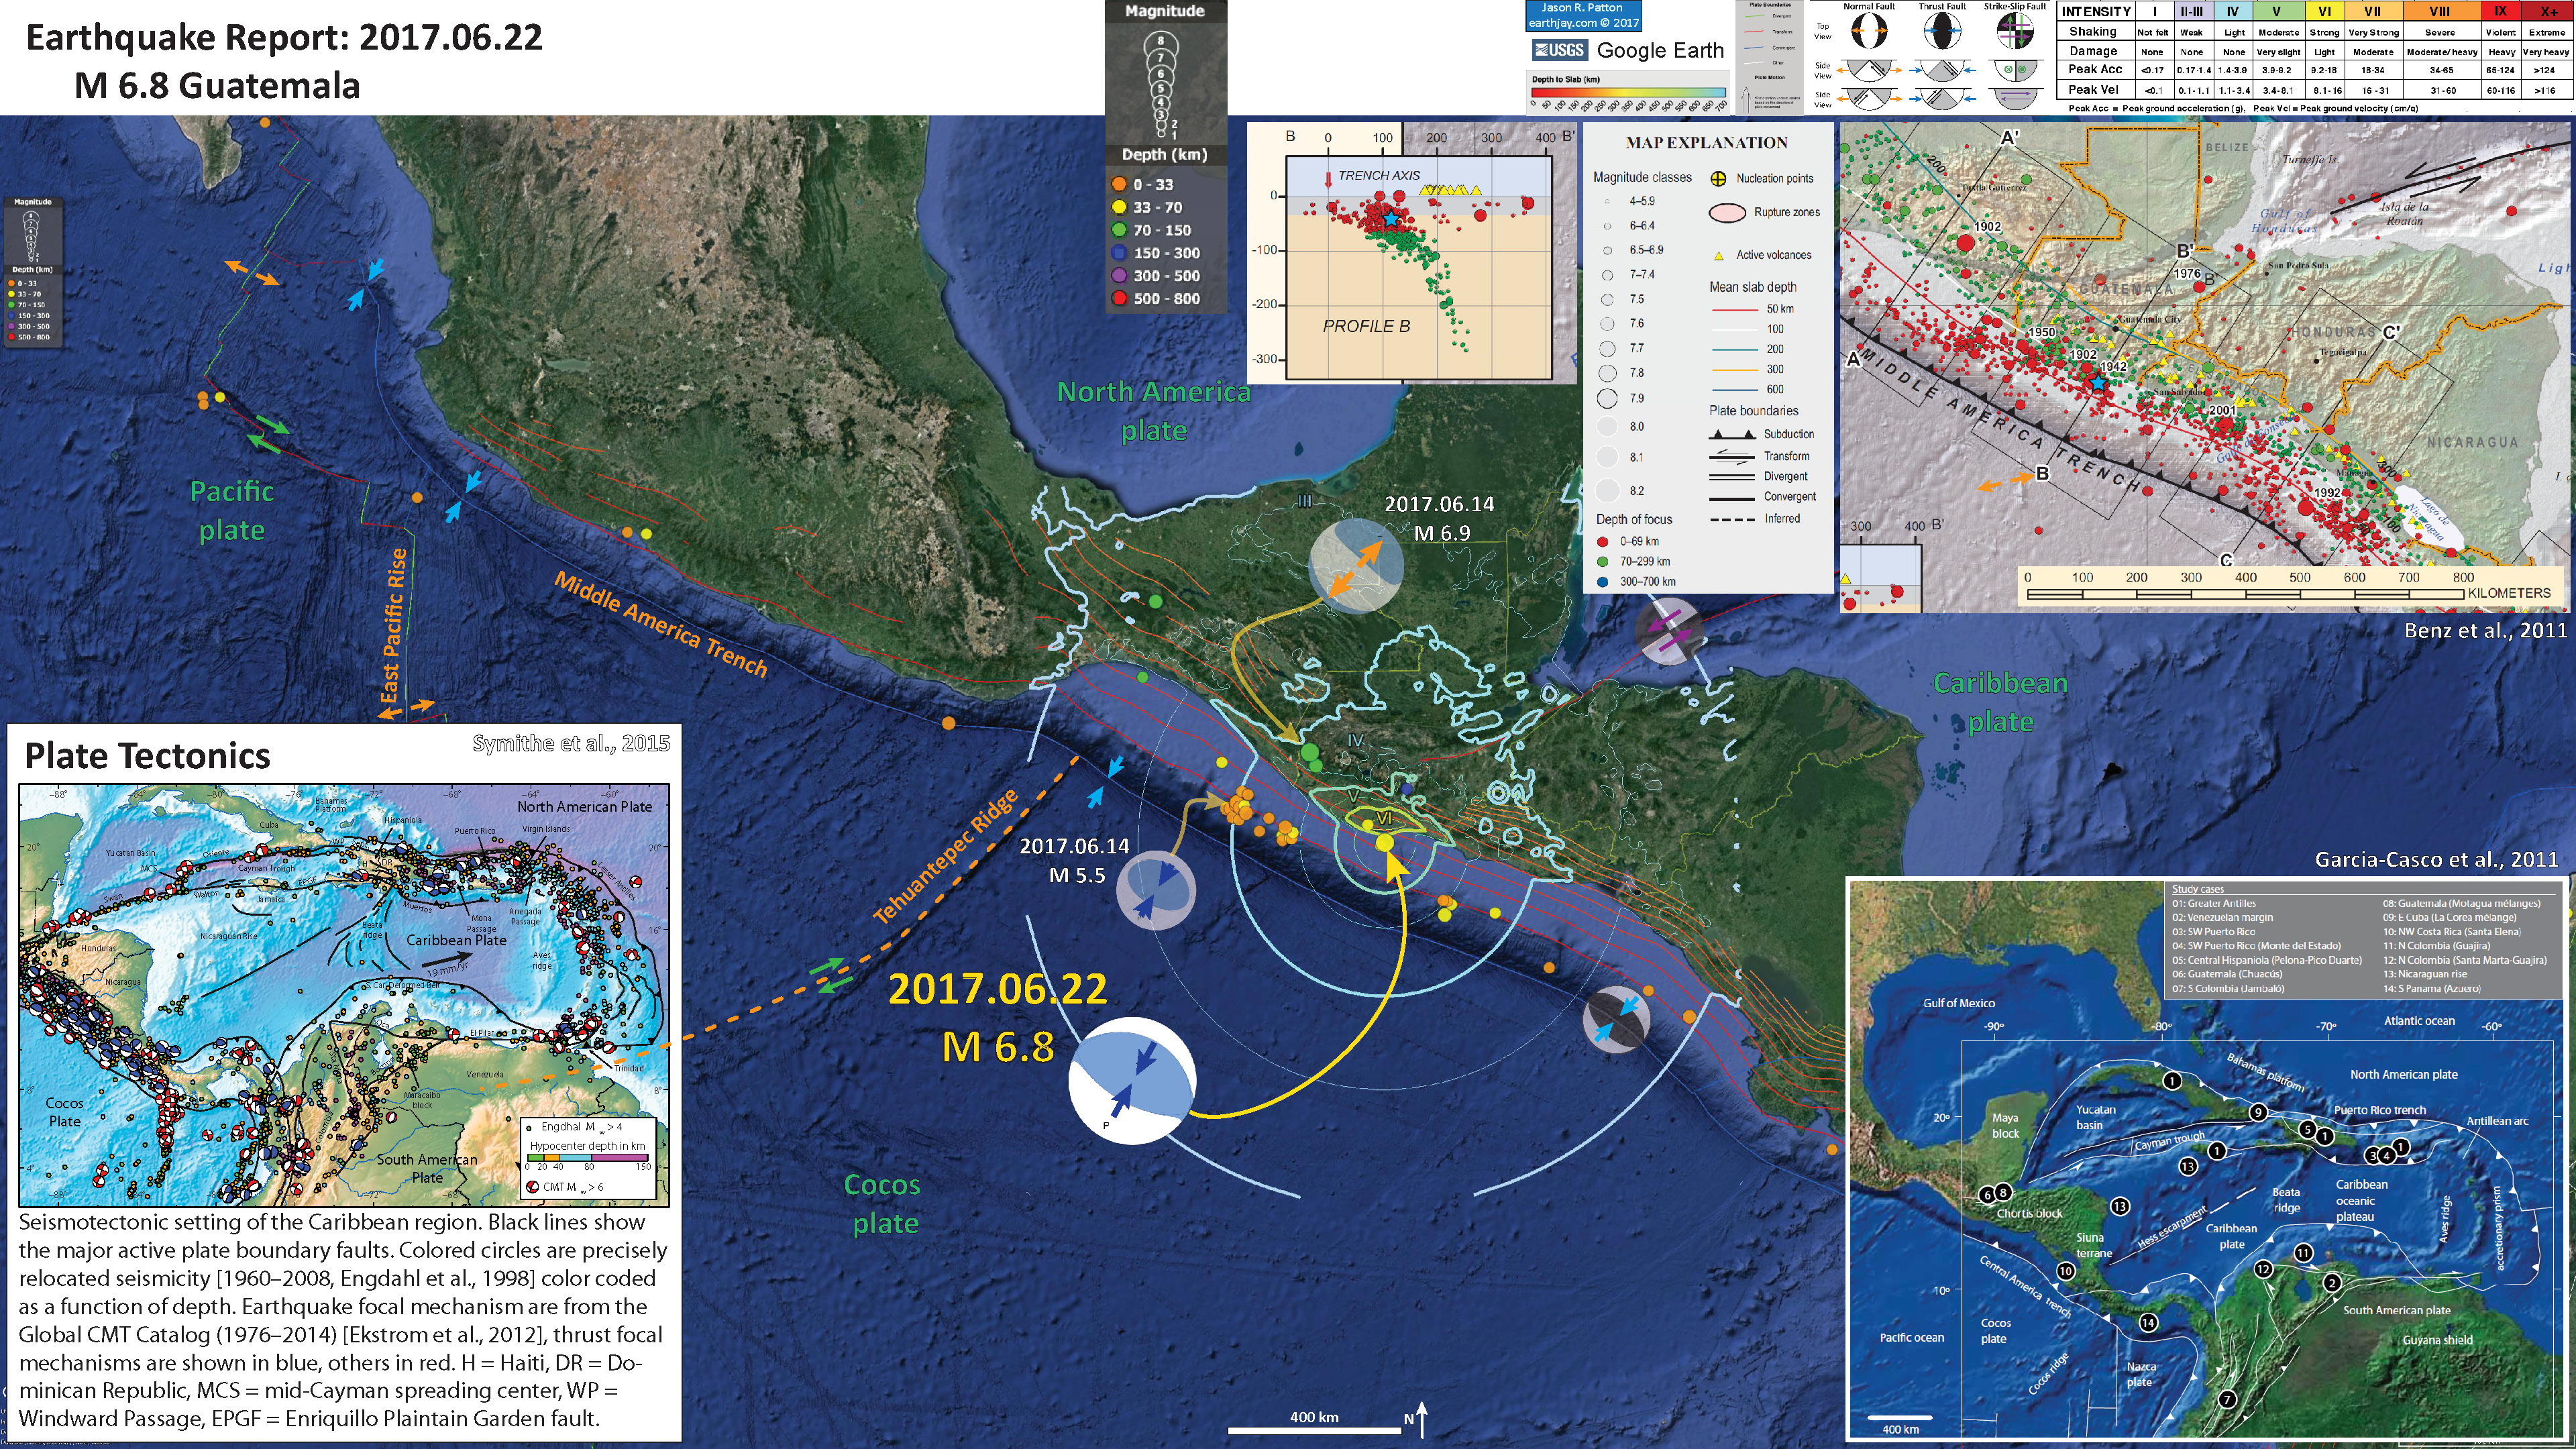
- There was a really cool earthquake sequence a few days ago on and offshore of Guatemala. Offshore of Guatemala in the Pacific Ocean, the Cocos plate subducts beneath the North America and Caribbean plates (NAP & CP). The transform plate boundary between the NAP and CP forms the Motagua-Polochic fault zone onshore, which bisects Guatemala.
- From late May 2017 through mid June there were several earthquakes with the largest magnitude M = 5.5. These earthquake hypocenters have depths that are deeper and shallower than the estimated depth for the subduction zone fault (Hayes et al., 2012), but many of the earthquakes simply have a default depth of 10 km. So it is difficult to say if these are all near the megathrust or are on upper plate faults (e.g. in the accretionary prism). These earthquakes have compressional fault plane solutions. Either way, they appear to have loaded some faults down-dip along the subducting slab. This may or may not be the case, but there was a deep extensional magnitude M 6.9 earthquake (with an aftershock of M = 5.1 nearby). These along dip earthquakes are probably related.
2017.06.14 M 6.9 Guatemala
- This morning we had an earthquake offshore of Guatemala with a magnitude M = 6.8. Here is the USGS website for this earthquake. This earthquake occurred to the east of a sequence from about a week ago. Here is my earthquake report for that sequence.
- Offshore of Guatemala is a subduction zone thrust fault, where the Cocos plate dives east beneath the North America (in the north) and Caribbean plates (in the south). Subduction zone faults are capable of generating the largest magnitude earthquakes possible because the fault width is wider than other faults. The seismogenic zone, the region of the crust that can store elastic strain and experience brittle rupture during earthquakes, extends into the earth several tens of kms. Strike-slip faults generally dip vertically, giving them the narrowest fault width. While subduction zones dip at an angle, so their fault width is wider. Earthquake magnitude is a measure of energy released during the earthquake and the moment magnitude (the magnitude most people use) is based on three factors: (1) fault area, (2) fault slip, and (3) shear modulus (how flexible, or rigid, the crust/lithosphere is). Fault area is length times width. Length is the distance on the ground surface that the fault ruptures and width is the distance into the earth that the fault ruptures. Because subduction zone faults dip into the earth at an angle, the distance that they extend before reaching a given depth is larger, owing to a larger possible magnitude.
- Today’s M 6.8 earthquake has a USGS hypocentral depth of ~47 km, which is very close to the depth of the subduction zone fault. Also, the fault plane solution (moment tensor, read below) is compressional. Thus, I interpret this earthquake to be a subduction zone earthquake at or near the megathrust. This earthquake is different from the sequence from a week ago. Those earthquakes had two populations: (1) earthquakes in the accretionary prism of the subduction zone and (2) earthquakes in the downgoing Cocos plate. Those earthquakes were not subduction zone earthquakes (though the shallower earthquakes may not have had well located hypocenters, so their depths are suspect… and could have been on the subduction zone). I suspect that this M 6.8 earthquake is related to the earthquakes from last week. I include the moment tensors for 2 of the significant earthquakes from last week. See my report for more on that sequence.
2017.06.22 M 6.8 Guatemala
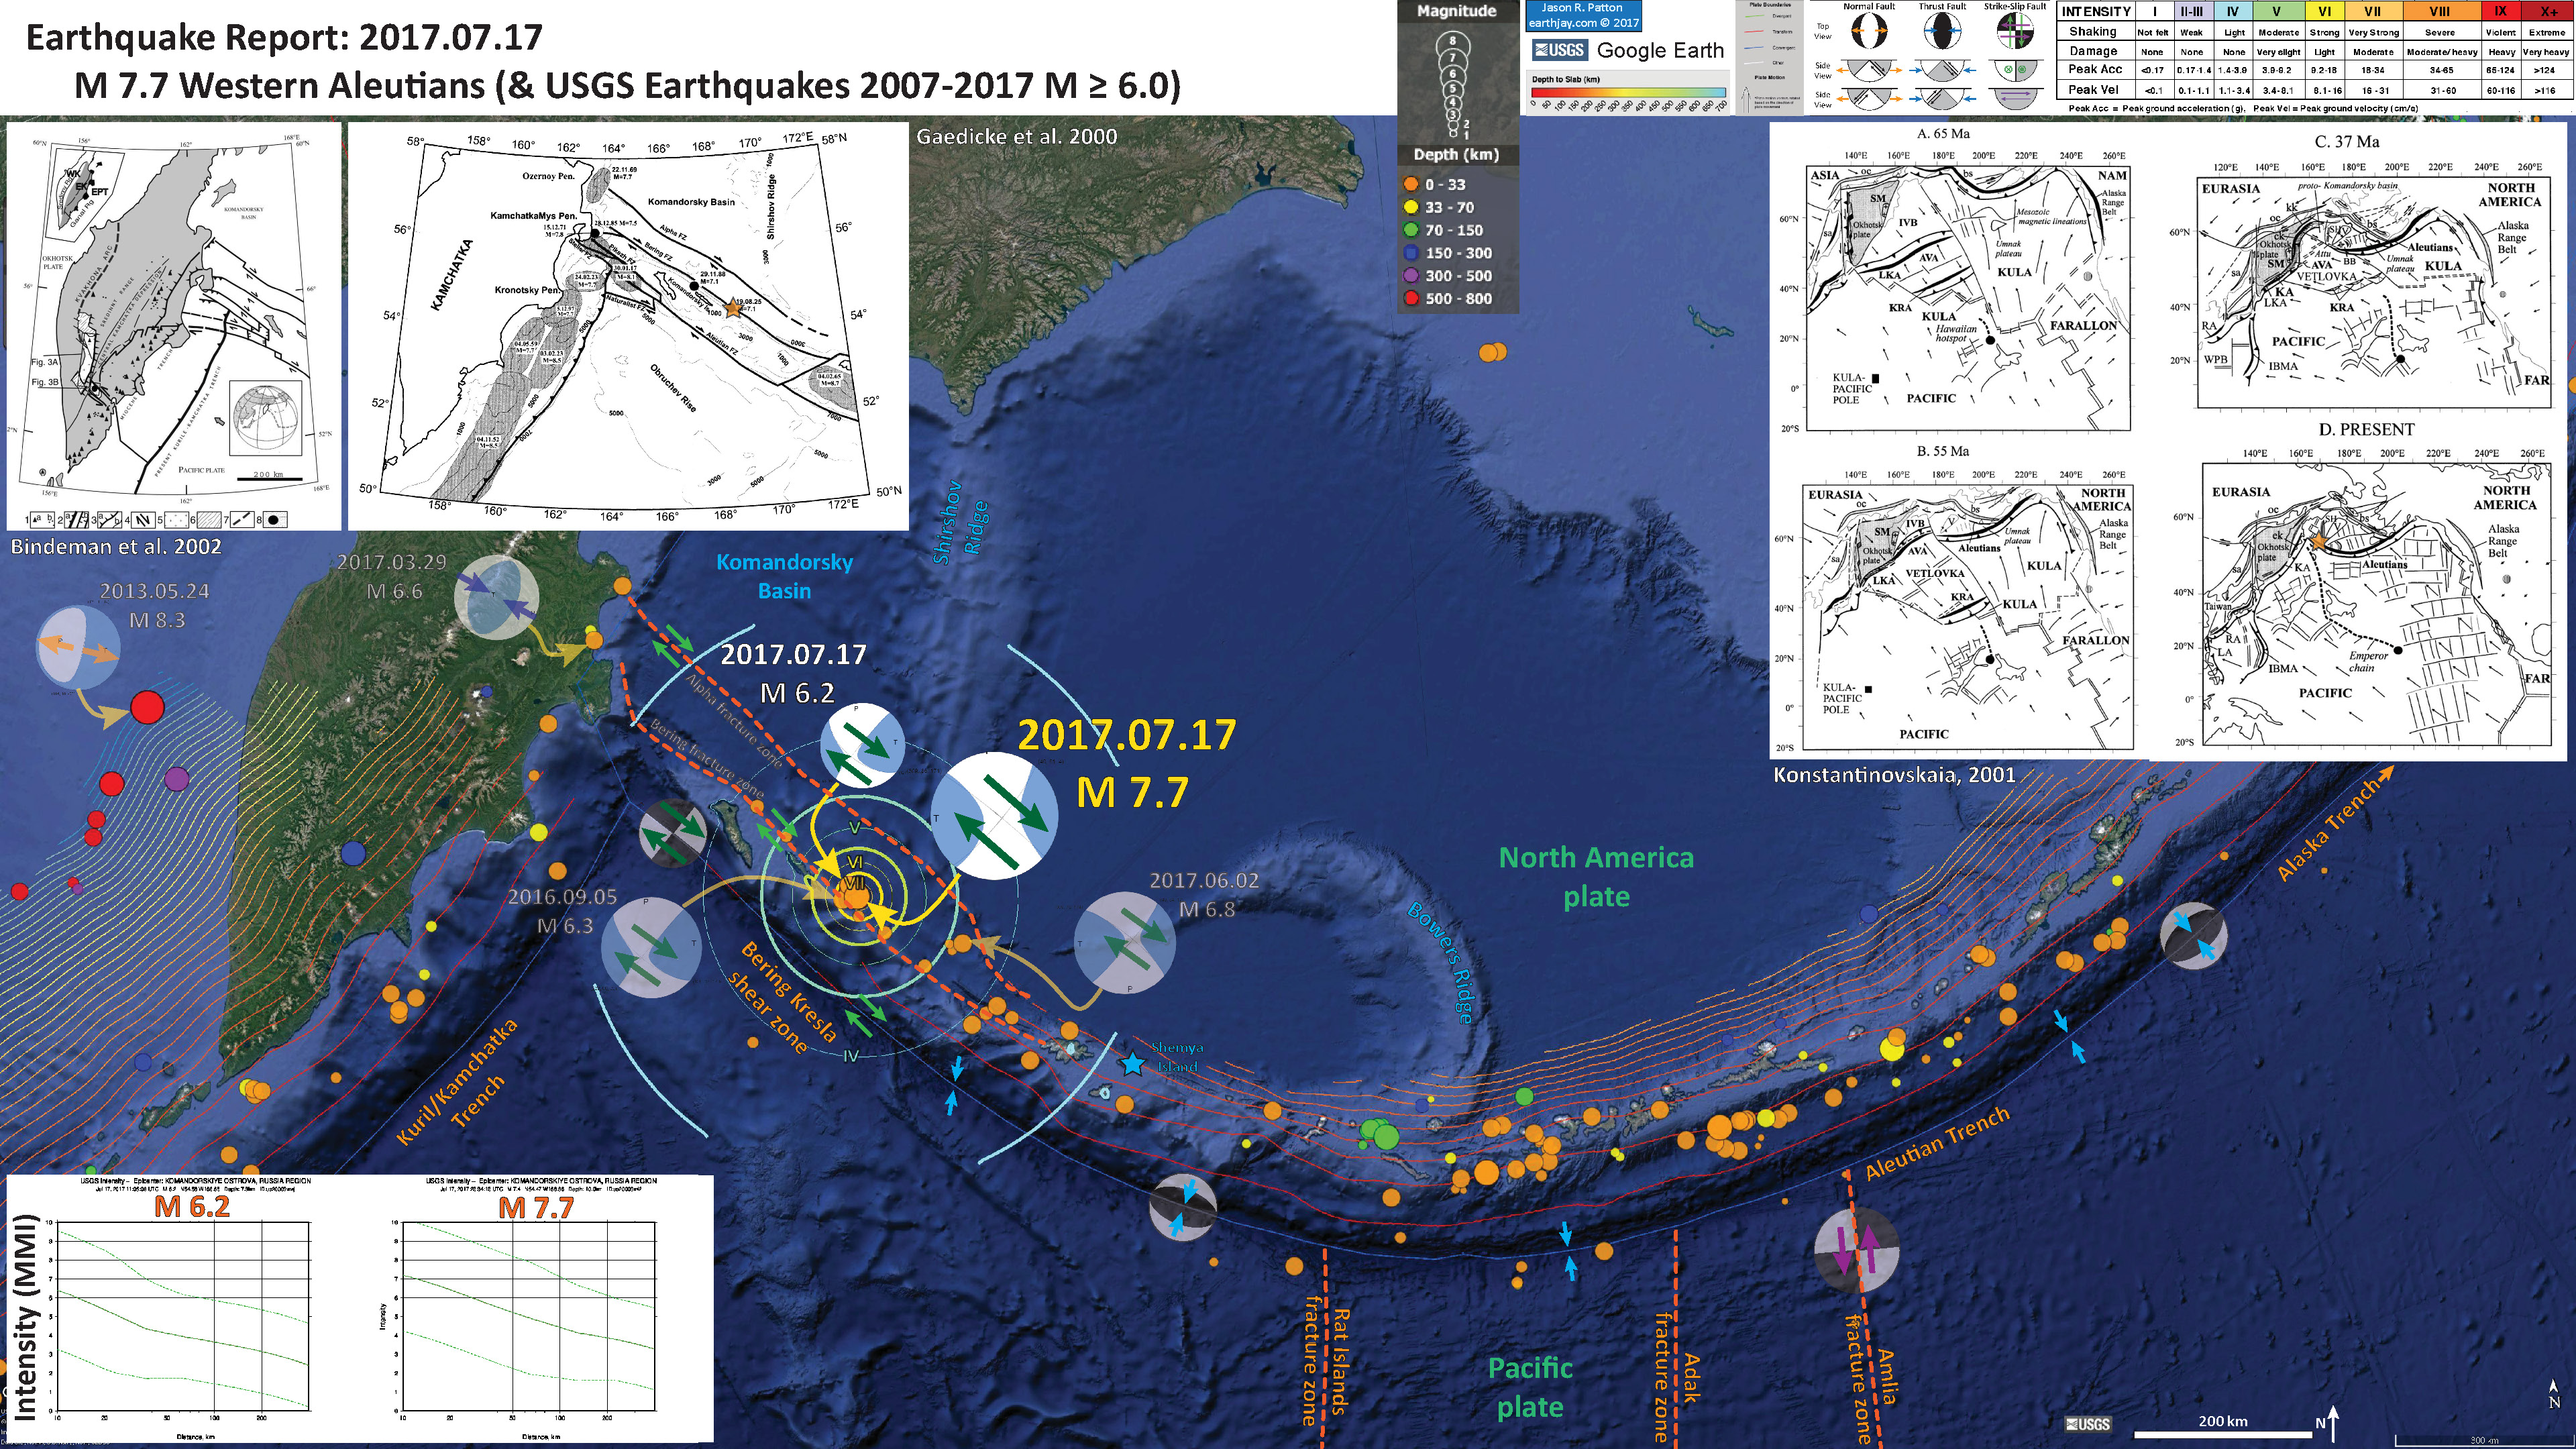
- We just had an earthquake along the western Aleutian Islands, very close to the international date line. In this region places often have more than two names, depending upon who drew the map.
- The majority of the Aleutian Islands are volcanic arc islands formed as a result of the subduction of the Pacific plate beneath the North America plate. To the west, there is another subduction zone along the Kuril and Kamchatka volcanic arcs. These subduction zones form deep sea trenches (the deepest parts of the ocean are in subduction zone trenches). Between these 2 subduction zones is another linear trough, but this does not denote the location of a subduction zone. The plate boundary between the Kamchatka and Aleutian trenches is the Bering Kresla shear zone (BKSZ).
- The oceanic basin, Komandorsky Basin, to the north of the BKSZ has been mapped with northwest trending fracture zones, most of which are fossil or inactive. However, due to the oblique convergence west of Bowers Ridge, some of these fossil fracture zones are being reactivated. Based upon offsets in magnetic anomalies in the oceanic crust forming the basement of Komandorsky Basin, these fracture zones show left-lateral offsets. However, the active strike-slip faults (and BKSZ) are right lateral. This is a great example of strike-slip faults reactivating as strike-slip faults.
- The mainshock was preceded earlier this day with several foreshocks and occurred very close to a M 6.3 earthquake from 9 months ago (2016.09.05). In addition, there was seismic activity to the east about 6 weeks ago (2017.06.02 M 6.8).
- Some place a tear in the downgoing Pacific plate (beneath Kamchatka) in the position of the Bering Kresla Shear zone. This marks the end of the modern Kamchatka subduction zone. However, there was a subduction zone further to the west of the active arc, which extended further to the north and possibly involved subduction of the oceanic crust forming the Komandorsky Basin. The combination of offsets along the right-lateral strike-slip faults to the north of the BKSZ, along with the convergence along the Kamchatka Trench, there is a fold and thrust belt (a zone of compressional tectonics). There was an M 6.6 earthquake earlier this year (2017.03.29), which is somewhat related to this fold and thrust belt.
- There was a tsunami recorded at the tide gage on Shemya Island, with an observed maximum wave height of 0.3 ft! This is interesting given the strike slip earthquake.
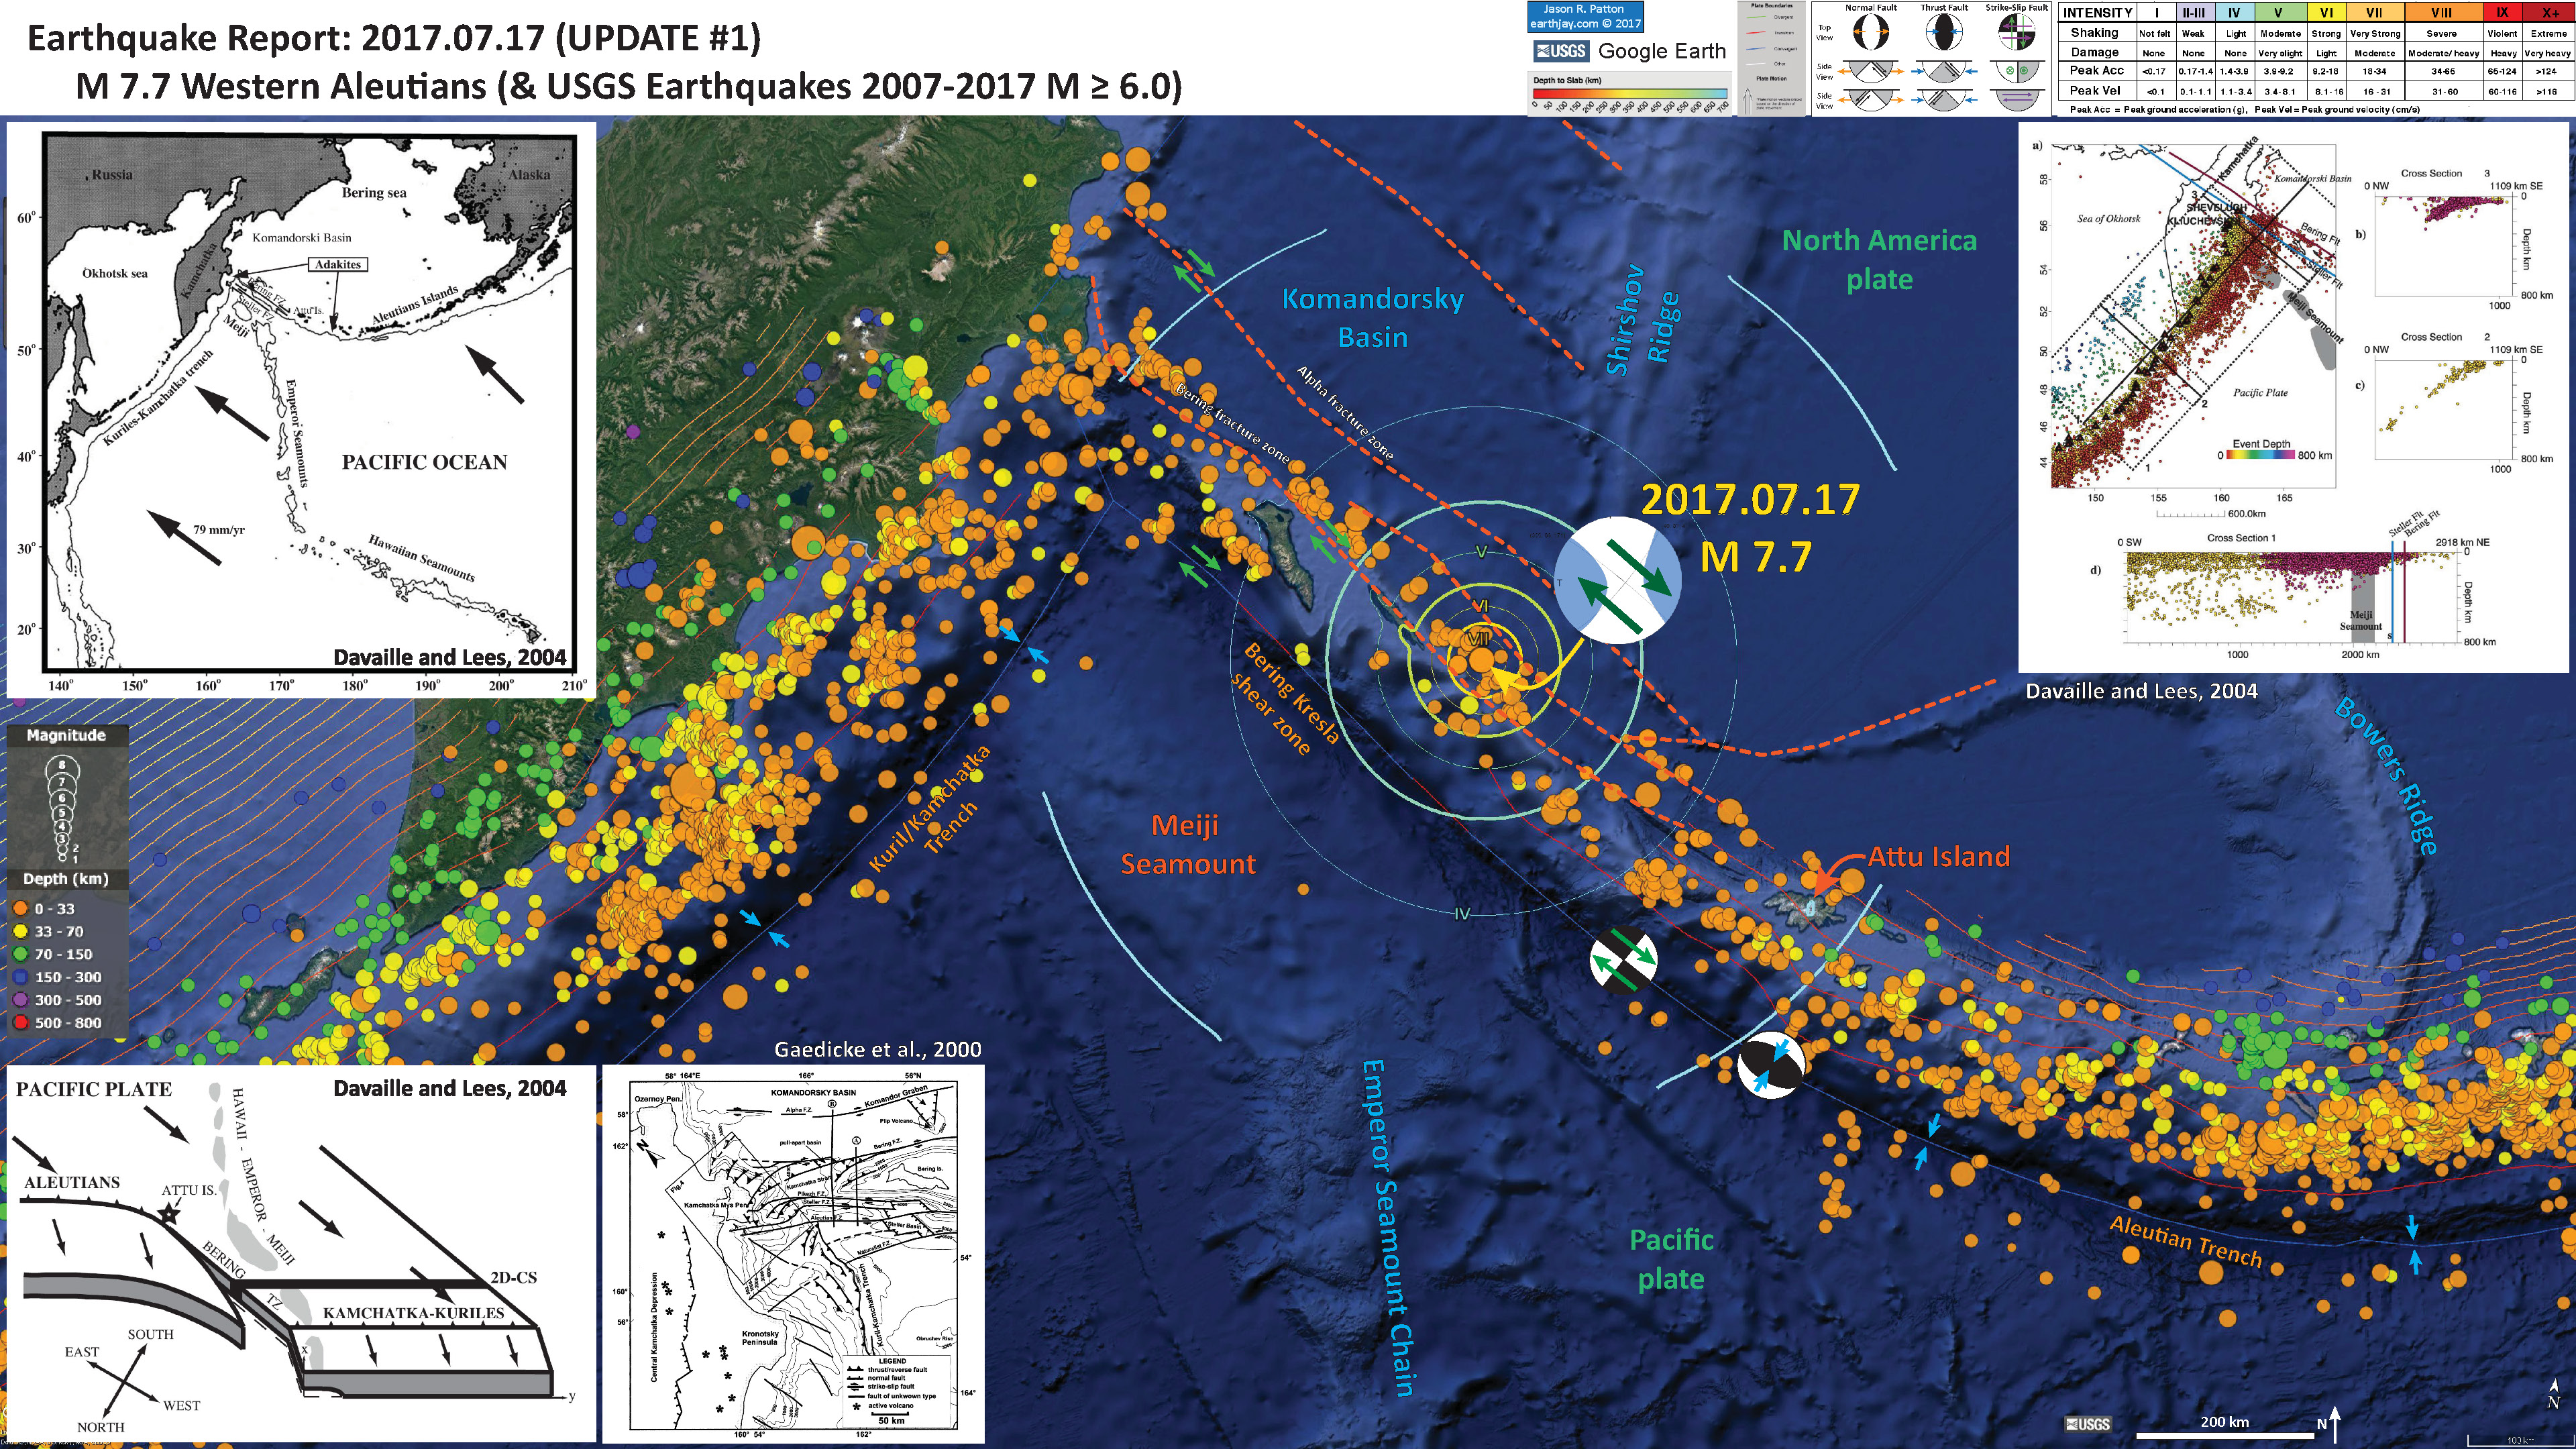
- Well, based upon a comment on twitter, I thought it prudent to review the seismicity of this region at the westernmost part of the western Aleutian Islands. For many years I considered this region part of the subduction zone that forms the Aleutian Trench. In the past couple of years, there have been a number of earthquakes that reveal this to not be the case. Rather, the Pacific-North America plate boundary in this region is in the form of a shear zone, distributed across several reactivated fracture zones. I noticed a plot from Jascha Polet and found another article that evaluates this plate boundary (Davaille and Lees, 2004).
- Here is my interpretive poster for my 2016.03.29 M 6.6 #EarthquakeReport.
2017.07.17 M 7.7 Aleutians
2017.07.17 M 7.7 Aleutians UPDATE #1
UPDATE #1:
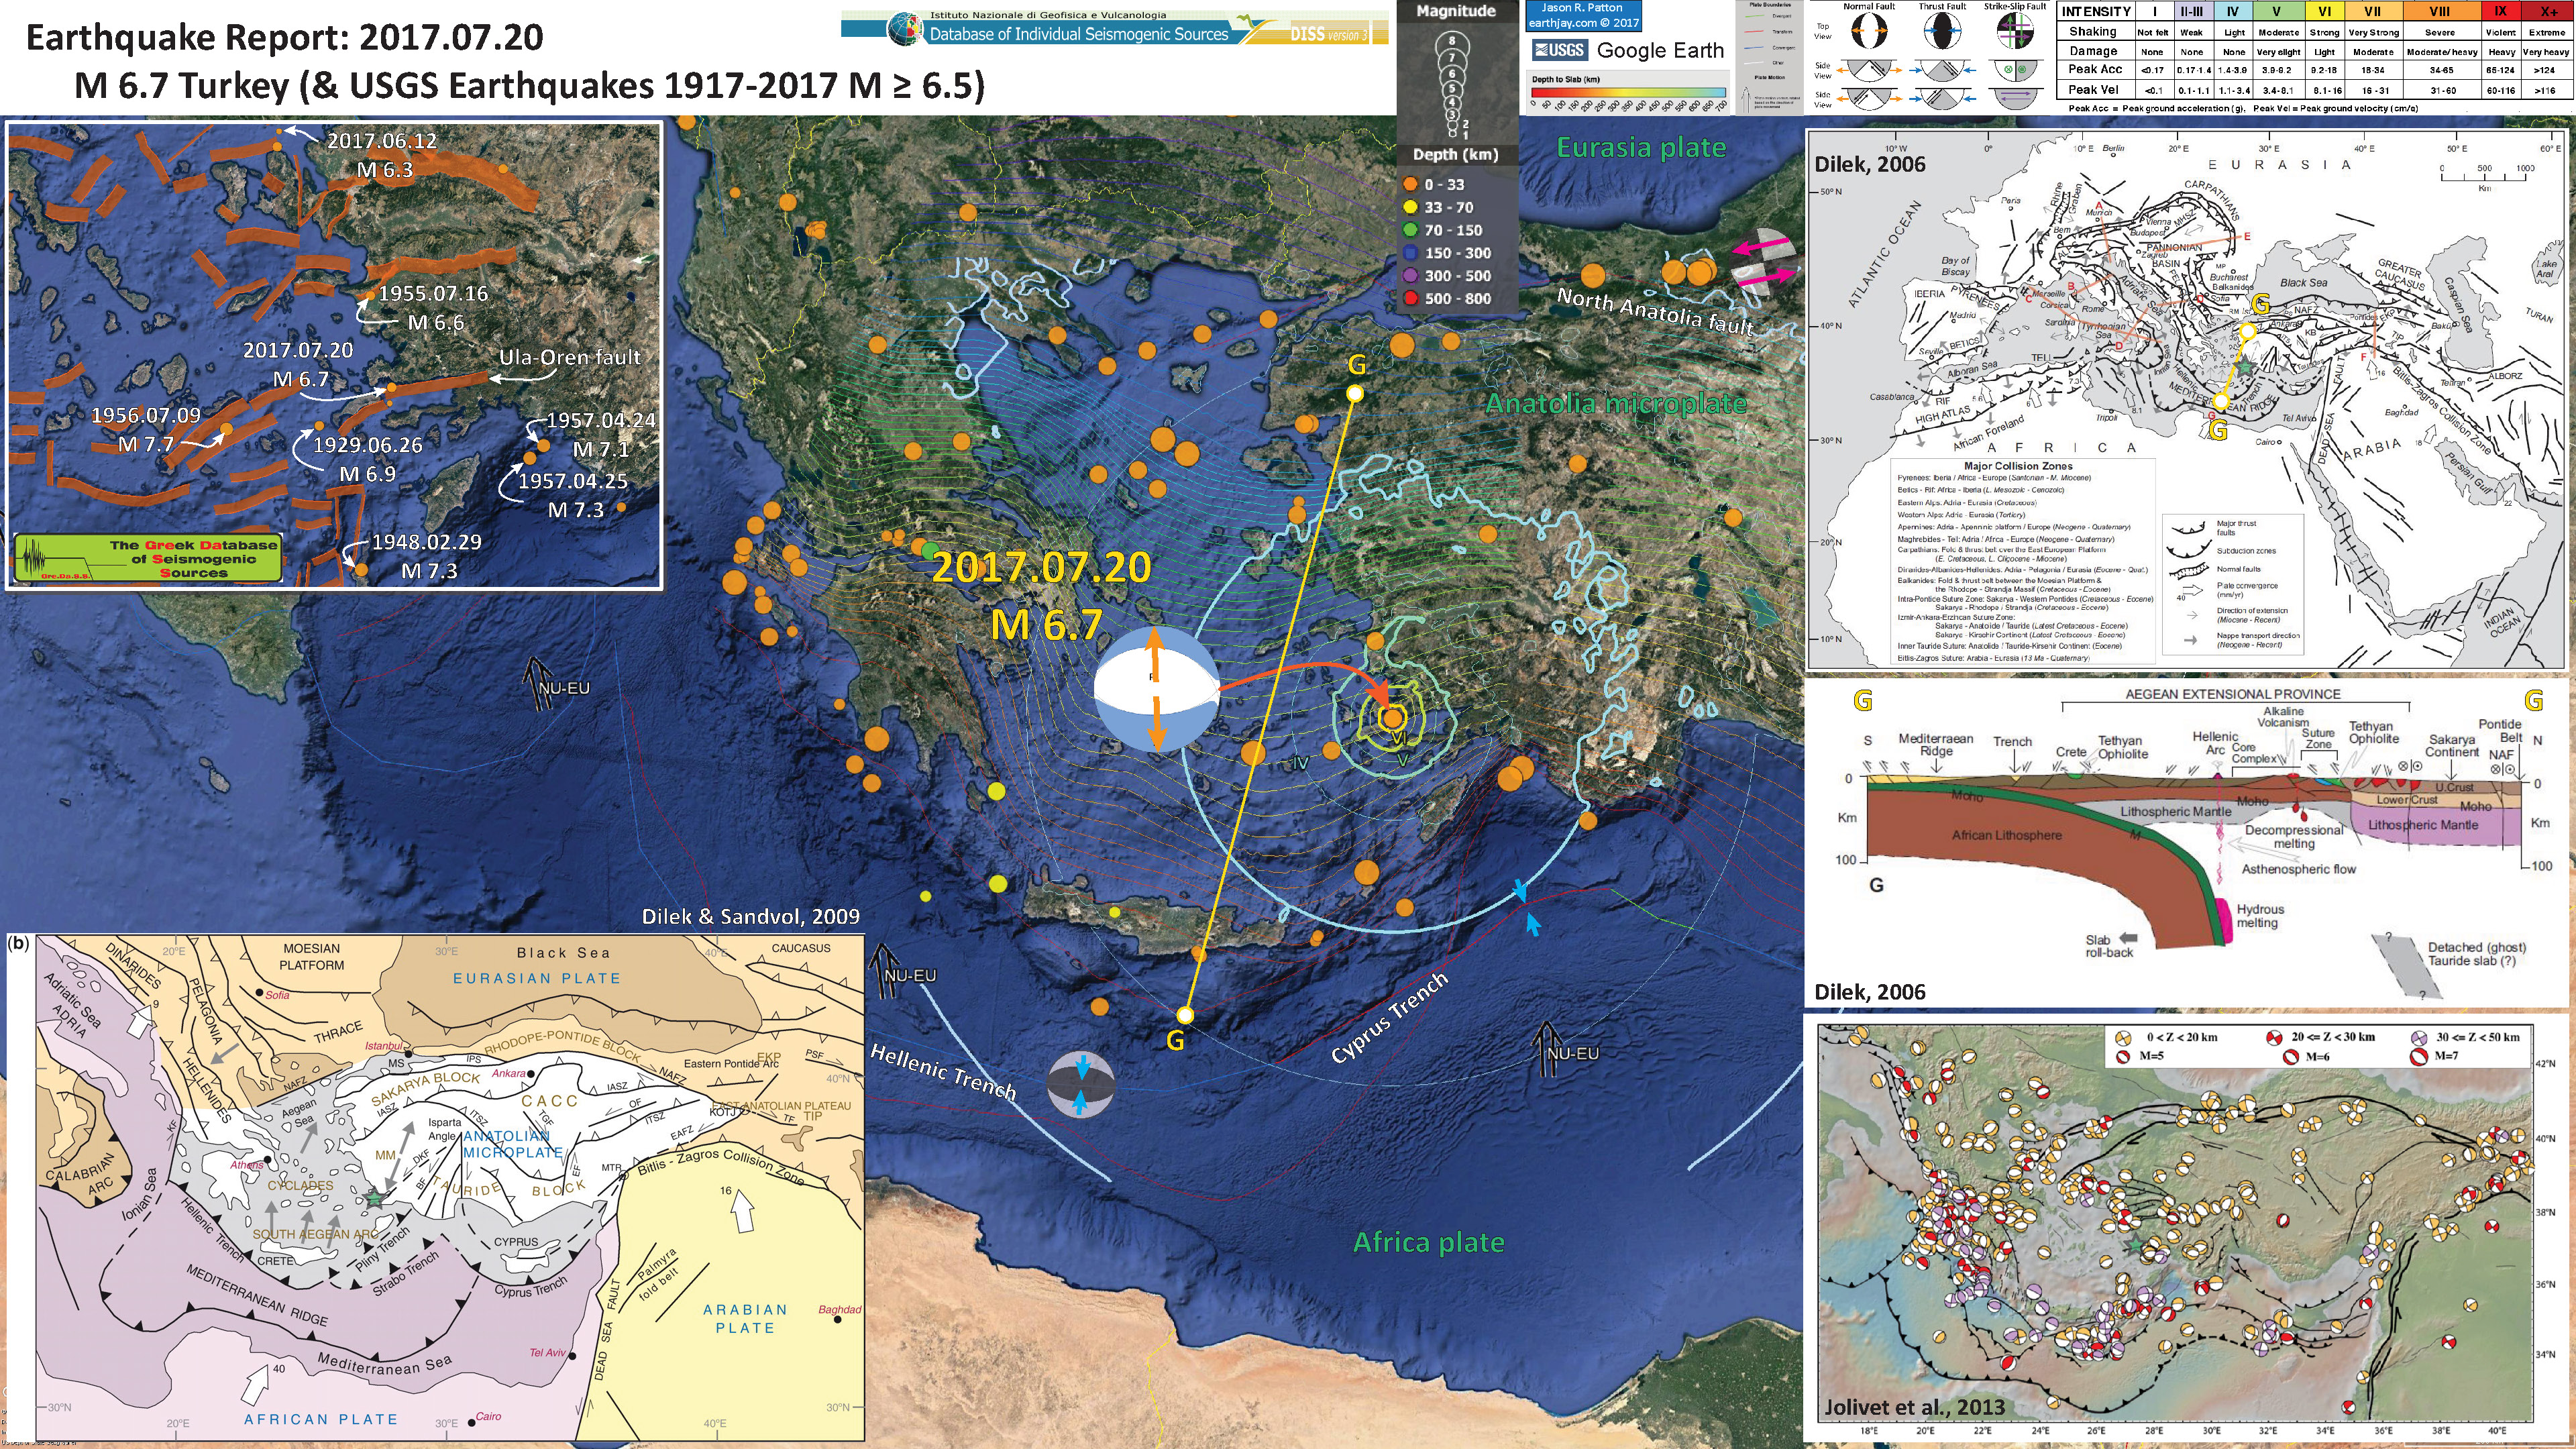
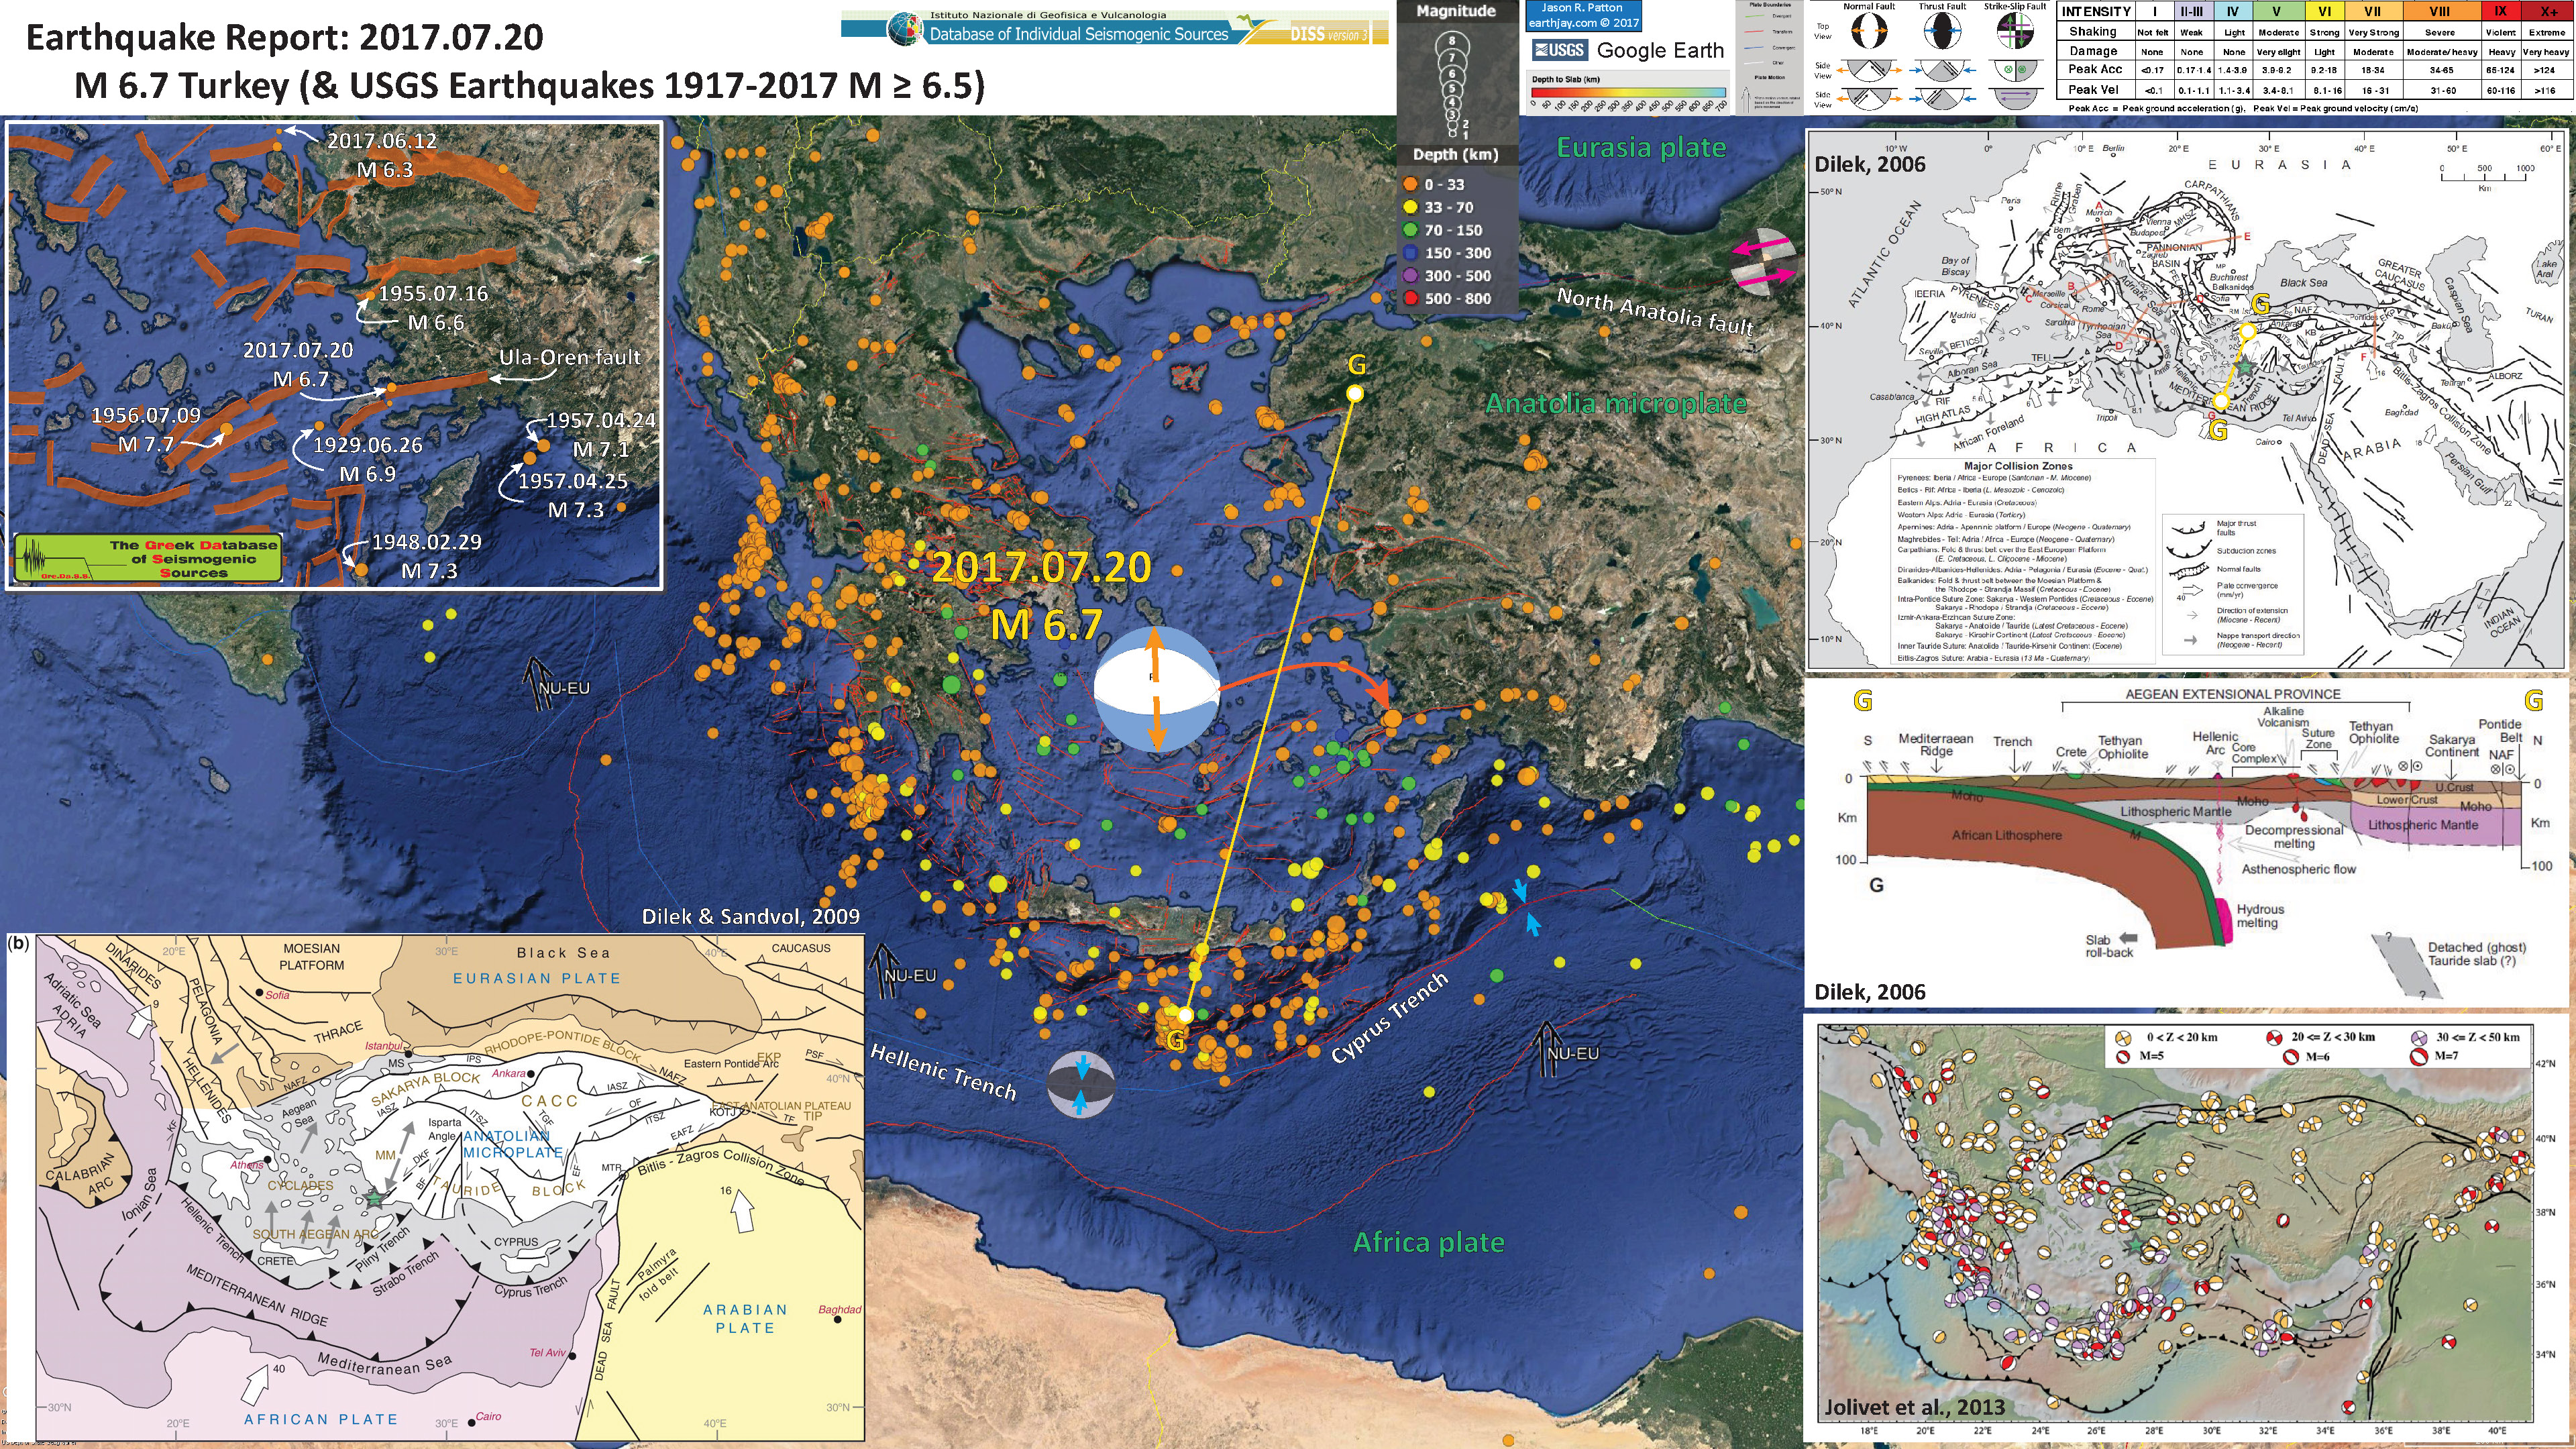
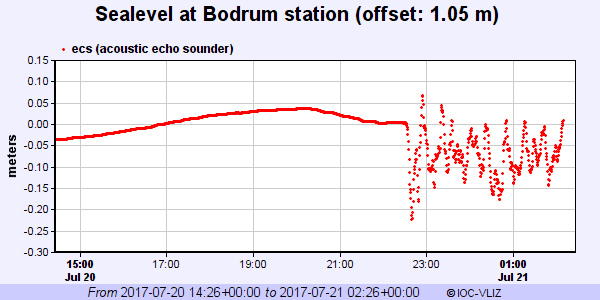
- We just had a good shaker in western Turkey. At the moment, there are over 400 reports of ground shaking to the USGS “Did you Feel It?” web page. The USGS PAGER report estimates that there may be some casualties (though a low number of them), but that the economic loss estimate is higher (35% chance of between 10 and 100 million USD).
- This earthquake appears to have been along a normal fault named either the Bodum fault (NOA; Helenic Seismic Network) or the Ula-Oren fault (GreDASS; Greek Database of Seismogenic Sources). The inset map shows the faults and fault planes from the GreDASS database. A third name for this fault is the Gökova fault (Kurt et al., 1999).
- Here is the USGS website for this earthquake.
- There is lots of information on the European-Mediterranean Seismological Centre (EMSC) page here.
- Here is the same poster, but with USGS earthquake epicenters from 2007-2017 with magnitude M ≥ 4.5.
- There was a small tsunami recorded at the Bodum tide gage. Here is the source.
2017.07.20 M 6.7 Turkey
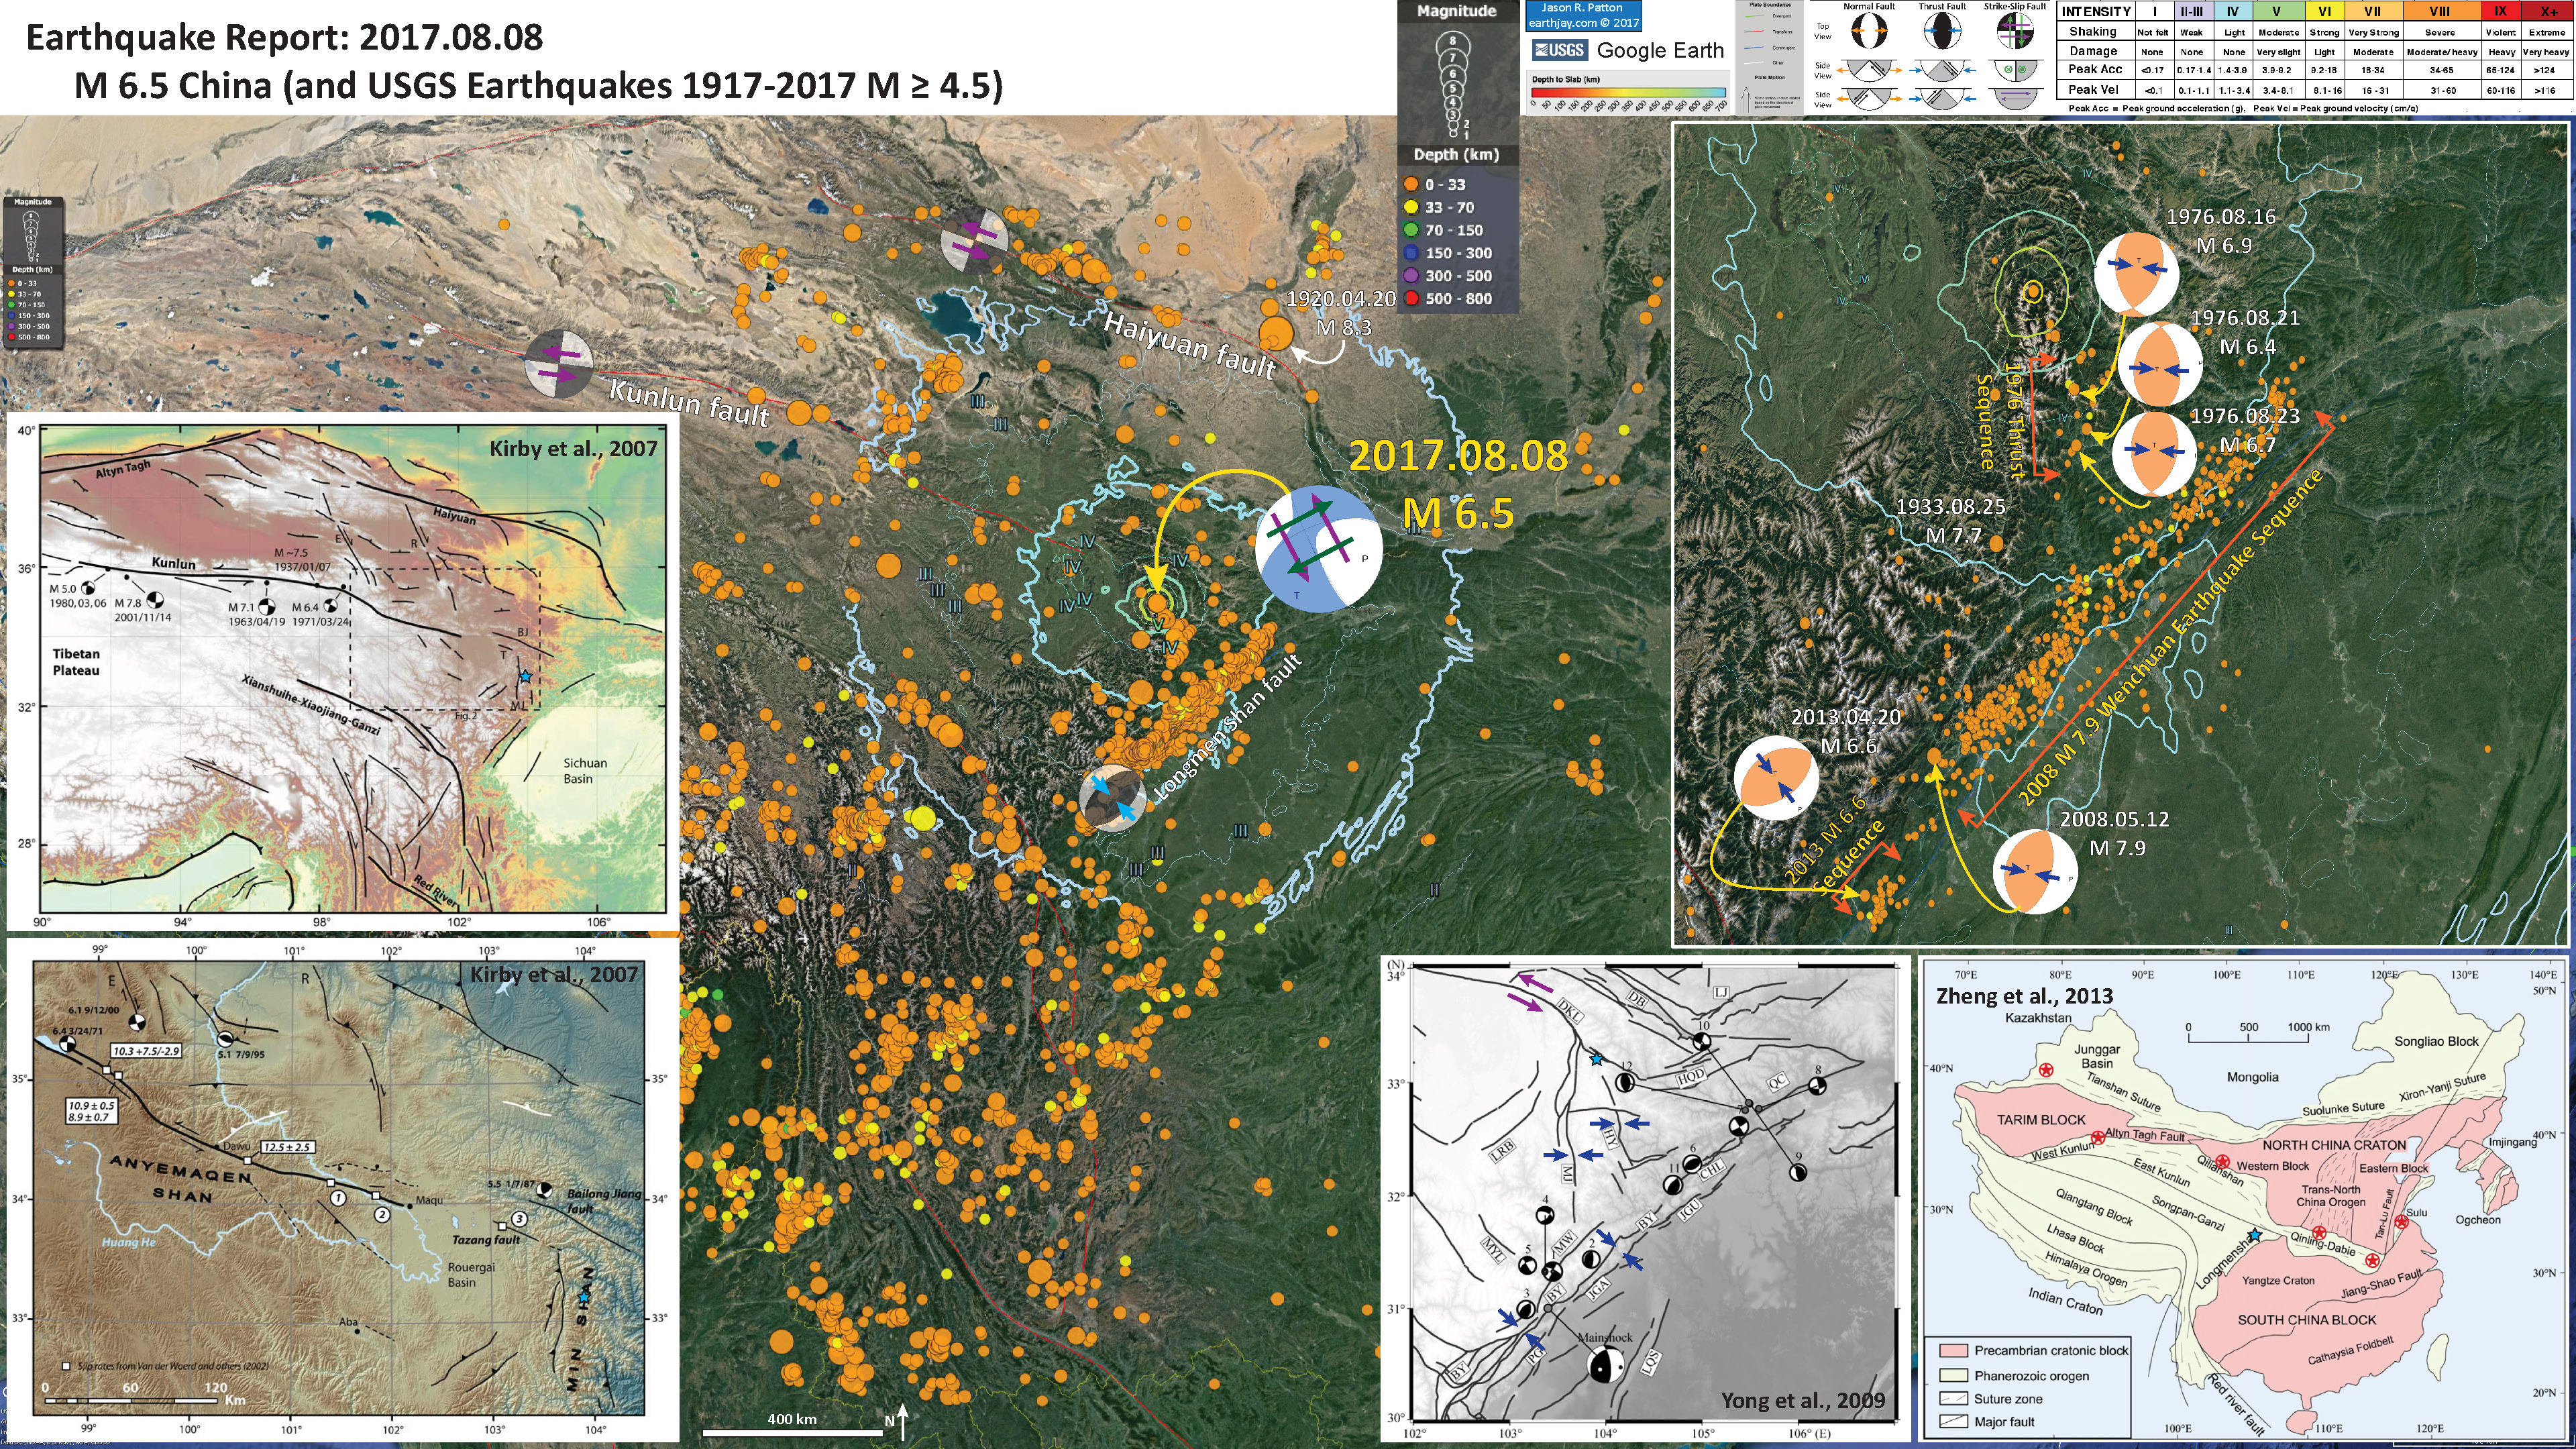
- This morning (my time) there was a shallow earthquake in western China, near a region that was shocked by an M 7.9 earthquake in 2008 (the “Wenchuan Earthquake”).
- Here is the USGS website for this M 6.5 earthquake.
2017.08.08 M 6.5 China
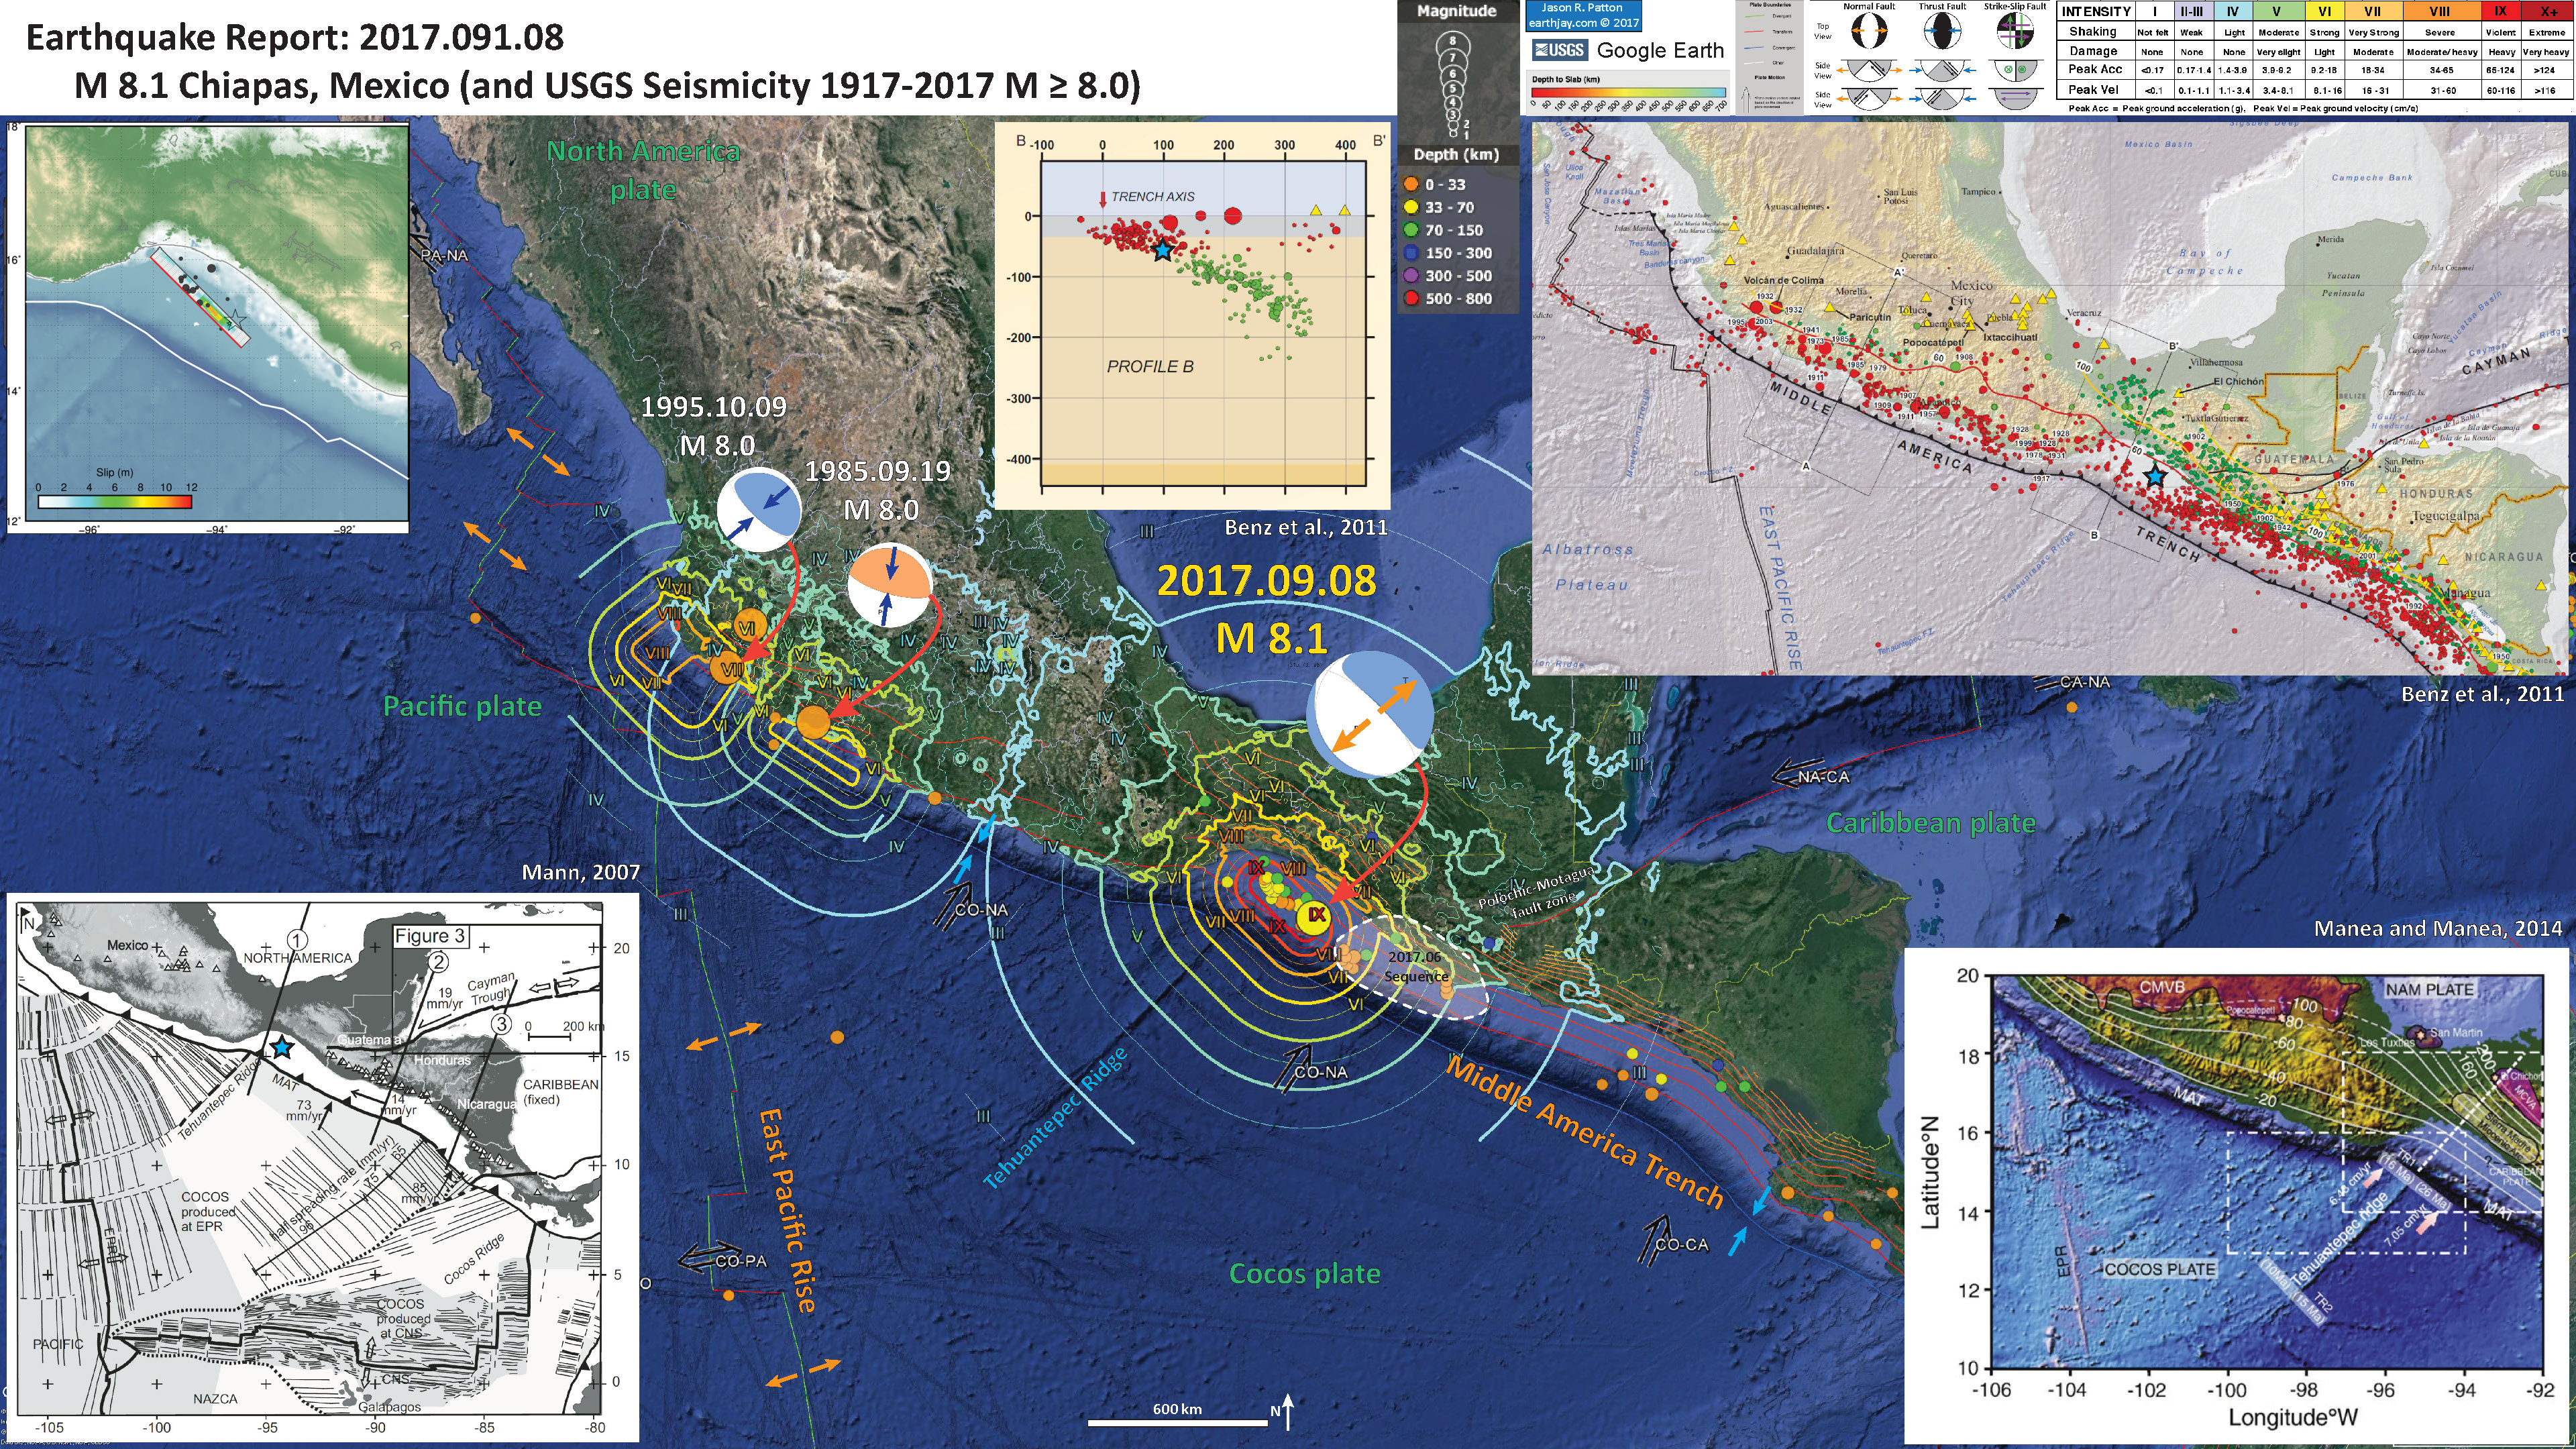
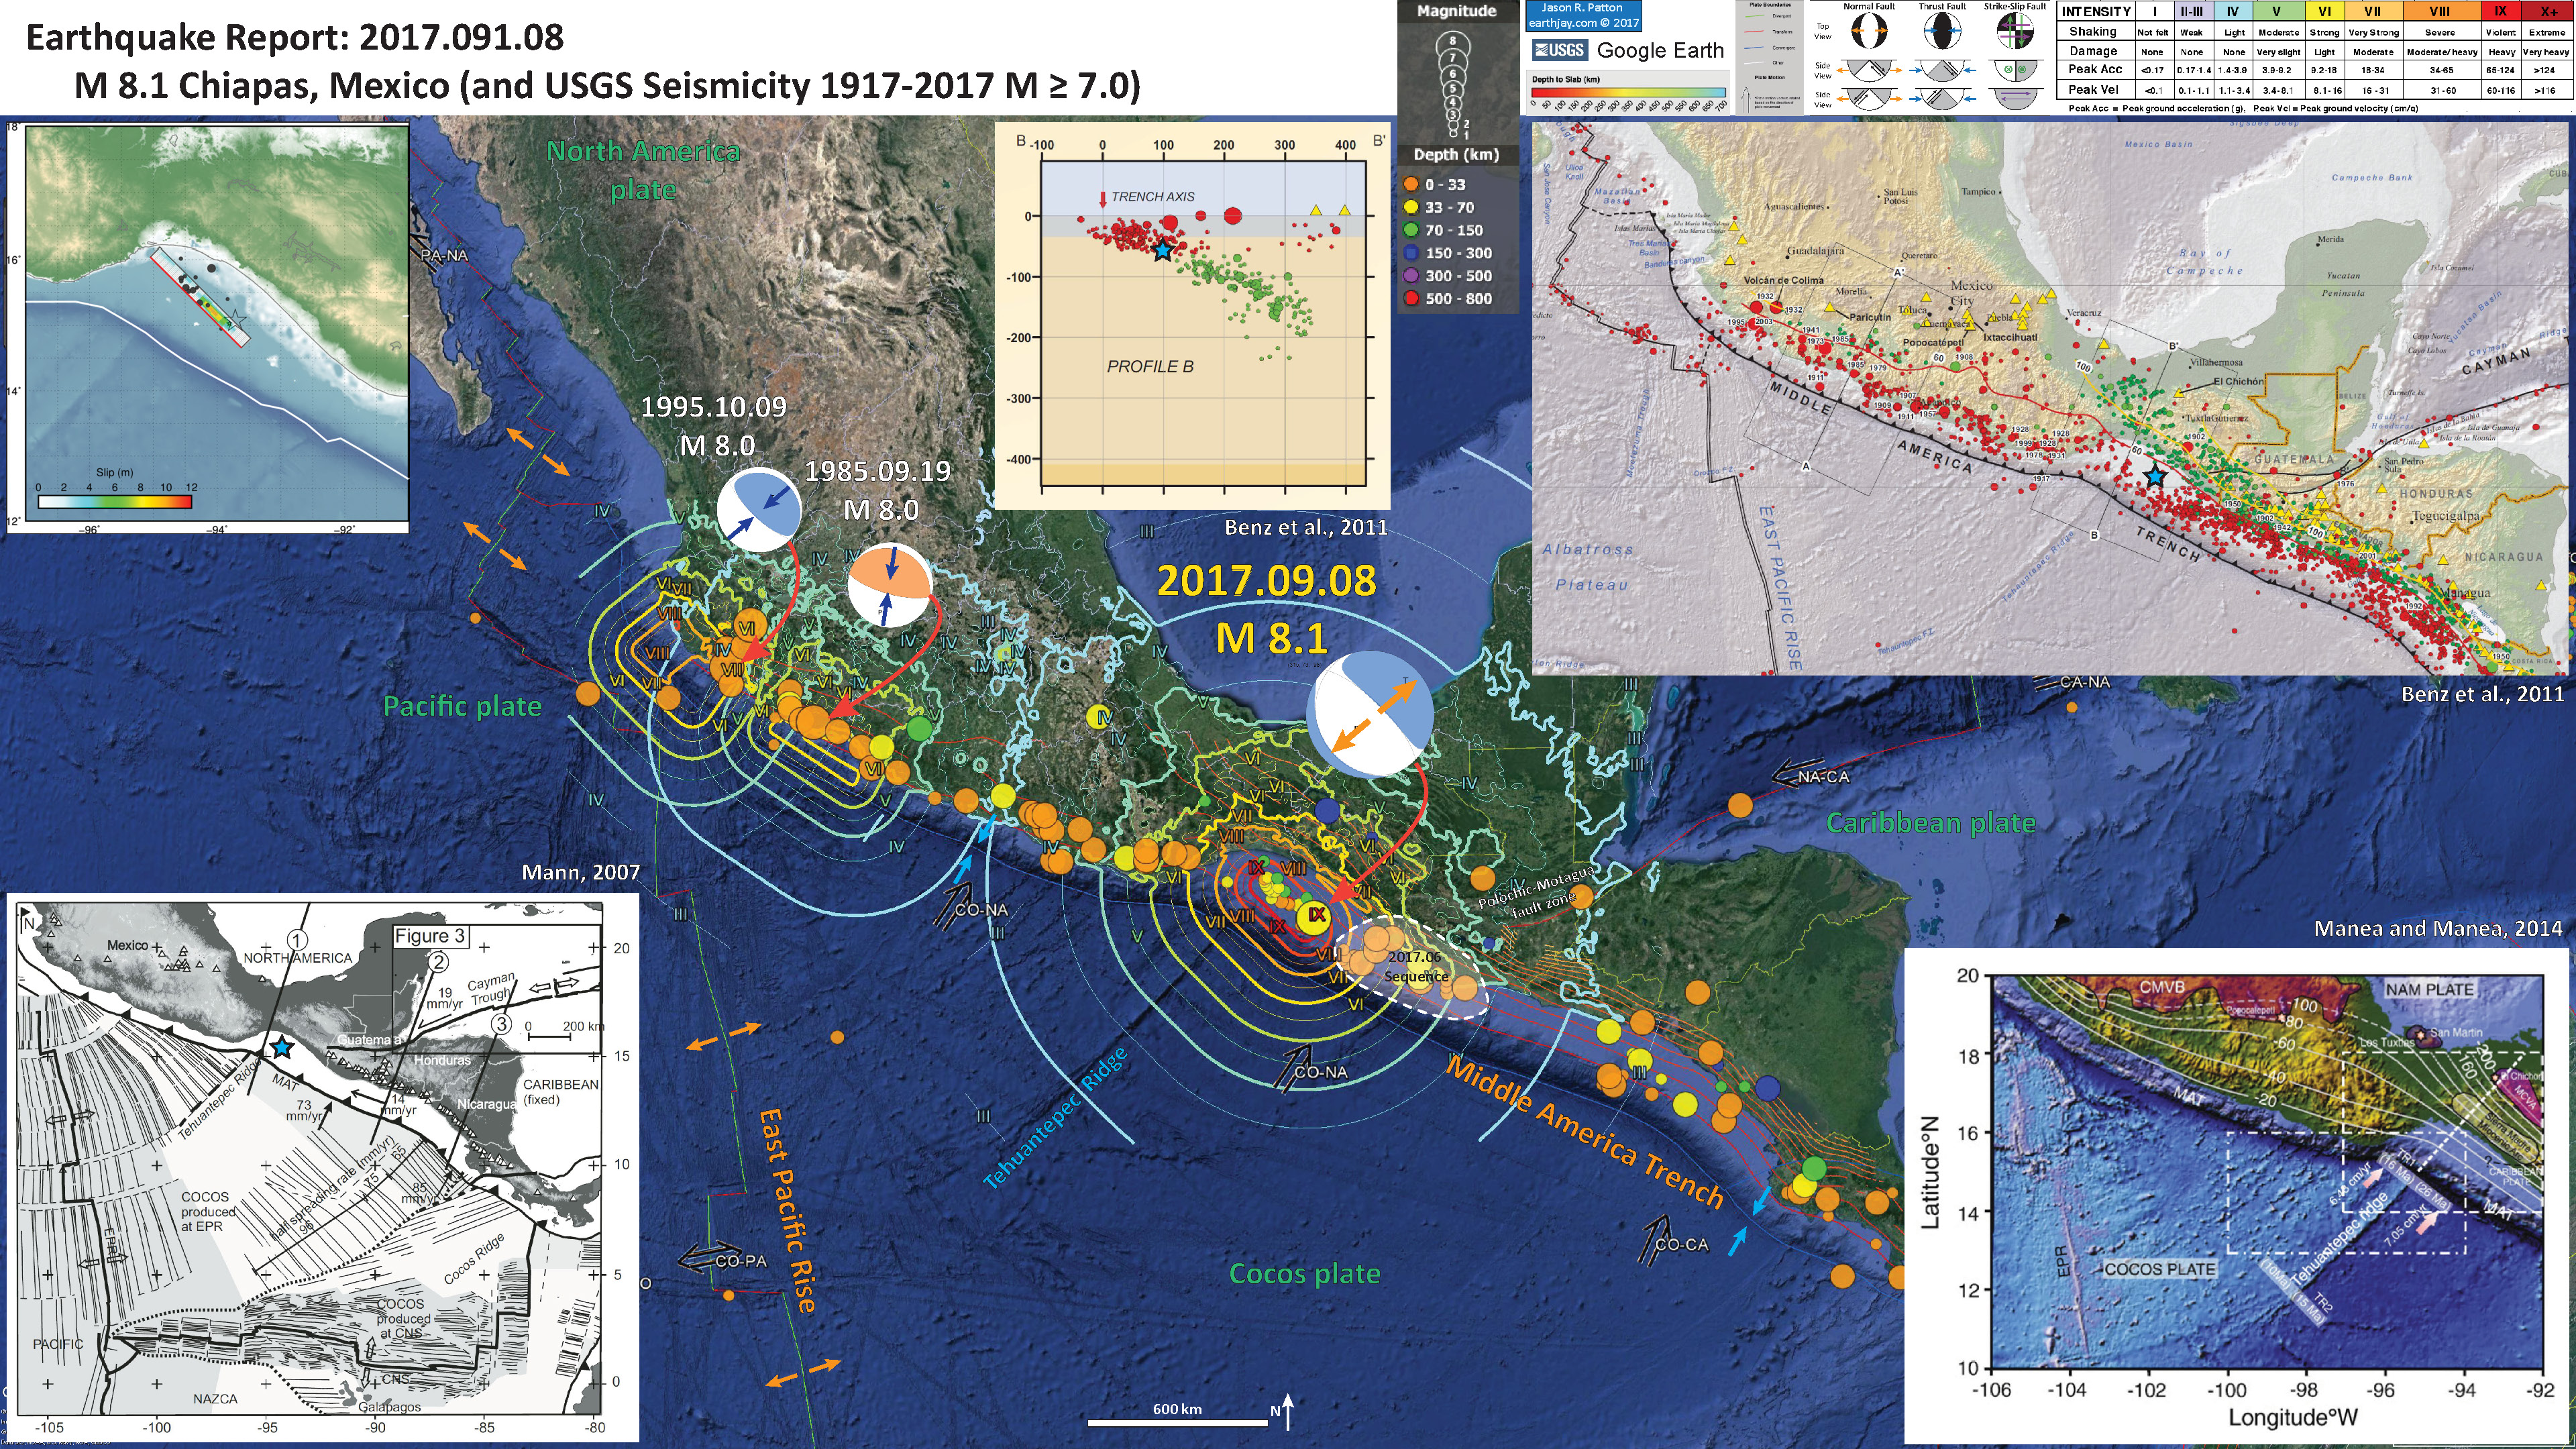
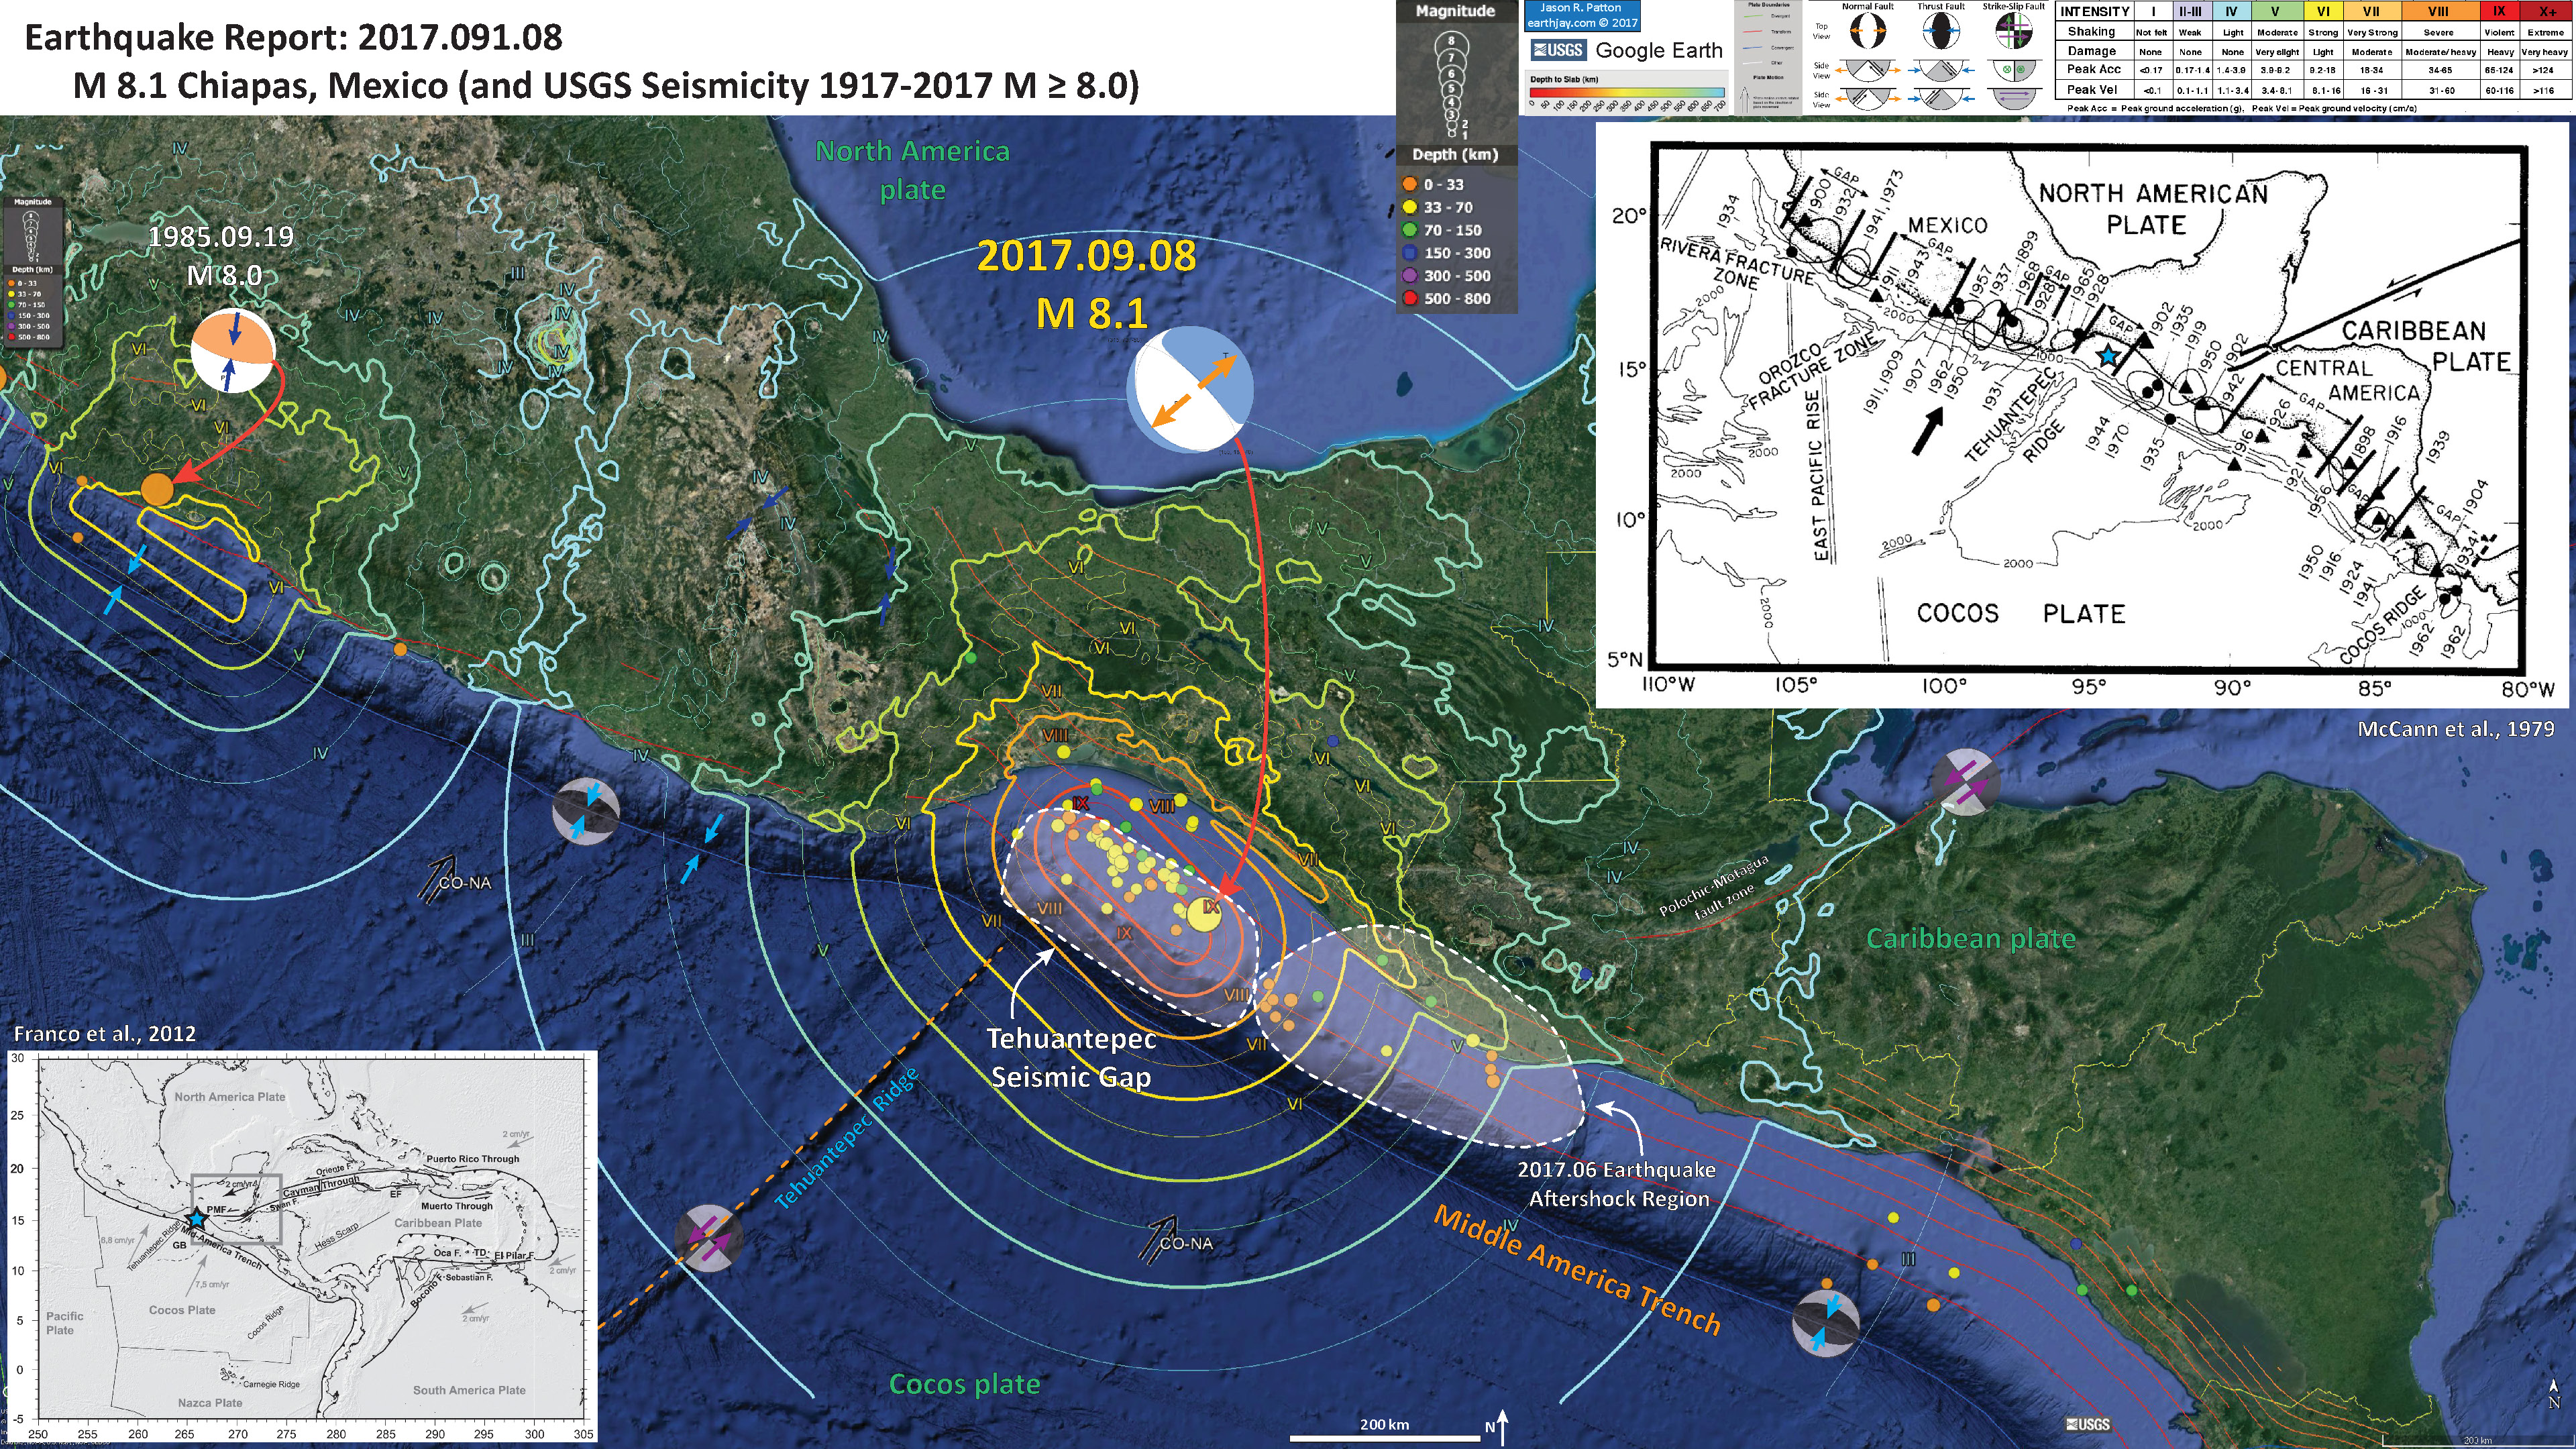
- While I was spending time with my friend Steve Tillinghast (he is getting married on Saturday), there was a Great Earthquake offshore of Chiapas, Mexico. This is one of four M 8 or greater earthquakes ever recorded along the subduction zone forming the Middle American Trench. There has recently been some seismic activity to the east of this current M 8.1 earthquake. These earthquakes happened near the boundary between the North America (NAP) and Caribbean (CP) upper plates.
- This M 8.1 earthquake happened in a region of the subduction zone that is interpreted to have a higher coupling ratio than further to the south (higher proportion of the plate convergence rate is accumulated as elastic strain due to seismogenic coupling of the megathrust fault). Faults that are aseismic (fully slipping) have a coupling ratio of zero. The Polochic-Motagua fault zone marks this NAP-CP boundary. The recent seismicity offshore of Guatemala (June 2017) comprised a series of thrust earthquakes along the upper megathrust, along with some down-dip extensional faulting.
- Tonight’s earthquake will be a very damaging and deadly earthquake and, based upon the shake map, possibly more damaging than either the 1985 or 1995 earthquakes. The 1985 earthquake caused severe damage in Mexico City. The PAGER alert shows an estimate of 34% probability for between 1000 and 10,000 fatalities. However, please read below about the PAGER alert and go to the USGS website about PAGER alerts (link below). These are just model based estimates of damage, so we won’t really know the damage until this is evaluated with “boots on the ground.” One might consider PAGER alerts to be the “armchair estimate” of damage. Thanks to Dr. Lori Dengler for reviewing my report (though any mistakes are only to be credited to me).
- This M 8.1 earthquake is deeper than the megathrust fault and has an extensional moment tensor. This is not a megathrust earthquake, but is related to slip on a fault in the downgoing Cocos plate. At this depth, it may be due to bending in the downgoing oceanic lithosphere.
- There is no danger of a tsunami here along the west coast of the U.S. West Coast, British Colombia, or Alaska. There have been some tsunami observations/
- Here is the same poster, but shows seismicity with earthquakes of smaller magnitudes (M 7).
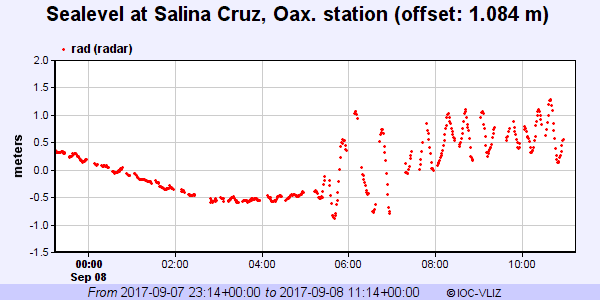
- Below is the record from the most proximal tide gage to the earthquake in Salina Cruz, Oaxaca, Mexico.
- Well, after about 4 hours sleep, my business partner woke me up to talk about the fire alarms we were installing in a rental (#safetyfirst). Now that I have had some breakfast, I here provide some additional observations that people have made since I prepared my initial report.
- Below I present some figures about the Tehuantepec Seismic Gap (as before, but with additional figures). The impetus for this is two fold: (1) it is interesting for earthquake geologists as they consider earthquake recurrence patterns, globally and (2) that the M 8.1 earthquake was not a subduction zone earthquake and may have loaded the megathrust.
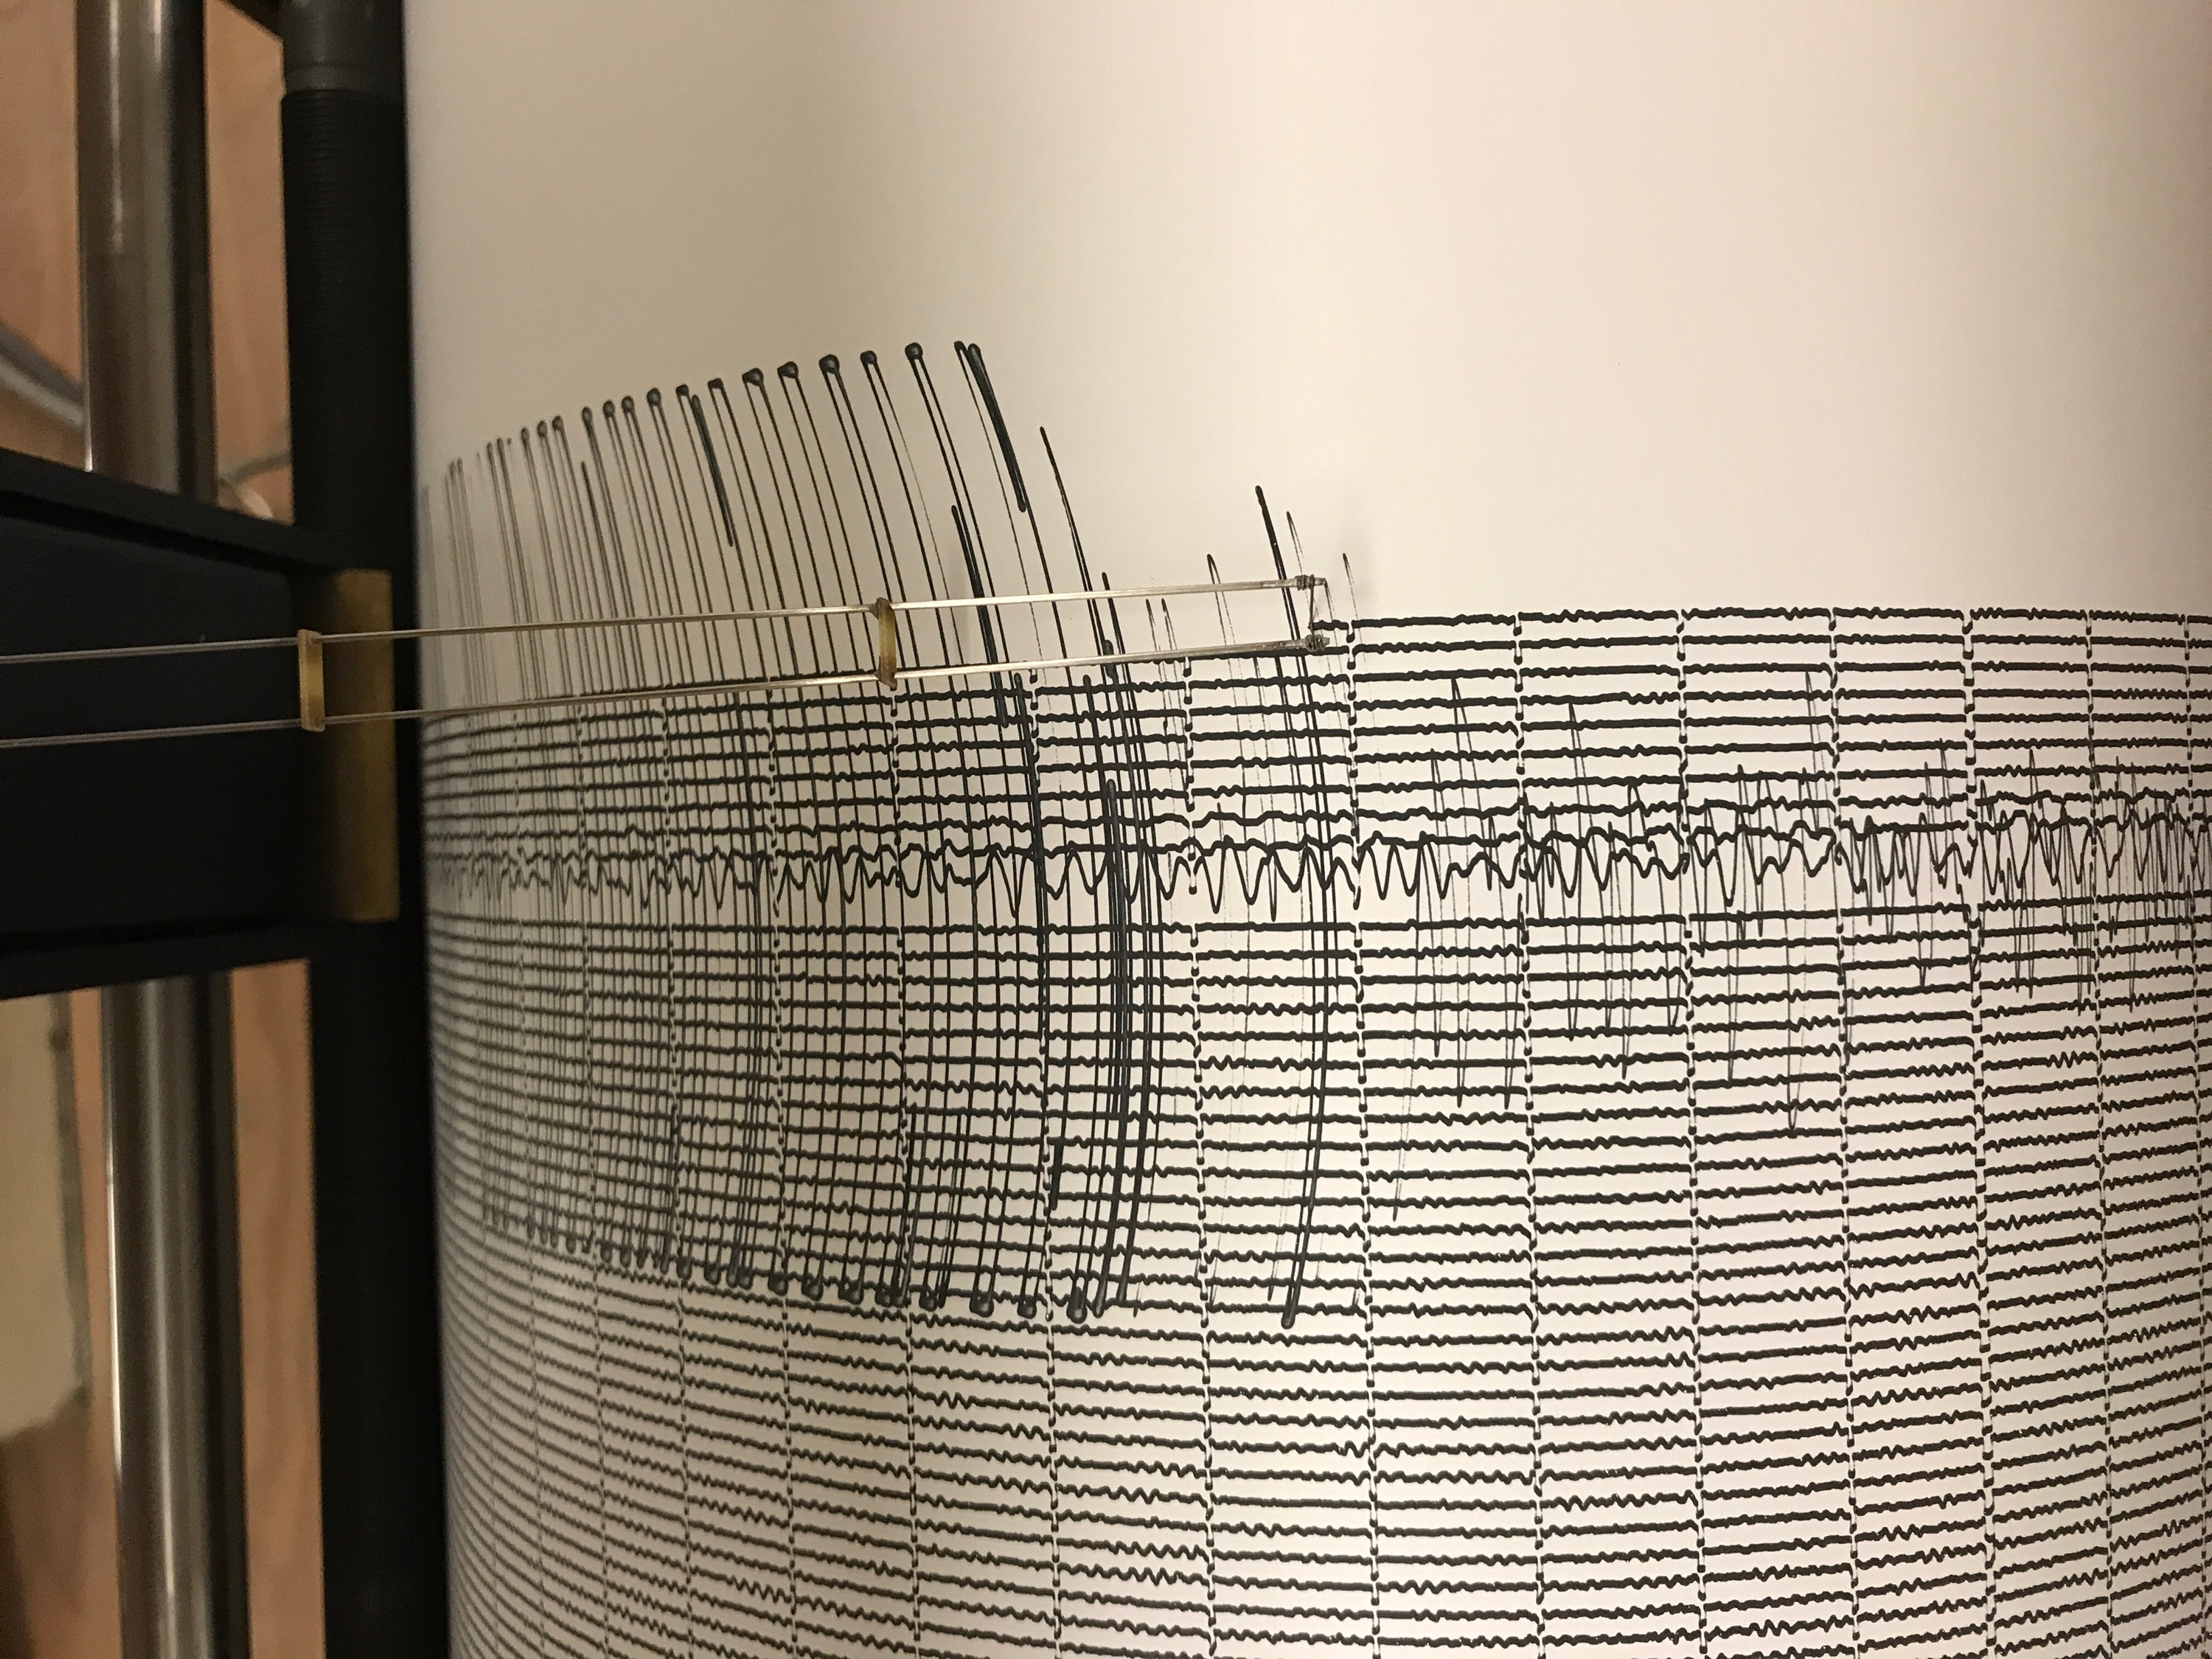
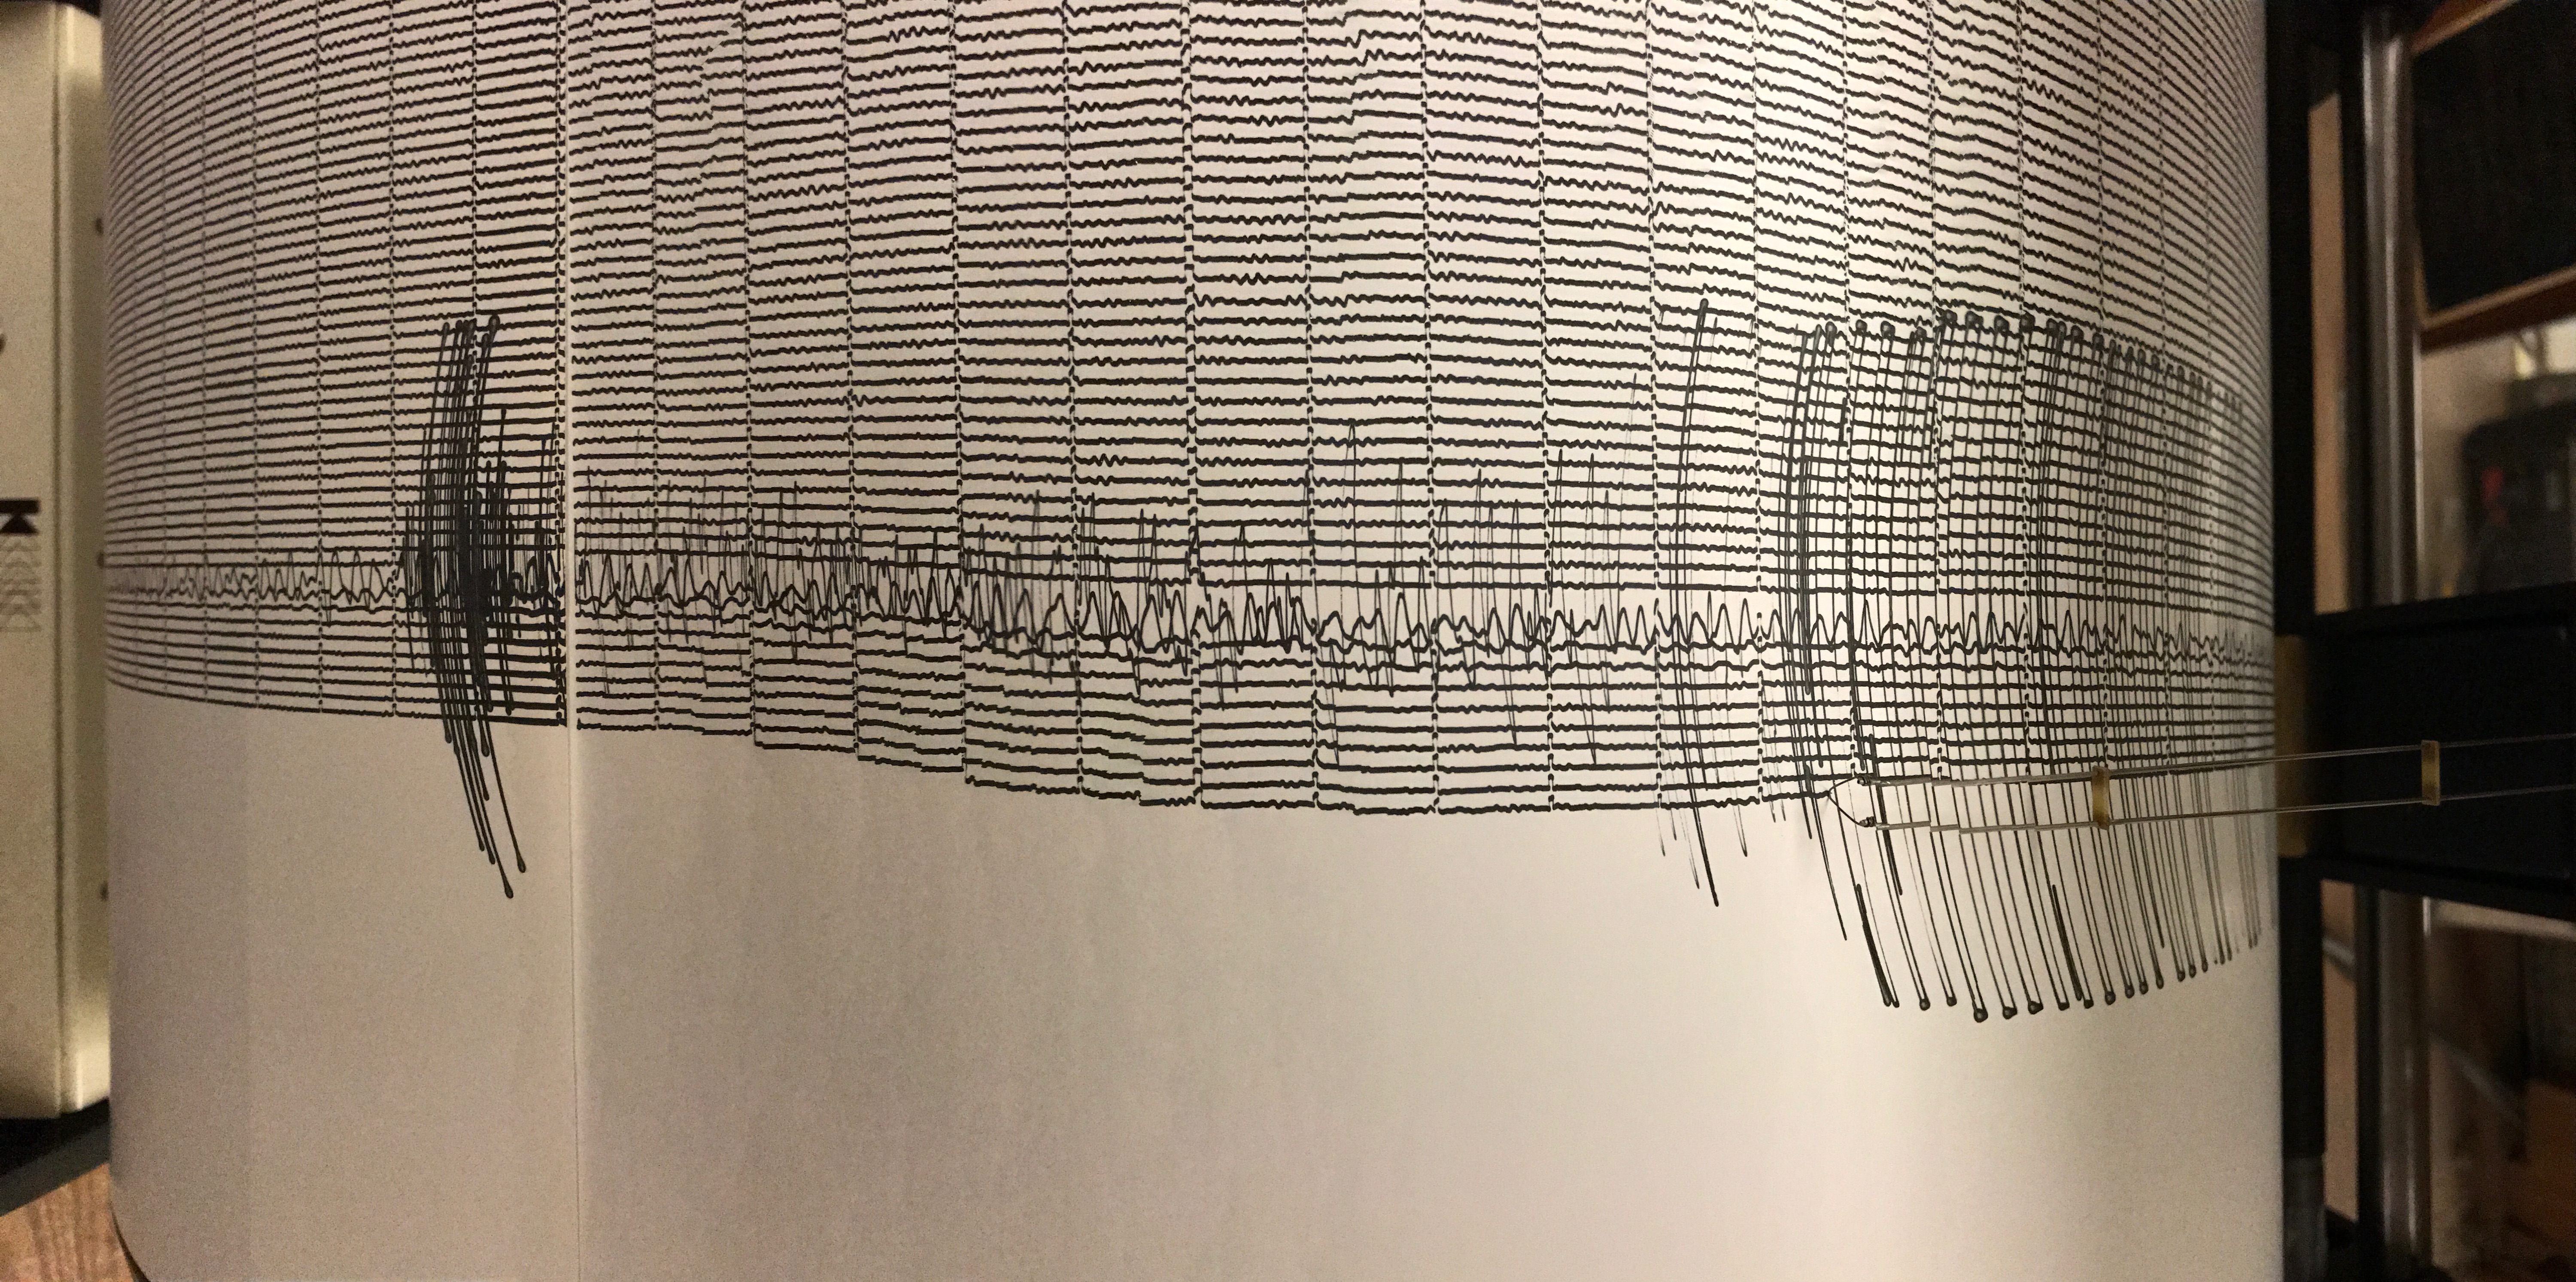
- Here are two views of the earthquake as recorded on Humboldt State University Department of Geology’s Baby Benioff seismometer. The photos are from Dr. Lori Dengler and were taken in the hallway in Van Matre Hall. Click on the image for a high res version (2 and 5 MB files).
- Here is an updated list of observations of the trans-Pacific tsunami.
- This is an update of the tide gage record at Salina Cruz in Oahaca, Mexico. It has been 15 hours and the tsunami waves are still significant (not as large amplitude as the initial few waves, but still potentially dangerous).
- Well, we had a really interesting earthquake today. There was a M 6.1 earthquake in the North America plate (NAP) to the north of the sequence offshore of Chiapas, with the M 8.1 mainshock. Here is the USGS website for the M 6.1 earthquake. There was also an M 5.8 earthquake that was a more typical aftershock (USGS website).
2017.09.08 M 8.1 Chiapas, Mexico
2017.09.08 M 8.1 Chiapas, Mexico Update #1
2017.09.23 M 8.1 Chiapas, Mexico Update #2
UPDATE #1:


UPDATE #2:

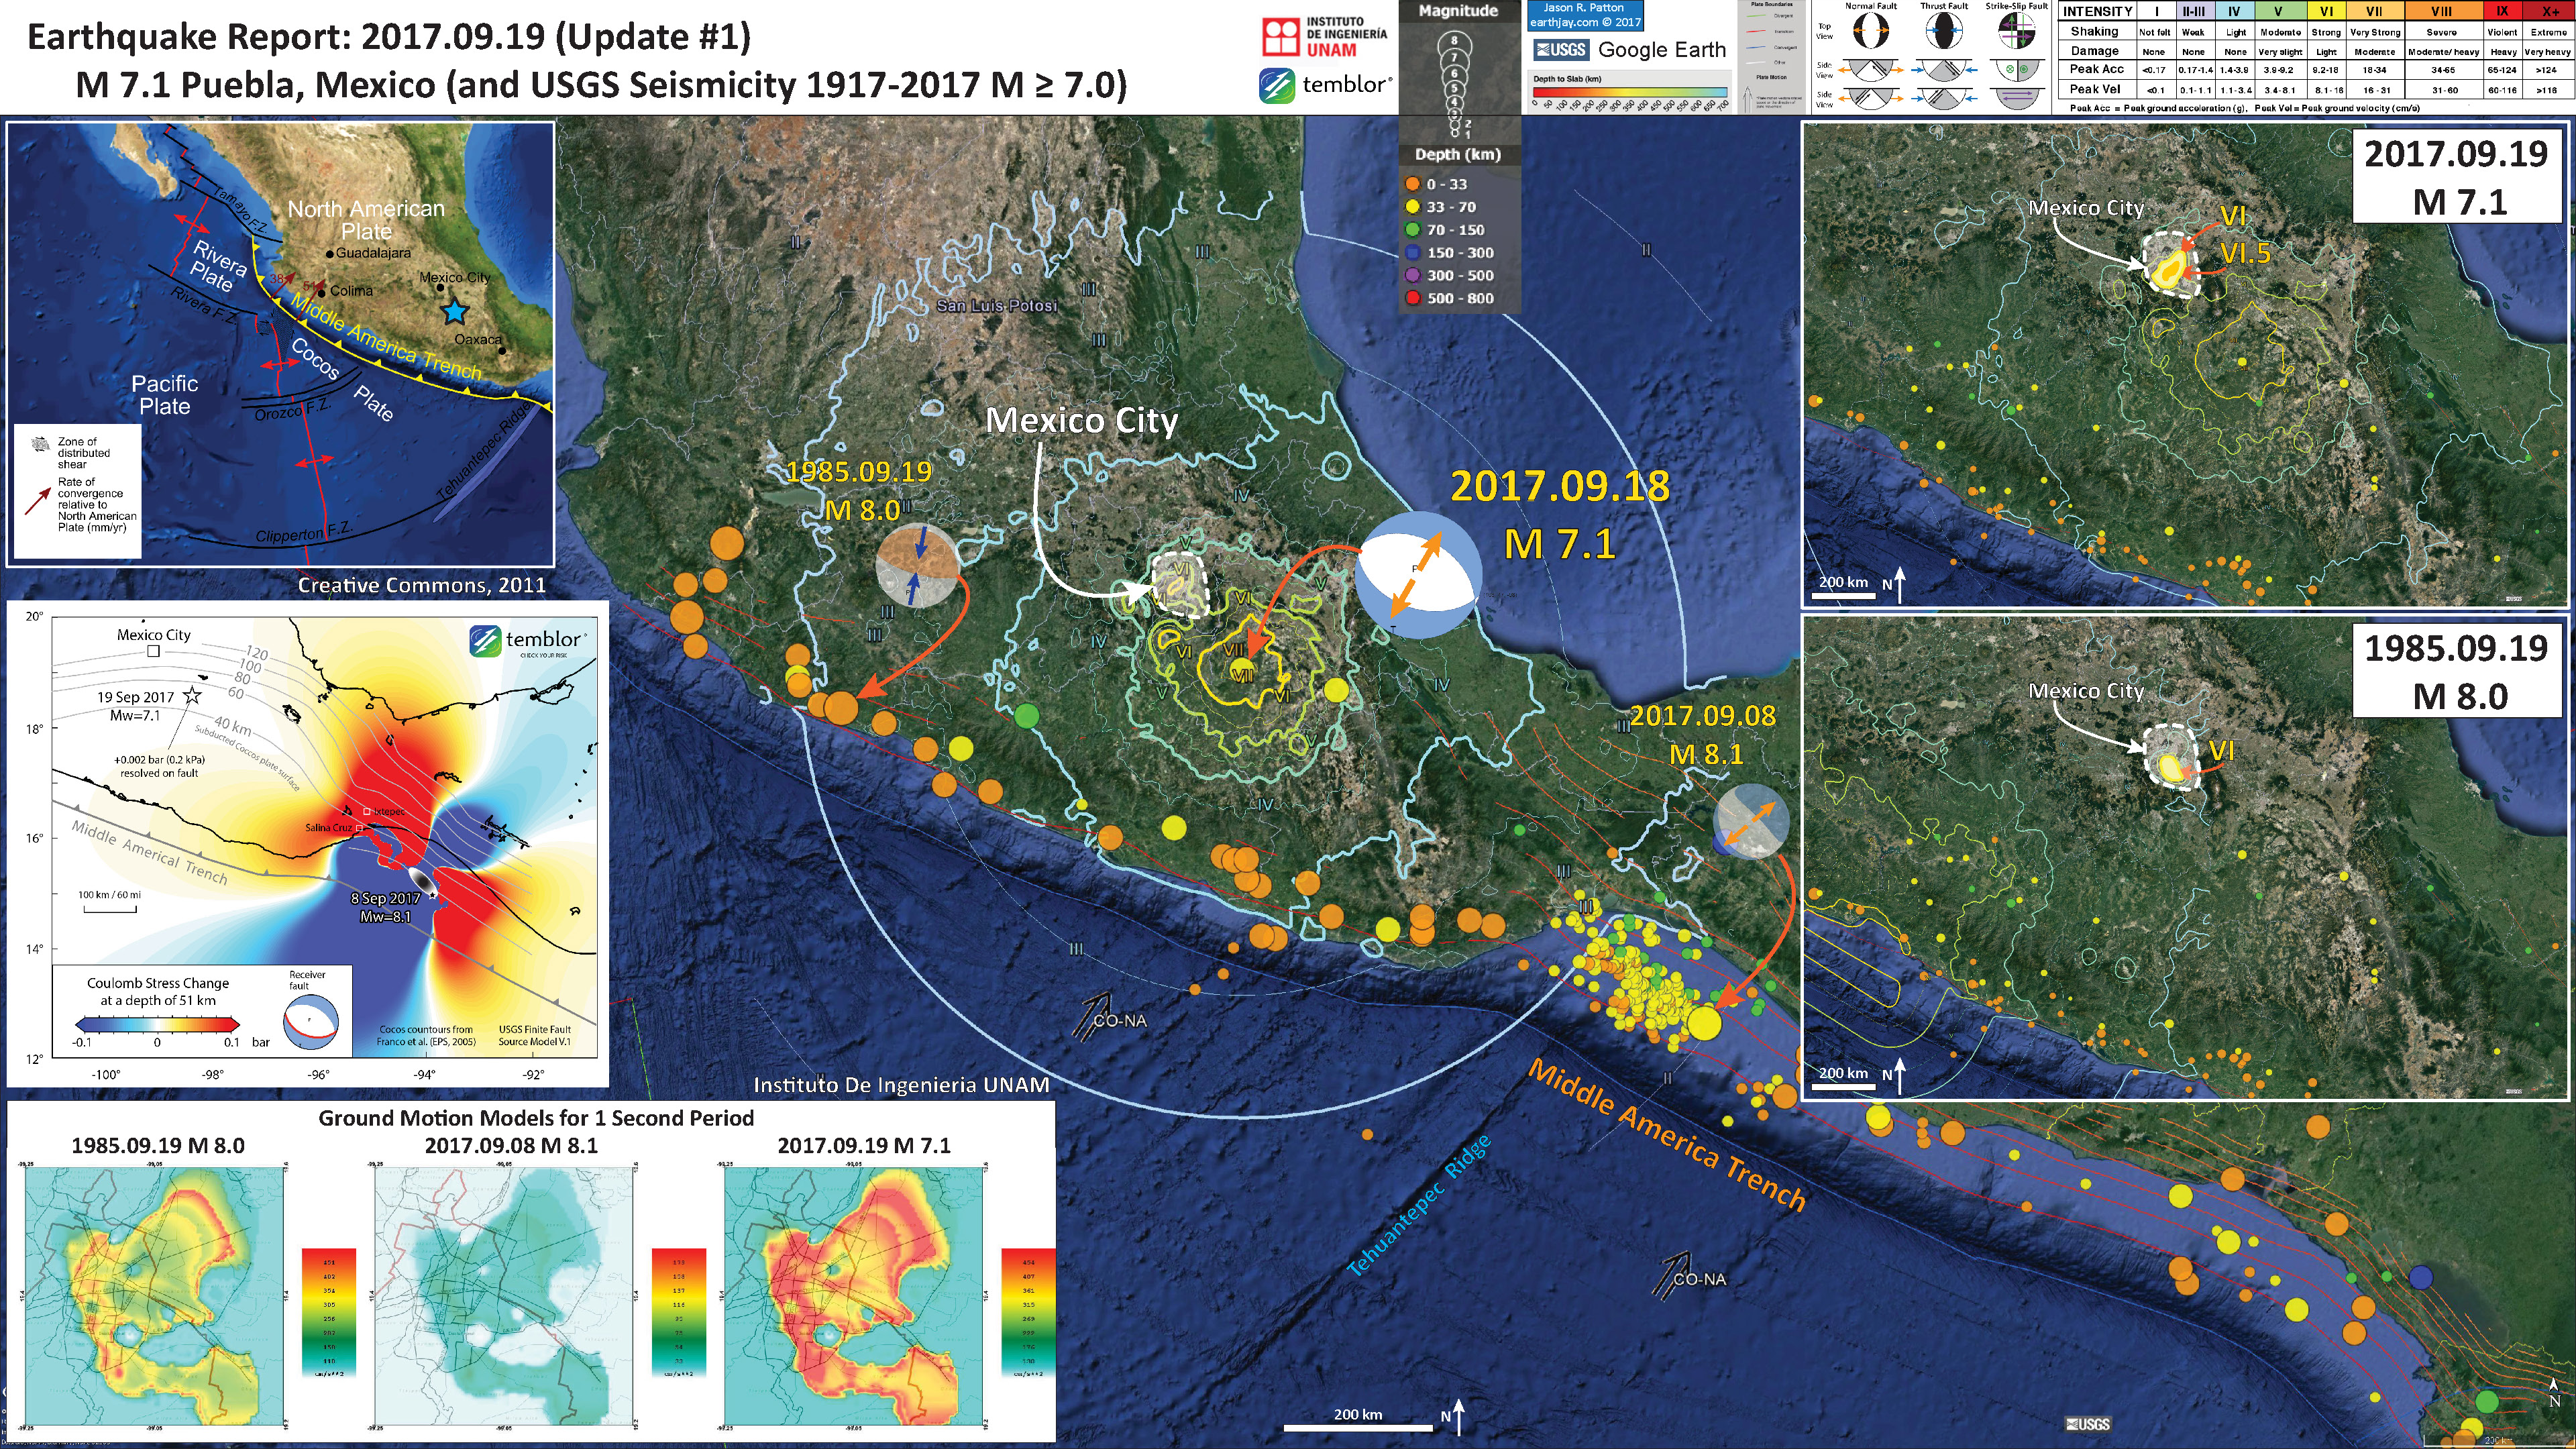
- Earlier today there was a large earthquake associated in some way with the subduction zone forming the Middle America Trench. There is currently some debate about what plate this earthquake occurred within, but it appears to be an intraplate earthquake within the downgoing Cocos plate (CP), beneath the North America plate (NAP).
- I initially thought that this was unrelated to the recent M 8.1 earthquake offshore of Chiapas, Mexico. This is due to my view of aftershocks, that they typically occur within 2 rupture lengths of the mainshock and that they need to be on the same fault (or nearby synthetic fault). However, upon discussing this on twitter, Dr. Susan Hough suggests that this need not be the case, referring to Richter, “Charles Richter observed in the ’50s that distant aftershocks could be part of local sequences set into motion by early triggered quakes.” My initial view was also based upon the slab contours (depth contours to the top of the subducting plate, as published by Hayes et al., 2012), which are discontinuous in this region. This suggested that the earthquake was in the upper plate, the NAP. However, upon discussions with Dr. Stephen Hicks, he suggested people refer to Gérault et al. (2015) that show how the subducting slab (the CP) is flat in this region. This evidence may place the M 7.1 earthquake within the CP.
- This shows the MMI contours for the 1985 M 8.0 earthquake.
- This version includes the MMI contours for the 2017.09.08 M 8.1 earthquake.
- Here is a comparison of the modeled intensities for three earthquakes, the 1985, 1999, and today’s M 7.1 earthquakes.
- Well, the responses of people who are in the midst of a deadly disaster have been inspiring, bringing tears to my eyes often. Watching people searching and helping find survivors. This deadly earthquake brings pause to all who are paying attention. May we learn from this disaster with the hopes that others will suffer less from these lessons.
- I have been discussing this earthquake with other experts, both online (i.e. the twitterverse, where most convo happens these days) and offline. Many of these experts are presenting their interpretations of this earthquake as it may help us learn about plate tectonics. While many of us are interested in learning these technical details, I can only hope that we seek a similar goal, to reduce future suffering. Plate tectonics is a young science and we have an ultra short observation period (given that the recurrence of earthquakes can be centuries to millenia, it may take centuries or more to fully understand these processes).
- Here I present a review of the material that I have seen in the past day and how I interpret these data. The main focus of the poster is a comparison of ground shaking for three earthquakes. Also of interest is the ongoing discussion about how the 2019.09.08 M 8.1 Chiapas Earthquake and this M 7.1 Puebla Earthquake relate to each other. My initial interpretation holds, that the temporal relations between these earthquakes is coincidental (but we now have the analysis to support this interpretation!).
- Here is a video of the seismic waves, as they are being recorded, on the Baby Benioff seismograph in Van Matre Hall at Humboldt State University, Department of Geology. This was provided via the unofficial HSU geology facebook page, uploaded by Dr. Mark Hemphill-Haley. Here is a link to the 10 MB mp4 file for downloading.
- Here is what Dr. Mark Hemphill-Haley wrote about this video.
2017.09.19 M 7.1 Puebla, Mexico
2017.09.19 M 7.1 Puebla, Mexico Update #1


UPDATE #1:
M 7.1 Puebla, Mexico earthquake at 11:14 AM PDT as recorded on the HSU Baby Benioff. The video is showing the surface waves arriving at campus, preceded by the P-waves at the beginning and S-waves immediately prior to the large amplitude waves. Our thoughts are with people in Mexico.
- BOO! Happy Halloween/Samhain….
- I am on the road and worked on this report while on layovers with intermittent internets access… Though this earthquake sequence spanned a day or so, so it is good that it took me a while to compile my figures.
- I just got back from one of the best conferences that I have ever attended, PATA Days 2017 (Paleoseismology, Active Tectonics, and Archeoseismology). This conference was held in Blenheim, New Zealand and was planned to commemorate the 300 year anniversary of the 1717 AD Alpine fault earthquake (the possibly last “full” margin rupture of the Alpine fault, a strike-slip plate boundary between the Australia and Pacific plates, with a slip rate of about 30 mm per year, tapering northwwards as synthetic strike slip faults splay off from the AF). While the meeting was being planned, the 2016 M 7.8 Kaikoura earthquake happened, which expanded the subject matter somewhat.
- Prior to the meeting, we all attended a one day field trip reviewing field evidence for surface rupture and coseismic deformation and landslides from the M 7.8 earthquake in the northern part of the region. The road is still cut off and being repaired, so one cannot drive along the coast between Blenheim and Christchurch (will be open in a few months). During the meeting, there were three days of excellent talks (check out #PATA17 on twitter). Following the meeting, a myajority of the group attended a three day field trip to review the geologic evidence as reviewed by earthquake geologists here of historic and prehistoric earthquakes on the Alpine fault and faults along the Marlborough fault zone (faults that splay off the Alpine fault, extracting plate boundary motion from the Alpine fault). The final day we saw field evidence of rupture from the M 7.8 earthquake, including a coseismic landslide, which blocked a creek. The creek later over-topped some adjacent landscape, down-cutting and exposing stratigraphy that reveals evidence for past rupture on that fault. The trip was epic and the meeting was groundbreaking (apologies for the pun).
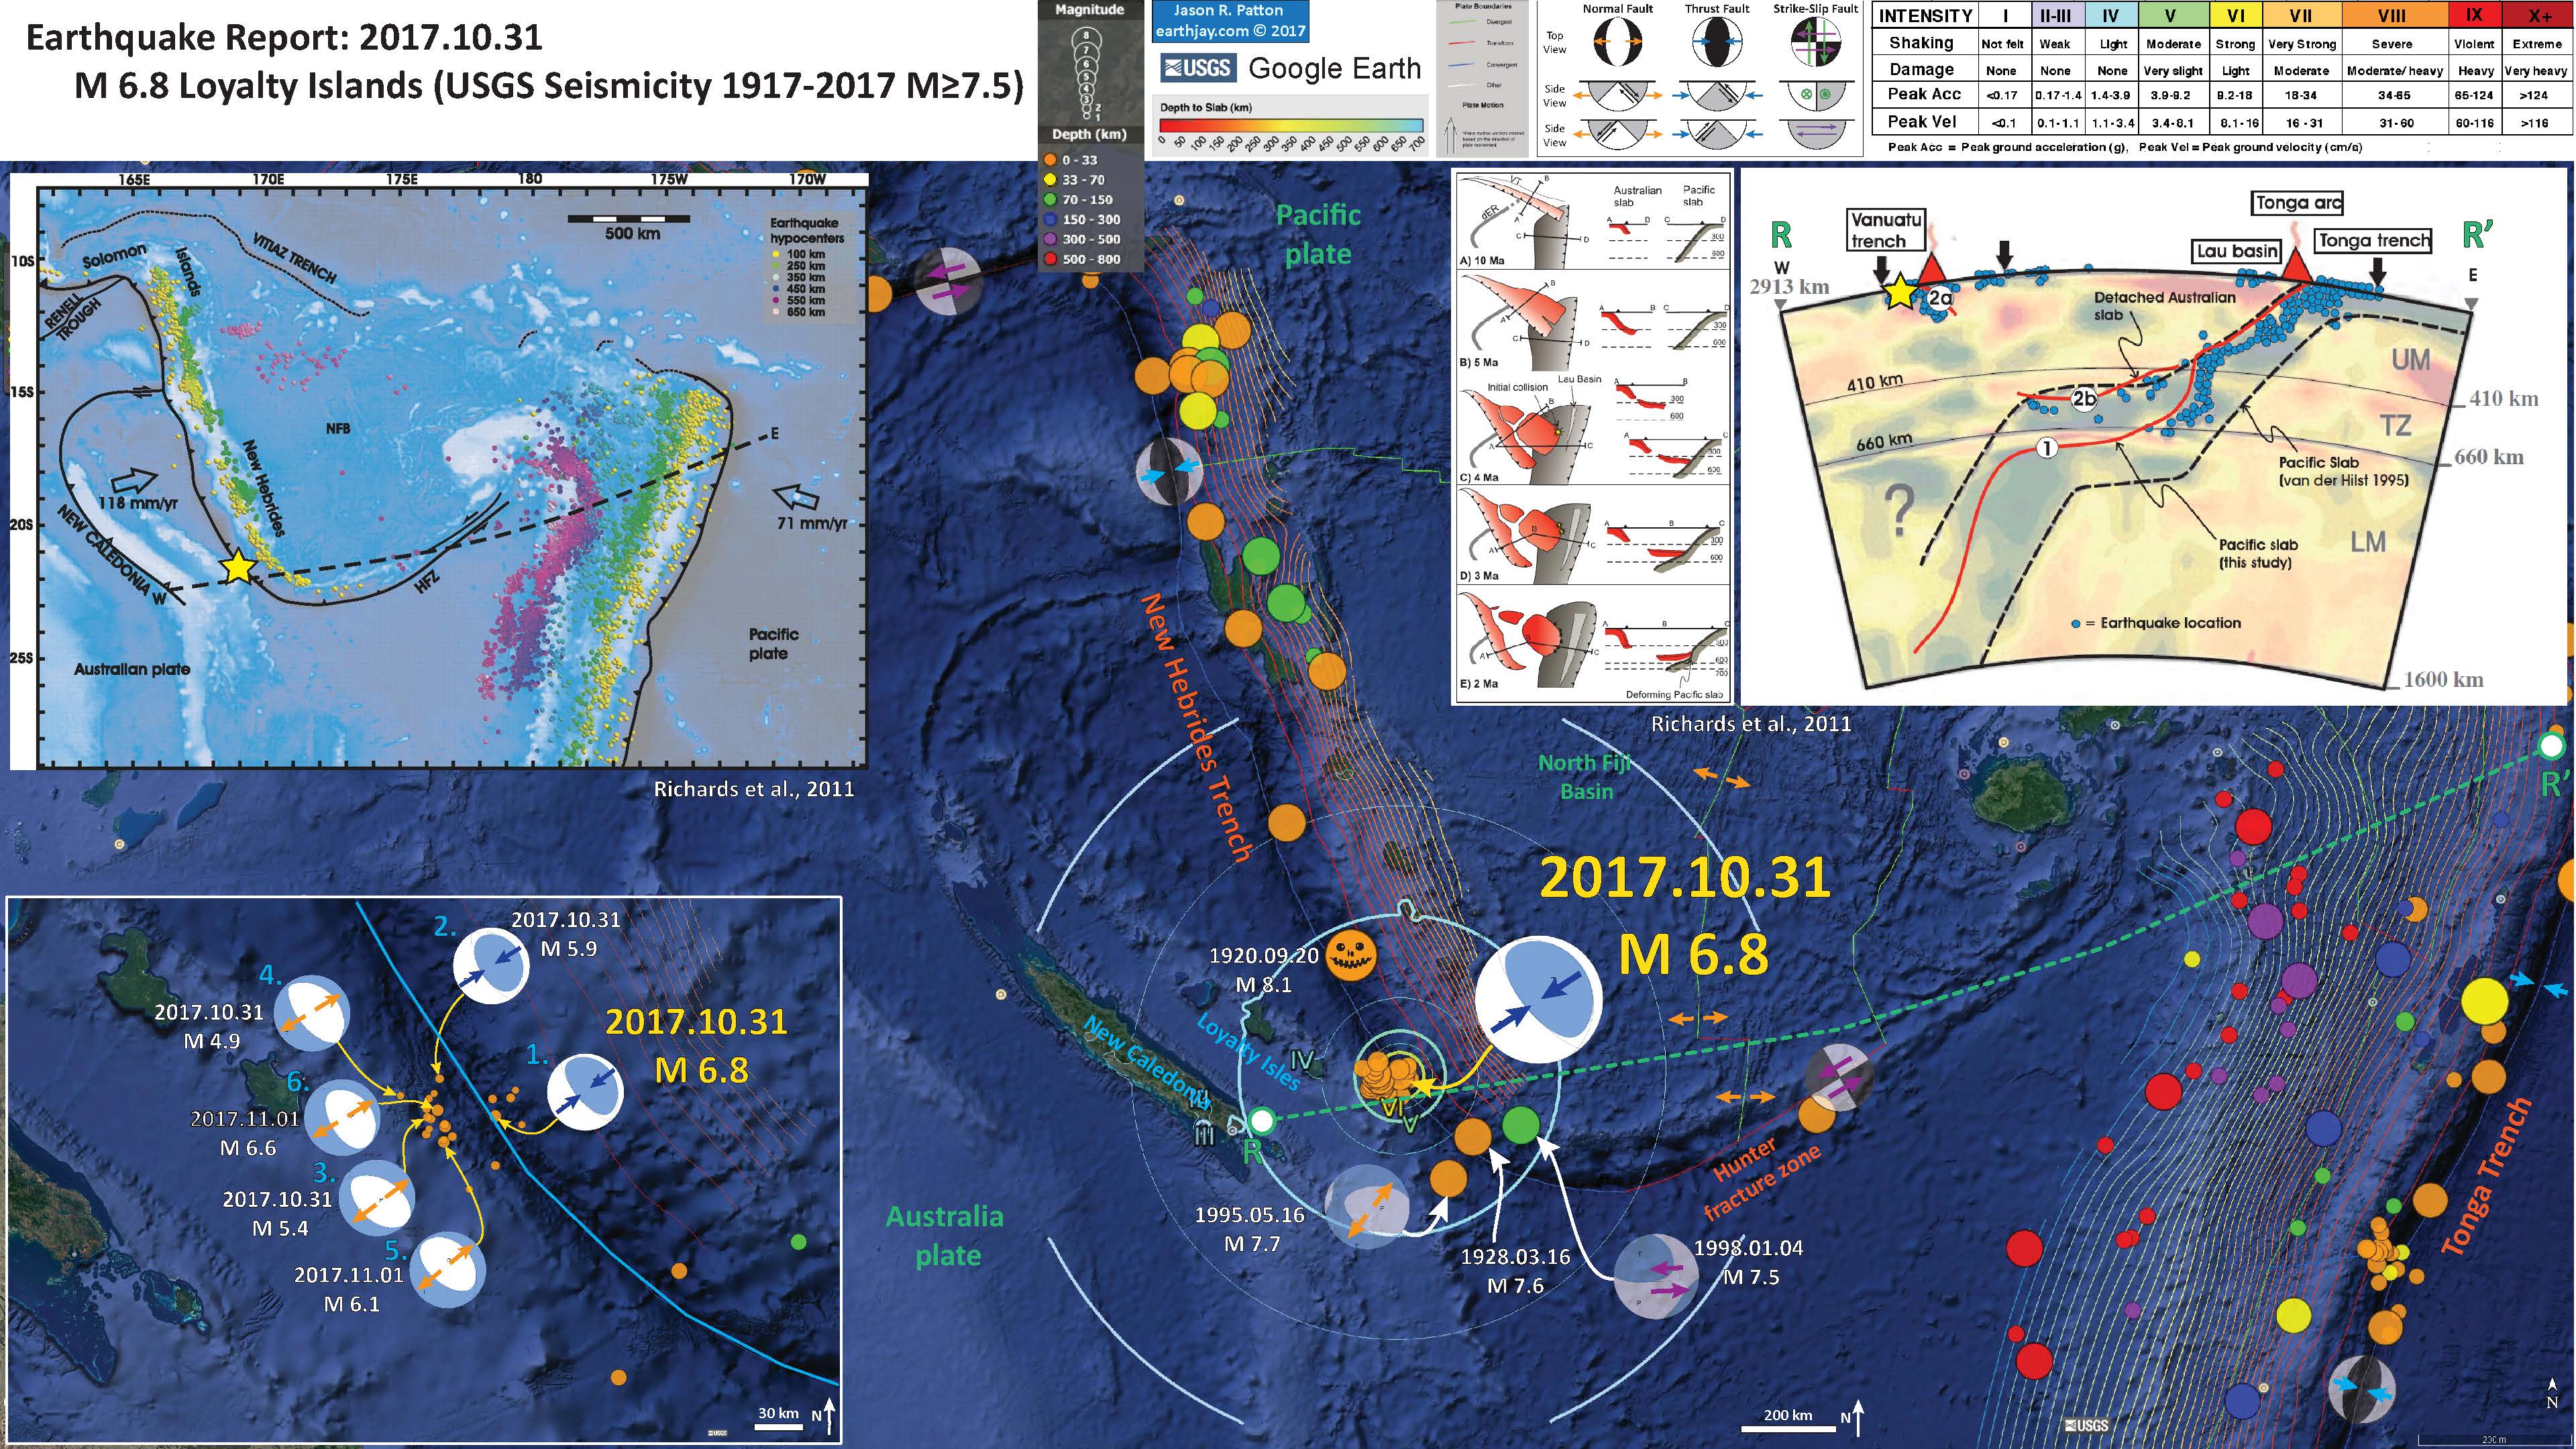
- This region of the southern New Hebrides subduction zone is formed by the subduction of the Australia plate beneath the Pacific plate. There has been an ongoing earthquake sequence since around Halloween (I prepared a report shortly after I arrived in New Zealand; here is my report for the early part of this sequence). Today there was the largest magnitude earthquake in the sequence. This M 7.0 earthquake generated a tsunami measured on tide gages in the region. However, there was a low likelihood of a transpacific tsunami. The sequence beginning several weeks ago included outer rise extension earthquakes and associated thrust fault earthquakes along the upper plate. I have discussed how the lower/down-going plates in a subduction zone flex and cause extension in this flexed bulge (called the outer rise because it bulges up slightly). Here is my report discussing a possibly triggered outer rise earthquake associated with the 2011 M 9.0 Tohoku-oki earthquake. Here is my report for this M 6.0 earthquake from 2016.08.20.
- While looking into this further today, I found that there was a similar sequence (to the current sequence) in 2003-2004. For both sequences, there is an interplay between the upper and lower plates, with compressional earthquakes in the upper plate and extensional earthquakes in the lower plate. Based upon the 2003-2004 sequence, it is possible that there may be a forthcoming compressional earthquake. However, there are many factors that drive the changes in static stress along subduction zones and how that stress may lead to an earthquake (so, there may not be a large earthquake in the upper plate). This is just a simple comparison (albeit for a section of the subduction zone in close proximity).
2017.10.31 M 6.8 Loyalty Islands
2017.11.19 M 6.8 Loyalty Islands Update #1
UPDATE #1:
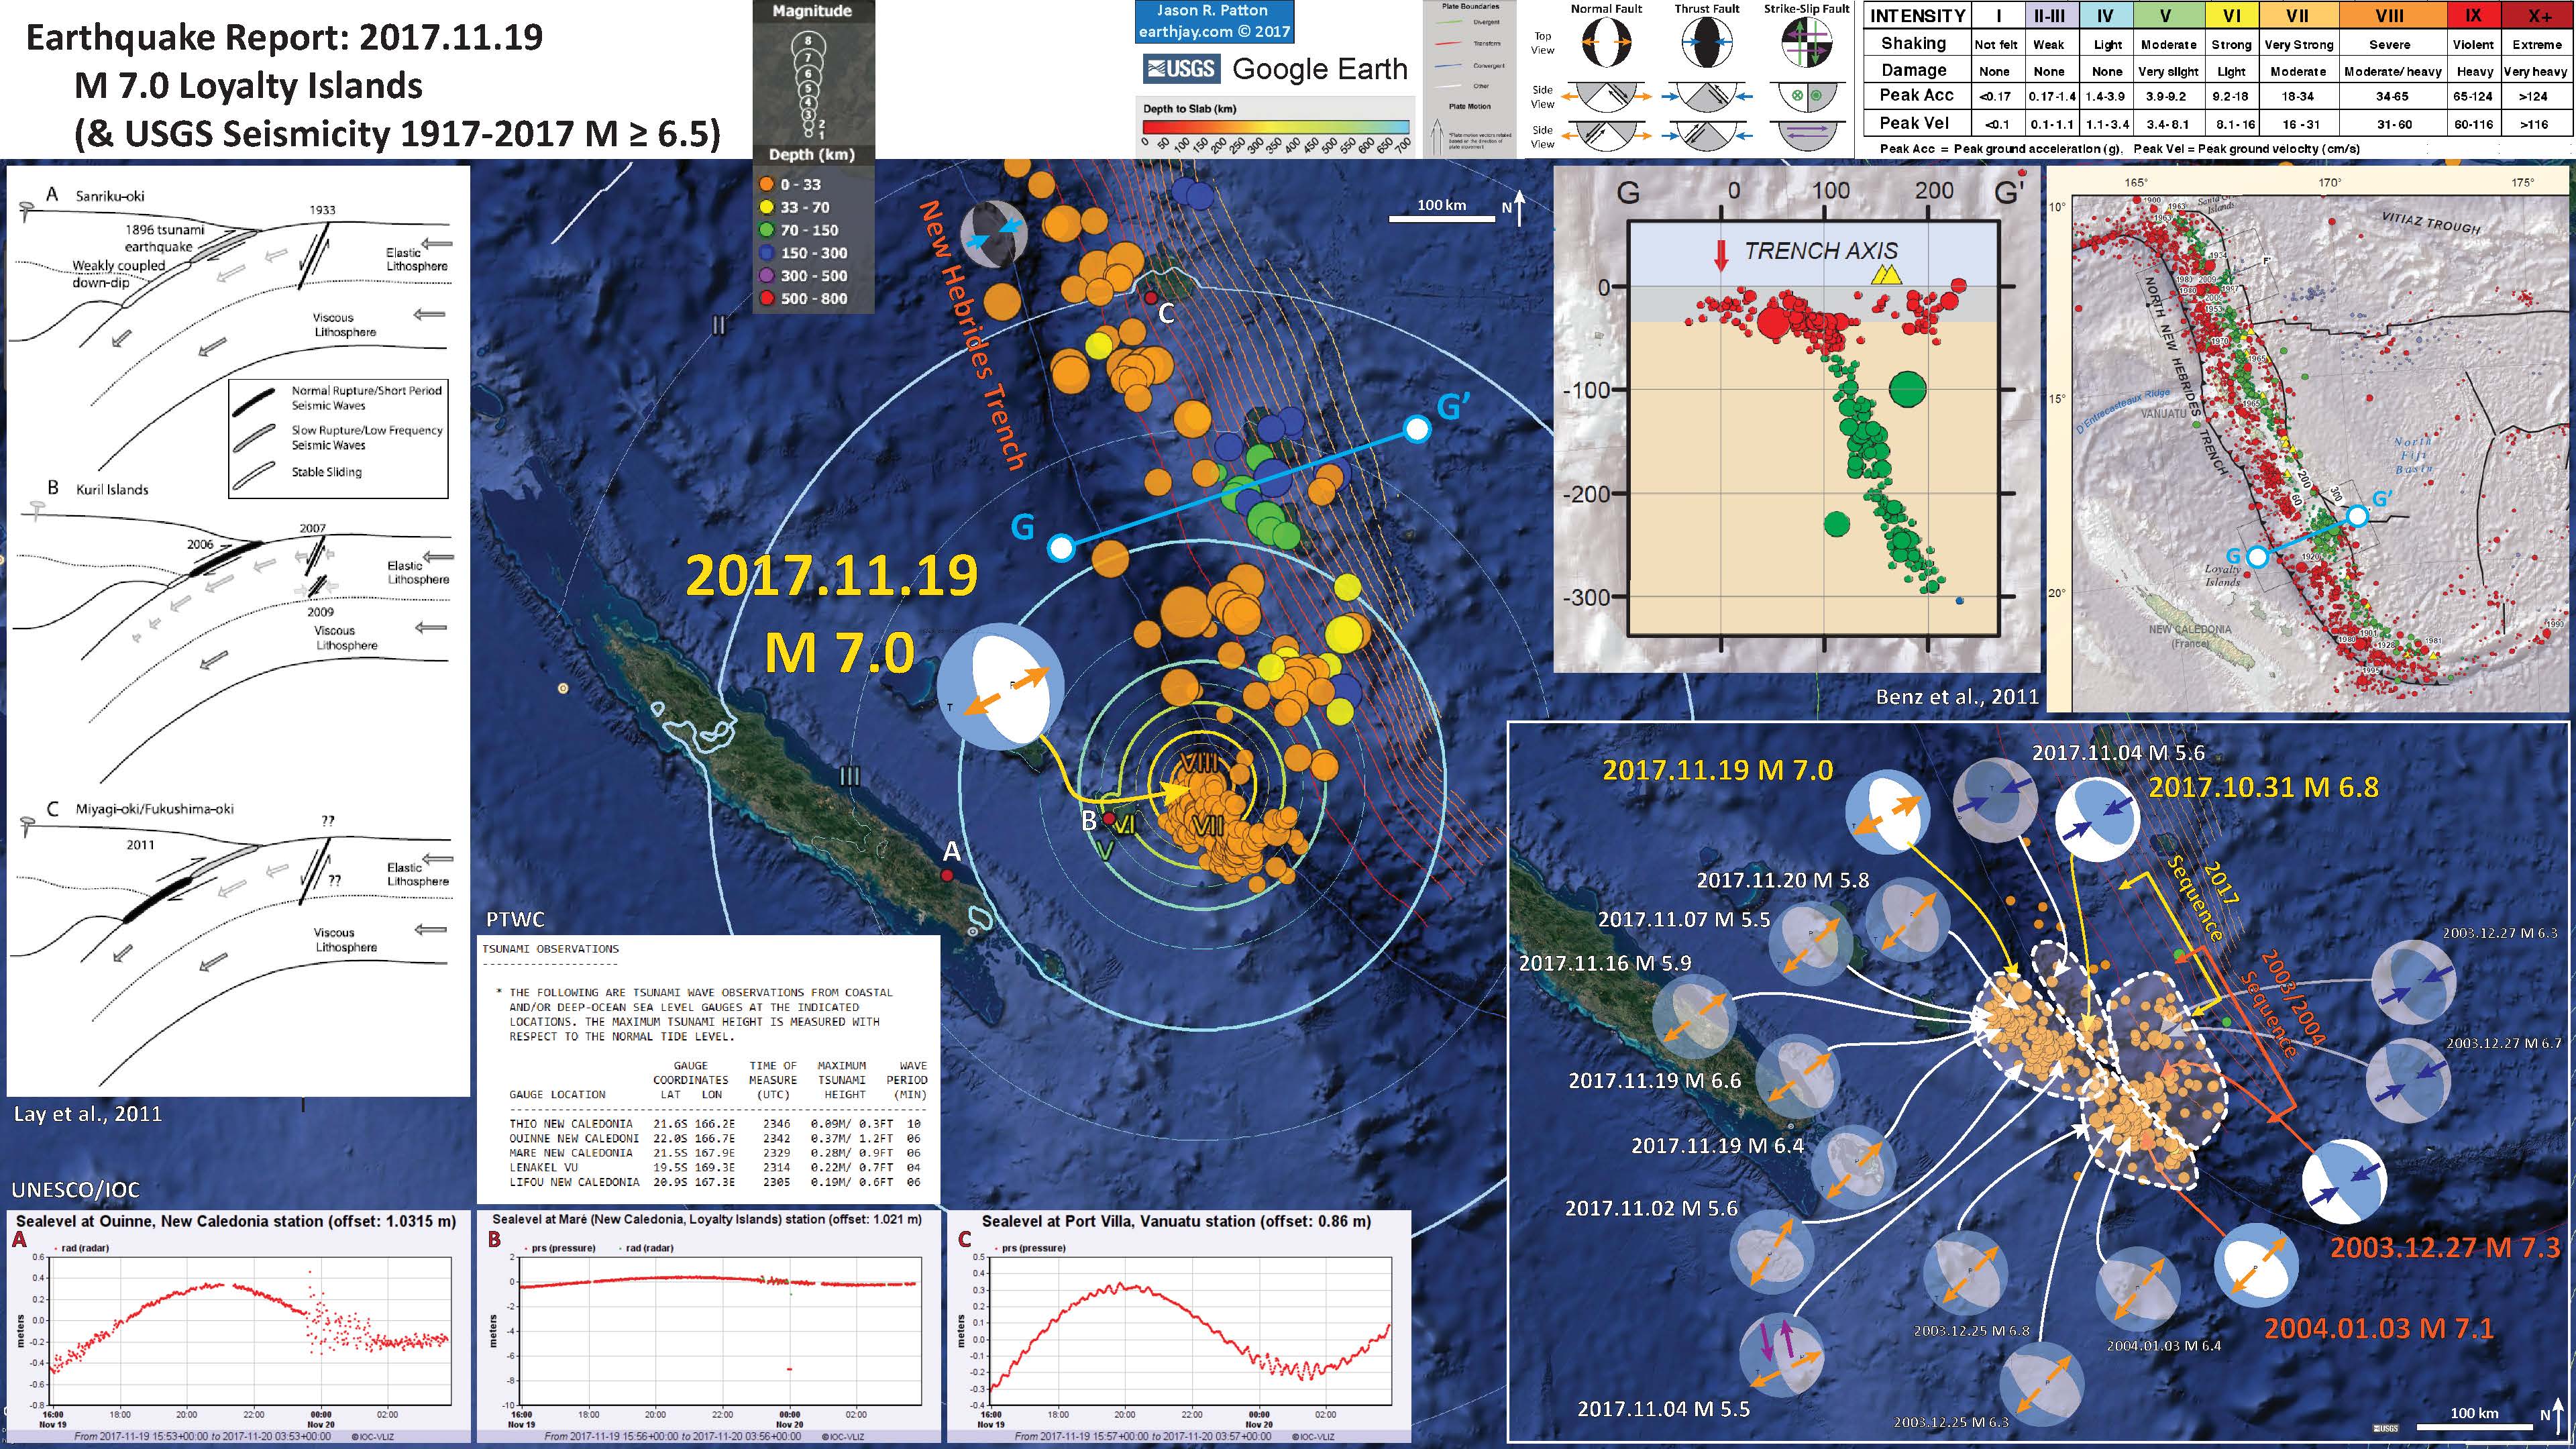
- Well, I was just getting ready for bed and saw the PTWC email notification. It took a couple minutes before the USGS email notification came through, but the earthquake was already listed on the website. By the time the ENS email came in, the magnitude was adjusted, as well as the location.
- This M 6.8 earthquake was originally reported as a deep earthquake at 80 km, but after real people took a look at the data, the depth was also adjusted.
- It is interesting that this earthquake happened just a few days after the sequence to the west, though these earthquakes are probably too far away to be related. Here is my report from a couple days ago. I include the interpretive poster from that earthquake below today’s interpretive poster. I use some of the same figures for both of these posters since they are each in a similar region of the world. Then, moments later, there was an M 5.5 in the Loyalty Islands region. Hmmmmm.
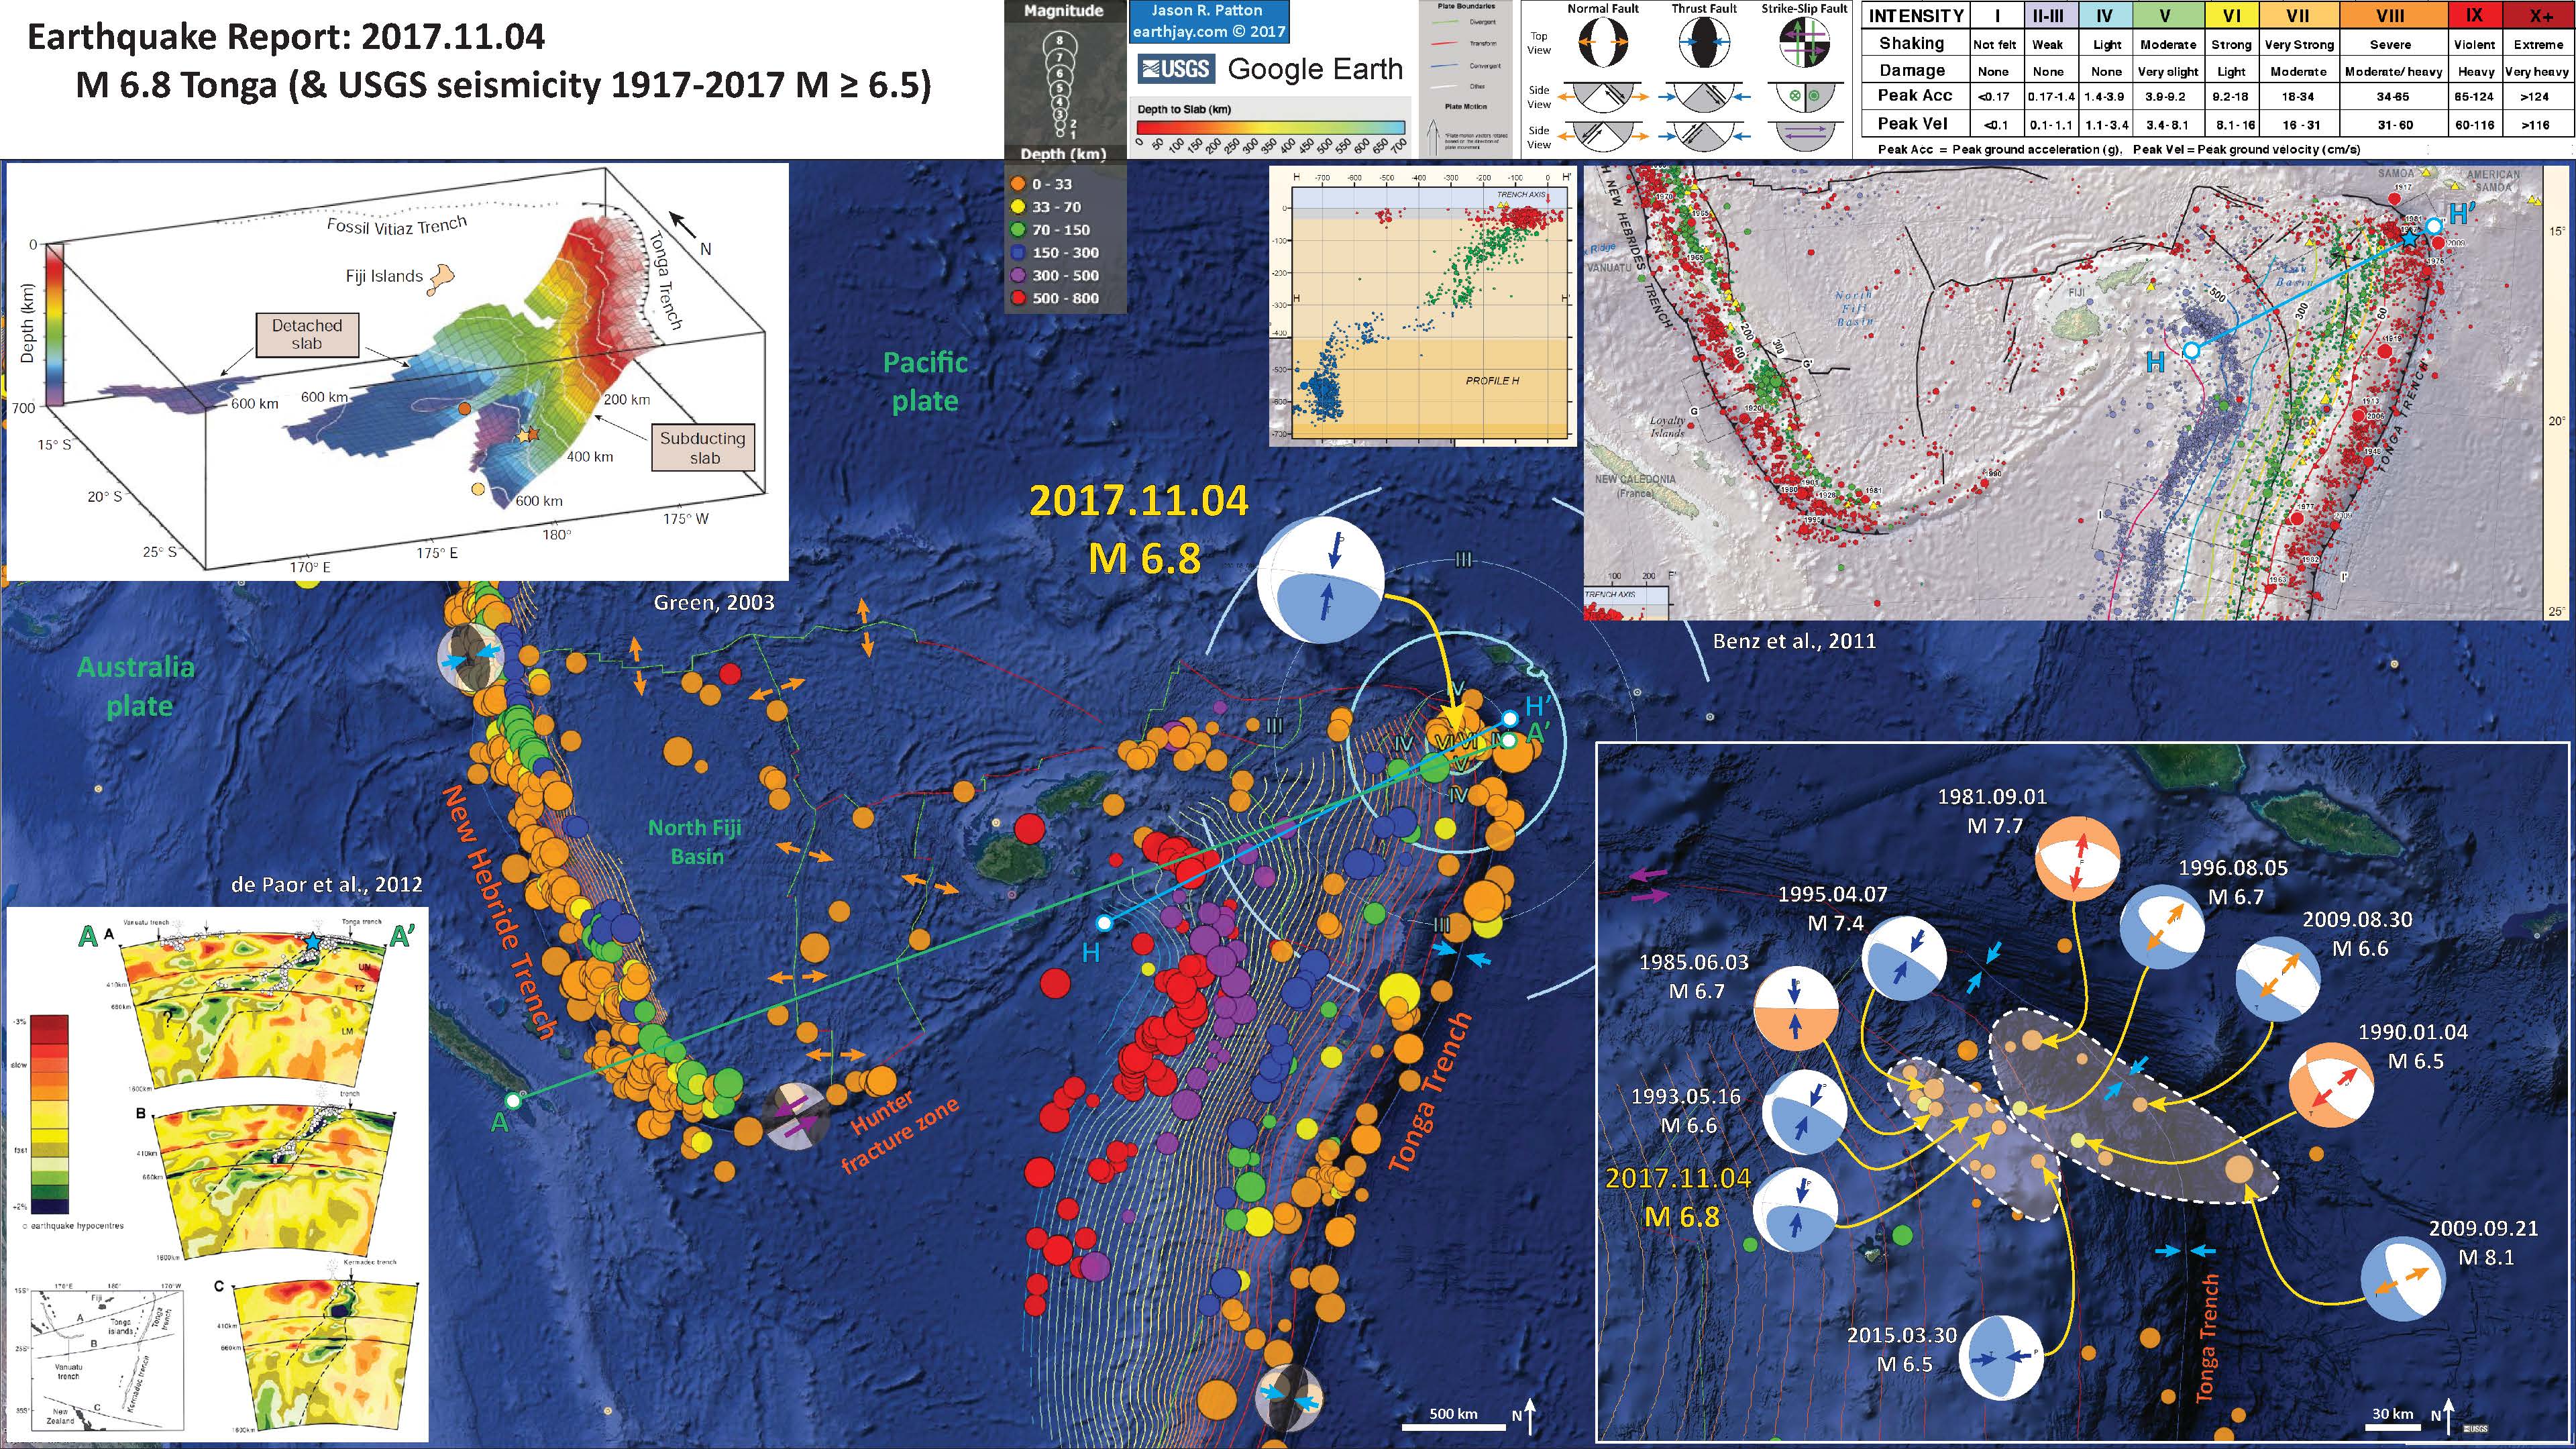
- Today’s M 6.8 earthquake did occur near the earthquake from 2009 (almost immediately down-dip of the 2009 earthquake), an M 8.1 earthquake in the downgoing slab, that caused a large and damaging tsunami in the Samoa Islands.
2017.11.04 M 6.8 Tonga
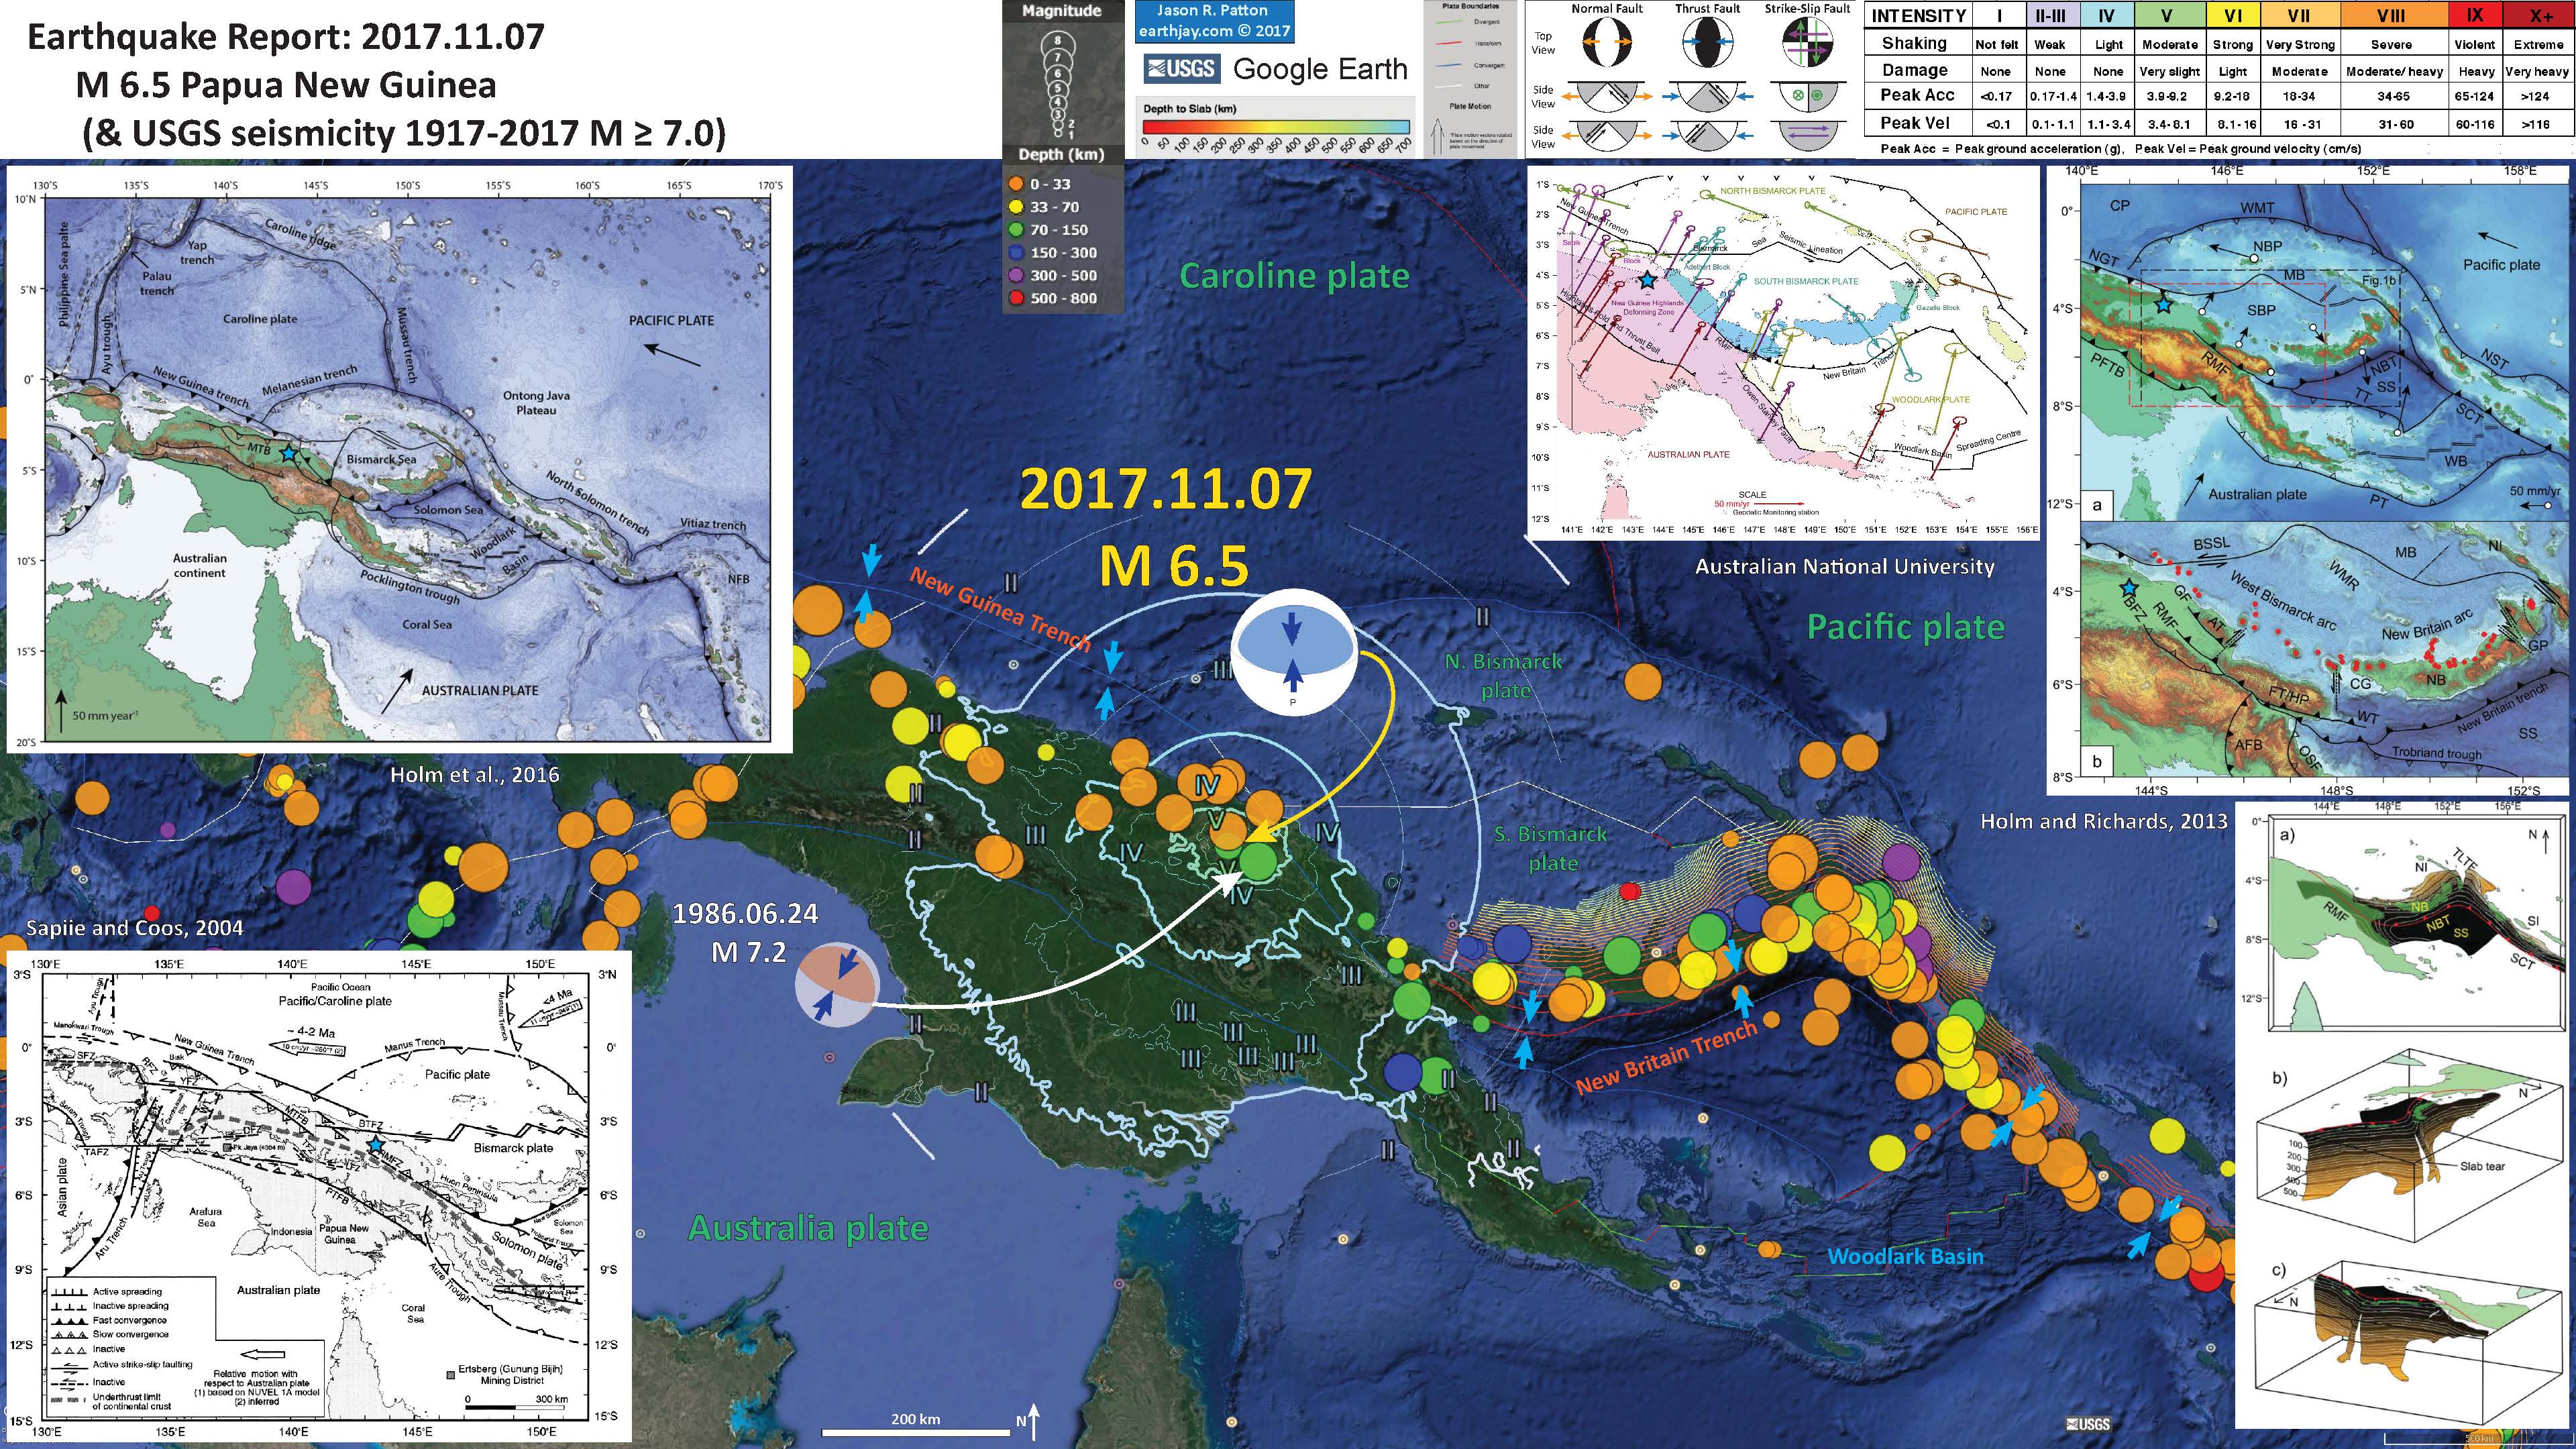
- Well. As I was preparing a job application at the library public wifi (the Airbnb I was staying at did not have wifi in my cabin, nor electricity for that matter), I prepared an interpretive poster for this earthquake. Interestingly, the library prevented any ftp connections, so I had to wait until today to upload my files.
- This M 6.5 earthquake (here is the USGS website for this earthquake) happened in a region of Papua New Guinea (PNG) that has a long record of different types of tectonic deformation (including subduction, strike-slip, and several fold and thrust belts). To the northwest, in 1998, there was an earthquake that triggered a submarine landslide, which generated a large, devastating, and deadly tsunami. Here is the USGS website for this 1998 M 7.0 earthquake.
- There are historic earthquakes to the west of this M 6.5 that are associated with the fold and thrust belt, but this M 6.5 earthquake is too deep to be associated with a possibly eastern extension of this fold and thrust belt. womp womp.
- However, there have been a few earthquakes that are more closely (spatially) related to the 2017.11.07 M 6.5 earthquake. On 1986.06.24 there was an M 7.2 earthquake (here is the USGS website for this earthquake) to the southeast. These two earthquakes both have similar fault plane solutions (a moment tensor for the 2017 earthquake and a focal mechanism for the 1986 earthquake) and nearly identical depths. These deep earthquakes are deeper than we would expect for a subduction zone fault, so are possibly related to internal deformation within the downgoing slab. The subduction zone associated with the New Guinea (NG) trench (associated with the 1998 landslide tsunami earthquake) may or may not extend into this region (The Holm et al. (2016) figure below shows it does now). There is a fossil subduction zone (the Melanesian or Manus Trench) to the east of the NG trench, but this is also probably unrelated.
- The best candidate is the downgoing slab associated with the New Britain Trench. This subduction zone is formed by the northward motion of the Solomon Sea plate beneath the South Bismarck plate (in the region of New Britain), but to the west, this fault splays into three mapped thrust faults that trend on land in eastern PNG. This is the slab imaged beneath where the epicenters are plotted for both 1986 and 2017 earthquakes. The Holm et al. (2016) figure has an inactive splay that more optimally (geometrically) is suited to fit these two earthquakes. There is a figure in the poster (and plotted below) that shows the geometry of this downgoing slab.
2017.11.07 M 6.5 Papua New Guinea
- A month and a half ago, I was attending the PATA conference and an earthquake hit Iran and Iraq the night before our first field trip. Thus, I did not have the time to address this earthquake at the time. I am preparing this report in support of my annual summary.
- This was a damaging earthquake and is the most deadly for 2017. Over 500 people were killed and thousands were injured.
- There was an earthquake in Iran a few weeks later. I prepared a report here and the poster update is below.
2017.11.12 M 7.3 Iran
2017.12.01 M 6.1 Iran


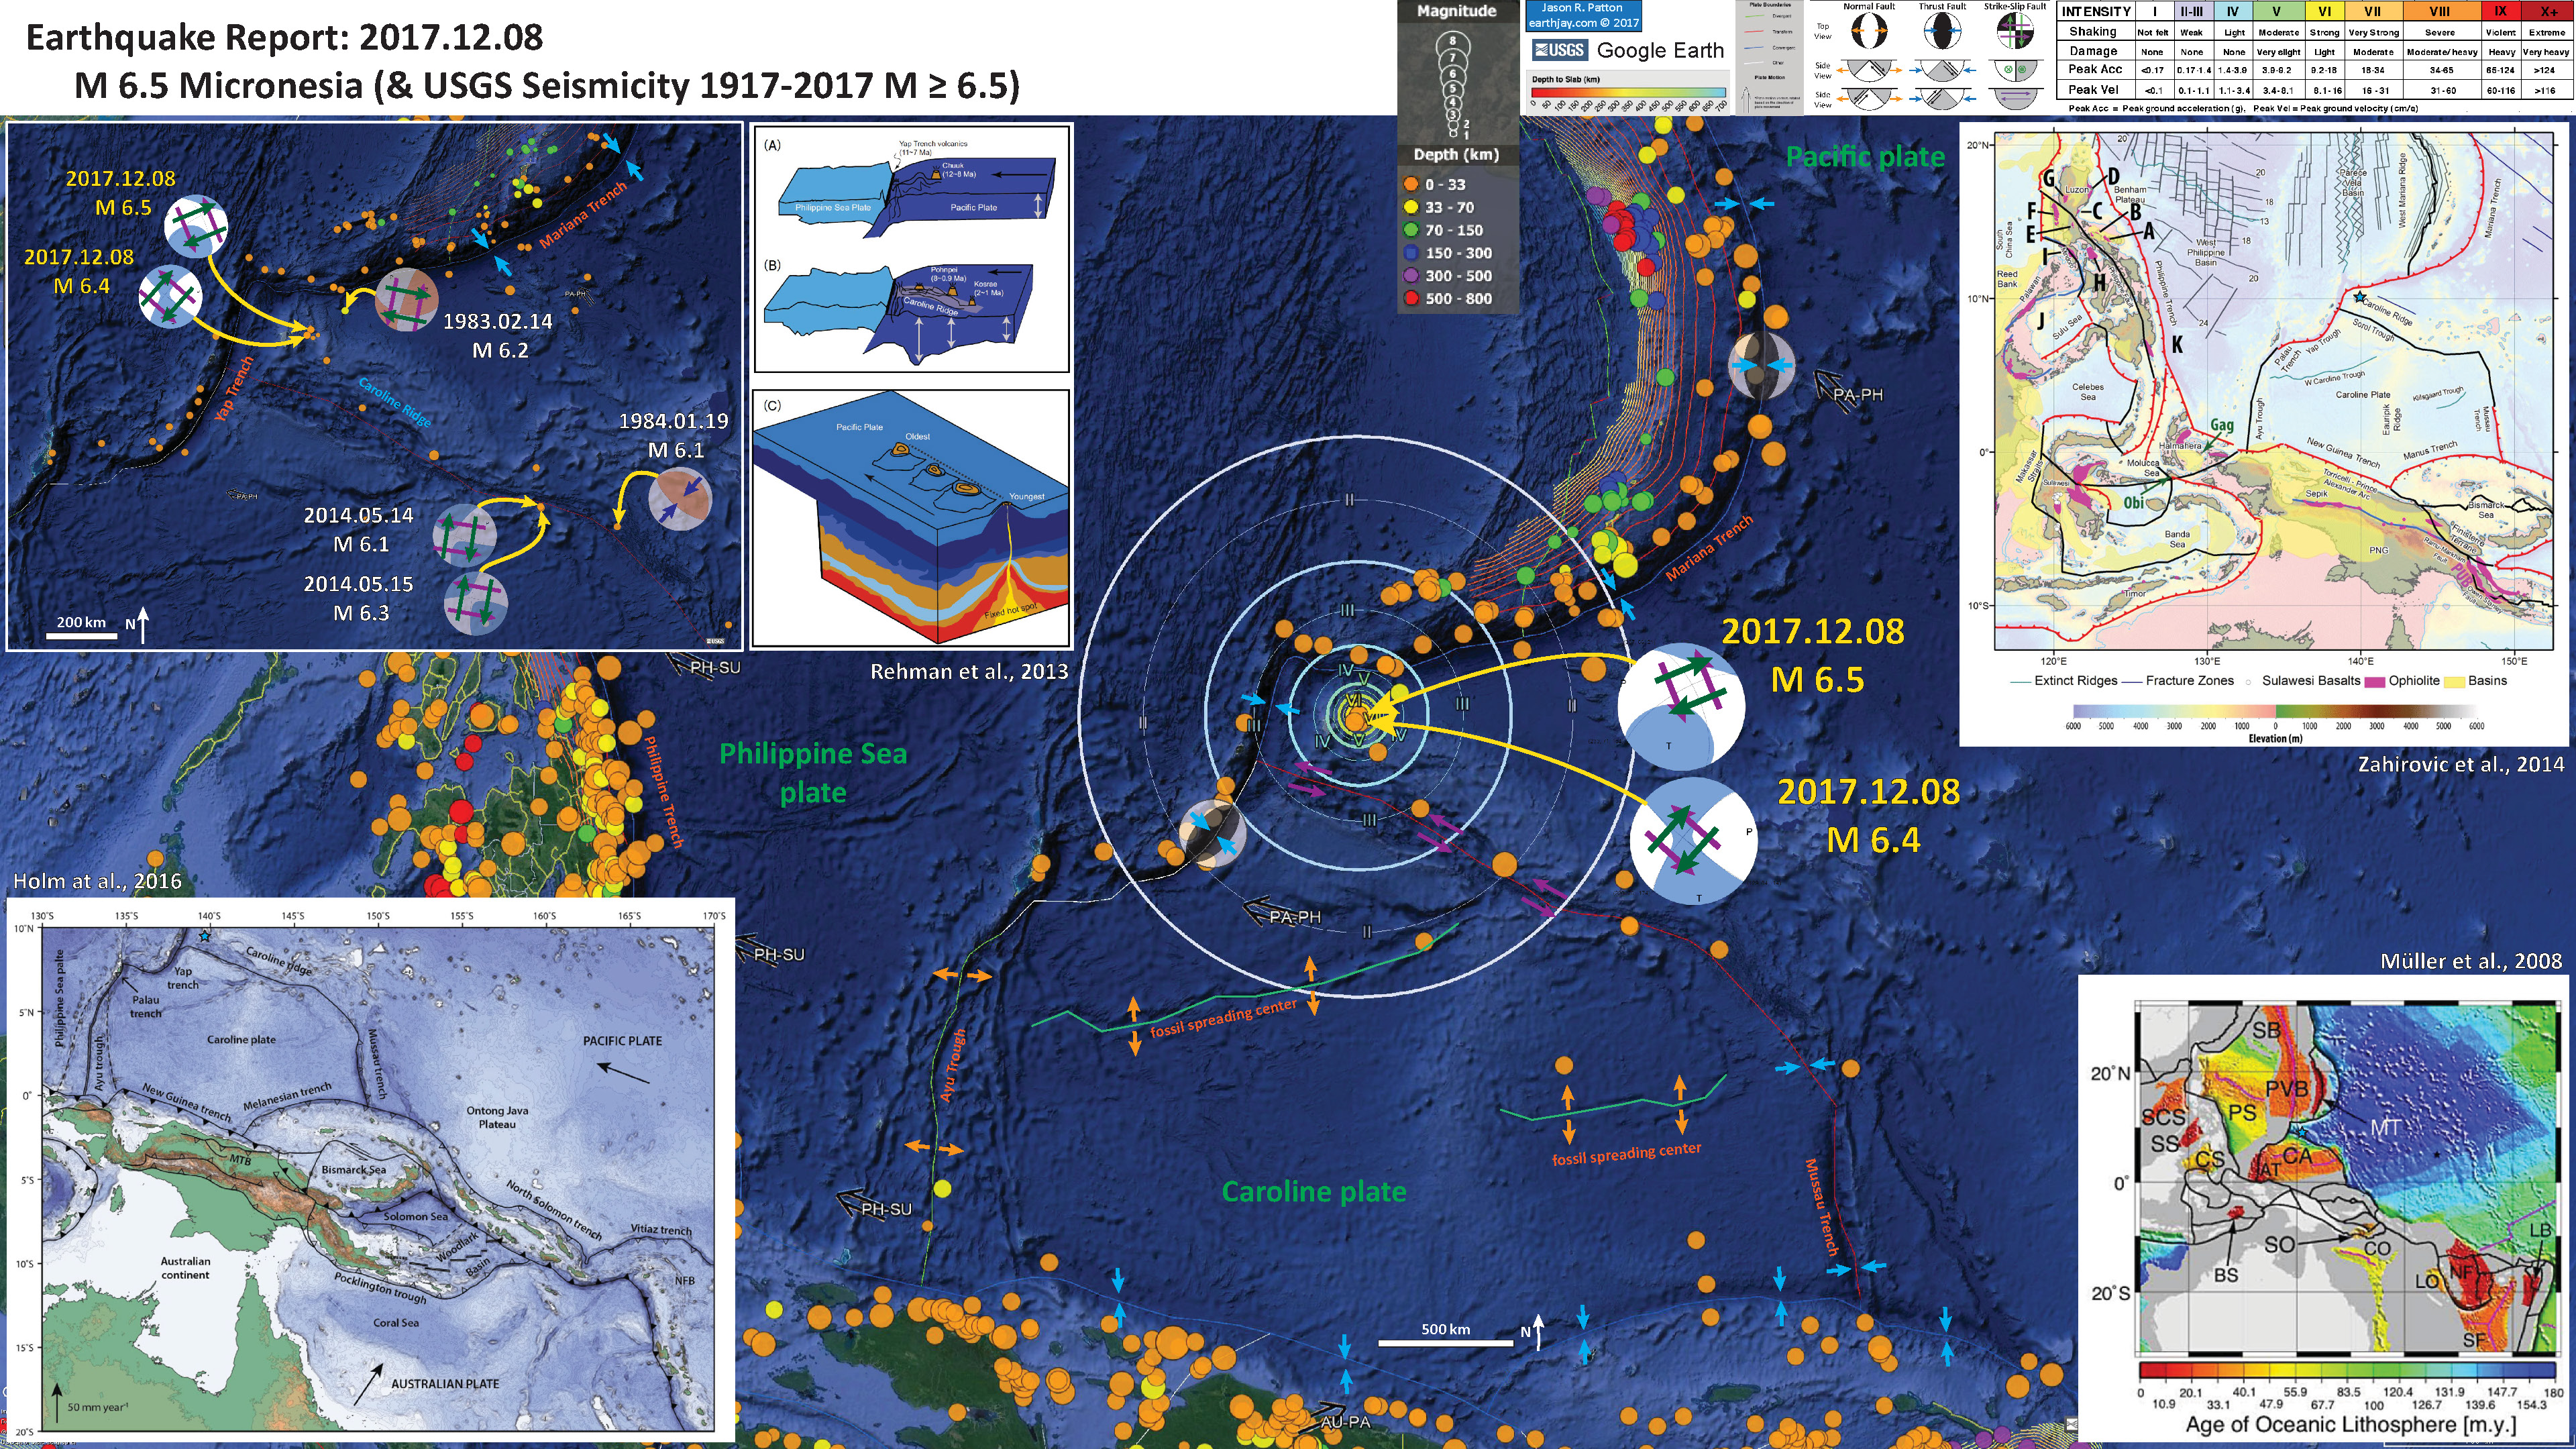
- There was an earthquake sequence beginning 2017.12.08 along the northern flank of Caroline Ridge in the western Pacific Ocean, near the intersection of the Mariana and Yap trenches.
- The two largest earthquakes, M 6.5 and M 6.4, are both strike-slip earthquakes. The M 6.5 is northeast of the M 6.4, so maybe this represents a northeast striking left lateral earthquake. But I rank this a low certainty interpretation. I did not find any geologic maps of this region that might show geologic structures that we might associate with this seismicity, so it is difficult to know if the alternate solution is correct (northwest striking left-lateral strike slip). However, there is possibly a transform (strike-slip) plate boundary fault associated with the southern boundary of the Caroline Ridge (this interpretation is based upon my interpretation of the “Age of Oceanic Lithosphere” map below). There may be synthetic faults to this transform boundary fault, ones sub-parallel to the main fault (the red faultline with purple arrows showing sense of motion). In this case, I would interpret the M 6.5 and M 6.4 earthquakes as northwest striking left-lateral earthquakes.
- The Yap and Mariana trenches are formed by the subduction of the Pacific plate beneath the Philippine Sea plate.
- The Caroline Islands are volcanic islands formed when the Pacific plate passed over a hotspot (Rehman et al., 2013). As in Hawaii (and other young hotspot volcanic island chains), the younger islands are to the east. The westward movement of this oceanic ridge, formed similar in fashion to the Ninetyeast Ridge, has interacted with the subduction zone in a way that has indented the trench. Prior to the ridge hitting the trench, the Mariana trench may have extended further south. As the ridge interacted with the subduction zone, the megathrust fault moved westwards, offsetting the trench and forming the Yap Trench. There is a great illustration from Fujiwara et al. (2000) below.
- There are fossil oceanic spreading ridges within the Caroline plate. These show up in the bathymetry and evidenced by the magnetic anomaly data.
2017.12.08 M 6.5 Caroline Ridge
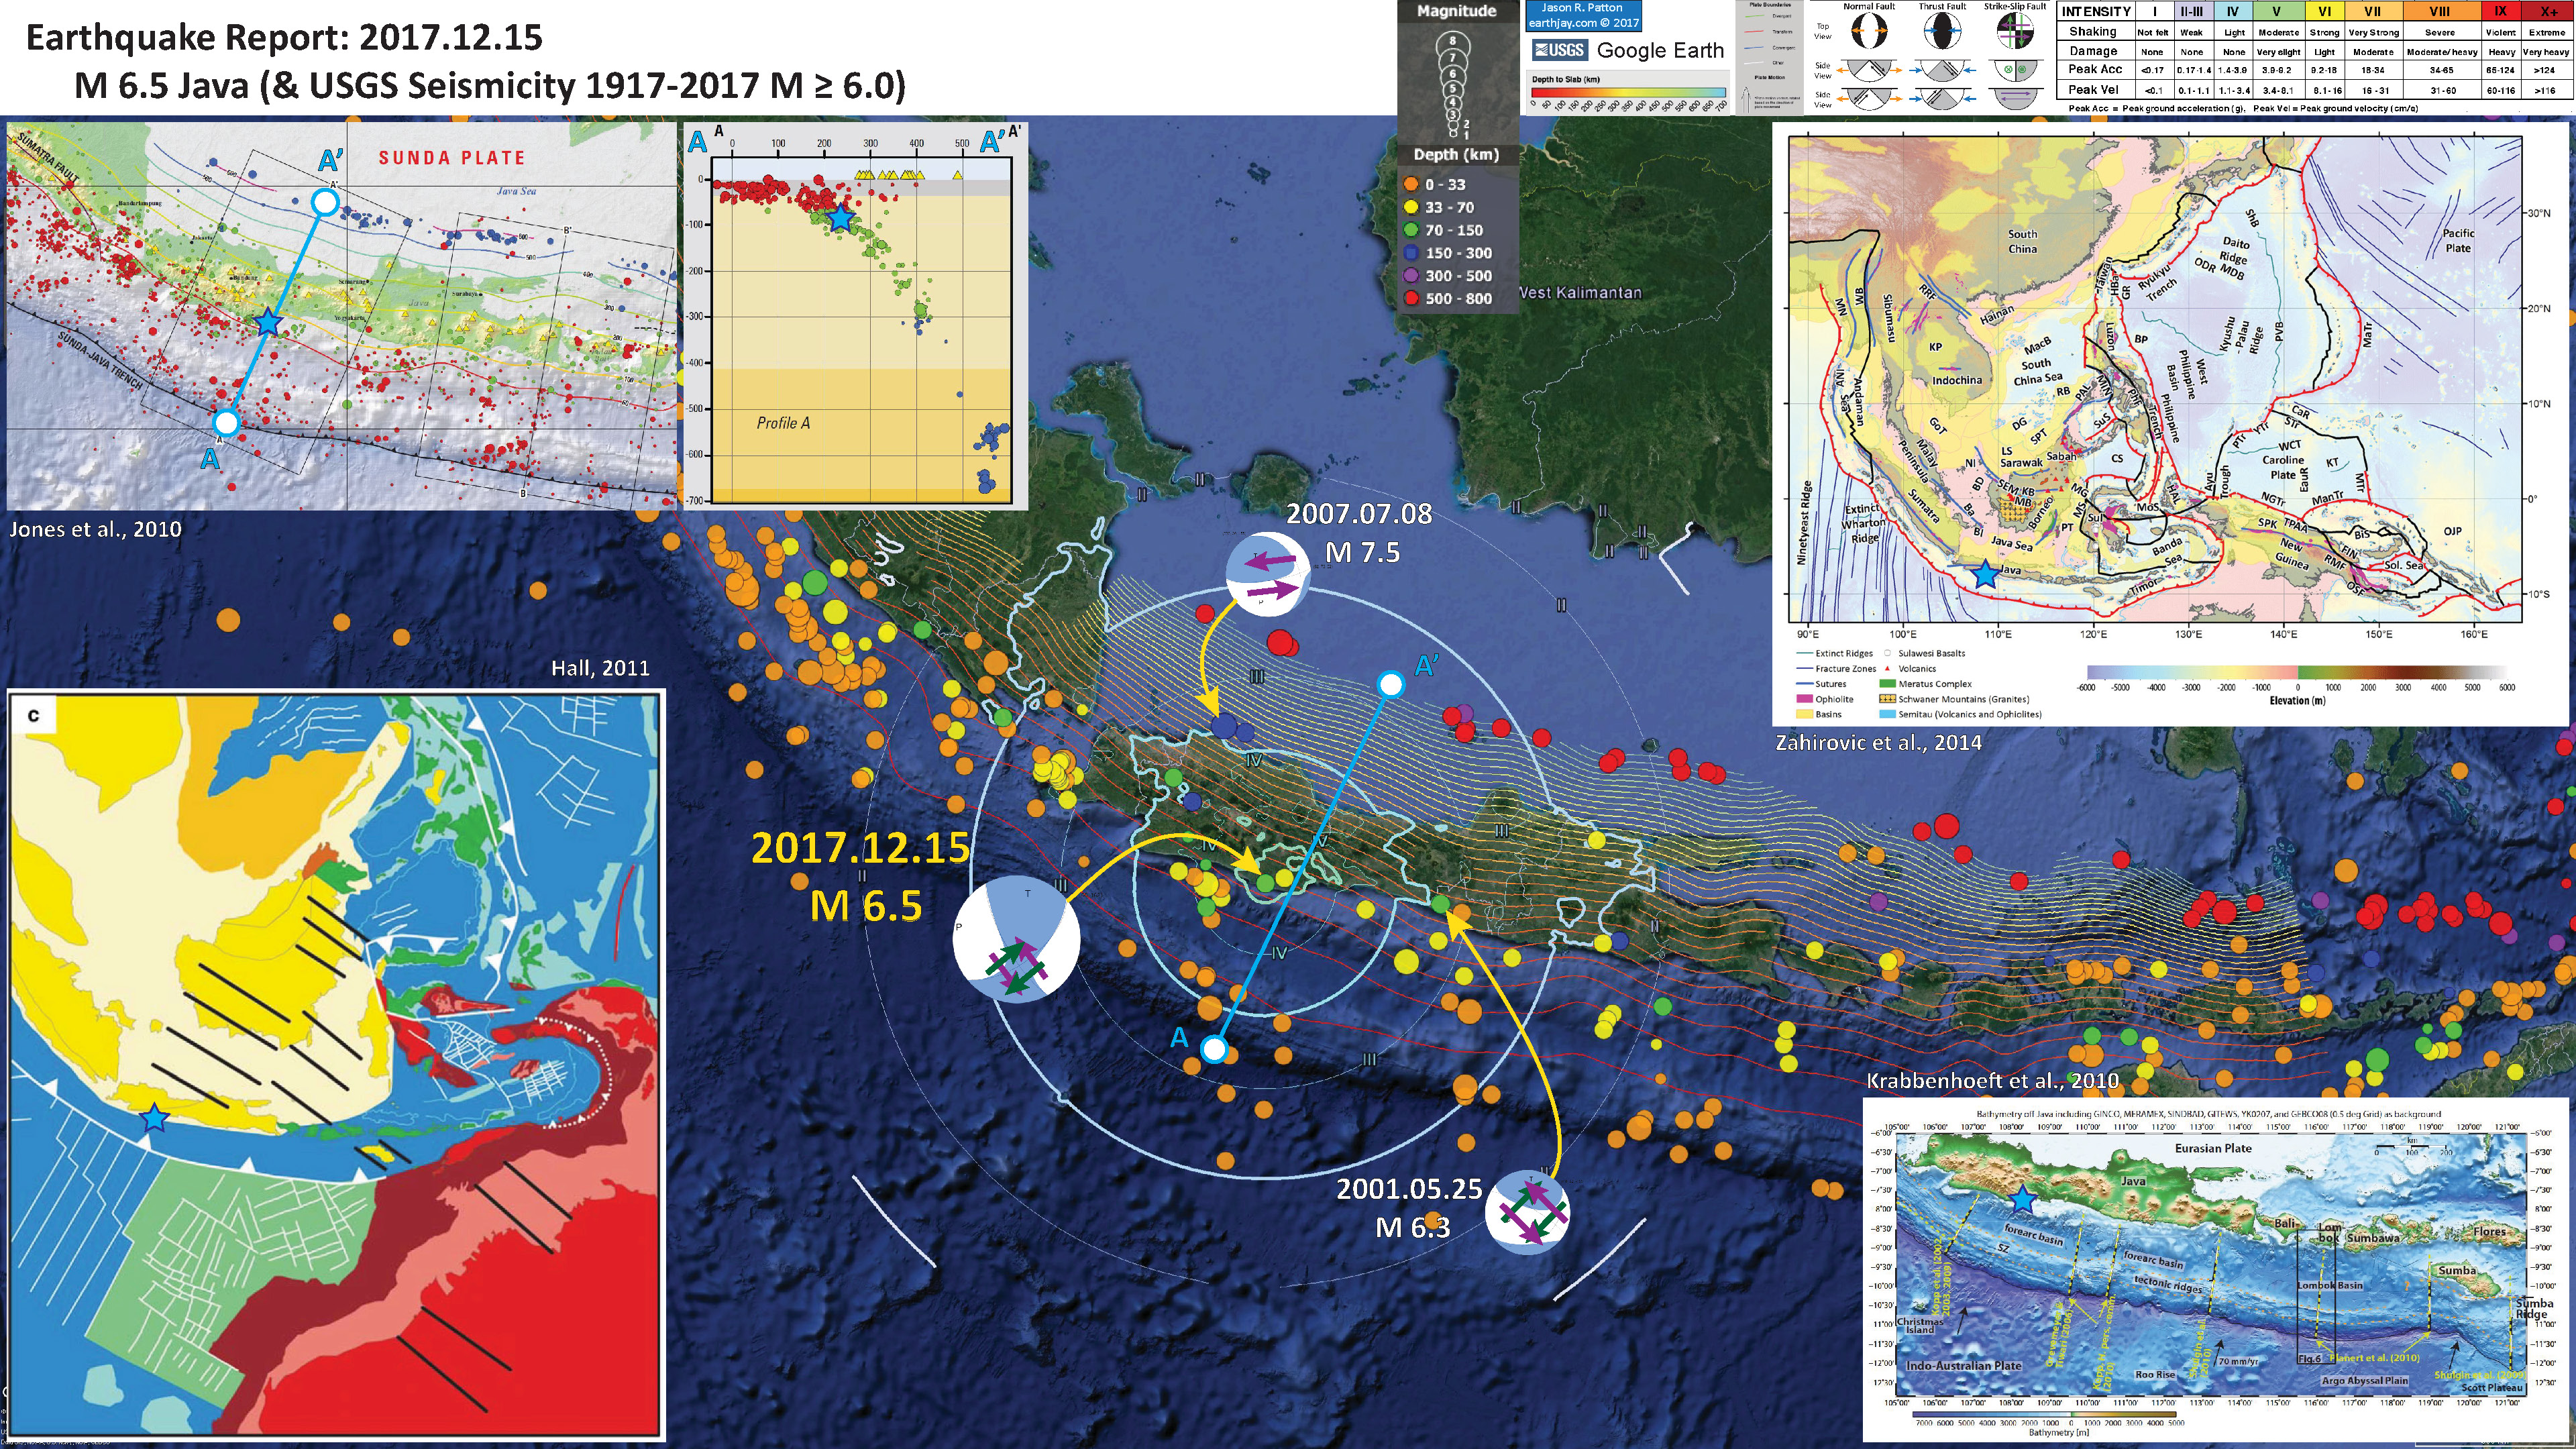
- This morning (my time) there was a deep earthquake along the subduction zone beneath Java. The M 6.5 earthquake hypocentral depth is deeper than the subduction zone megathrust fault, so it is the downgoing Australia plate (AP).
- My initial interpretation was that this earthquake is a strike-slip earthquake related to reactivated transform faults/fracture zones in the subducting AP. So, I did a little searching for prior historic earthquakes in the region to see what they might tell us about the tectonics of the subducting AP in this region. Given my knowledge of the fracture zones in the AP to the west, these fracture zones are ~north-south in orientation. Thus, my first interpretation was that this M 6.5 earthquake was a left-lateral strike-slip earthquake on a north-northwest striking (oriented) fault.
- However, looking into these historic earthquakes, there are two good analogues. On 2001.05.25 there was an earthquake with magnitude of M 6.3 to the east of today’s M 6.5 earthquake, with a similar depth relation to the downgoing plate (it was also within the AP). This M 6.3 has a similarly oriented moment tensor.
- Then I found a deeper earthquake (that plots closer to the depth of the downgoing AP, but does not have a thrust moment tensor, so is probably in the AP). This earthquake has a fault slip model from the USGS, where they inverted seismic data to interpret the M 7.5 earthquake to be a left-lateral strike-slip earthquake on an ~east-west fault. This did not fit my hypothesis about north-south fracture zones. So, I realized I needed to look at the magnetic anomaly data (and any other sources about the structures in the AP south of Java).
- The fracture zones are differently oriented south of Java. In the Hall (2011) inset map in the interpretive poster, the fracture zones are oriented to the northwest, and the normal faults associated with spreading ridge tectonics are oriented to the northeast. So, perhaps the M 7.5 earthquake was on a reactivated spreading ridge fault and the 2017 M 6.5 and 2001 M 6.3 are on reactivated fracture zone faults. This leads me to my original interpretation, that the M 6.5 earthquake is a left-lateral strike-slip fault earthquake. Of course, this is still just an hypothesis. Since the earthquake is so deep, we will never be able to observe offset geomorphic features like we can for earthquakes on land.
2017.12.15 M 6.5 Java

2017 Earthquake Subsidiary Reports
- There were some earthquakes that were of particular interest that did not make the magnitude threshold for the poster and discussion above. I include these here.
- There was an earthquake in the Arctic on 2017.01.08, along the channel of one of the major northwest passages. At first, I thought: “intraplate!” This earthquake is not along a plate boundary (though there are many examples of intraplate earthquakes). What led to this seismicity? Perhaps it is due to intraplate deformation along pre-existing fault systems. Perhaps it is related to internal deformation of the crust due to stressed from post-glacial rebound. I am still not sure. There is sparce historic seismicity here and I only spent a few hours looking through the literature. If anyone has an explanation, I would love to hear their ideas. One confounding factor is that this region is covered in ice at least most of the year, so there is probably a limitation to the subsurface geophysical exploration data (e.g. seismic reflection/refraction, seismic tomography, etc.).
2017.01.08 M 5.8 Arctic

- There was an earthquake yesterday in the Gulf of California nearby a series of earthquakes that happened in 2015 and earlier in 2013. The 2017 and 2013 earthquakes are happening along a fault that forms the Carmen Basin and the 2015 earthquakes are rupturing a fault that appears to be in the middle of the Farallon Basin. Here is my Earthquake Report for the 2013 earthquake (an early report, so it is rather basic). Here is my Earthquake Report for the 2015 earthquake sequence. This is an update to the initial 2015 report.
- 2013.10.19 M 6.4
- 2015.09.13 M 6.6
- 2015.09.13 M 5.3
- 2015.09.13 M 4.9
- 2015.09.13 M 5.2
- 2017.03.29 M 5.7
2017.03.29 M 5.7 Gulf of California
Here are the USGS web pages for these earthquakes
2013
2015
2017

- This is an interesting earthquake for a number of reasons. The epicenters of the largest earthquakes in this series (M 6.2 and M 6.3) align just off-strike from the Dalton section of the Denali fault (DF) which was mapped as having offset Holocene features by Plafker et al (1977), though there were no numerical ages to support their interpretation. This is just north of the Chilkat River section of the DF and just north of the Chatham Strait section of the DF. These sections of the Denali fault have not been found to be active (though they may be and today’s earthquake sequence suggests that they are!). There are many faults mapped in this region based upon the British Columbia data catalogue.
- The moment tensor for the M 6.3 is also slightly misaligned to the orientation (strike) of the Denali fault here. Also interesting because the USGS has been putting forth significant effort on an investigation of the Quuen Charlotte (QCF)/Fairweather fault to the south of these earthquakes. The Chatham Strait fault splinters eastwards from the QCF and connects to the Denali fault just south of this sequence. The Chatham Strait fault was recognized to have dextral slip (right-lateral strike-slip) by Hudson et al. (1982; and references therein) using offsets of geologic units. These and earlier authors found up to 150 km of separation (offset) of these post-middle Cretaceous rocks.
- UPDATE: Dr. Rick Koehler (UNR) informs me that the Chilkat section is now included in the Dalton section of the Denali fault.
- Dr. Sean Bemis posted this model on Sketchfab. Dr. Bemis used 1948 aerial imagery, in Agisoft Photoscan software, to create this 3-D model using the method called “Structure For Motion” (SFM). He then exported the model to Sketchfab. Agisoft has academic pricing for their software. However, there is also free software available that does the stuff the Photoscan does (though one may need to use multiple apps).
- There is a north-south lineation that aligns nicely with the strike-line formed between the M 6.3 & M 6.2 epicenters (not shown on the 3-D model).
2017.05.01 M 6.3 British Columbia

- We are still having a series of earthquakes in southeastern Idaho. This earthquake appears related to the Bear Valley fault (BVF) system, which is a normal fault system related to extension in the Basin and Range geomorphic province. Here is the USGS web page for this M 5.3 earthquake.
- This part of Idaho has a geologic basement that was folded and faulted during the Sevier Orogeny, a period of compressional tectonics between approximately 140 million years (Ma) ago and 50 Ma. Basin and Range extension occurred at a much later time, in the Late Cenozoic (e.g. in northwestern Nevada, it has been demonstrated that the extension is post 15-17 Ma (Colgan et al., 2004, 2006).
2017.09.02 M 5.3 Idaho

- Today there was an earthquake in the state of Delaware, a region that does not have many mapped surface faults (I could not find any active faults in a couple hours of lit review). This area also does not have much historic seismicity, however there is an Open File Report from the Delaware Geological Survey, published in 2001. Today’s M 4.1 earthquake matches the record for the largest earthquake of record. There was a M 4.1 in the Wilmington, Delaware region on 1871.10.09 (see OFR42 linked above). The Wilmington region seems to be the most seismically active part of Delaware. Today’s earthquake, to the northeast of Dover, Delaware, happened in a place that has only had a single earthquake in the historic record (M 3.3 on 1879.03.26).
- The earthquake happened along the coast plain, where the surficial geology is mapped as marsh deposits (underlain by Quaternary sediments, then by Tertiary sediments). I include a geological map below, along with a cross section. There does not appear to be any structural control for today’s earthquake (but I have only spent a couple hours on this, and the cross section is not very deep). To the south, in Maryland, there is an impact structure (from a Bolide impact). But the structures from this probably don’t extend this far north. There is probably some structures related to the active tectonics of the past (as mapped in the Appalachans to the west), and this earthquake is probably reactivating one of those structures.
- Also, there is a possible chance that this is a foreshock. But we won’t know until later if this is the case.
- Here is the USGS website for this 2017.11.30 M 4.1 earthquake.
2017.11.30 M 4.1 Delaware
