There was an earthquake yesterday in the Gulf of California nearby a series of earthquakes that happened in 2015 and earlier in 2013. The 2017 and 2013 earthquakes are happening along a fault that forms the Carmen Basin and the 2015 earthquakes are rupturing a fault that appears to be in the middle of the Farallon Basin. Here is my Earthquake Report for the 2013 earthquake (an early report, so it is rather basic). Here is my Earthquake Report for the 2015 earthquake sequence. This is an update to the initial 2015 report.
- 2013.10.19 M 6.4
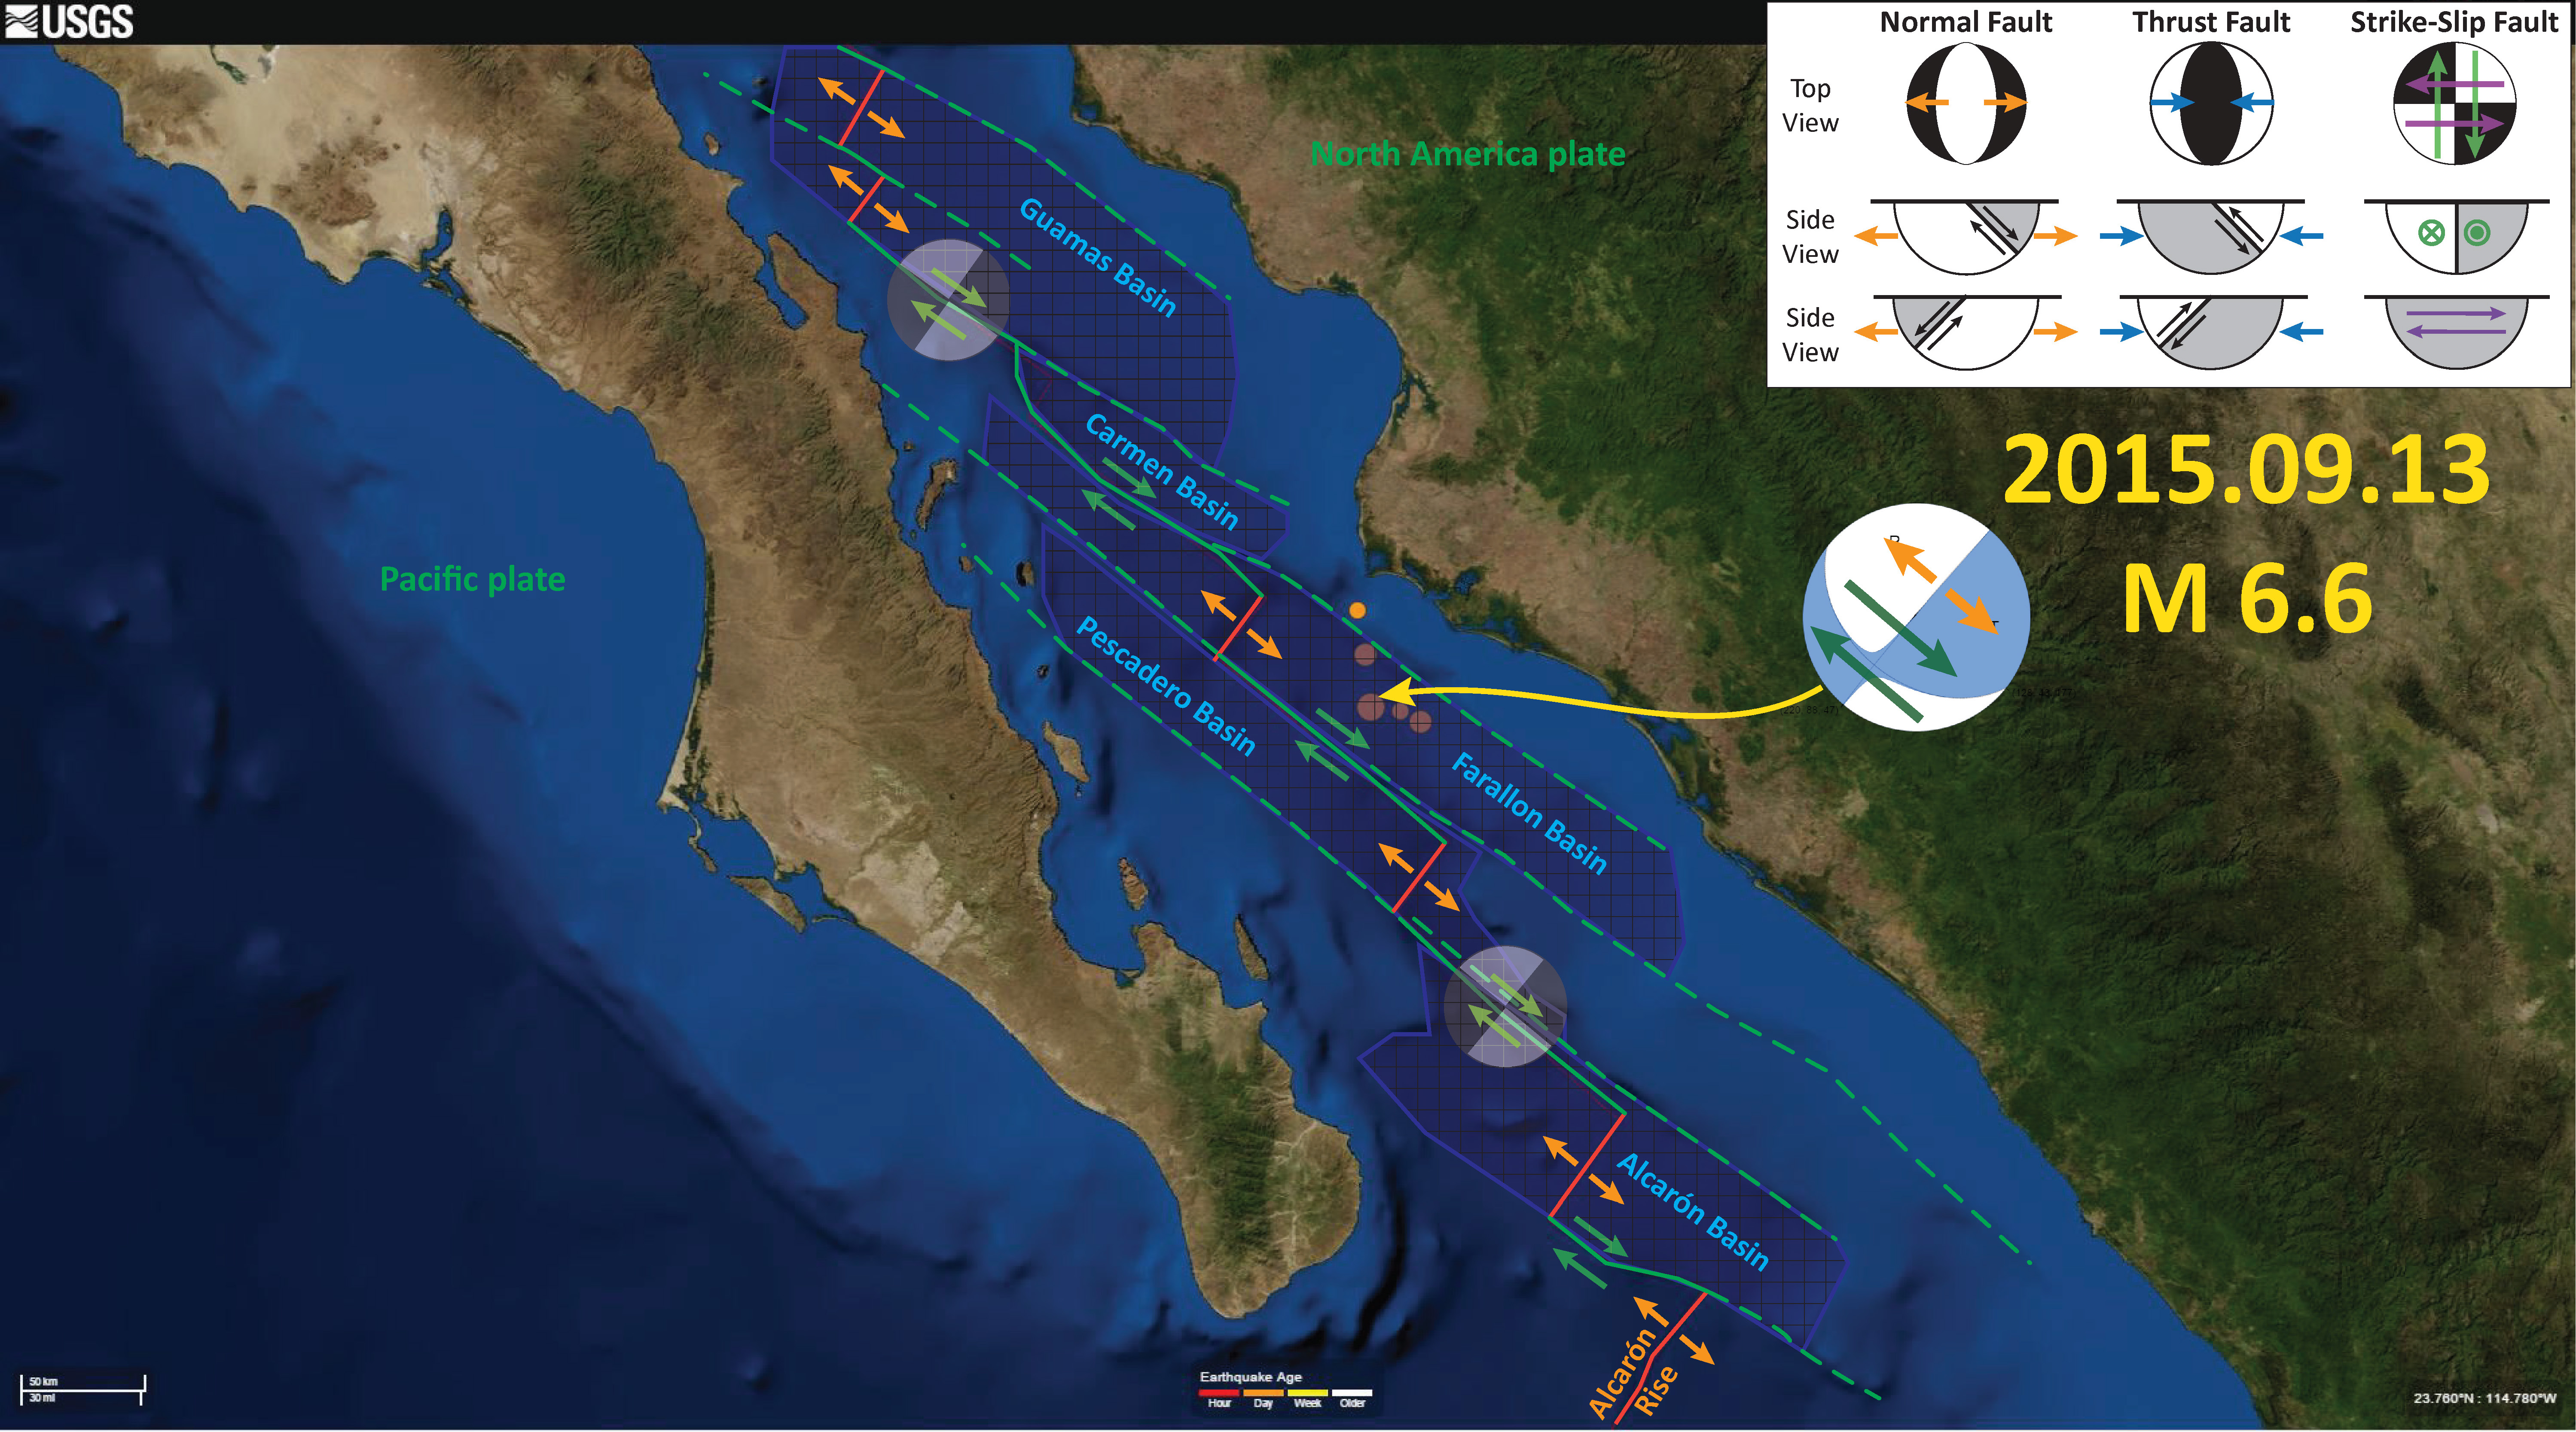
- 2015.09.13 M 6.6
- 2015.09.13 M 5.3
- 2015.09.13 M 4.9
- 2015.09.13 M 5.2
- 2017.03.29 M 5.7
Here are the USGS web pages for these earthquakes
2013
2015
2017
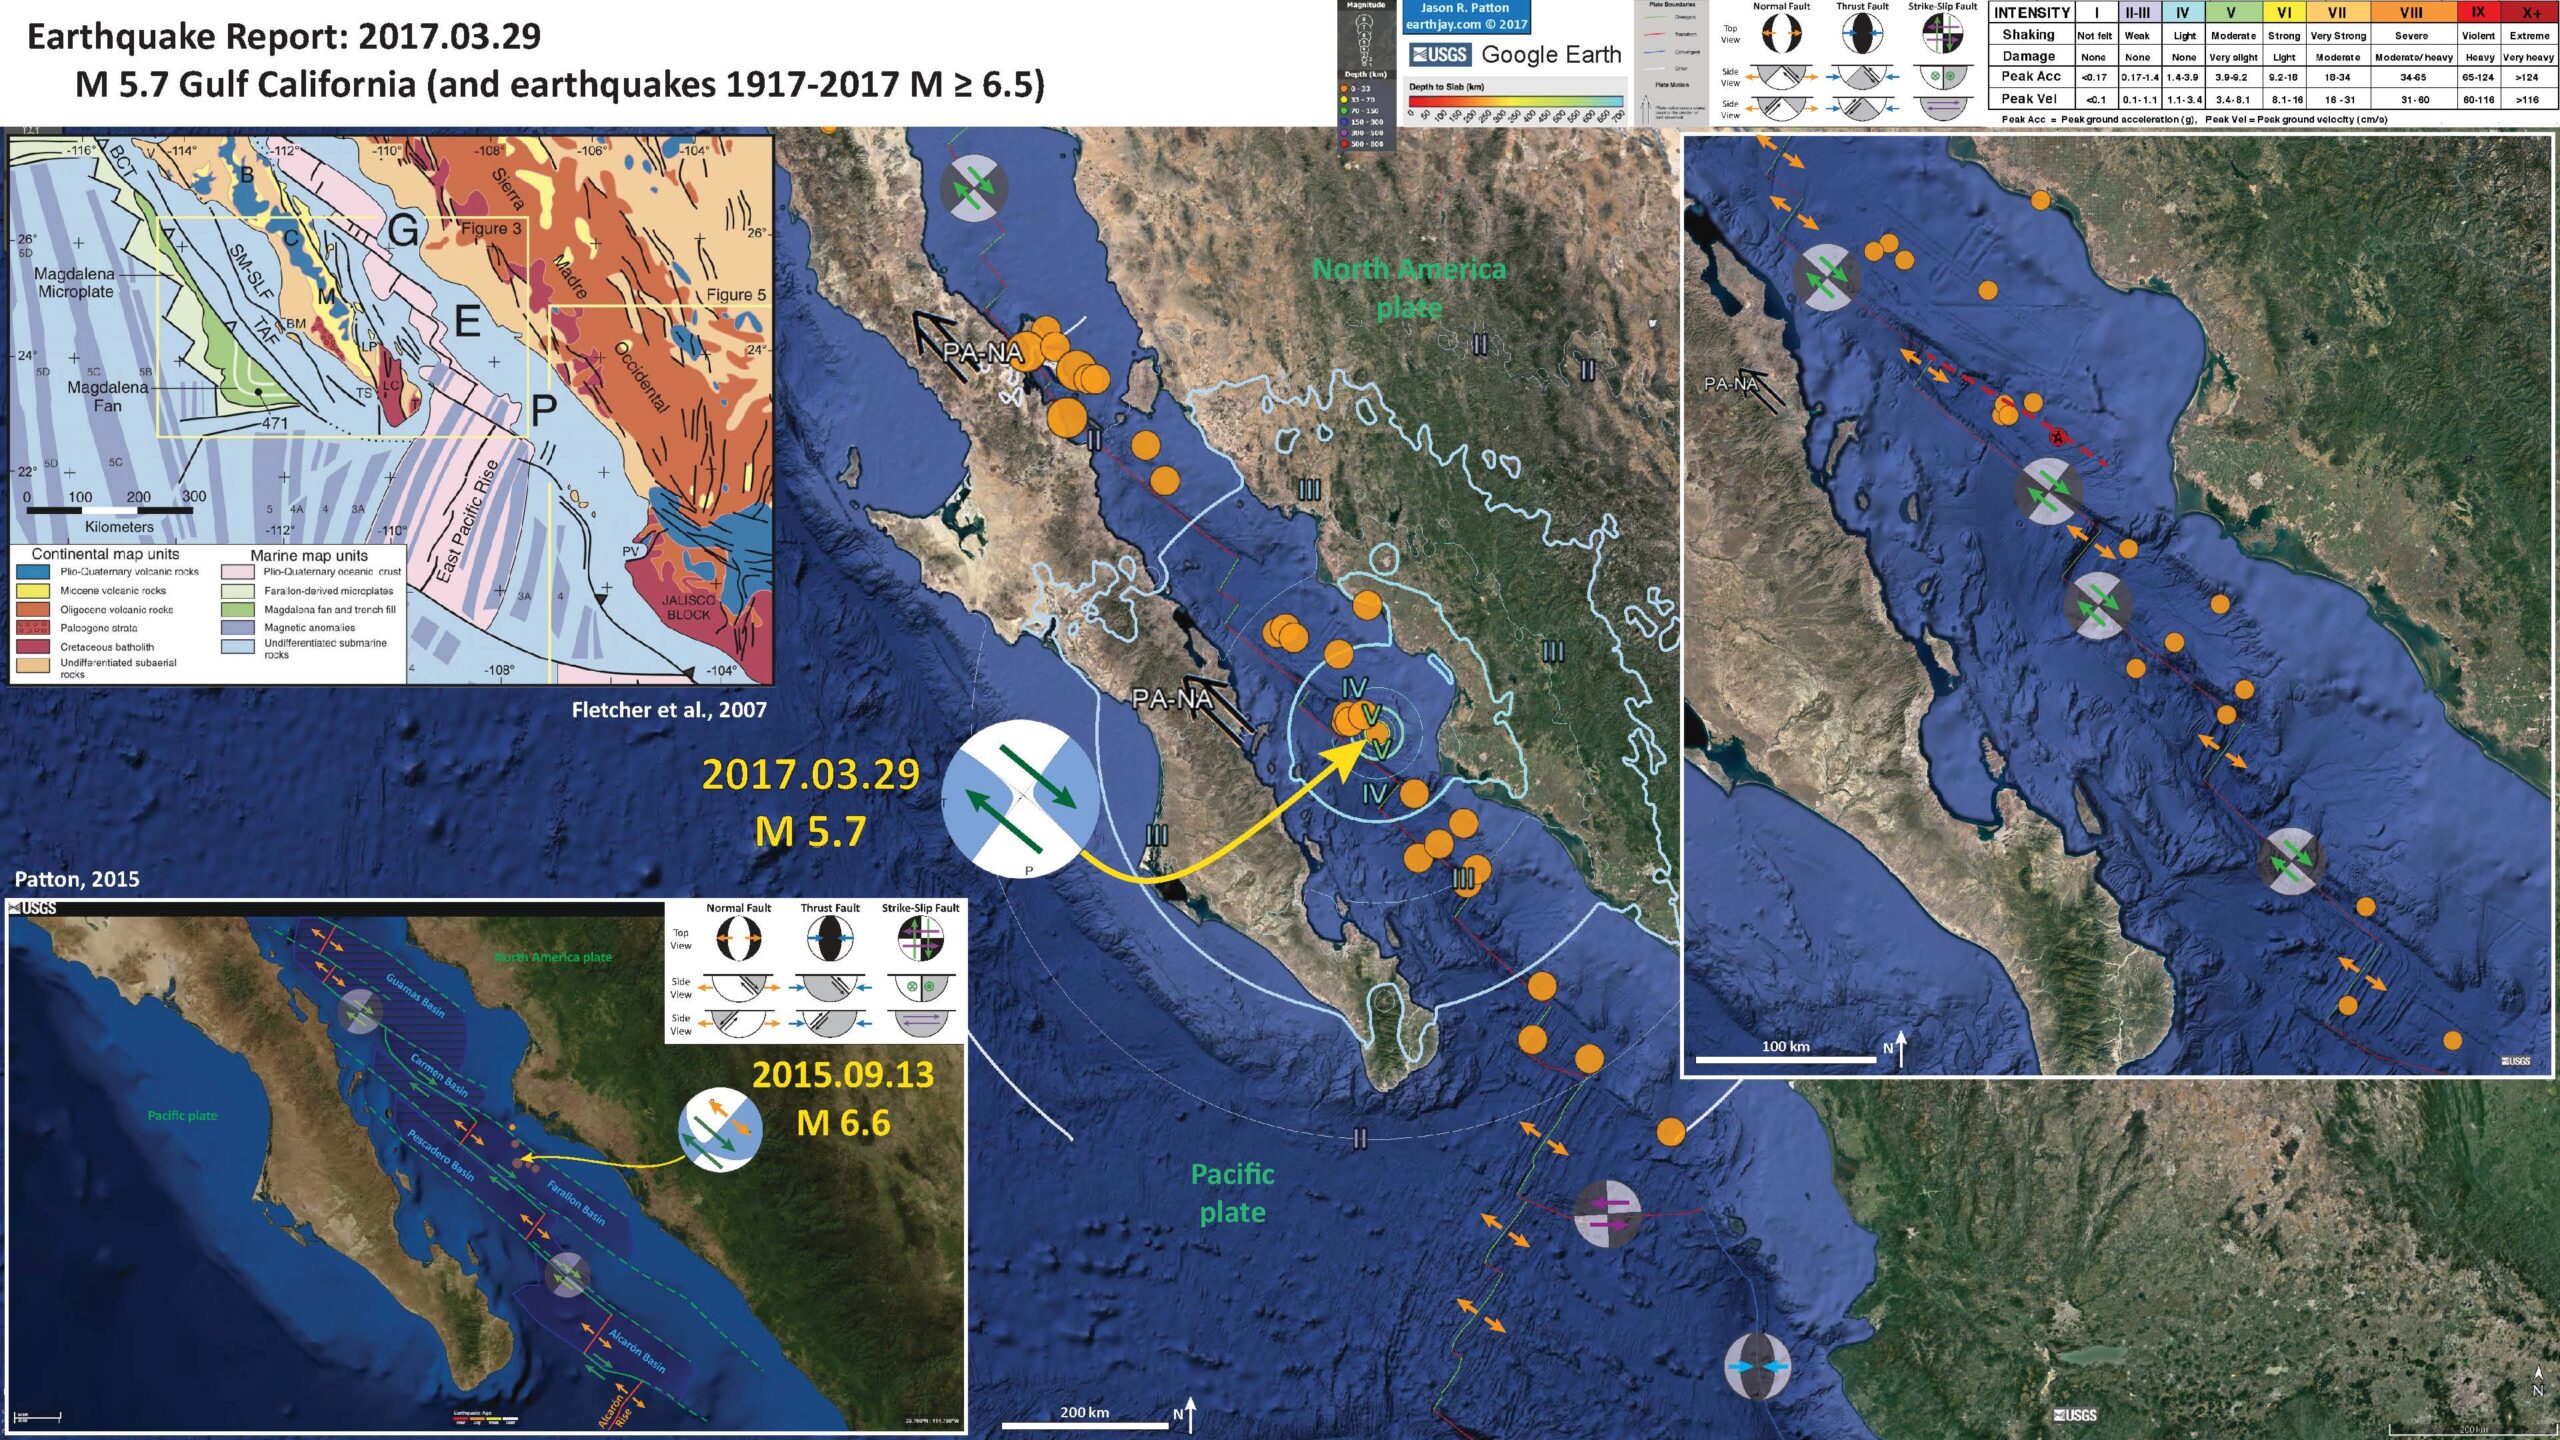
Below is my interpretive poster for this earthquake.
I plot the seismicity from the past month, with color representing depth and diameter representing magnitude (see legend). I include the USGS epicenters for earthquakes from 1917-2017 with magnitudes M ≥ 6.5.
- I placed a moment tensor / focal mechanism legend on the poster. There is more material from the USGS web sites about moment tensors and focal mechanisms (the beach ball symbols). Both moment tensors and focal mechanisms are solutions to seismologic data that reveal two possible interpretations for fault orientation and sense of motion. One must use other information, like the regional tectonics, to interpret which of the two possibilities is more likely. I suspect that the fault that ruptured is eastward vergent (dipping to the west), so the west dipping nodal plane is probably the primary fault plane. However, this region of Kamchatka has numerous upper plate thrust and reverse faults (so the primary fault plane could be the other one, dipping to the east).
- I also include the shaking intensity contours on the map. These use the Modified Mercalli Intensity Scale (MMI; see the legend on the map). This is based upon a computer model estimate of ground motions, different from the “Did You Feel It?” estimate of ground motions that is actually based on real observations. The MMI is a qualitative measure of shaking intensity. More on the MMI scale can be found here and here. This is based upon a computer model estimate of ground motions, different from the “Did You Feel It?” estimate of ground motions that is actually based on real observations.
- In the upper left corner I include a map that shows the tectonic setting of this region, with the geological units colored relative to their age and type (marine or continental).This is from a paper that discusses the interaction between spreading ridges and subduction trenches (Fletcher et al., 2007).
- In the upper right corner I include a larger saled version of this map with the same seismicity plotted, but without the MMI contours. One can see the shape of the seafloor and how this is formed due to plate tectonics. Note the spreading ridge in the lower right corner and the parallel ridges formed as the plates extend from the ridge. The magnitude scale is slightly different than the main map.
- In the lower left corner I include a map from the 2015 earthquake series. I include this because I labeled the Basins formed by the enechelon steps in this plate boundary. In my 2015 report, I provide more maps that include the names of some of these fracture zones (the transform plate boundary strike-slip faults).
I include some inset figures in the poster.

- Here is a great diagram showing the major faults in the region. I include their figure caption below.
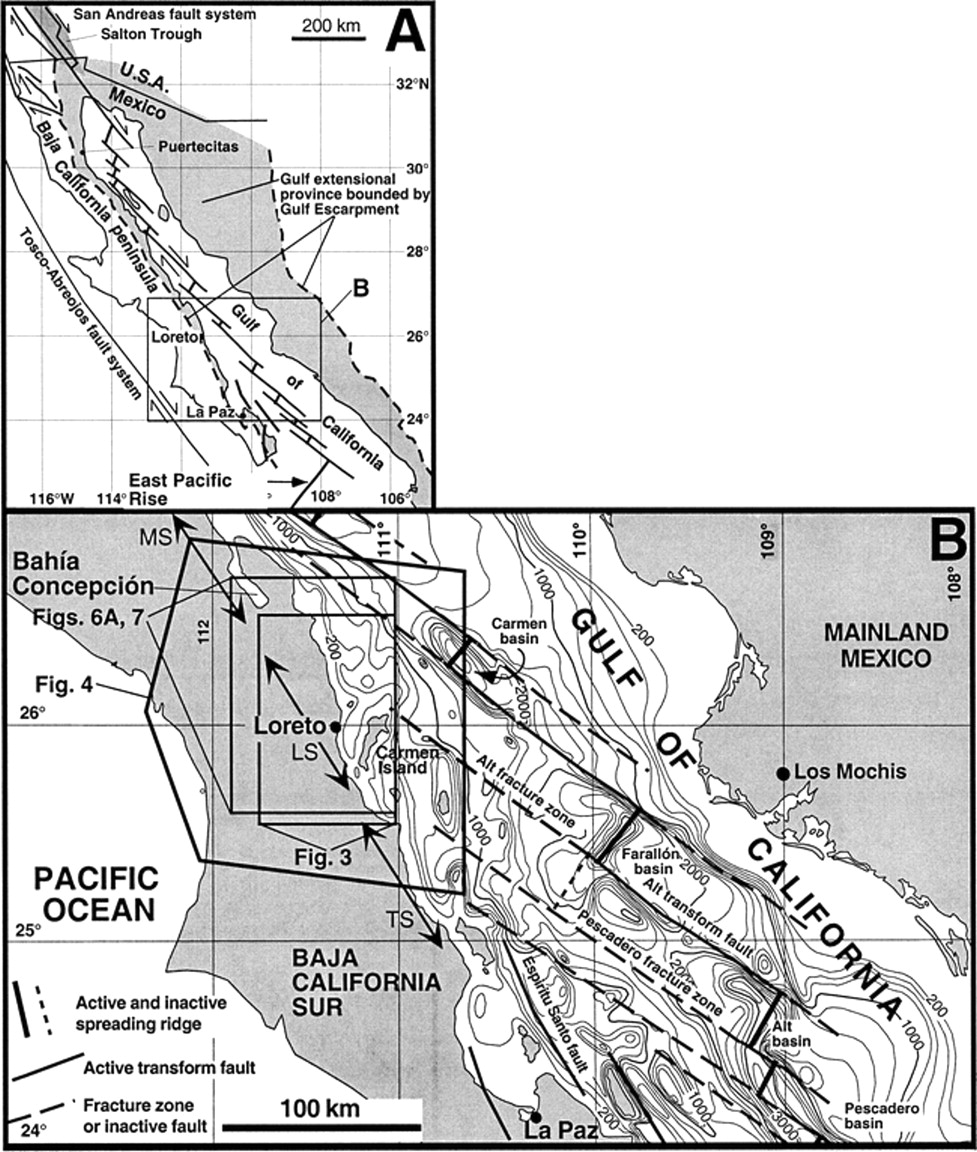
(A) Simplified map of the Gulf of California region and Baja California peninsula showing the present plate boundary and some major tectonic features related to the plate-tectonic history since 12 Ma. The Gulf extensional province in gray is bounded by the Main Gulf Escarpment (bold dashed lines), which runs through the Loreto area and is shown in Figure 3. The Salton trough in southern California is merely the northern part of the Gulf extensional province. (B) Map of part of the southern Gulf of California and Baja California peninsula showing bathymetry (in meters), the transform–spreading-ridge plate boundary, and the location of subsequent figures with maps. The bathymetry is after a map in Ness and Lyle (1991) and the transform–spreading-ridge plate boundary is from Lonsdale (1989). The lines with double arrows are the three proposed rift segments modified here after Axen (1995); MS—Mulege´ segment, LS—Loreto segment, TS—Timbabichi
segment.
- This map shows the magnetic anomalies and the geologic map for the land and the youngest oceanic crust.
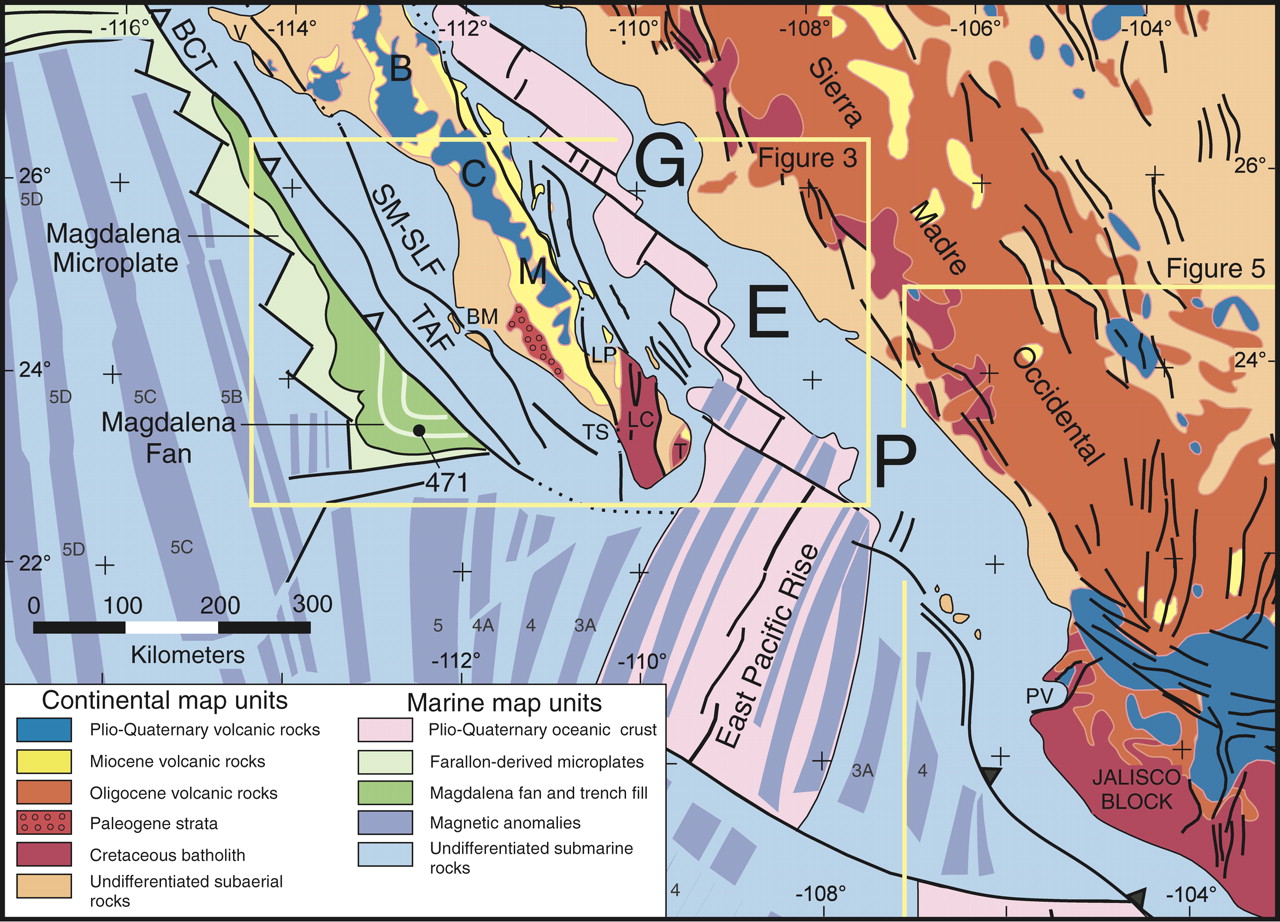
(A) Tectonic map of the southern Baja California microplate (BCM) and Gulf of California extensional province (GEP). The Magdalena fan is deposited on oceanic crust of the Farallon-derived Magdalena microplate located west of Baja California. Deep Sea Drilling Project Site 471 is shown as black dot on the Magdalena fan. Abbreviations: BCT—Baja California trench, BM—Bahia Magdalena, LC—Los Cabos block, T—Trinidad block, LP—La Paz, PV—Puerto Vallarta, SMSLF—Santa Margarita–San Lazaro fault, TAF—Tosco-Abreojos fault, TS—Todos Santos, V—Vizcaino peninsula. Geology is simplifi ed from Muehlberger (1996). Interpretation of marine magnetic anomalies, with numbers denoting the chron of positively magnetized stripes, is from Severinghaus and Atwater (1989) and Lonsdale (1991).
- This map shows a more broad view of the magnetic anomalies through time.
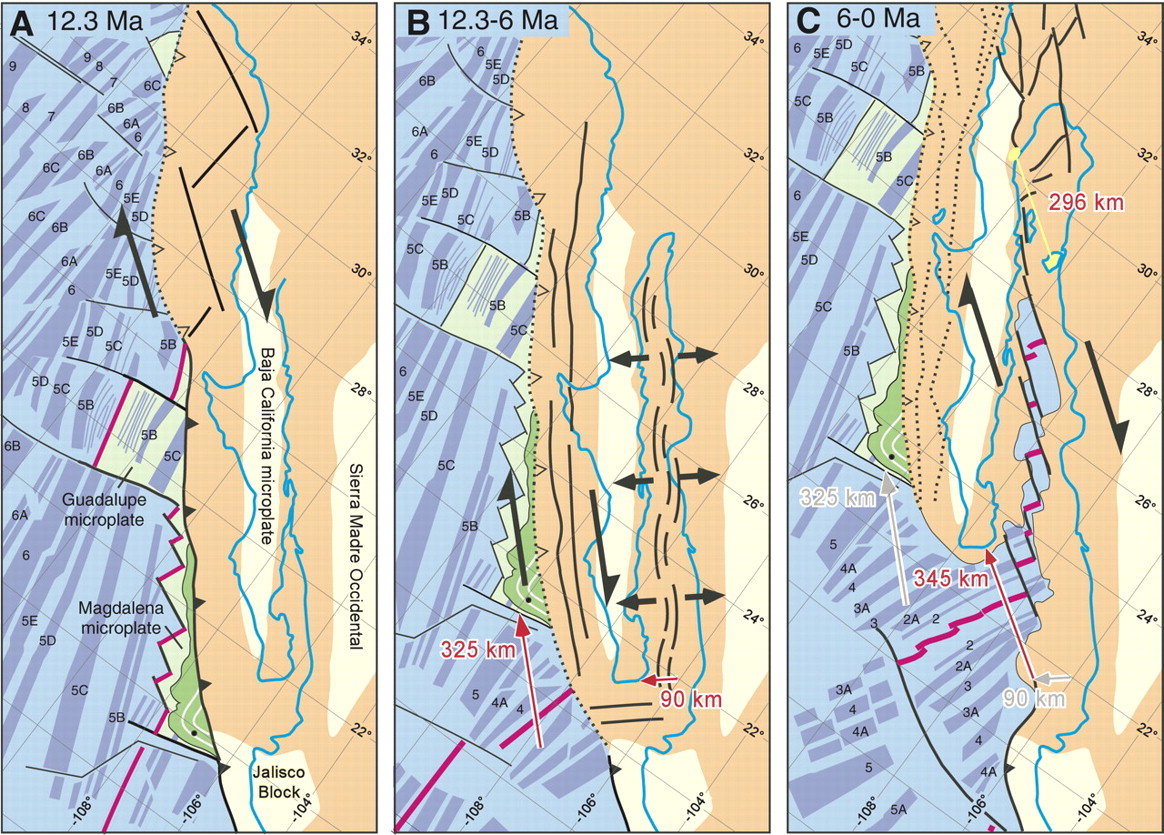
Map-view time slices showing the widely accepted model for the two-phase kinematic evolution of plate margin shearing around the Baja California microplate. (A) Configuration of active ridge segments (pink) west of Baja California just before they became largely abandoned ca. 12.3 Ma. (B) It is thought that plate motion from 12.3 to 6 Ma was kinematically partitioned into dextral strike slip (325 km) on faults west of Baja California and orthogonal rifting in the Gulf of California (90 km). This is known as the protogulf phase of rifting. (C) From 6 to 0 Ma faults west of Baja California are thought to have died and all plate motion was localized in the Gulf of California, which accommodated ~345 km of integrated transtensional shearing. Despite its wide acceptance, our data preclude this kinematic model. In all frames, the modern coastline is blue. Continental crust that accommodated post–12.3 Ma shearing is dark brown. Unfaulted microplates of continental crust are light tan. Farallon-derived microplates are light green. Middle Miocene trench-filling deposits like the Magdalena fan are colored dark green. Deep Sea Drilling Project Site 471 is the black dot on the southern Magdalena microplate. Yellow line (296 km) in the northern Gulf of California connects correlated terranes of Oskin and Stock (2003). Maps have Universal Transverse Mercator zone 12 projection with mainland Mexico fixed in present position.
- Here is the Earthquake Report Poster from the 2015 sequence.
This is a nice simple figure, from the University of Sydney here, showing the terminology of strike slip faulting. It may help with the following figures.
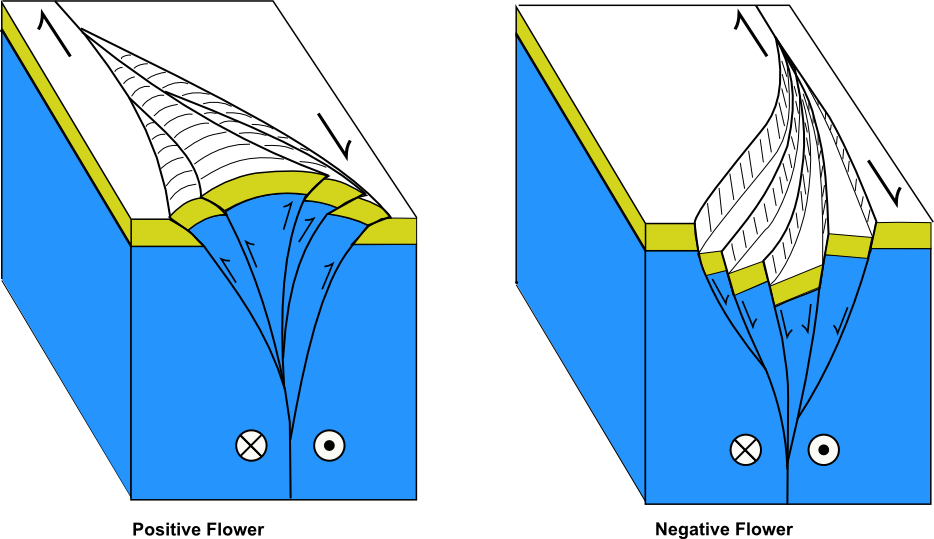
Here is a fault block diagram showing how strike-slip step overs can create localized compression (positive flower) or extension (negative flower). More on strike-slip tectonics (and the source of this image) here.
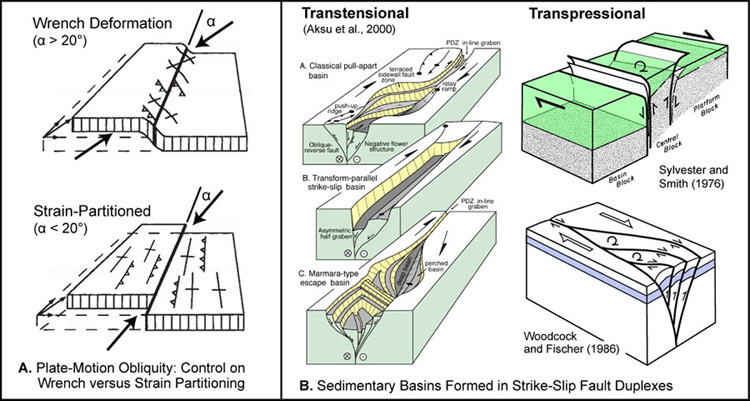
Here is another great figure showing how sedimentary basins can be developed as a result of step overs in strike slip fault systems (source: Becky Dorsey, University of Oregon, Dept. of Geological Sciences).
I also put together an animation of seismicity from 1065 – 2015. First, here is a map that shows the spatial extent of this animation.
Here is the animation link (2 MB mp4 file) if you cannot view the embedded video below. Note how the animation begins in 1965, but has the recent seismicity plotted for reference.
-
There have been two large magnitude earthquakes in this region over the past 50 years.
- 2007.09.01 M 6.1
- 2010.10.21 M 6.7
This is an animation from Tanya Atwater. Click on this link to take you to yt (if the embedded video below does not work).
Here is an animation from IRIS. This link takes you to yt (if you cannot view the embedded version below). Here is a link to download the 21 MB mp4 vile file.
This is a link to a tectonic summary map from the USGS. Click on the map below to download the 20 MB pdf file.
References:
- Fletcher, J.M., Grove, M., Kimbrough, D., Lovera, O., and Gehrels, G.E., 2007. Ridge-trench interactions and the Neogene tectonic evolution of the Magdalena shelf and southern Gulf of California: Insights from detrital zircon U-Pb ages from the Magdalena fan and adjacent areas in GSA Bulletin, v. 119, no. 11/12, p. 1313-1336.
- Umhoefer, P.J., Mayer, L., and Dorse, R.J., 2002. Evolution of the margin of the Gulf of California near Loreto, Baja California Peninsula, Mexico in GSA Bulletin, v. 114, no. 7, p. 849-868.