
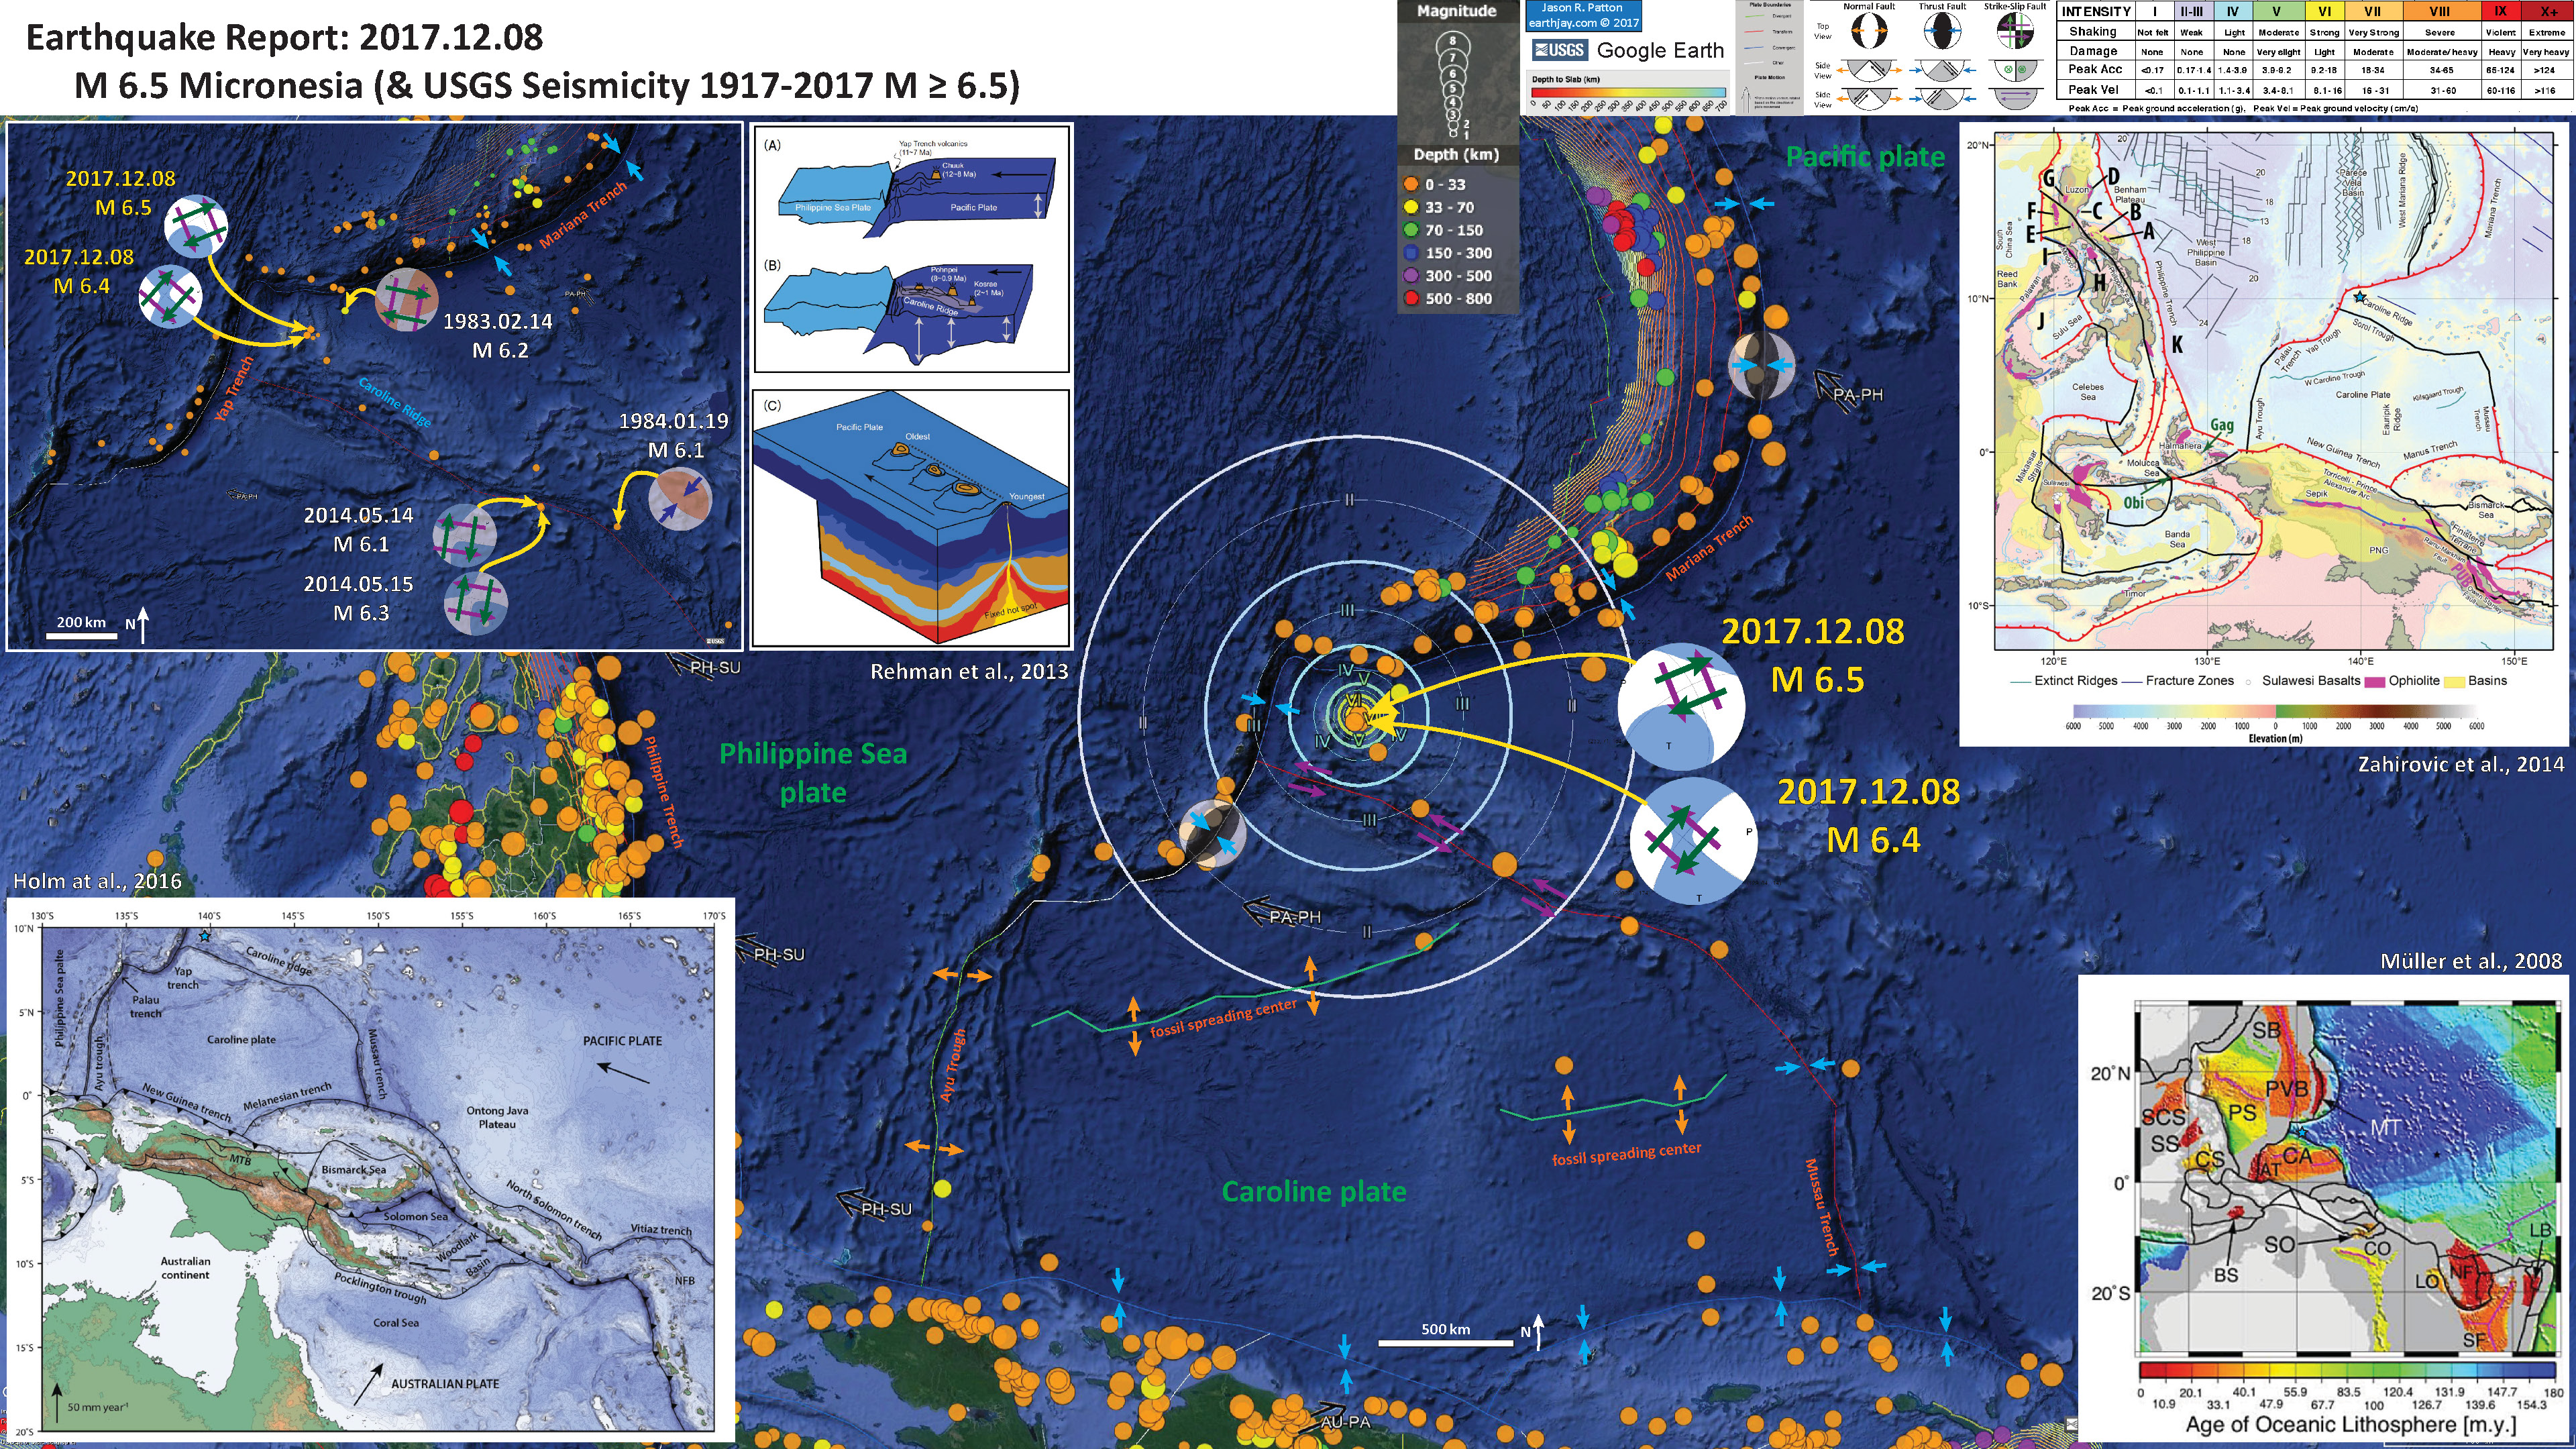
There was an earthquake sequence beginning 2017.12.08 along the northern flank of Caroline Ridge in the western Pacific Ocean, near the intersection of the Mariana and Yap trenches.
The two largest earthquakes, M 6.5 and M 6.4, are both strike-slip earthquakes. The M 6.5 is northeast of the M 6.4, so maybe this represents a northeast striking left lateral earthquake. But I rank this a low certainty interpretation. I did not find any geologic maps of this region that might show geologic structures that we might associate with this seismicity, so it is difficult to know if the alternate solution is correct (northwest striking left-lateral strike slip). However, there is possibly a transform (strike-slip) plate boundary fault associated with the southern boundary of the Caroline Ridge (this interpretation is based upon my interpretation of the “Age of Oceanic Lithosphere” map below). There may be synthetic faults to this transform boundary fault, ones sub-parallel to the main fault (the red fault line with purple arrows showing sense of motion). In this case, I would interpret the M 6.5 and M 6.4 earthquakes as northwest striking left-lateral earthquakes.
Update: the earthquake magnitudes are now M 6.4 and M 6.3 respectively.
The Yap and Mariana trenches are formed by the subduction of the Pacific plate beneath the Philippine Sea plate.
The Caroline Islands are volcanic islands formed when the Pacific plate passed over a hotspot (Rehman et al., 2013). As in Hawaii (and other young hotspot volcanic island chains), the younger islands are to the east. The westward movement of this oceanic ridge, formed similar in fashion to the Ninetyeast Ridge, has interacted with the subduction zone in a way that has indented the trench. Prior to the ridge hitting the trench, the Mariana trench may have extended further south. As the ridge interacted with the subduction zone, the megathrust fault moved westwards, offsetting the trench and forming the Yap Trench. There is a great illustration from Fujiwara et al. (2000) below.
There are fossil oceanic spreading ridges within the Caroline plate. These show up in the bathymetry and evidenced by the magnetic anomaly data.
Below is my interpretive poster for this earthquake.
I plot the seismicity from the past month, with color representing depth and diameter representing magnitude (see legend). I include earthquake epicenters from 1917-2017 with magnitudes M > 6.5.
I plot the USGS fault plane solutions (moment tensors in blue and focal mechanisms in orange) for the M 6.5 and M 6.4 earthquakes, in addition to some relevant historic earthquakes.
- I placed a moment tensor / focal mechanism legend on the poster. There is more material from the USGS web sites about moment tensors and focal mechanisms (the beach ball symbols). Both moment tensors and focal mechanisms are solutions to seismologic data that reveal two possible interpretations for fault orientation and sense of motion. One must use other information, like the regional tectonics, to interpret which of the two possibilities is more likely.
- I also include the shaking intensity contours on the map. These use the Modified Mercalli Intensity Scale (MMI; see the legend on the map). This is based upon a computer model estimate of ground motions, different from the “Did You Feel It?” estimate of ground motions that is actually based on real observations. The MMI is a qualitative measure of shaking intensity. More on the MMI scale can be found here and here. This is based upon a computer model estimate of ground motions, different from the “Did You Feel It?” estimate of ground motions that is actually based on real observations.
- I include the slab contours plotted (Hayes et al., 2012), which are contours that represent the depth to the subduction zone fault. These are mostly based upon seismicity. The depths of the earthquakes have considerable error and do not all occur along the subduction zone faults, so these slab contours are simply the best estimate for the location of the fault. The depth is probably not very well constrained due to the geometry and lack of seismometer coverage in the oceanic setting.
Here are the USGS pages for the main earthquake in this sequence:
-
I include some inset figures.
- In the lower left corner is a great figure showing the generalized plate tectonic boundaries in this region of the equatorial Pacific Ocean (Holm et al., 2016). I place a blue star in the general location of the M 6.5 and M 6.4 earthquakes (also plotted in other inset figures).
- In the upper right corner I include a large scale view of the regional tectonics (Zahirovic et al., 2014). Plate boundary fault symbology (and other features, like fracture zones) is shown in the legend. I place a blue star on the map in the general location of this earthquake epicenter. There are two east-west green lines in the Caroline plate. These are the axes of fossil spreading centers (‘W. Caroline Trough’ & ‘Kilssguard Trough’).
- In the lower right corner is a map that shows the age of the oceanic crust in the western Pacific (Müller et al., 2008). The big blue bleb is the older Pacific plate crust. The CA labels the Caroline plate. Note the two east-west trending magenta lines, these are the fossil spreading centers. See how the crust gets older to the north and south of these ancient spreading ridges. I also locate these spreading ridges on the main map.
- In the upper left corner is a view of the seismicity with a better view of the bathymetry than in the main map. Note how the Caroline Ridge is an ~east-west trending (N80W or so) lighter blue area, because the ocean depth is shallower here. This region of the Pacific plate may be overthickened during its formation. The M 6.4 had a pretty deep hypocenter. Even if there was some considerable uncertainty, this is a deep earthquake for oceanic crust (~7 km on average for oceanic crust).
- To the right of the inset seismicity map is an illustration that shows an interpretation about how the Caroline Islands, and surrounding crust, was formed (Rehman et al., 2013). Rehman et al. (2013) show how the Pacific plate passed over a hotspot, creating the Caroline Islands (like Hawaii) and leading to a thicker crust here (see panel B).
- Here is a map from the USGS that shows the USGS seismicity from the 20th century or so (Smocyk et al., 2010). The cross sections show the earthquake hypocenters in orientations that reveal the various types of subduction zones in this region of Earth. For example, the northern Mariana Trench shows a steeply dipping megathrust fault (and very deep seismicity), while cross section E-E’ in the southern Mariana Trench is not as deep. Click on the map to see the entire 92 MB pdf poster.

- Here is the plate tectonic map from Zahirovic et al. (2014), which shows the Sorol Trough as a fracture zone (strike-slip).

Regional tectonic setting with plate boundaries (MORs/transforms = black, subduction zones = teethed red) from Bird (2003) and ophiolite belts representing sutures modified from Hutchison (1975) and Baldwin et al. (2012). West Sulawesi basalts are from Polvé et al. (1997), fracture zones are from Matthews et al. (2011) and basin outlines are from Hearn et al. (2003)
- This is a gravity anomaly map for the western Pacific north of Papua New Guinea (Gaina and Müller, 2007). Overlain on the map are magnetic anomaly isochrons (labeled C6 for example; lower chron numbers are younger). Note the fossil spreading center on the east is just younger than isochron C8, possibly the same for the West Caroline Trough on the west. Also clearly shown on this map are the subduction zones, which have negative gravity anomalies due to the downward flexing oceanic lithosphere as it approaches the trench.

Gravity anomaly derived from satellite altimetry (Sandwell and Smith, 2005) for the Caroline sea region. Superimposed are the interpreted magnetic lineations (C8–C16 stand for chron numbers, see detailed interpretation in Figs. 3 and 4). Locations of DSDP and ODP drilling are shown in white boxes. Abbreviations: CR—Caroline Ridge, PKR—Palau Kyushu Ridge, WCR—West Caroline Ridge, KT—Kiilsgaard Trough, PVB—Parece Vela Basin, WPB — West Philippine Basin.
- Here is the crust age map from the poster (Müller et al., 2008).
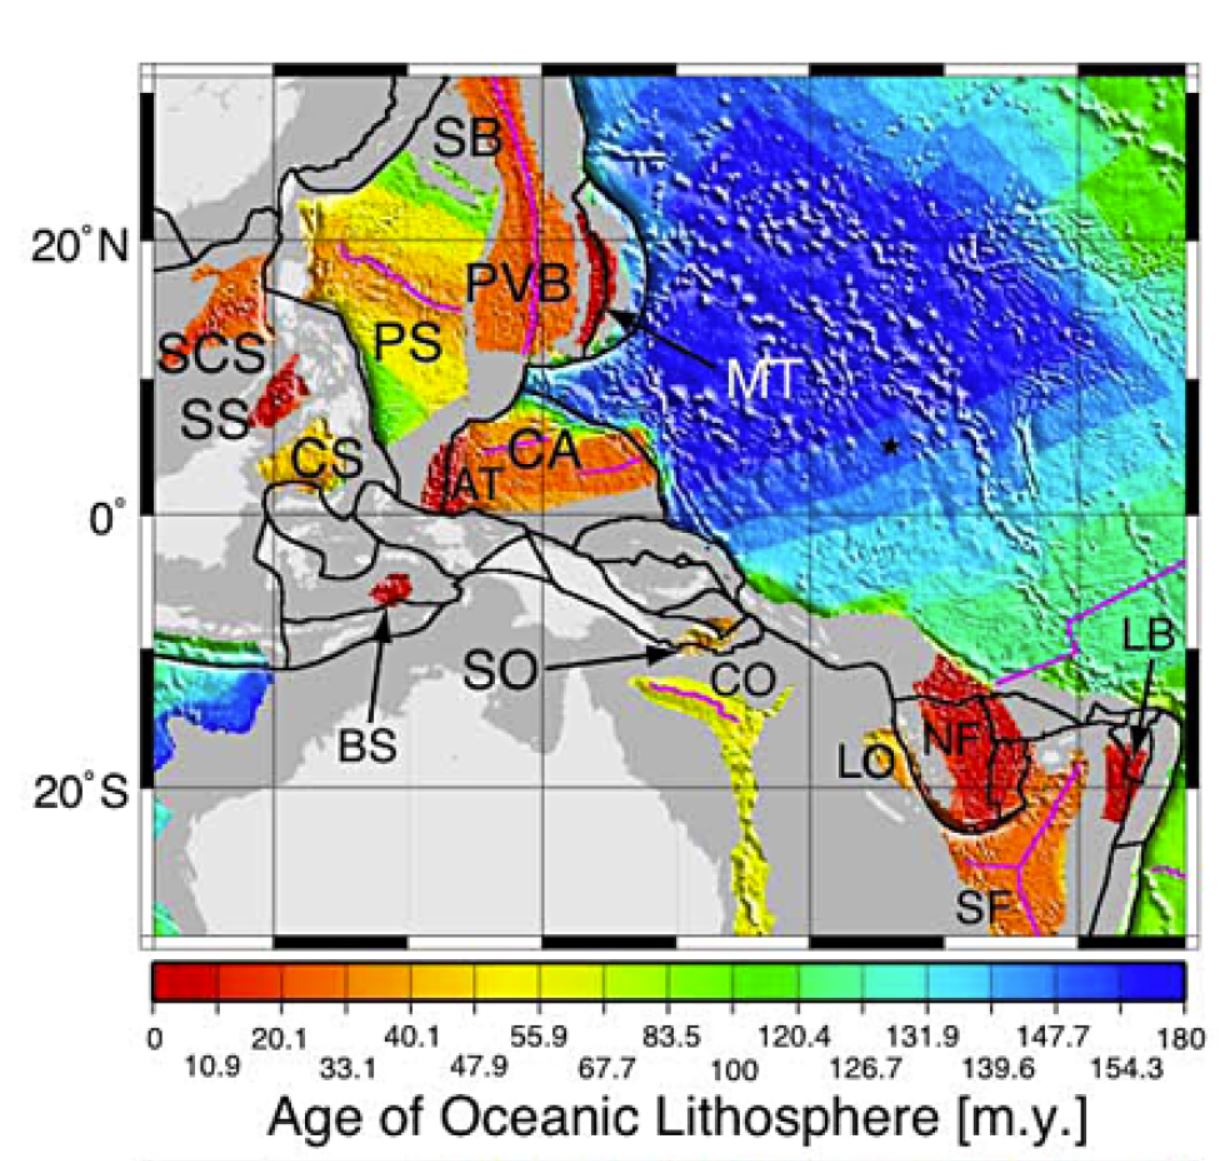
Oceanic lithospheric age. the following isochrons are shown: West Philippine Basin (18y, 20o, 21o, 24o, 26o), Caroline Sea (8o, 10o, 11o, 13y, 15o, 16y), Ayu Trough (3o, 5o), Parece Vela/Shikoku Basin (5Dy, 6o, 6By, 7o, 8o, 9o), Mariana Trough (1o, 2Ao, 3o), South China Sea (5Dy, 6o, 6By, 7o, 8o, 19o, 11o), Celebes Sea (16o, 17o, 18o, 19o, 21o), Sulu Sea (3o, 5o), South Fiji Basin (7o, 8o, 9o, 10o, 11o), North Fiji Basin (1o), Solomon Sea (17o, 18o), North Loyalty Basin (16y, 17o, 18o, 20o), and Lau Basin (1o, 2Ao, 3o). SCS, South China Sea; SS, Solomon Sea; CS, Celebes Sea; BS, Bismark Sea; PS, Philippine Sea; AT, Ayu Trough; CA, Caroline Sea; PVB, Parece Vela Basin; SB, Shikoku Basin; MT,
Marianas Trough; SO, Solomon Sea; CO, Coral Sea; LO, North Loyalty Basin; NF, North Fiji Basin; SF, South Fiji Basin; LB, Lau Basin.
- Here is another oceanic crust age map, with more details in the region of the Caroline plate (Gaina and Müller, 2007).

Fig. 12. Set of tectonic reconstructions that depict the evolution of oceanic crust north of Australia since Middle Eocene (50 Ma). Light yellow represent continental blocks, rotated present day coastline are in black, island arcs are colored in pale brown. Grey areas depict regions with insufficient data to constrain paleo-age grids. Black lines are active plate boundaries (if dashed—unconstrained plate boundary), light grey lines are extinct spreading ridges. The two blue circles show the location of the Manus (west) and Caroline (east) hotspots assuming an underlying Pacific mantle. An additional position for the Manus hotspot depicts its location if part of moving Indian Ocean hotspot (green circle). Large Igneous Provinces (in this case Ontong Java Plateau, NE of Australia and Kerguelen and Broken Ridge plateaus, SWof Australia) are colored in magenta.
- This is a cross section showing how Fujiwara et al. (2000) interpret how the Pacific plate (Caroline Ridge) subducts beneath the Philippine Sea plate at the Yap Trench.
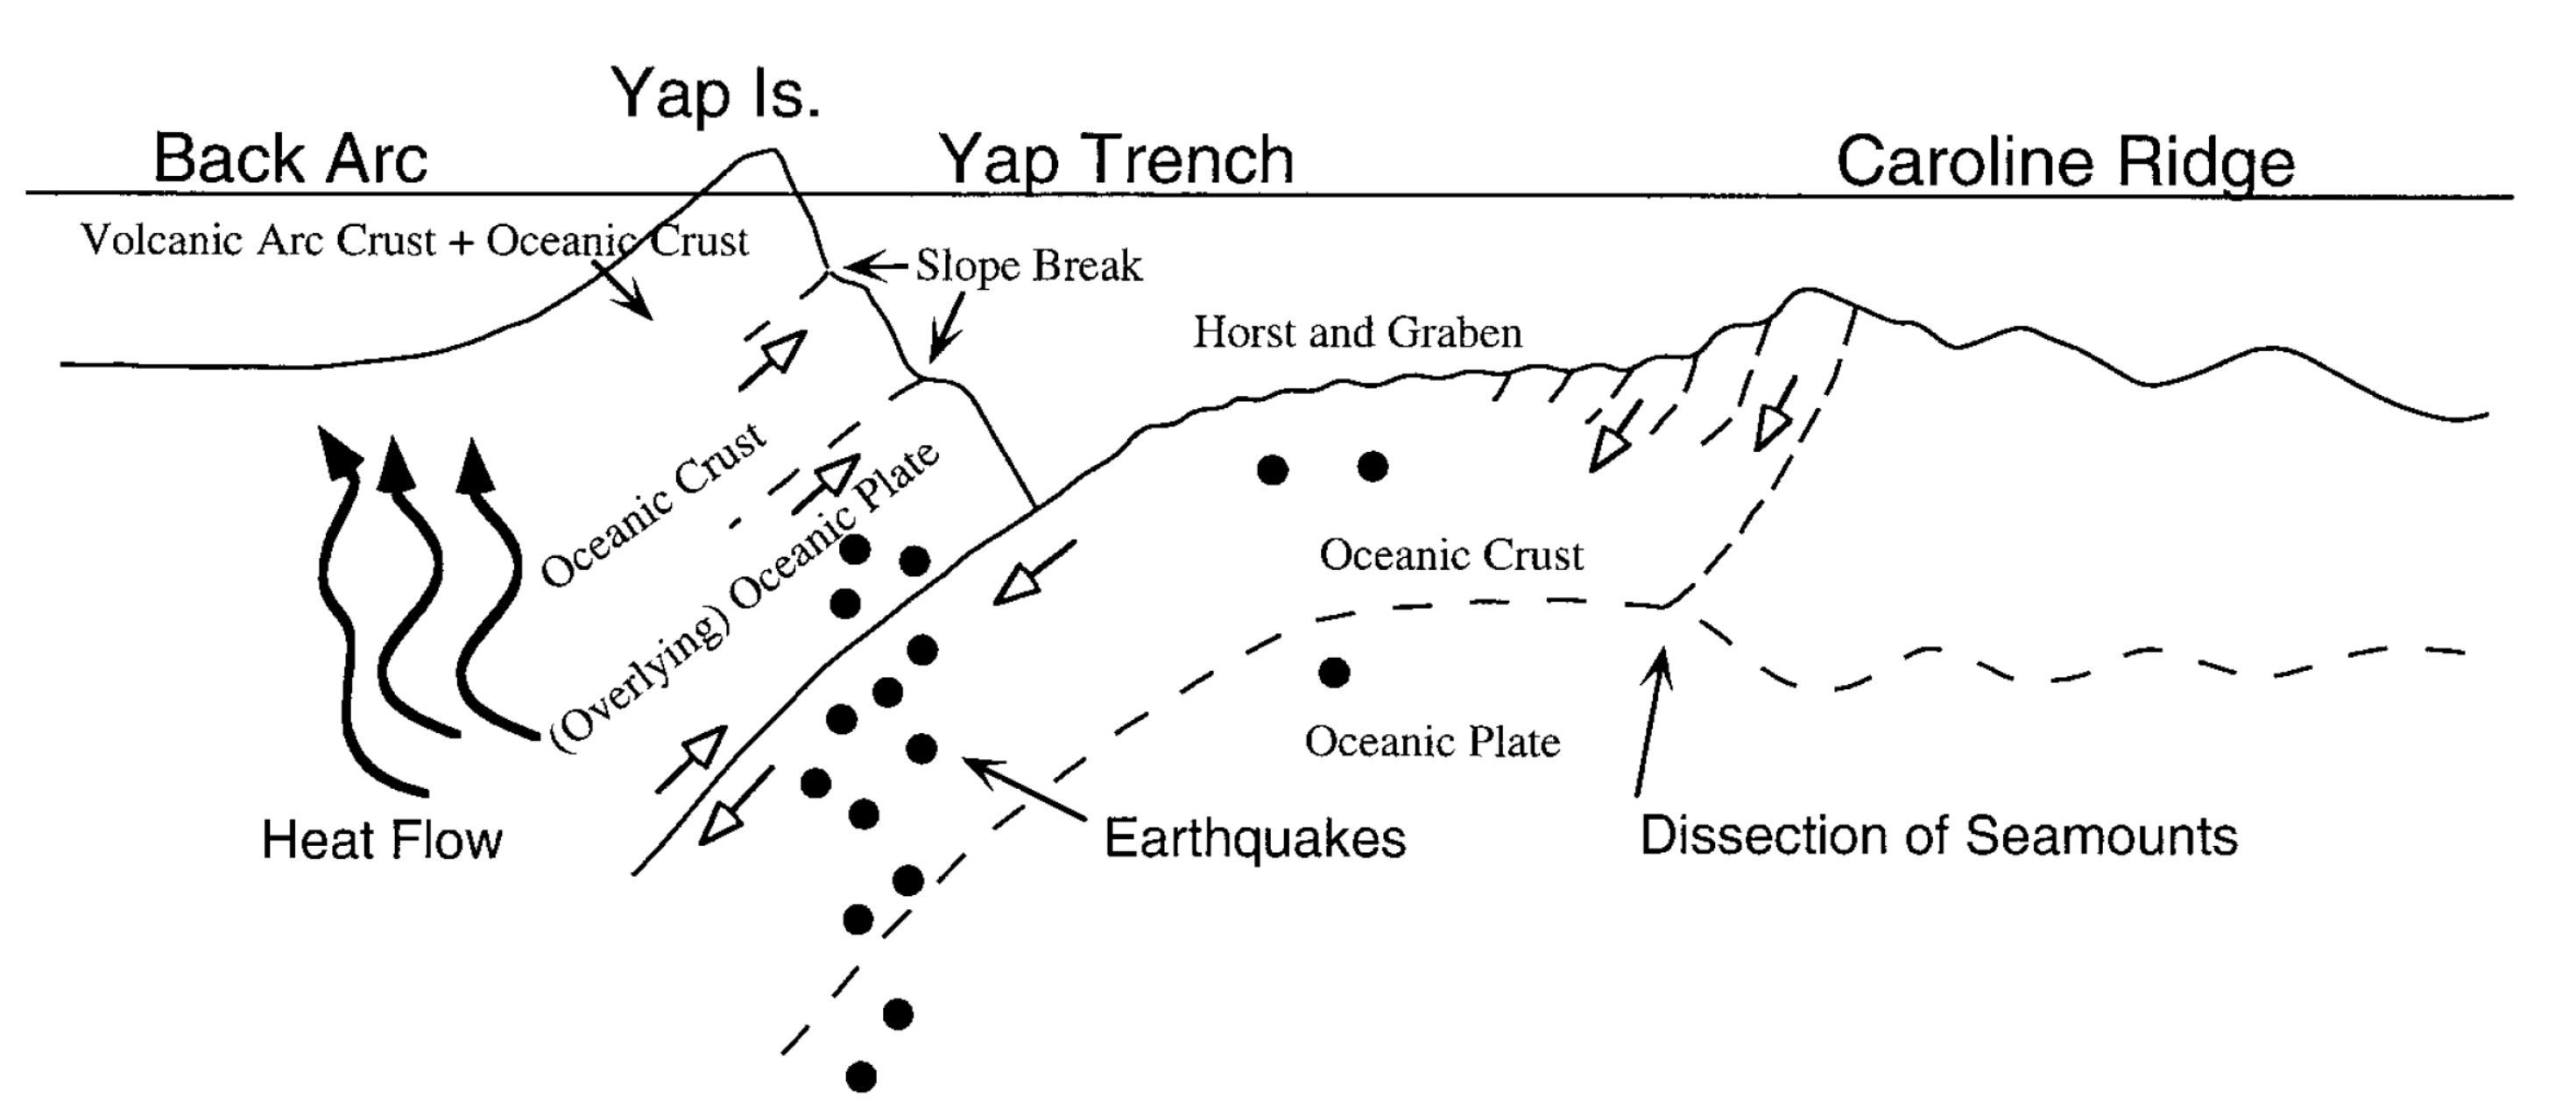
Schematic across the axis cross section of the northern part of the Yap Trench and its tectonic interpretation.
- This illustration shows four time steps in the evolution of the plate boundary in this area.

Proposed scenario of the evolution of the Yap Trench.
- This shows an alternative hypothesis for the formation of the Yap Trench (Okino et al., 2009).

One hypothesis for the evolution of the southern tip of the PVB. (a) The landward side of the Yap Trench consists of island arc crust and remnant lithosphere inherited from old Philippine Sea. Backarc extension in E–W direction split the arc crust and new oceanic crust was formed. (b) Overlapping rifts developed at the southern tip of the PVB. (c) The southernmost overlapping rift system was abandoned and the NE–SWspreading occurred in the main PVB.
- Here is a comparison of the two earthquakes from IPGP. Below are the links to the earthquake pages from IPGP. The IPGP depths are shallower, but still on the deep side for oceanic crust earthquakes.
- 2017.12.08 M 6.5
- 2017.12.08 M 6.4

- Here is a map of the Pacific with the location of hotspots designated by orange dots (Nunn et al., 2016). The Caroline volcanic chain is ~2,800 km long.

Island locations within the Pacific Basin showing their relationship with principal island-forming island locations. Plate boundaries (in red) and hotspots active within the past 43 Ma (orange circles) are also shown. Active convergent plate boundaries are shown by lines with triangles pointing in the downthrust direction; all other plate boundaries are undistinguished, although most are transform except for most of the East Pacific Rise where divergence occurs. Hotspot locations are from King and Adam (2014).
- This shows the arc and backarc tectonic elements in this region (Stern et al., 2003).

Generalized locality map for the Izu-Bonin-Mariana Arc system. Dashed line labeled STL = Sofugan Tectonic Line.
- This shows, in cross-section form, the magmatic evolution of the Back-Arc along the Mariana Trench (Stern et al., 2003).

Simplified history of the IBM arc system. Shaded areas are magmatically inactive, cross-hatched areas are magmatically active.
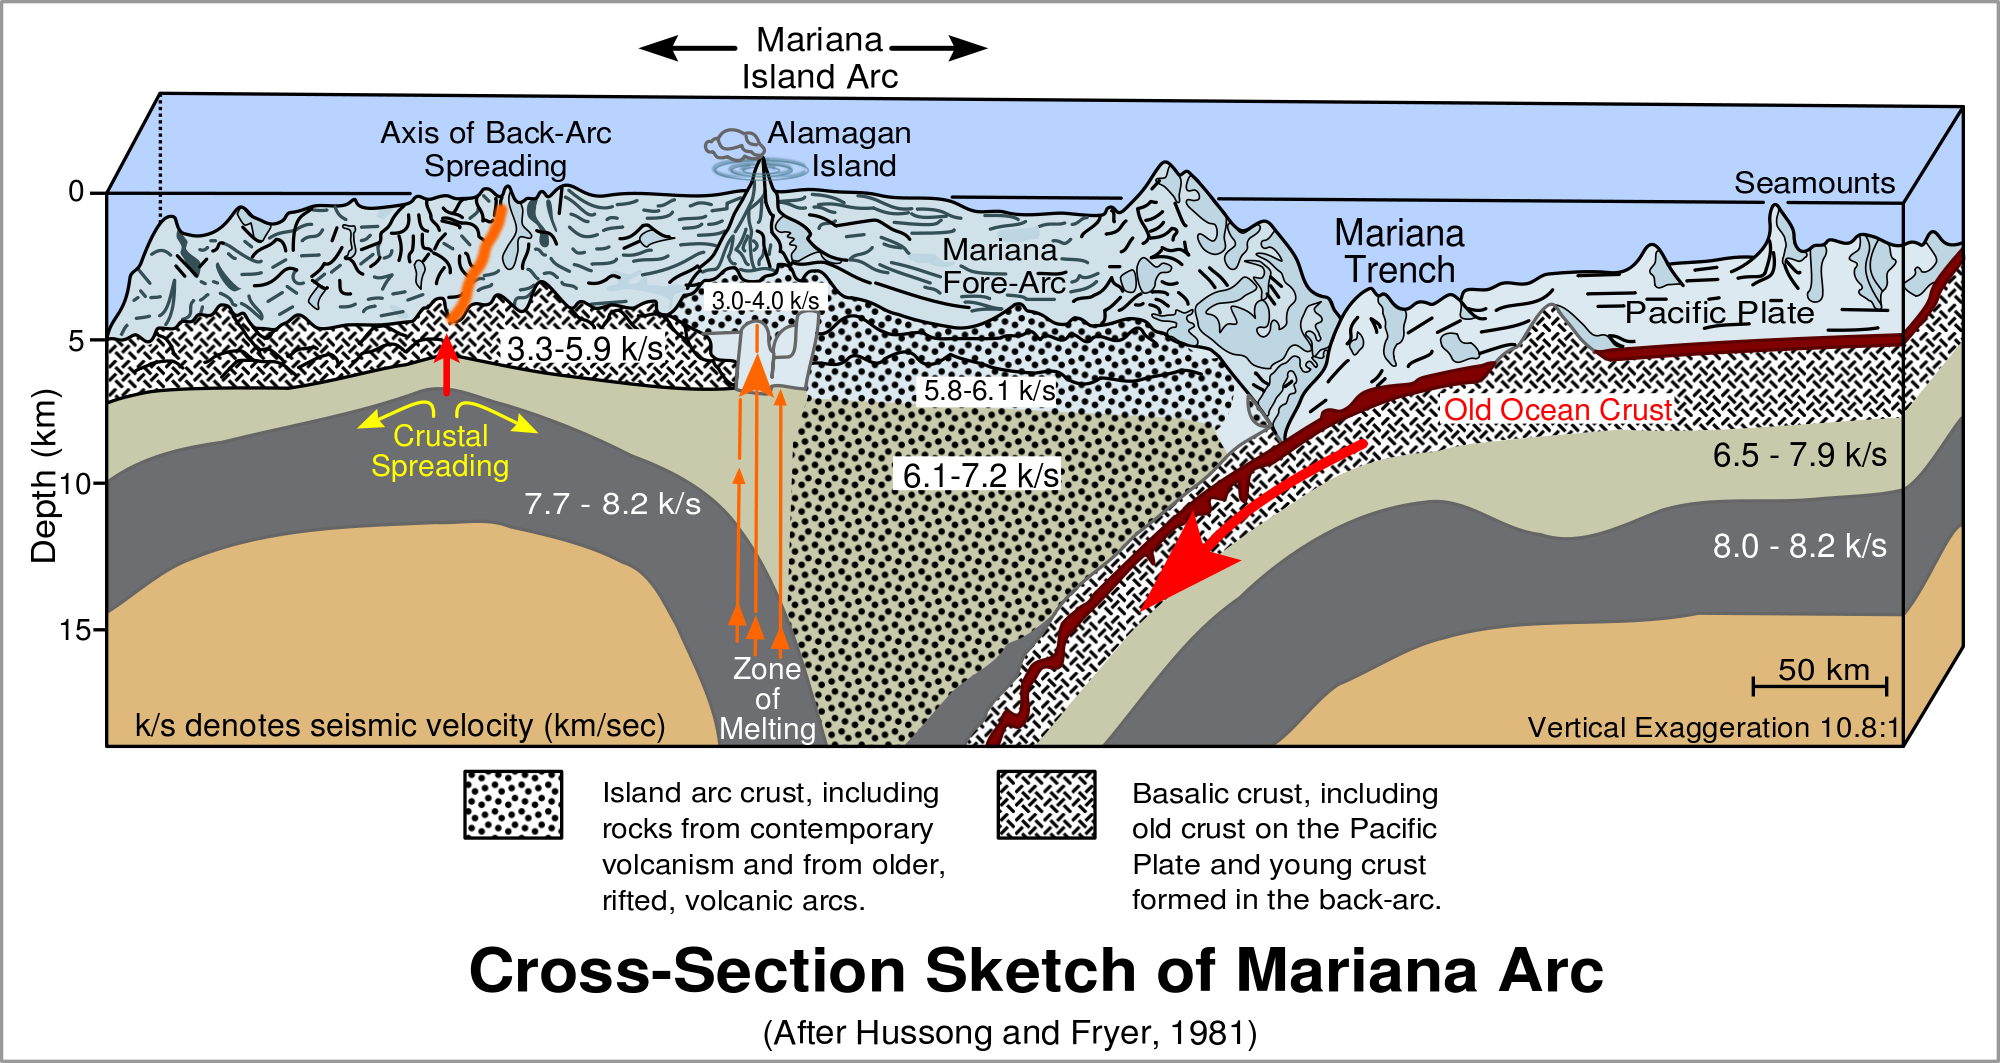
- This is the cross section from Hussong and Fryer (1982) showing the crustal structure in the region of Deep Sea Drilling Project Site 60. More about this site is available online here. The upper panel is the original figure (showing the drill sites) and the lower panel is an updated version. These figures also show the velocity model in km/second (this shows how the seismic velocity varies through different materials). Note the rough incoming oceanic crust (see the Magellan Seamounts on the Pacific plate). The rough plate is also visible in the main poster above.
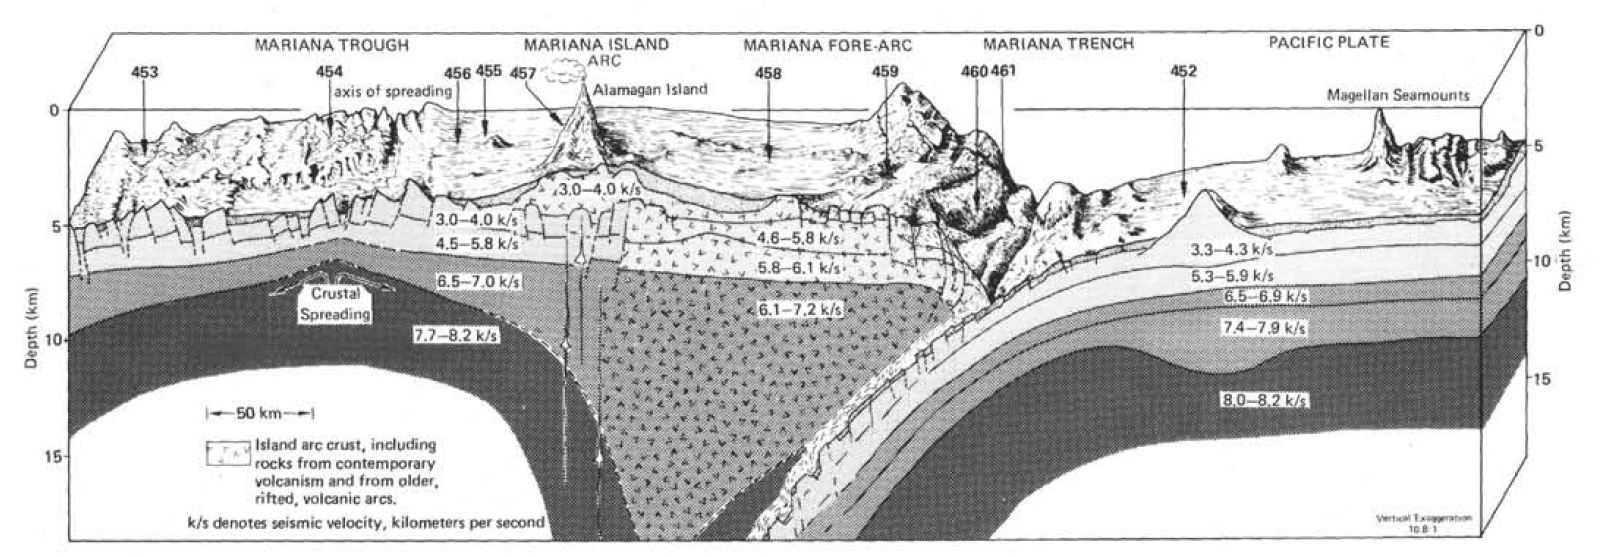
Physiographic diagram and crustal structure across the Mariana Trench and arc and the Mariana Trough, with Leg 60 site location shown. Crustal structure generalized from IODP site survey data by D. Hussong. Physiography drawn from IPOD site survey data by W. Coulbourn. This diagram summarizes the data and structural interpretations available prior to drilling.
- Here Stern (2010) updates the cross section of Uyeda and Kanamori (1979) even further.

Comparison of Andean-type arc (a) and intra-oceanic arc system (b), greatly simplified.
- Here is the seismicity cross section prepared by Fouch also an inset in the poster above.
- 2017.12.08 M 6.5 Caroline Ridge
- 2017.08.11 M 6.2 Philippines
- 2017.04.28 M 6.9 Philippines
- 2017.04.08 M 5.9 Philippines
- 2017.01.10 M 7.3 Celebes Sea
- 2016.07.29 M 7.7 Mariana
- 2015.03.17 M 6.2 Molucca Sea
- 2014.11.26 M 6.8 Molucca Sea
- 2014.11.21 M 6.5 Molucca Sea
- 2014.11.15 M 7.1 Molucca Sea
- Bird, P., 2003. An updated digital model of plate boundaries in Geochemistry, Geophysics, Geosystems, v. 4, doi:10.1029/2001GC000252, 52 p.
- Fujiwara, T., Tamura, C., Nishizawa, A., Fujioka, K., Kobayashi, K., and Iwabuschi, Y., 2000. Morphology and tectonics of the Yap Trench in Marine Geophysical Researches, v. 21, p. 69-86
- Gaina, C. and Müller, R.D., 2007. Cenozoic tectonic and depth/age evolution of the Indonesian gateway and associated back-arc basins in Earth-Science Reviews v. 83, p. 177-203
- Hayes, G. P., D. J. Wald, and R. L. Johnson (2012), Slab1.0: A three-dimensional model of global subduction zone geometries, J. Geophys. Res., 117, B01302, doi:10.1029/2011JB008524.
- Holm, R.J., Rosenbaum, G., Richards, S.W., 2016. Post 8 Ma reconstruction of Papua New Guinea and Solomon Islands: Microplate tectonics in a convergent plate boundary setting in Eartth Science Reviews, v. 156, p. 66-81.
- Müller, R.D., Sdrolias, M., Gaina, C., and Roest, W.R., 2008. Age, spreading rates, and spreading asymmetry of the world’s ocean crust in Geochemistry, Geophysics, Geosystems, v. 9, no. 3. Q04006, doi:10.1029/2007GC001743
- Okino, K., Ohara, Y., Fujiwara, T., Lee, S-M., Koizumi, K., Nakamura, Y., and Wu., S., 2009. Tectonics of the southern tip of the Parece Vela Basin, Philippine Sea Plate in Tectonophysics, v. 466, p. 213-228.
- Richards, S., Holm, R., Barber, G., 2011. When slabs collide: A tectonic assessment of deep earthquakes in the Tonga-Vanuatu region in Geology, v. 39, no. 8., p. 787-790
- Smoczyk, G.M., Hayes, G.P., Hamburger, M.W., Benz, H.M., Villaseñor, Antonio, and Furlong, K.P., 2013, Seismicity of the Earth 1900–2012 Philippine Sea Plate and vicinity: U.S. Geological Survey Open-File Report 2010–1083-M, scale 1:10,000,000, https://dx.doi.org/10.3133/ofr20101083m.
- Stern, R.J., 2010. The anatomy and ontogeny of modern intra-oceanic arc systems in Kusky, T. M., Zhai, M.-G. & Xiao, W. (eds) The Evolving Continents: Understanding Processes of Continental Growth. Geological Society, London, Special Publications, 338, 7–34.
- Stern, R. J., Fouch, M. J. & Klemperer, S. 2003. An overview of the Izu–Bonin–Mariana subduction factory. In: Eiler, J. (ed.) Inside the Subduction Factory. American Geophysical Union, Geophysical Monograph, 138, 175–222.
- Uyeda and Kanamori, 1979. Back-Arc Opening and the Mode of Subduction in JGR, v. 84, no. B3, p. 1049-1061.
- Zahirovic et al., 2014. The Cretaceous and Cenozoic tectonic evolution of Southeast Asia in Solid Earth, v. 5, p. 227-273, doi:10.5194/se-5-227-2014.
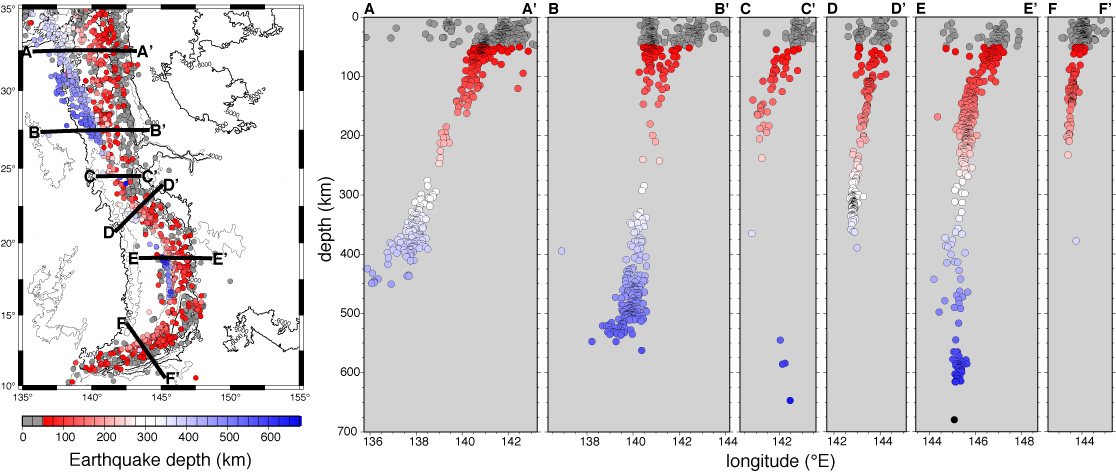
Map view of bathymetry and seismicity in the IBM subduction zone using the earthquake catalog of Engdahl, van der Hilst & Buland 1998. Circles denote epicentral locations; lighter circles represent shallower events, darker circles represent deeper events. Black lines denote cross sectional areas depicted in 6 profiles on right, organized from N to S. Black circles represent hypocentral locations in volume ~60 km to each side of the lines shown on the map at left. Large variations in slab dip and maximum depth of seismicity are apparent. Distance along each section is measured from the magmatic arc. A) Northern Izu-Bonin region. Slab dip is ~45°; seismicity tapers off from ~175 km to ~300 km depth but increases around 400 km, and terminates at ~475 km. B) Central Izu Bonin region. Slab dip is nearly vertical; seismicity tapers off from ~100 km to ~325 km but increases in rate and extends horizontally around 500 km, and terminates at ~550 km. C) Southern Izu Bonin region. Slab dip is ~50°; seismicity is continuous to ~200 km, but a very few anomalous events are evident down to ~600 km. D) Northern Mariana region. Slab dip is ~60°; seismicity is continuous to ~375 km and terminates at ~400 km, but a very few anomalous events are evident down to ~600 km. E) Central Mariana region. Slab dip is vertical; seismicity tapers off slightly between ~275 km and ~575 km, but is essentially continuous. A pocket of deep events around 600 km exists, as well as 1 deep event at 680 km. F) Southern Mariana region. Slab dip is ~55°; seismicity is continuous to ~225 km, with an anomalous event at 375 km.