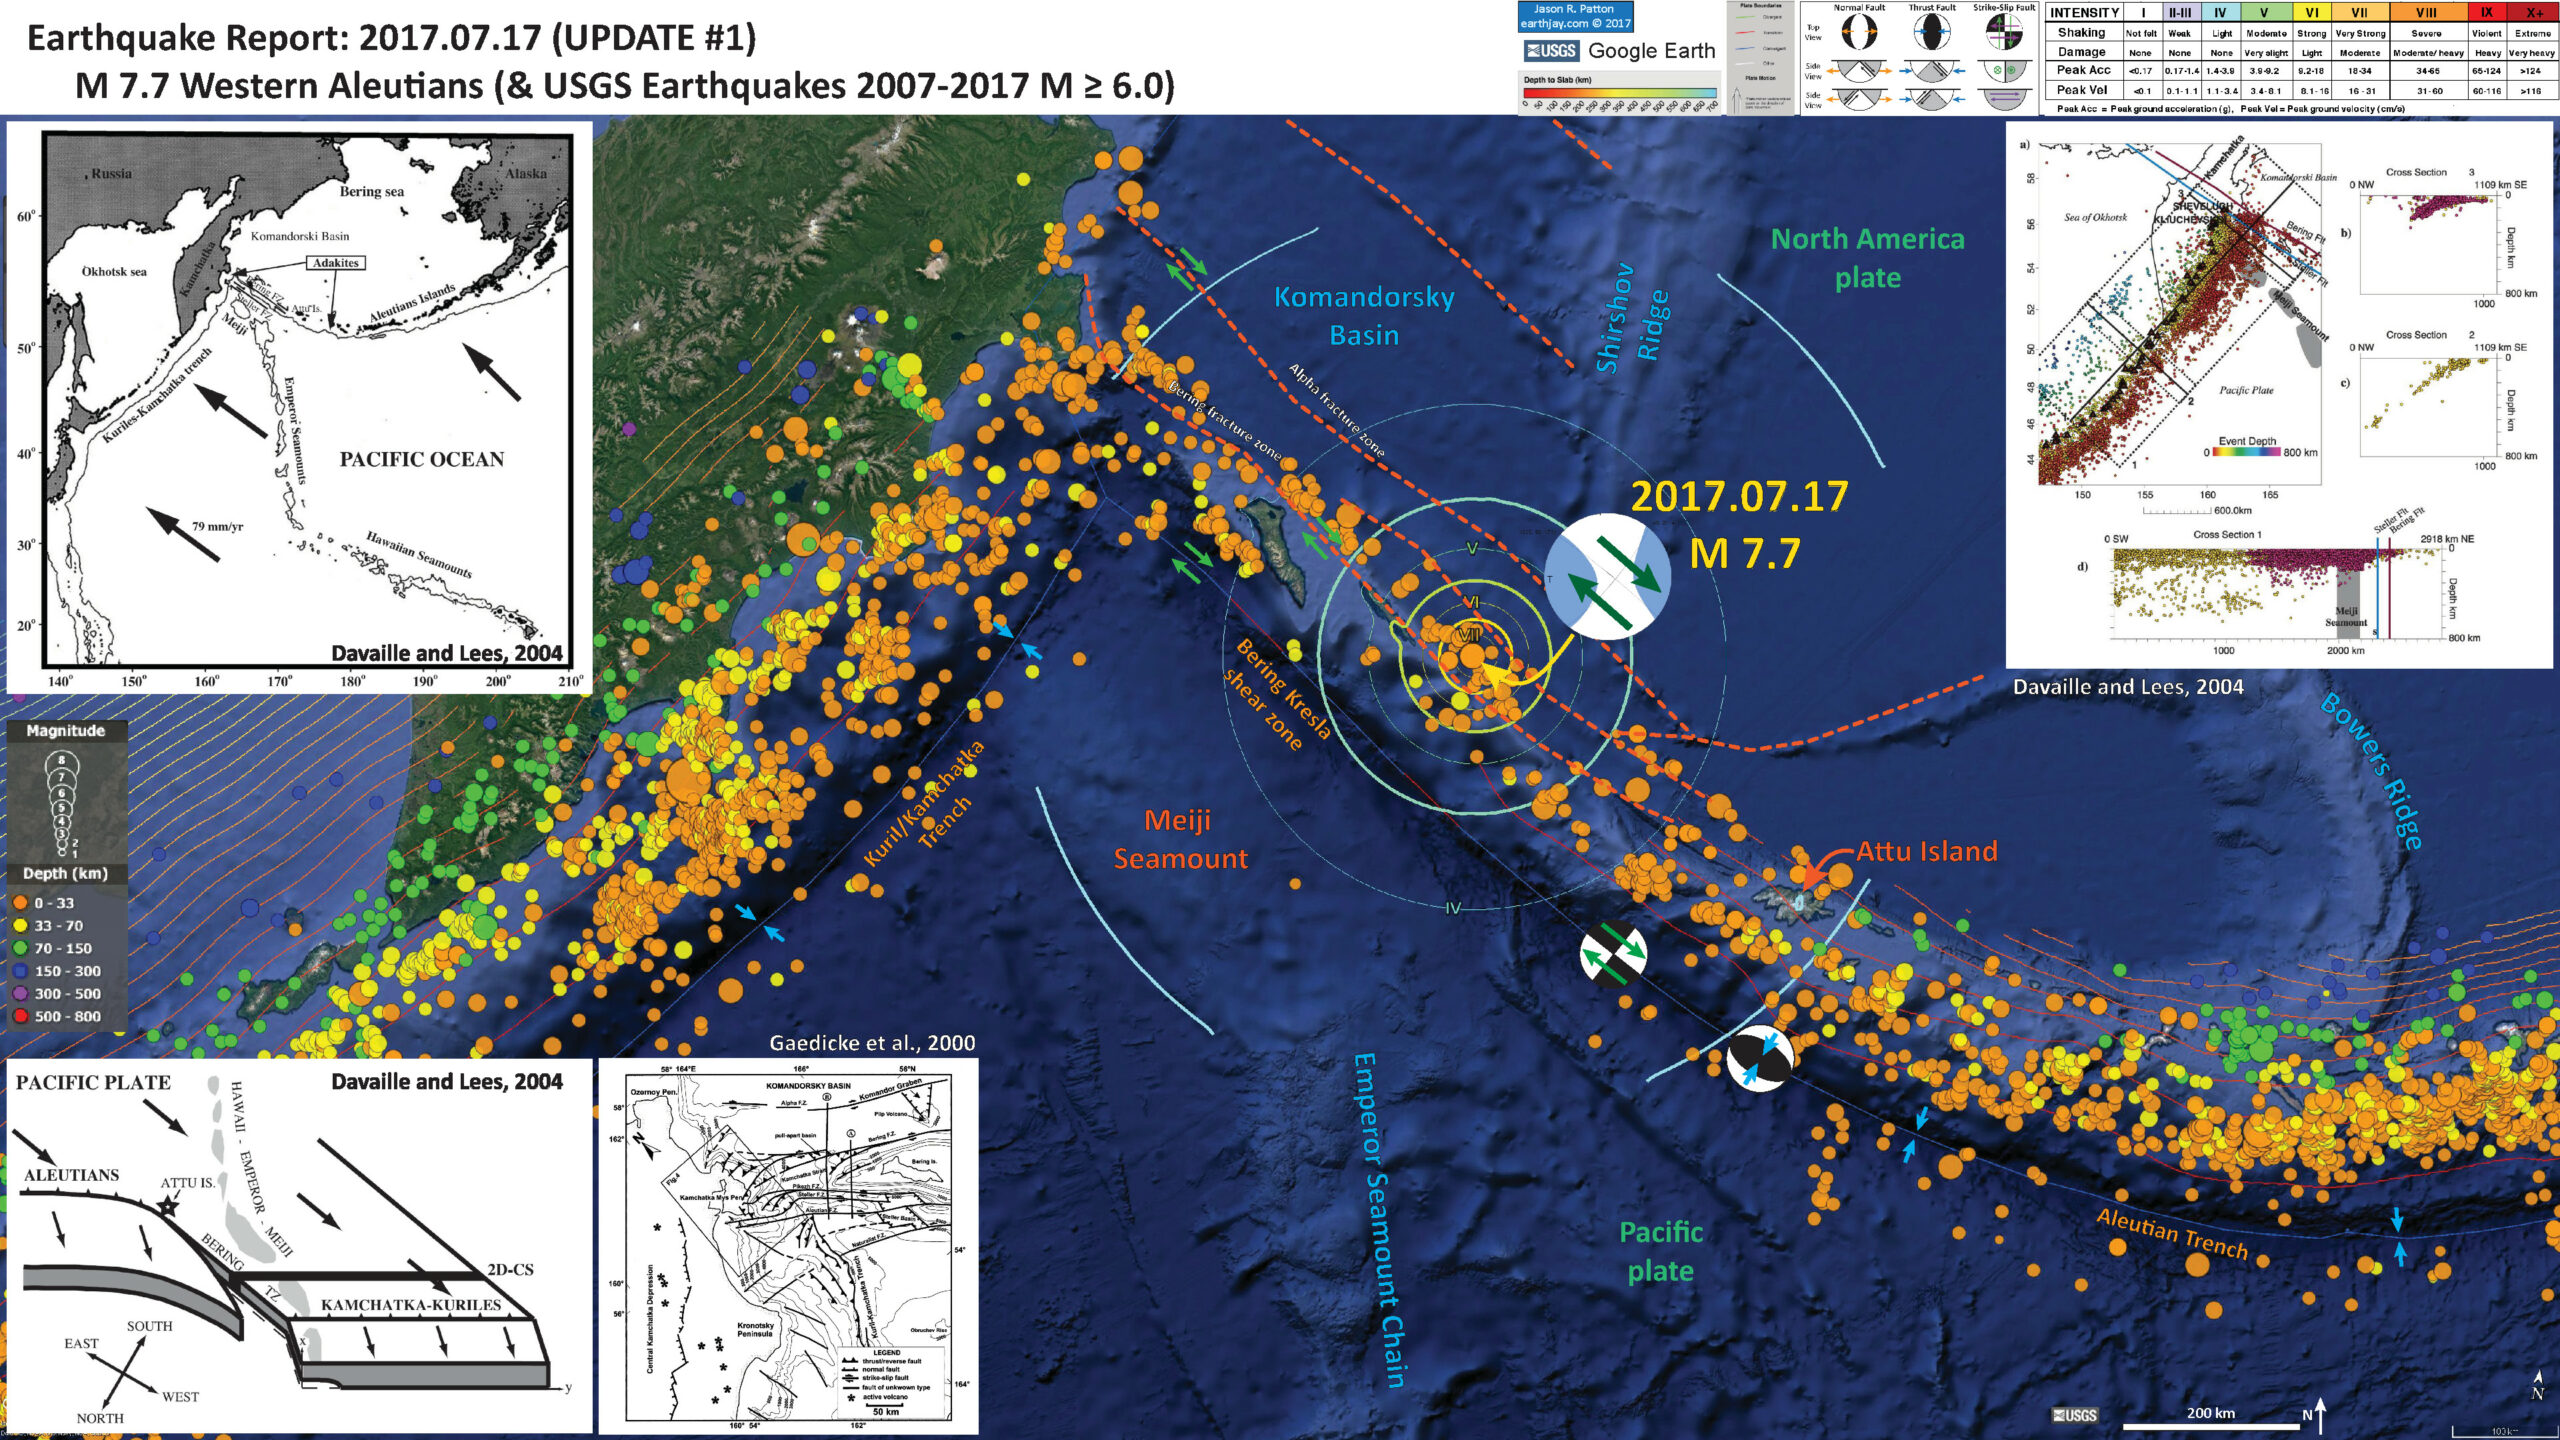
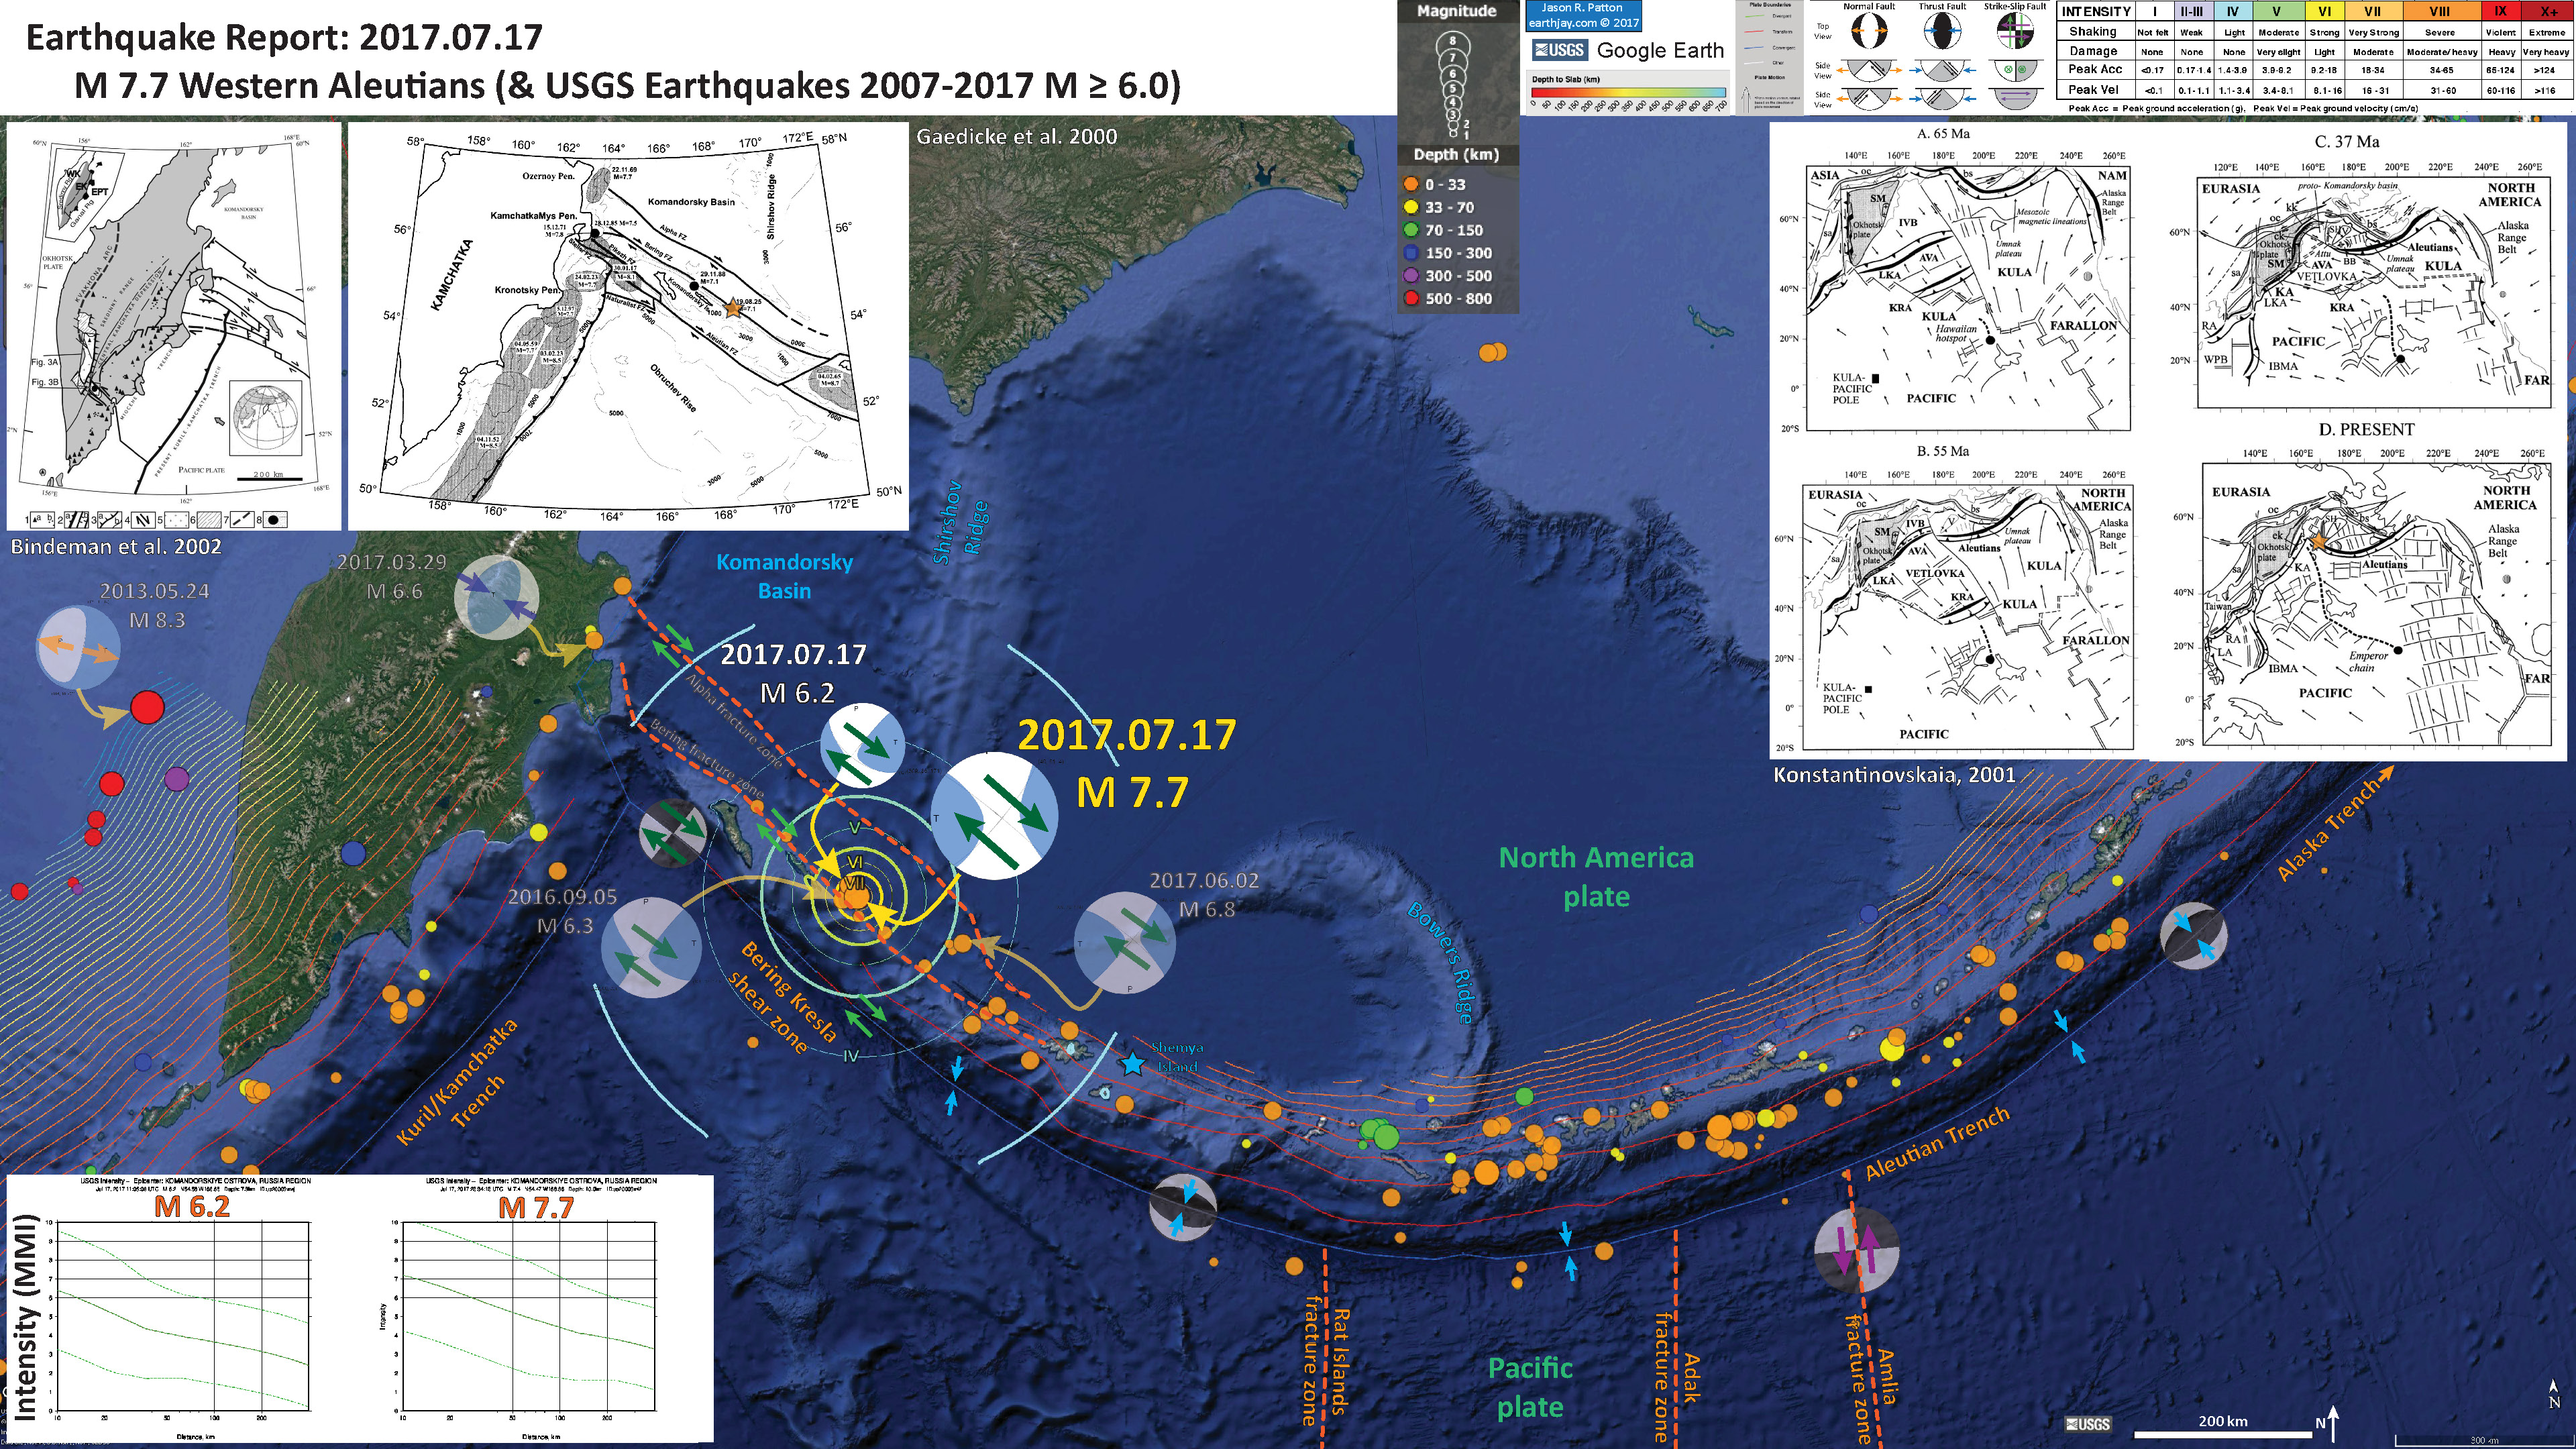
We just had an earthquake along the western Aleutian Islands, very close to the international date line. In this region places often have more than two names, depending upon who drew the map.
The majority of the Aleutian Islands are volcanic arc islands formed as a result of the subduction of the Pacific plate beneath the North America plate. To the west, there is another subduction zone along the Kuril and Kamchatka volcanic arcs. These subduction zones form deep sea trenches (the deepest parts of the ocean are in subduction zone trenches). Between these 2 subduction zones is another linear trough, but this does not denote the location of a subduction zone. The plate boundary between the Kamchatka and Aleutian trenches is the Bering Kresla shear zone (BKSZ).
The oceanic basin, Komandorsky Basin, to the north of the BKSZ has been mapped with northwest trending fracture zones, most of which are fossil or inactive. However, due to the oblique convergence west of Bowers Ridge, some of these fossil fracture zones are being reactivated. Based upon offsets in magnetic anomalies in the oceanic crust forming the basement of Komandorsky Basin, these fracture zones show left-lateral offsets. However, the active strike-slip faults (and BKSZ) are right lateral. This is a great example of strike-slip faults reactivating as strike-slip faults.
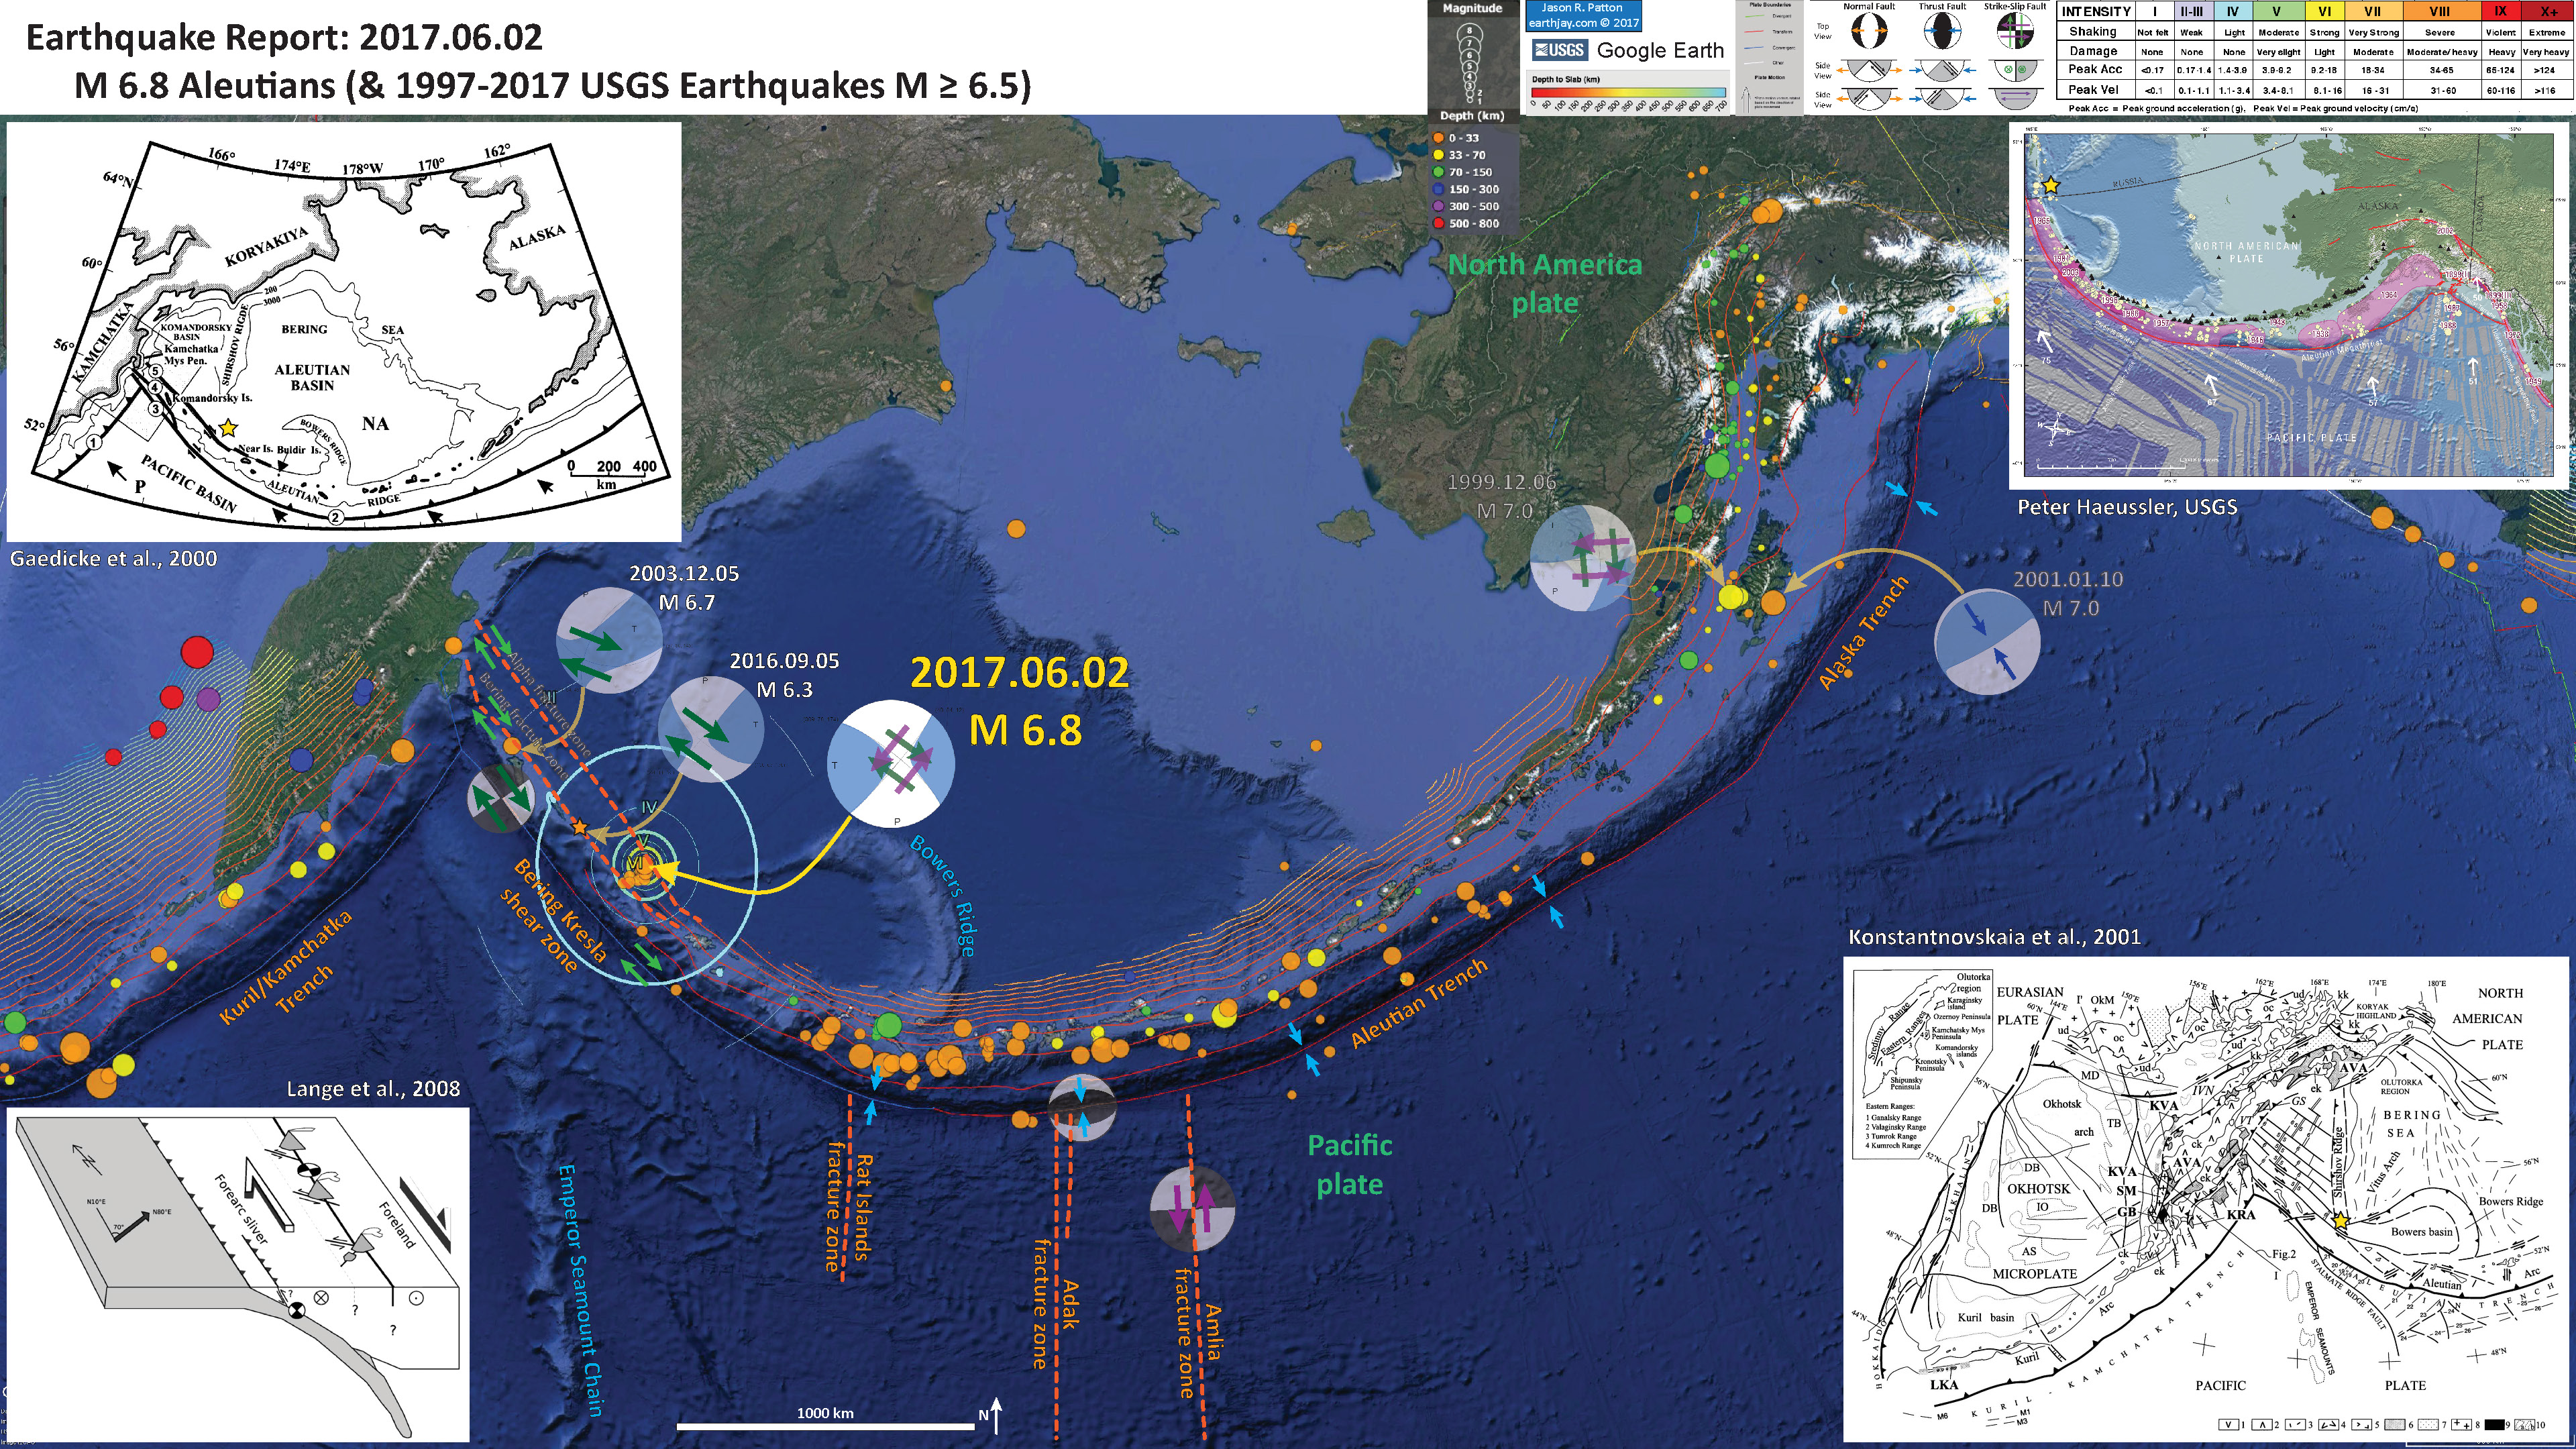
The mainshock was preceded earlier this day with several foreshocks and occurred very close to a M 6.3 earthquake from 9 months ago (2016.09.05). In addition, there was seismic activity to the east about 6 weeks ago (2017.06.02 M 6.8).
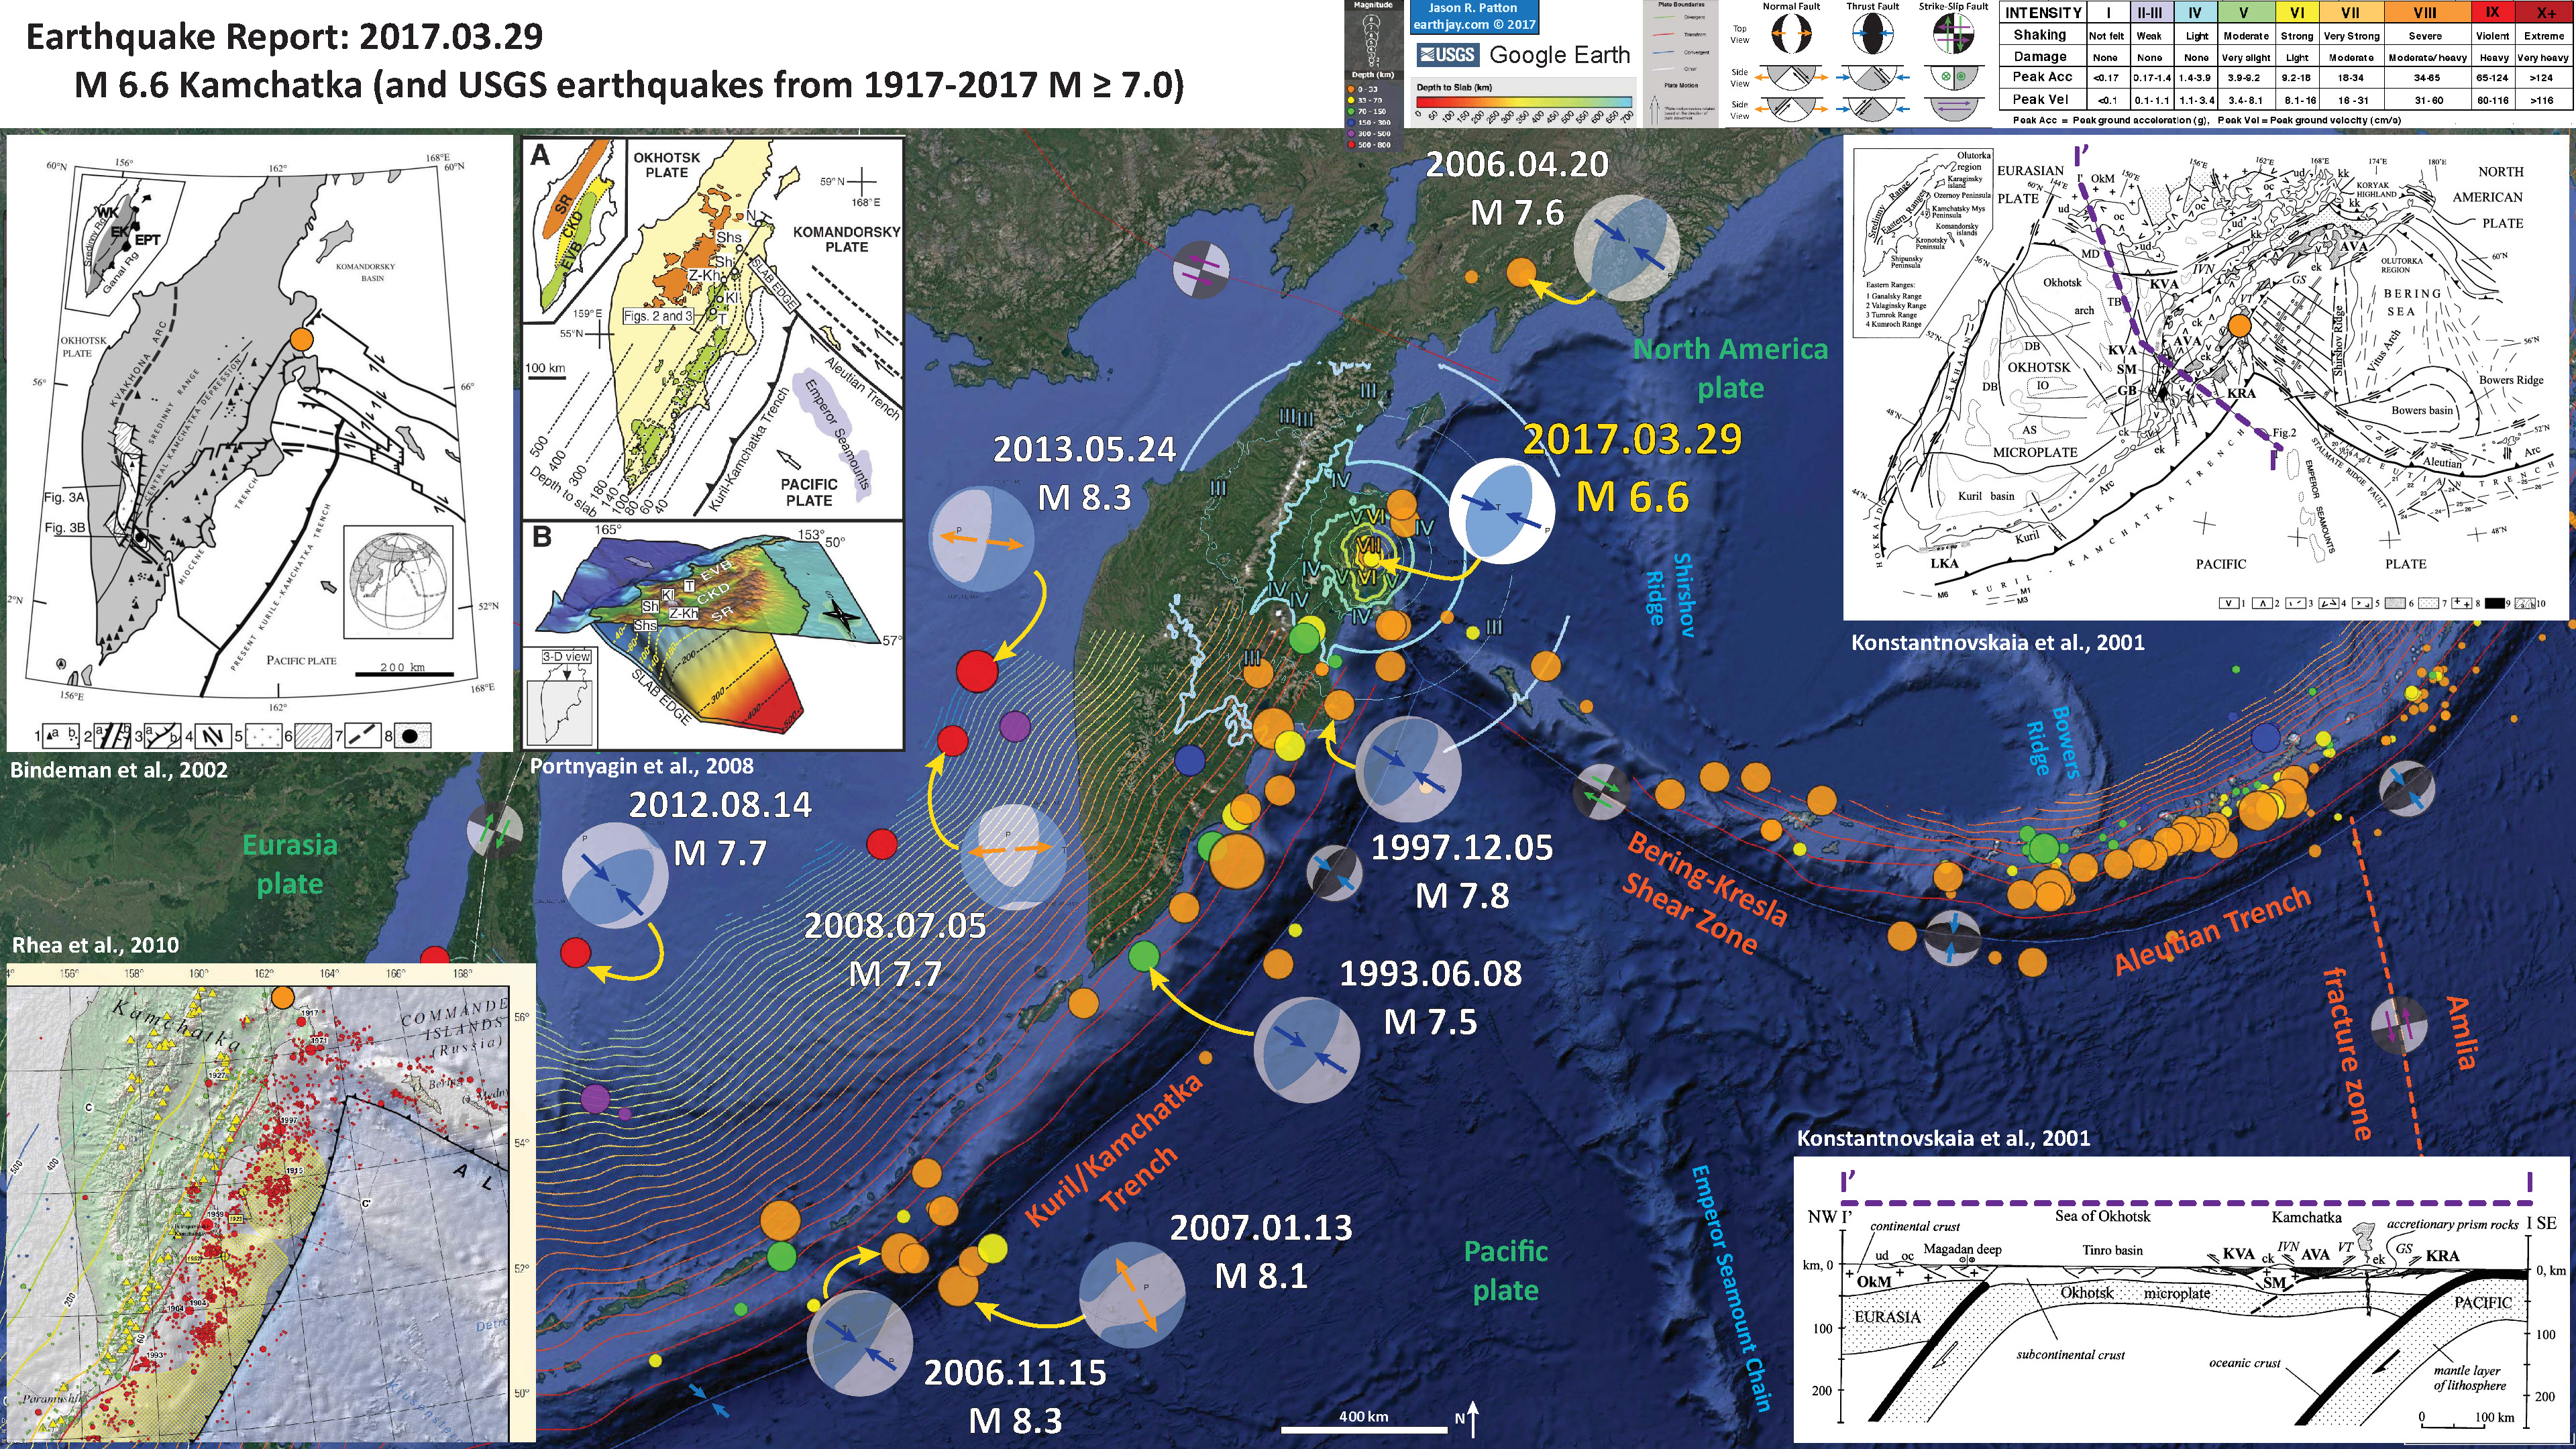
Some place a tear in the downgoing Pacific plate (beneath Kamchatka) in the position of the Bering Kresla Shear zone. This marks the end of the modern Kamchatka subduction zone. However, there was a subduction zone further to the west of the active arc, which extended further to the north and possibly involved subduction of the oceanic crust forming the Komandorsky Basin. The combination of offsets along the right-lateral strike-slip faults to the north of the BKSZ, along with the convergence along the Kamchatka Trench, there is a fold and thrust belt (a zone of compressional tectonics). There was an M 6.6 earthquake earlier this year (2017.03.29), which is somewhat related to this fold and thrust belt.
Finally, of note, is the M 8.3 deep extensional earthquake in the downgoing Pacific plate crust (2013.05.24).
There was a tsunami recorded at the tide gage on Shemya Island, with an observed maximum wave height of 0.3 ft! This is interesting given the strike slip earthquake.
- Here are the USGS website for today’s earthquakes.
- 2017-07-17 11:05 M 6.2
- 2017-07-17 11:23 M 5.1
- 2017-07-17 23:34 M 7.7
- Here are my #EarthquakeReport pages for some of these related earthquakes.
- 2016.09.05 M 6.3
- 2017.03.29 M 6.6
- 2017.06.02 M 6.8
Below is my interpretive poster for this earthquake.
I plot the seismicity from the past month, with color representing depth and diameter representing magnitude (see legend). I also include USGS earthquake epicenters from 2007-2017 for magnitudes M ≥ 6.0.
- I placed a moment tensor / focal mechanism legend on the poster. There is more material from the USGS web sites about moment tensors and focal mechanisms (the beach ball symbols). Both moment tensors and focal mechanisms are solutions to seismologic data that reveal two possible interpretations for fault orientation and sense of motion. One must use other information, like the regional tectonics, to interpret which of the two possibilities is more likely. I plot moment tensors for the M 7.7 earthquake, as well as for the 2013, 2016, and 2017 earthquakes mentioned above. I also include moment tensors for earthquakes in 1999 and 2001 because these are also interesting earthquakes that I had not noticed before. It appears that perhaps the 1999 strike-slip earthquake led to an increased stress on the subduction zone, which slipped in 2001. Based upon the series of earthquakes and the mapped faults, I interpret this M 7.7 earthquake as a right-lateral strike-slip earthquake related to slip associated with the Bering fracture zone.
- I also include the shaking intensity contours on the map. These use the Modified Mercalli Intensity Scale (MMI; see the legend on the map). This is based upon a computer model estimate of ground motions, different from the “Did You Feel It?” estimate of ground motions that is actually based on real observations. The MMI is a qualitative measure of shaking intensity. More on the MMI scale can be found here and here. This is based upon a computer model estimate of ground motions, different from the “Did You Feel It?” estimate of ground motions that is actually based on real observations.
- I include the slab contours plotted (Hayes et al., 2012), which are contours that represent the depth to the subduction zone fault. These are mostly based upon seismicity. The depths of the earthquakes have considerable error and do not all occur along the subduction zone faults, so these slab contours are simply the best estimate for the location of the fault.
- In the upper left corner I include a regional tectonic map showing Kamchatka and the westernmost tip of the westernmost Aleutian Islands (Bindeman et a., 2002). Today’s M 7.7 earthquake is just off the map to the east.
- To the right of the Bindeman map is a map that shows a larger scale view of the faults in this region (Gaedicke et al., 2000). I include an orange star designating the rough location of today’s M 7.7 earthquake.
- In the lower left corner are the earthquake intensity regression plots for the M 6.2 and M 7.7 earthquakes. These are plots based upon Attenuation Relation equations (formerly called Ground Motion Prediction Equations, GMPEs). Using seismic data from thousands of earthquakes with a range of magnitudes, distances, fault types, etc., people have developed empirical relations between each of these parameters. These plots are based upon these empirical relations and show how earthquake intensity (how strong it shakes) diminishes with distance.
- In the upper right corner is a series of tectonic maps showing one interpretation of how the plates have moved relative to each other through time (Konstantinovskaia, 2001). The time spans 65, 55, and 37 millions of years into the present. Begin by looking at the present configuration and move backwards in time. These maps show an interesting story (that appears consistent with other published data).
I include some inset figures in the poster.
- Here is my interpretive poster for my 2016.03.29 M 6.6 #EarthquakeReport.
- Here is my interpretive poster for my 2017.06.02 M 6.8 #EarthquakeReport.
- Here is the interpretive poster from the 2016.09.05 M 6.3 #EarthquakeReport.
- Here are several figures from Gaedicke et al. (2000) showing their tectonic reconstructions. I include their figure captions below in blockquote. The first map shows the general tectonic setting as in the poster above.
- This figure shows the complicated intersection of the BKSZ and the Kuril-Kamchatka Trench (a subduction zone).
- This figure shows a medium scale view of the faults here, along with the major historic earthquakes. In this figure the BKSZ is labeled the Aleutian fracture zone (AFZ).

Map of the Aleutian–Bering region and location of the study area (rectangle). Lines with barbs indicate subduction zones: (1) Kamchatka Trench and (2) Aleutian Trench; lines with sense of displacement mark fracture zones (FZs): (3) Steller, (4) Pikezh and (5) Bering FZs. Single arrows show relative direction of convergence of the Pacific (P) and North American (NA) plates. Bathymetric contours are in meters.

The main tectonic features of the Kamchatka–Aleutian junction area modified from Seliverstov (1983), Seliverstov et al. (1988) and Baranov et al. (1991). The eastern side of the Central Kamchatka depression is bounded by normal faults. Contour interval is 1000 m. Lines A and B indicate the locations of profiles shown in Fig. 3; the rectangle marks the location of the area shown in Fig. 4.

Rupture zones of the major earthquakes in the Kamchatka–Aleutian junction area [according to Vikulin (1997)]. Earthquakes with a magnitude of Mw>7 are shown.
- Here are several figures from Konstantnovskaia et al. (2001) showing their tectonic reconstructions. I include their figure captions below in blockquote. The first figure is the one included in the poster above.
- Here are 4 panels that show the details of their reconstructions. Panels shown are for 65 Ma, 55 Ma, 37 Ma, and Present.

Geodynamic setting of Kamchatka in framework of the Northwest Pacific. Modified after Nokleberg et al. (1994) and Kharakhinov (1996)). Simplified cross-section line I-I’ is shown in Fig. 2. The inset shows location of Sredinny and Eastern Ranges. [More figure caption text in the publication].


The Cenozoic evolution in the Northwest Pacific. Plate kinematics is shown in hotspot reference frame after (Engebretson et al., 1985). Keys distinguish zones of active volcanism (thick black lines), inactive volcanic belts (thick gray lines), deformed arc terranes (hatched pattern), subduction zones: active (black triangles), inactive *(empty triangles). In letters: sa = Sikhote-aline, bs = Bering shelf belts; SH = Shirshov Ridge; V = Vitus arch; KA = Kuril; RA = Ryukyu’ LA = Luzon; IBMA = Izu-Bonin-Mariana arcs; WPB = Western Philippine, BB = Bowers basins.
- Here is the low-angle oblique map from Portnyagin and Manea (2008). I include the figure caption as a blockquote below.
Kamchatka subduction zone. A: Major geologic structures at the Kamchatka–Aleutian Arc junction. Thin dashed lines show isodepths to subducting Pacific plate (Gorbatov et al., 1997). Inset illustrates major volcanic zones in Kamchatka: EVB—Eastern Volcanic Belt; CKD—Central Kamchatka Depression (rift-like tectonic structure, which accommodates the northern end of EVB); SR—Sredinny Range. Distribution of Quaternary volcanic rocks in EVB and SR is shown in orange and green, respectively. Small dots are active vol canoes. Large circles denote CKD volcanoes: T—Tolbachik; K l — K l y u c h e v s k o y ; Z—Zarechny; Kh—Kharchinsky; Sh—Shiveluch; Shs—Shisheisky Complex; N—Nachikinsky. Location of profiles shown in Figures 2 and 3 is indicated. B: Three dimensional visualization of the Kamchatka subduction zone from the north. Surface relief is shown as semi-transparent layer. Labeled dashed lines and color (blue to red) gradation of subducting plate denote depths to the plate from the earth surface (in km). Bold arrow shows direction of Pacific Plate movement.
- Here is a map that shows the seismicity (1960-2014) for this plate boundary. This is the spatial extent for the videos below.
- Here is a link to the file to save to your computer.
- Summary of the 1964 Earthquake
- 2017.07.17 M 7.7 Aleutians
- 2017.06.02 M 6.8 Aleutians
- 2017.05.08 M 6.2 Aleutians
- 2017.05.01 M 6.3 British Columbia
- 2017.03.29 M 6.6 Kamchatka
- 2017.03.02 M 5.5 Alaska
- 2016.09.05 M 6.3 Bering Kresla (west of Aleutians)
- 2016.04.13 M 5.7 & 6.4 Kamchatka
- 2016.04.02 M 6.2 Alaska Peninsula
- 2016.03.27 M 5.7 Aleutians
- 2016.03.12 M 6.3 Aleutians
- 2016.01.29 M 7.2 Kamchatka
- 2016.01.24 M 7.1 Alaska
- 2015.11.09 M 6.2 Aleutians
- 2015.11.02 M 5.9 Aleutians
- 2015.11.02 M 5.9 Aleutians (update)
- 2015.07.27 M 6.9 Aleutians
- 2015.05.29 M 6.7 Alaska Peninsula
- 2015.05.29 M 6.7 Alaska Peninsula (animations)
- 1964.03.27 M 9.2 Good Friday
Earthquake Reports: Alaska | Kamchatka | Kurile
General Overview
- Bassett and Watts, 2015. Gravity anomalies, crustal structure, and seismicity at subduction zones: 1. Seafloor roughness and subducting relief in Geochemistry, Geophysics, Geosystems, v. 16, doi:10.1002/2014GC005684.
- Gaedicke, C., Baranov, B., Seliverstov, N., Alexeiev, D., Tsukanov, N., Freitag, R., 2000. Structure of an active arc-continent collision area: the Aleutian-Kamchatka junction. Tectonophysics 325, 63–85
- Hayes, G. P., D. J. Wald, and R. L. Johnson (2012), Slab1.0: A three-dimensional model of global subduction zone geometries, J. Geophys. Res., 117, B01302, doi:10.1029/2011JB008524.
- Ikuta, R., Mitsui, Y., Kurokawa, Y., and Ando, M., 2015. Evaluation of strain accumulation in global subduction zones from seismicity data in Earth, Planets and Space, v. 67, DOI 10.1186/s40623-015-0361-5
- Konstantnovskaia, 2001. Arc-continent collision and subduction reversal in the Cenozoic evolution of the Northwest Pacific: an example from Kamchatka (NE Russia) in Tectonophysics, v. 333, p. 75-94.
- Koulakov, I.Y., Dobretsov, N.L., Bushenkova, N.A., and Yakovlev, A.V., 2011. Slab shape in subduction zones beneath the Kurile–Kamchatka and Aleutian arcs based on regional tomography results in Russian Geology and Geophysics, v. 52, p. 650-667.
- Krutikov, L., et al., 2008. Active Tectonics and Seismic Potential of Alaska, Geophysical Monograph Series 179, doi:10.1029/179GM07
- Lay, T., H. Kanamori, C. J. Ammon, A. R. Hutko, K. Furlong, and L. Rivera, 2009. The 2006 – 2007 Kuril Islands great earthquake sequence in J. Geophys. Res., 114, B11308, doi:10.1029/2008JB006280.
- Portnyagin, M. and Manea, V.C., 2008. Mantle temperature control on composition of arc magmas along the Central Kamchatka Depression in Geology, v. 36, no. 7, p. 519-522.
- Rhea, S., Tarr, A.C., Hayes, G., Villaseñor, A., Furlong, K.P., and Benz, H.M., 2010. Seismicity of the Earth 1900-2007, Kuril-Kamchatka arc and vicinity: U.S. Geological Survey Open-File Report 2010-1083-C, 1 map sheet, scale 1:5,000,000.